Spatial and historic variability of benthic nitrogen cycling in an anthropogenically impacted estuary
 Sarah Q. Foster
 Robinson W. Fulweiler
- 1Department of Earth and Environment, Boston University, Boston, MA, USA
- 2Department of Biology, Boston University, Boston, MA, USA
Human activities have dramatically altered reactive nitrogen (N) availability in coastal ecosystems globally. Here we used a gradient of N loading found in a shallow temperate estuary (Waquoit Bay, Massachusetts, USA) to examine how key biogeochemical processes respond to environmental change over time. Using a space-for-time substitution we measured sediment oxygen uptake, dissolved inorganic nitrogen, and di-nitrogen (N2) gas fluxes from sediments collected at four stations. For two stations we compared measurements to those made at the same locations 20 years ago. Spatial variability was not directly correlated to N loading, however the results indicate significant changes in crucial ecosystem processes over time. Sediment oxygen uptake was only 46% of the historic rate and ammonium flux only 34%. The current rate of net denitrification (36 μmol N2-N m−2 h−1) was also lower than the mean historic rate (181 μmol N2-N m−2 h−1). Additionally, at one of the stations we measured a negative average N2 flux rate, indicating that the sediments may be a net source of reactive N. These changes in benthic flux rates are concurrent with a 39% decline in net ecosystem productivity determined from long-term dissolved oxygen data. Although we cannot rule out year-to-year variability we propose that the differences measured between current and historic rates may be explained in part by concurrent changes found in water temperature, precipitation, and freshwater discharge. These regional forcings have the potential to impact N inputs to the estuary, primary producer biomass, and benthic fluxes by altering the supply of organic matter to the sediments. This work highlights the dynamic nature of biogeochemical cycling in coastal ecosystems and underscores the need to better understand long-term changes.
Introduction
Over the past century human activities have dramatically increased both the magnitude and transport rate of nutrients to coastal ecosystems leading to widespread negative impacts including, eutrophication (Bricker et al., 2008; Selman et al., 2008), a rise in toxic phytoplankton blooms (Smayda, 1990; Anderson et al., 2002; Anderson, 2009), increased frequency and duration of low oxygen events (Diaz and Rosenberg, 2008), and losses of biodiversity (Valiela et al., 1992; Heck et al., 1995; Gong and Xie, 2001). However, the impact of excess nutrients and subsequent eutrophication on benthic nutrient cycling is less understood, particularly in terms of how sediment biogeochemistry may be altered under concurrent environmental changes on larger regional and global scales (Duarte et al., 2009). This is important because sediments in shallow coastal ecosystems play a critical role in ecosystem function by supporting organic matter decomposition and subsequent nutrient regeneration, as well as by influencing water column dissolved oxygen (O2) concentrations (Nixon, 1981; Boynton and Kemp, 1985; Giblin et al., 1997). Furthermore, coastal sediments serve as an important sink for reactive nitrogen (N) with the capability of removing 20–50% of external N inputs through denitrification [the microbial transformation of nitrate (NO−3) to di-nitrogen (N2) gas] (Seitzinger and Kroeze, 1998; Galloway et al., 2004; Seitzinger et al., 2006). In this way the sediments of estuaries and near-shore ecosystems act as filters, which can mitigate anthropogenic N locally and diminish export to the ocean. Understanding how N pollution alters this critical ecosystem service is key to long-term coastal ecosystem sustainability.
Excess N can alter sediment biogeochemistry through a variety of complex mechanisms. For example, enhanced water column phytoplankton or macroalgae production following nutrient loading leads to declines in seagrass populations (McGlathery, 2001; Hauxwell et al., 2003) while simultaneously increasing deposition of organic matter to the benthos. In turn, this can enhance rates of sediment decomposition and nutrient mineralization (Nixon, 1981). Increased organic matter deposition to the benthos has also been shown to stimulate rates of denitrification (Seitzinger and Giblin, 1996; Cornwell et al., 1999; Fulweiler et al., 2008). In addition, as macroalgae or phytoplankton decompose dissolved O2 concentrations drop leading to an increase in the overall duration, intensity, and frequency of hypoxia (dissolved O2 concentrations less than 2 mg O2 L−1; 62.5 μ M; approximately 30% O2 saturation Vaquer-Sunyer and Duarte, 2008) and/or anoxia. Low oxygen events have important implications for sediment biogeochemistry in general (Middelburg and Levin, 2009) and the N cycle in particular (Lam et al., 2009; Canfield et al., 2010).
In addition to local scale impacts such as N loading and eutrophication, coastal ecosystems are also subject to larger scale regional and global forcings (e.g., warming, sea level rise, increased precipitation, etc., Cloern et al., 2007; Nixon and Fulweiler, 2009). These environmental changes can greatly impact coastal ecosystem biogeochemistry and ecosystem functioning. For example, in Narragansett Bay winter water temperatures have increased by 1.7°C since the 1970s (Nixon et al., 2009). This temperature increase has been linked to a variety of critical ecological changes, including the loss of the winter-spring diatom bloom (Oviatt et al., 2002) and diminished mean annual water column chlorophyll concentrations (Li and Smayda, 1998). In turn, these water column changes led to decreased sediment O2 uptake, benthic nutrient fluxes, and denitrification rates (Fulweiler and Nixon, 2009; Fulweiler et al., 2010). Thus, the interactions between global, regional, and local scale forcings are complex, non-linear, and often unexpected (Conley et al., 2009; Duarte et al., 2009). However, understanding how coastal systems will respond to these changes is a critical challenge if we hope to manage and even restore these ecosystems.
The objective of this study was to assess how sediment metabolism and nitrogen cycling varies under different N loads within a shallow temperate estuary, Waquoit Bay (Massachusetts, USA). Additionally, we compare our rates to those measured in Waquoit Bay over two decades ago as a way to examine how these ecosystem functions have changed over time.
Materials and Methods
Site Description
Waquoit Bay is a shallow (mean depth 1.8 m, maximum depth 3 m), temperate estuary on the southwestern shore of Cape Cod (Figure 1). The surface area of the main basin and the two major tributaries (Childs River and Quashnet River) is approximately 6 km2. River discharge rates range between 0.1 and 0.4 m3 s−1 and both are approximately 2 km long and 100 m wide with 10 m bridge abutments that restrict flow (Geyer, 1997). The main basin of the estuary opens to Vineyard Sound but water exchange between the two bodies is restricted by barrier beaches along the southern edge of the bay and water flow is through a small (100 m wide) channel. The tidal range is 0.5 m with a weak spring/neap signal (Geyer, 1997).
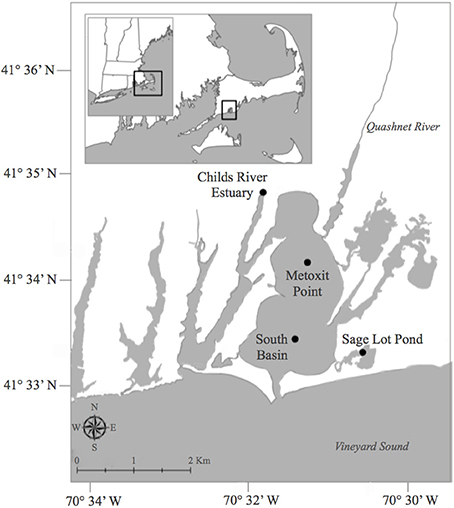
Figure 1. Map of sampling locations during 2011 and 2012 for benthic oxygen, dissolved inorganic nitrogen, and net di-nitrogen sediment flux measurements in Waquoit Bay, Cape Cod, Massachusetts, USA. Stations include; Childs River Estuary (CRE), Metoxit Point (MP), South Basin (SB), and Sage Lot Pond (SLP). Historic studies in the early 1990s measured benthic oxygen and nitrogen fluxes (LaMontagne, 1996; LaMontagne et al., 2002) at two of these stations, CRE and SLP. Map created by S. Q. Foster. GIS data layers are from the Office of Geographic Information (MassGIS, www.mass.gov/mgis/massgis.html, December 2011,) and are registered to the NAD83 datum, Massachusetts State Plane Mainland Zone coordinate system.
Over the past century changes in watershed land use have dramatically increased the rate of land-derived reactive N inputs to Waquoit Bay. In a model developed by Bowen and Valiela (2001), the load of N to Waquoit Bay more than doubled from 1938 to 1990. This increase is concurrent with a tenfold increase in the number of houses in the Childs River watershed (Valiela et al., 1992). Residential septic systems are the principal source of N because the drainage area has become densely populated and many of the homes are not connected to a sewer system.
Four stations were chosen to capture a range of environmental variability in the Waquoit Bay estuarine system (Figure 1). The stations varied in relative external N loading rates, dissolved inorganic nitrogen (DIN) concentrations, chlorophyll a concentrations, sediment characteristics (Table 1), and macrophyte biomass (Table 3). Childs River Estuary (CRE) is a brackish station located in the tidal section of the river in the northwest region of the Waquoit Bay estuarine system. CRE is one of the two main fresh water sources to Waquoit Bay and receives high N inputs (Table 1) (Valiela et al., 1997a, 2000). Two stations in the main basin of Waquoit Bay were also sampled, Metoxit Point (MP) and South Basin (SB). MP is located just south of the Quashnet River, which also carries a high load of N (Valiela et al., 1997a, 2000) from its suburbanized watershed, but this open basin station is more well mixed and has greater tidal exchange than CRE. MP also has high macroalgae biomass and experiences large diel swings in dissolved O2 concentrations in the summer. SB is located close to the mouth of the estuary where there is enhanced tidal mixing and is presumably less influenced by anthropogenic N inputs. This station receives an average N-load from multiple Waquoit Bay sub-watersheds, so we assumed an intermediate N load relative to the other stations but no values are available. The final station sampled we sampled was Sage Lot Pond (SLP), a small (surface area 0.17 km2) lagoon located within a forested watershed of protected state lands, which delivers a low N load relative to the other stations (Valiela et al., 1997a, 2000). SLP is one of the only regions within the Waquoit Bay estuarine system where native eelgrass (Zostera marina) stands are still present. The CRE and SLP sampling stations in this study are in the same region as historical stations where benthic O2 and N fluxes with sealed cores (LaMontagne, 1996; Kirkpatrick and Foreman, 1998; LaMontagne et al., 2002), benthic chambers (Hurlbut et al., 1994), and total ecosystem metabolism (D'Avanzo et al., 1996) were previously measured over the past 20 years. Three of the stations (CRE, MP, and SLP) in this current study correspond to long-term monitoring stations that are part of the National Estuarine Research Reserve (NERR) System-Wide Monitoring Program (SWMP).
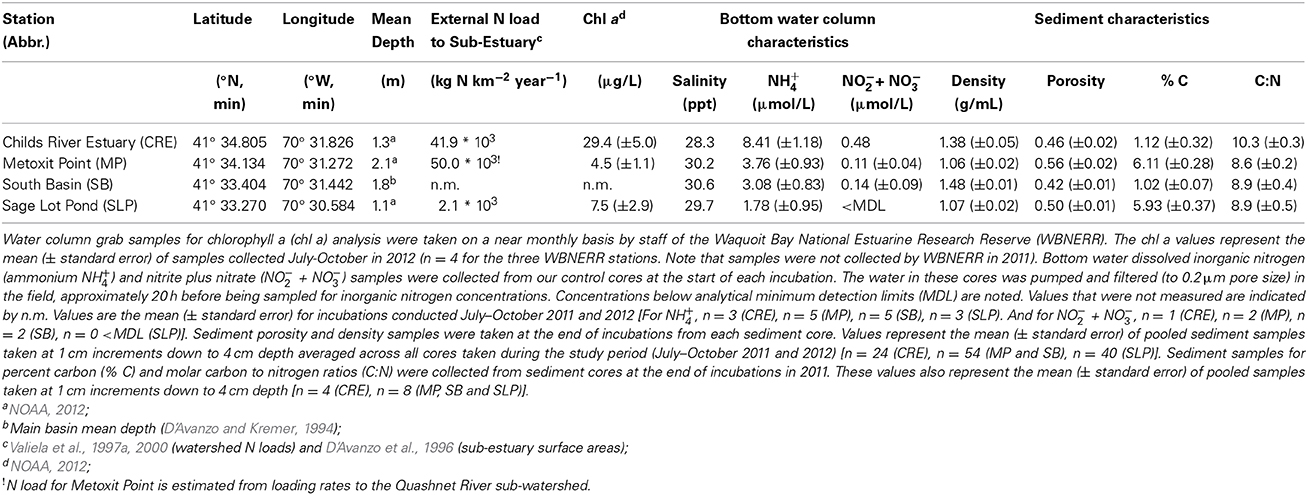
Table 1. Characterization of the four sampling stations in Waquoit Bay Massachusetts, USA.
Nitrogen Loading: Historic Calculation and Current Estimate
We calculated historic N loads to Waquoit Bay sub-estuaries for the early 1990s using the total N load to sub-watersheds from the Waquoit Bay Nitrogen Loading Model (NLM) (Valiela et al., 1997a, 2000) divided by the estuary surface areas (D'Avanzo et al., 1996). The Waquoit Bay NLM calculates the sub-watershed N-loads through 1990 (Valiela et al., 1997a, 2000; Bowen and Valiela, 2001) and we assume relative changes in the N load based on well-developed relationships with land use/land cover (Boyer et al., 2002), population (Caraco and Cole, 1999) and housing densities (Valiela et al., 1992). Using the Boyer et al. model (2002) and reclassified land use data (MassGIS), we estimated the current N load to the sub-estuaries. The MassGIS data classifies 21 different types of land-use. We reclassified these land-uses into 3 simple categories: “disturbed,” “non-disturbed,” or “other.” Disturbed land-use categories included all residential, commercial, industrial, transportation, waste disposal areas, and cropland. Non-disturbed included forest, pasture, wetlands, open land, and woody perennial regions (e.g., orchards, nurseries, bogs). Under these classifications, the disturbed area of the Childs River Estuary sub-watershed increased by nearly 90% between the early 1970s and the start of the 2000s. This trend is driven by an increase in residential and commercial regions, a trend that continues into the 2000s (Figure 2). In 1999 more than 40% of the CRE sub-watershed was designated as disturbed compared to 20% in 1971. In the Sage Lot Pond sub-watershed, the land area was relatively less disturbed and only showed a small increase (~3%) in disturbed areas between 1971 and 1999 (Figure 2). These differences in land use between the sub-watersheds is largely responsible for the observed historic differences in N loads (Valiela et al., 2000) and the estimated current N loads. Although the rate of building and watershed development decreased in the 2000s, there have been no substantial changes in the watershed that would impact the overall N-load budget. Therefore, we assume that based on land use in Waquoit Bay sub-estuaries and well established relationships (Valiela et al., 1992; Caraco and Cole, 1999; Boyer et al., 2002) that the current N-load is relatively higher in Childs River Estuary compared to Sage Lot Pond. Additionally, Childs River Estuary is likely to have experienced the greatest increase in N-load over the past 40 years.
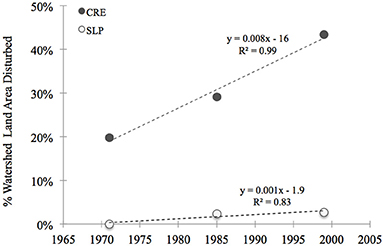
Figure 2. Thirty years of land use/land cover change in two Waquoit Bay sub-watersheds, Childs River Estuary (CRE, closed gray circles) and Sage Lot Pond (SLP, open circles). Disturbed areas were defined as regions under high human influence. This included the following land use categories (data from MassGIS, www.mass.gov): residential, commercial, industrial, transportation, waste disposal and cropland. Equations and the coefficient of determination (R2) for linear models are displayed next to the curves.
Sediment Coring and Field Measurements
We collected sediment cores on seven occasions for sediment O2 uptake, benthic nitrogen fluxes, and net sediment N2 fluxes at the four sampling stations over 2 years (2011 and 2012) in the summer and fall months (July–October). Each station was sampled three to six times during this period (Table 2). Triplicate or quadruplicate intact sediment cores were collected using a pull corer, which maintains the vertical structure of the sediment cores. The core tubes (30 cm height, 10 cm diameter) are made of clear polyvinyl chloride (PVC) material. The sediment height in the cores collected ranged from 10 to 18 cm. After collection the cores were capped and kept in the dark in a cooler in order to maintain approximate field temperature until they were brought to an environmental chamber at Boston University, which was set to the average in situ bottom water temperature. The time between coring and placement in the environmental chamber was less than 7 h. Dissolved O2 concentrations, salinity, and water temperature (Hach HQd using LDO101, CDC401 probes) were collected at the surface and bottom at each station.
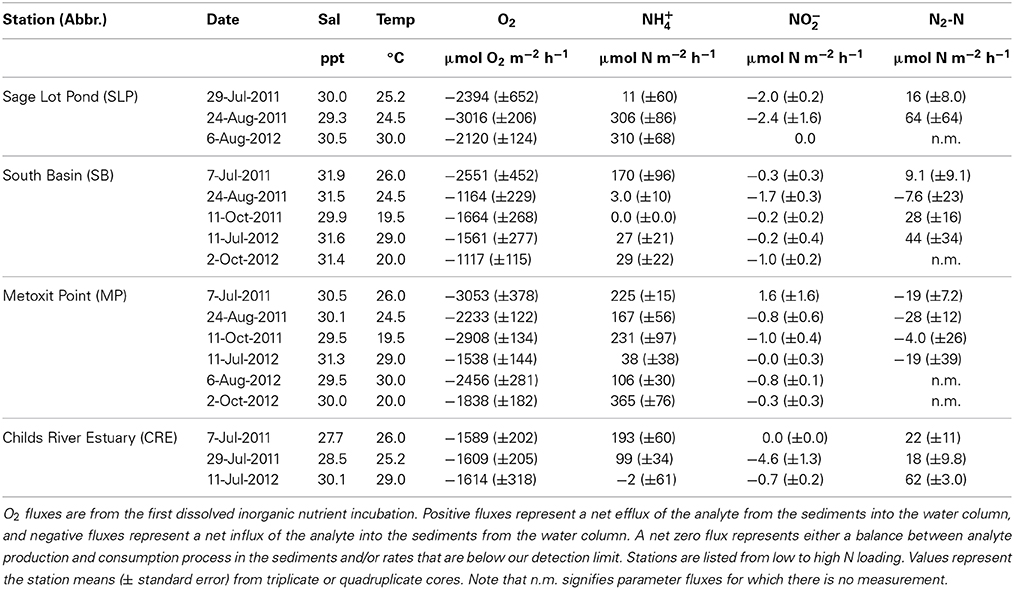
Table 2. Summary of sediment oxygen (O2), ammonium (NH+4), nitrite (NO−2) and di-nitrogen gas per mole nitrogen (N2-N) flux rates measured across the sediment-water interface in 2011 and 2012 (July–October).
Incubation Set up and Sampling
After the cores arrived at Boston University they were immediately placed in a water bath in the environmental chamber. The sediment cores were kept in the dark, uncapped, and bubbled gently with ambient air overnight (~12 h) to keep the overlaying water oxygenated without disturbing the surface of the sediment (Fulweiler et al., 2008; Fulweiler and Nixon, 2009). All of our incubations were conducted in the dark. We conducted dark only incubations because we used the N2/Ar technique for measuring N2 fluxes which is highly sensitive to bubble formation created by photosynthesis in the light (Eyre et al., 2002). Additionally, we conducted dark incubations because we wanted to compare these fluxes to those measured historically and all previous incubations were conducted in the dark.
We conducted two separate incubations. The first incubation collected samples for DIN fluxes and the second for the flux of N2 gas (Fulweiler and Nixon, 2009; Vieillard and Fulweiler, 2012). We separated these incubations in order to minimize the sample volume taken from the cores at each time point thus decreasing potential dilution impacts. The two incubations were separated by 8–12 h (overnight) and cores were again bubbled gently with ambient air. Before each of the core incubations we carefully siphoned off the water overlaying the sediment and replaced it with 0.2 μm filtered, station-specific bottom water. Each core was then sealed with no air headspace with an acrylic gas-tight lid equipped with inflow and outflow ports. This process was done using inflow of the 0.2 μm filtered station water in order to prevent bubbles in the tops of the sealed cores. Magnetic stir bars (8 cm length), fixed to the core tops (Banta et al., 1995; Fulweiler et al., 2010), provided gentle mixing of the overlying water (~40 revolutions min−1) with minimal re-suspension of sediments. The incubation temperatures ranged from 19.5 to 26°C. Incubation time was determined by balancing the following criteria: achieving a 2 mg L−1 drop in dissolved oxygen, five sampling time points at intervals of at least 60 min, and dissolved O2 concentrations kept above the hypoxic threshold (>2 mg O2 L−1). Our incubations ranged between 6 and 9 h. The total time between core collection and the end of the second incubation ranged between 48 and 55 h.
At each time point water samples were immediately filtered into 30 ml acid washed and deionized water leached polyethylene bottles using a 60 ml acid washed polypropylene syringe and glass fiber filters (Whatman GF/F, 0.70 μm pore size). The vials were stored in a freezer (at approximately −15°C) until analysis for DIN (ammonium (NH+4), nitrite (NO−2), and nitrate (NO−3)). Dissolved O2 concentrations were measured at 3 time points (initial, middle, and final) using an optical dissolved oxygen sensor (Hach LDO101). At the start of the second incubation we replaced the overlying water with filtered (0.2 μm) station water and the cores were sealed with the gas tight lids and the incubation proceeded. We collected duplicate water samples in 12 ml Labco Limited Exetainer® vials with gas tight septa for dissolved N2/Ar gas analysis at five time points and preserved them with 25 μl of saturated zinc chloride solution (Fulweiler and Nixon, 2009, 2011). Sample vials were filled from the bottom with approximately a 12 ml overflow volume, preserved, and then immediately capped in order to minimize atmospheric gas contamination.
At the end of the second incubation we uncapped the cores and bubbled them over night (approximately 12 h). The following day we took sediment sub-samples from each core to analyze for sediment porosity, density (in 2011 and 2012) and sediment percent carbon and molar carbon to nitrogen ratios (in 2011). Sub-core samples were taken using acid washed 60 mL polycarbonate syringes with their ends cut off. We sectioned sub-cores at 1 cm increments up to 4 cm. Sediment samples were then frozen and stored in a −80°C freezer until analysis.
Sampling Analysis and Flux Calculations
Dissolved inorganic nitrogen concentrations were determined by high-resolution digital colorimetry on a Seal Auto Analyzer 3 with segmented flow injection using standard techniques (Solorzano, 1969; Johnson and Petty, 1983; Hansen and Koroleff, 1999). Our laboratory mean minimum detection limits (MDL) for the period of this study are 0.164, 0.051, and 0.005 μ M for NH+4, NOx (NO−3 + NO−2), and NO−2 respectively.
Dissolved gas samples were analyzed for concentrations of N2 and Ar using a quadrupole membrane inlet mass spectrometer (MIMS) using a technique developed by Kana et al. (1994) to measure rates of sediment denitrification (Kana et al., 1998; Eyre et al., 2002; Fulweiler and Nixon, 2009). This method is precise (±0.03% for N2/Ar), rapid (~20–30 samples h−1) and requires a small sample size (<10 ml). N2 concentrations were determined using the measured ratio of N2/Ar multiplied by the calculated theoretical Ar concentration based on solubility constants of Weiss (1970) and given the temperature and salinity of the sample (Colt, 1984; Kana et al., 1998). The N2/Ar technique gives a measure of net N2 flux (i.e., gross denitrification minus gross nitrogen fixation).
Flux rates across the sediment-water interface were determined by first calculating the linear regression slope (R squared value ≥0.65) of the net parameter (e.g., O2, NH+4, NO−3, NO−2, N2) concentration over the incubation time. This rate was then multiplied by the sediment core water column volume and then divided by the sediment core surface area. We report mean flux rates of O2, NH+4, NO−2, and N2 from triplicate or quadruplicate cores (± standard error) from a given sampling station and date in consistent units (micromoles per meter squared per hour, μmol m−2 h−1). Positive fluxes represent a net efflux of the parameter out of the sediments into the water column, and negative fluxes represent a net influx of the parameter into the sediments from the water column. A net zero flux represents either a balance between analyte production and consumption process in the sediments and/or rates that are below our detection limit.
Concentration values for NOx were consistently low and in many cases below the MDL of the Seal Auto Analyzer. As a result of this, NOx concentrations were often less than the measured concentration of NO−2 yielding a negative value for NO−3. Therefore, although we were successfully able to calculate fluxes for NO−2 for most cores we were unable to do so for NO−3.
Sediment characteristic methods (i.e., sediment porosity, density, percent carbon and nitrogen) followed those outlined in the Protocol Handbook for NICE (Nitrogen Cycling in Estuaries) (Dalsgaard et al., 2000). Analysis of sediment percent carbon and nitrogen was conducted at the Boston University Stable Isotopes Lab, Boston, Massachusetts, USA.
Historic Comparison Methods
In an effort to put our Waquoit Bay sediment flux rates in a larger temporal context we compared our data to all available historical studies for this site. Most of the historical data come from a comprehensive effort in the early 1990s lead by LaMontagne and Valiela (LaMontagne and Valiela, 1995; LaMontagne, 1996; LaMontagne et al., 2002). In these studies, sediment fluxes of O2, DIN, and N2 gas, were measured using similar methods to our current 2011–2012 study. Others also measured DIN fluxes (Kirkpatrick and Foreman, 1998) in Waquoit Bay and we have compared our 2011-2012 rates to those studies as well.
All of the values used in our historic comparisons were derived from near identical field and incubation procedures. For example, sediment cores were collected from similar locations within Waquoit Bay and then transported to laboratories where sealed core incubations were conducted in the dark and at ambient temperatures. Water samples were taken from the cores at discrete time points during the incubations and analyzed for the various parameters. The duration of incubations in the LaMontagne (1996) study, like those we report here, were based on the O2 uptake rate. The Kirkpatrick and Foreman (1998) study used a set incubation time of 24 h. All studies used the same colorimetric techniques to determine dissolved nitrogen species concentrations.
Methods differ between the studies in the analysis of dissolved gas samples. In the LaMontagne studies (LaMontagne and Valiela, 1995; LaMontagne, 1996; LaMontagne et al., 2002), dissolved gas samples were analyzed for concentrations of O2 and N2 using a custom gas stripper connected to a gas chromatograph (GC) (Devol, 1991). This analysis was designed to precisely (<0.5% coefficient of variance) measure dissolved gasses by injecting a fixed volume of liquid, completely stripping the gasses from the water sample into the carrier gas of a GC and separating N2 and O2 into discreet peaks. The peaks were quantified with a Perkin Elmer 9310 gas chromatograph equipped with a thermal conductivity detector. In our current study, we measured dissolved O2 concentrations over the course of the incubation with a Hach LDO101 oxygen sensor and N2 concentrations were determined by the N2/Ar technique on a MIMS.
Although the GC gas stripping and the MIMS N2/Ar methods clearly differ in terms of the instruments used to estimate denitrification, they are similar in that they both are techniques that directly measure the concentration of N2. Currently, to our knowledge, there are no published simultaneous comparisons between the GC method and the N2/Ar technique. However, we acknowledge that differences in denitrification rates may be driven, at least in part, by methodical issues.
As part of our historic comparison we also calculated net ecosystem daytime productivity and nighttime respiration using the same change in oxygen concentration method which was first proposed by Odum (1956) and modified according to Thébault (Thébault et al., 2008). We computed rates for our sampling years (2011–2012) at Childs River Estuary, the station where historic measurements were conducted in the early 1990s (D'Avanzo et al., 1996). We used conductivity, temperature, and dissolved oxygen data from the Waquoit Bay National Estuarine Research Reserve (WBNERR) System-Wide Monitoring Program (SWMP) (NOAA, 2012). All input data was measured at 15-min intervals using a YSI model 6600 data logger equipped with a Luminescence Lifetime ProODO optical sensor and is deployed and maintained by WBNERR. The data were carefully examined and we removed any time points flagged by the WBNERR staff as potentially erroneous. We did not eliminate data based on severe weather events. The historic study (D'Avanzo et al., 1996) used an ENDECO/YSI 1184 rapid-pulsed Clark-type polarographic electrode (membrane technology) to determine dissolved O2 concentrations. In our 2011–2012 study, the Childs River Estuary data-sonde was a YSI 6600v2 equipped with a 6150 ROX Optical dissolved oxygen probe. Side-by-side simultaneous measurement of dissolved O2 concentrations using these two sensors has shown agreement within 1% (Thébault et al., 2008).
The basic method for calculating daily productivity and respiration rates uses rates of dissolved O2 concentration change over a 24-h time period (Odum, 1956). The rate of dissolved O2 change during the day is net primary production, while at night it is respiration. The relationship is represented by the mass balance equation:
Where dDO is the change in concentration of dissolved oxygen (mg O2 L−1), dt is the change in time (h), P is the rate of gross photosynthesis and R is the absolute value of respiration, and D is the diffusional flux of oxygen between the water-air interface (mg O2 L−1 h−1). The diffusional flux (D) is dependent on wind driven turbulence on the water surface and the concentration gradient between the dissolved oxygen concentration in the water (DO) and the hypothetical saturation concentration at equilibrium with the atmosphere (DOs). The relationship is described by:
In our calculations we set the exchange coefficient (k) equal to 0.5 h−1. While this exchange coefficient is generally representative of estuarine tributaries (Caffrey, 2004), the coefficient can vary with wind conditions and other studies use wind speeds measured concurrently to dissolved oxygen concentrations to determine k (Marino and Howarth, 1993; D'Avanzo et al., 1996; Thébault et al., 2008; Howarth et al., 2014). Therefore, our measure of the diffusional flux is simplistic and may at times be over or underestimated. The DOs concentration is a function of water salinity and temperature (Benson and Krause, 1984). When the DO concentration in the water exceeds the saturation concentration, the diffusive rate is negative indicating oxygen flux out of the water and when the DO concentration is less than the saturation concentration, the diffusive rate is positive indicating diffusion of oxygen from the atmosphere into the water.
Dissolved O2 change can also be a result of exchange with other water bodies through advection, but in Waquoit Bay this has been determined to be a negligible process (D'Avanzo et al., 1996; Caffrey, 2003). D'Avanzo et al. (1996) calculated that the tidal excursion for Childs River Estuary was 600 m. This excursion value is less than the length of estuary indicating that tidal advection is likely to be confined within the sub-estuary region during the intervals over which productivity and respiration are measured. In addition, Caffrey (2003) tested the impact of horizontal advection on metabolism calculations for a 6-week period at the end of 1998 in Waquoit Bay using WBNERR sondes at Central Basin and Metoxit Point stations. It was found that production and respiration calculated from these data did not significantly differ between the two stations (Caffrey, 2003). In our calculations we also assumed negligible effects of advection based on the findings of D'Avanzo et al. (1996). Additionally, we did not find a correlation between dissolved O2 concentrations and salinity (R2 = 0.002), again indicating that dissolved O2 concentrations where not greatly impacted by tidal advection.
Data Analysis
All statistical tests were conducted using the JMP software package (version 10.0.0, copyright 2012, SAS Institute Inc.). To determine if flux rates were significantly different from each other we ran two-way analysis of variance (ANOVA) with sampling date and station as the main effects. We then conducted paired student's t test post-hoc to further examine where differences existed in our datasets. We determined outliers as points that exceed 1.5 times the interquartile range beyond the first or third quartiles. For all statistical analyses we interpreted a p value ≤ 0.05 to show that the observed trends and correlations were statistically significant.
Results
Sediment Oxygen Uptake
Sediment O2 uptake from the DIN incubation ranged (± standard error) from 1117 (±115) to 3053 (±378) μ mol O2 m−2 h−1 with a mean of 2025 (±151) μ mol O2 m−2 h−1 (Table 2). O2 uptake measured from the DIN incubation (conducted first) was significantly lower (p = 0.04) than the uptake measured during the incubation for N2 samples by approximately 14%. In order to be consistent, we use only the O2 uptake values measured from the first DIN incubation for our comparison analyses. Oxygen uptake values differed significantly across the stations sampled because Metoxit Point and Sage Lot Pond had greater O2 uptake rates compared to South Basin and Childs River Estuary (p < 0.01) (Figure 3A). Three dates (7-July-2011, 11-Oct-2011, and 6-Aug-2012) were significantly higher than two other sampling dates (11-July-2012 and 2-Oct 2012) but the data exhibited no correlation with temperature (R2 < 0.001, p = 0.83, temperature range 20–30°C).
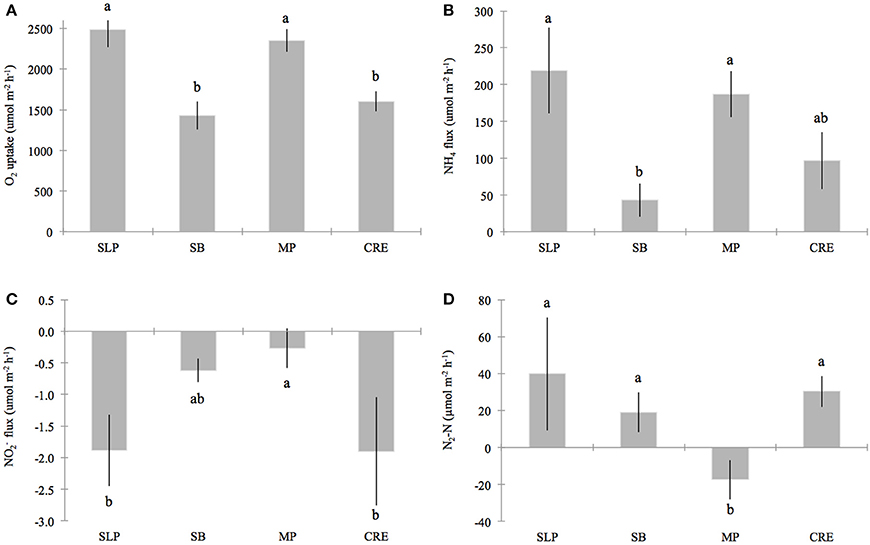
Figure 3. Benthic fluxes for (A) oxygen (O2) uptake, (B) ammonium (NH+4), (C) nitrite (NO−2) and (D) di-nitrogen gas per mole nitrogen (N2-N), across the sediment-water interface in Waquoit Bay. Bars represent the station means (± standard error) of all cores measured on seven 2011–2012 sampling dates for O2 uptake, NH+4 and NO−2 fluxes (plots A–C) and five sampling dates 2011–2012 for N2-N fluxes (plot D). Stations organized from relatively low to high external nitrogen load: Sage Lot Pond (SLP, n = 10 (plots A–C), n = 6 (plot D)), South Basin (SB, n = 16 (plots A–C), n = 13 (plot D)), Metoxit Point (MP, n = 21 (plots A–C), n = 12 (plot D)), and Childs River Estuary (CRE, n = 9 (plots A–C), n = 8 (plot D)). Note that we did find a significant difference between dates for NO−2 fluxes (p < 0.01), but not for the other flux parameters. Lower case letters above the bars that are not the same indicate fluxes that are significantly different from each other (α = 0.05).
Benthic Dissolved Inorganic Nitrogen Fluxes
We measured positive fluxes of ammonium (NH+4) from the sediments at all stations over the course of this study except on one occasion (11-July-2012) where we measured mean NH+4 uptake (negative flux) from Childs River Estuary sediments. Additionally, on two occasions at the South Basin station and one occasion at the Sage Lot Pond station, individual cores showed NH+4 uptake (although the mean of triplicate cores per station was a positive flux). The mean (± standard error) NH+4 flux rate across all sampling dates and stations was 136 (±30) μmol N m−2 h−1 with a range of −2 (±61) (Childs River Estuary) to 365 (±76) (Metoxit Point) μmol N m−2 h−1 (Table 2).
Ammonium fluxes were significantly higher at Sage Lot Pond and Metoxit Point than South Basin (p = 0.002 for both Sage Lot Pond and Metoxit Point). Childs River Estuary did not differ significantly from the other stations. Additionally, while samples taken on 7-July-2011 had higher rates than samples from 29-July-2011 and 11-July-2012, there was no significant correlation between NH+4 flux rates and temperature (R2 = 0.004, p = 0.650). Ammonium flux rates were positively correlated with O2 uptake rates (R2 = 0.34, p = 0.014) with high rates of NH+4 flux corresponding to high rates of O2 uptake (Figures 3A,B).
In general, we observed low sediment NO−2 fluxes (Figure 3C) with a range of mean rates (± standard error) from −4.6 (±1.3) to 1.6 (±0.2) μmol N m−2 h−1 (Table 2). Production (positive flux) of NO−2 was measured only once over the sampling period (Metoxit Point, 7-July-2011, 1.6 ± 1.6 μmol N m−2 h−1, n = 3). The highest NO−2 uptake (−4.6 ± 1.3 μmol N m−2 h−1, n = 3) was from Childs River Estuary sediments collected at the end of July. Nitrite flux rates differed significantly across three sampling dates in 2011 (7-July-2011, 29-July-2011, 24-August-2011) but not in 2012. Fluxes did not correlate significantly with temperature (R2 = 0.002, p = 0.773). Metoxit Point had higher flux rates than Childs River Estuary (p = 0.022) and Sage Lot Pond (p = 0.019) but did not differ significantly from South Basin (p = 0.363). Nitrite fluxes did not vary significantly as a function of O2 uptake or NH+4 fluxes for the data set as a whole.
Direct Measure of Sediment Net N2 Flux
Fluxes of N2 varied among stations with three stations exhibiting positive (net denitrification) and one station (Metoxit Point) exhibiting negative (net N fixation) fluxes (Figure 3D). At Metoxit Point, net N2 flux was significantly lower than the Sage Lot Pond (p = 0.012), South Basin (p = 0.042) and Childs River Estuary (p = 0.021). Mean net N2 flux across all stations and sampling dates in 2011-2012 was 14 (±8.3) μmol N2-N m−2 h−1 and did not differ significantly with temperature (R2 = 0.002, p = 0.766). Mean net denitrification (positive fluxes only) was 33 (±7.5) μmol N2-N m−2 h−1, and net N fixation (negative values only) was −16 (±4.3) μmol N2-N m−2 h−1. We observed the highest rate of net denitrification (190 μmol N2-N m−2 h−1) from a Sage Lot Pond core on 24-Aug-2011. Overall, the N2 fluxes from Sage Lot Pond had the highest mean N2 flux rates but also the highest variability between cores compared to the other stations. The highest mean net N fixation rate (−28 ± 12 μmol N2-N m−2 h−1, n = 3) was measured in sediments collected from the Metoxit Point during August 2011. In fact, we measured net N fixation in 9 out of 12 Metoxit Point sediment cores incubated over the sampling period and overall mean rates from Metoxit Point. The fluxes of net N2 from Waquoit Bay sediments were not correlated to sediment O2 uptake (p = 0.863).
Discussion
Spatial Variability
Despite the spatial gradient of N loads in Waquoit Bay the observed benthic fluxes did not follow the trend of N loading (Figure 3). Water column and sediment characteristics also did not vary as function of N loading (Table 1). Although many studies have found a positive relationship of N load to these benthic flux rates (Seitzinger, 1988; Nowicki, 1994) others have found little to no relationship between nutrient enrichment and net denitrification rates (Oviatt et al., 1995; Fulweiler et al., 2008). Similarly, the historic Waquoit Bay studies (LaMontagne and Valiela, 1995; LaMontagne, 1996; LaMontagne et al., 2002) also did not find a significant relationship between N load and O2 uptake, NH+4, NO−3, or net N2 flux rates. This suggests that in Waquoit Bay factors other than N load may be of equal or greater importance in determining organic matter deposition to sediments and subsequently the rates of benthic metabolism and N cycling dynamics.
Sediment Oxygen Uptake
We measured a significant difference in O2 uptake rates between the four stations, however the relationship between N load and O2 uptake was not a positive correlation as has previously been found in other estuarine systems (Nixon, 1981). For example, the Childs River Estuary receives the highest N inputs from its sub-watershed relative to the other stations however O2 uptake was relatively low. We attribute this pattern to the low concentrations of dissolved O2 in the Childs River Estuary water column when we collected our sediment cores and station water for incubations, 5.1 ± 0.6 mg O2 L−1 (mean ± standard error). These concentrations were 2.0–3.6 mg O2L−1 lower than the concentrations measured at the other stations sampled on the same day.
The highest rates of O2 uptake were measured at Metoxit Point and Sage Lot Pond. The similarity in O2 uptake rates between these two stations is intriguing as the Metoxit Point station is heavily influenced by anthropogenic N while Sage Lot Pond has the lowest N load (Table 1). Large, pervasive, filamentous macroalgae mats of Cladophora vagabunda and Gracilaria tikvahiae characterize Metoxit Point. In contrast, the dominant primary producer in Sage Lot Pond is the rooted eelgrass, Zostera marina, (Table 3) which once covered the entire benthos of the Waquoit Bay estuary (Valiela et al., 1992). Although these systems have different N loads and ecological structures, they are both highly productive regions of the bay and have organic rich sediments. The percent carbon content of both of these stations was similar (6.11 ± 0.28% and 5.93 ± 0.37%, Metoxit Point and Sage Lot Pond respectively), as was their porosity and density compared to the other two stations (Table 1). The South Basin station is moderately impacted by anthropogenic activities because of its location at the mouth of the estuary, which puts it relatively far from land-based N loading and it is the most tidally flushed and well mixed site. At this station we measured lower oxygen demand than both Metoxit Point and Sage Lot Pond but rates similar to Childs River Estuary, the station most heavily influenced by N loading. The relatively low rates at South Basin and Childs River Estuary may be attributed again to their similarity in sediment characteristics. Both these stations have lower percent carbon in their sediments than the other two stations (1.02 ± 0.07% and 1.12 ± 0.32%, South Basin and Childs River Estuary respectively) (Table 1).
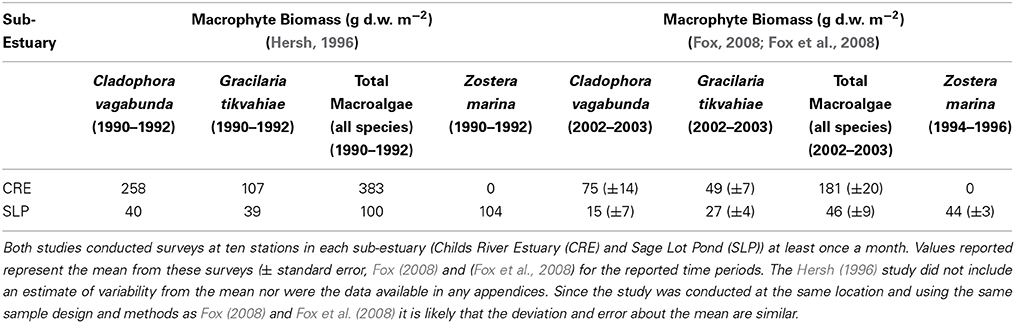
Table 3. Comparison of mean macrophyte biomass in grams dry weight per meter squared (g d.w. m−2) between surveys conducted in the early 1990s (Hersh, 1996) and the early 2000s (Fox, 2008; Fox et al., 2008).
Benthic Nitrogen Fluxes
Many estuarine studies of benthic sediment fluxes report high rates of NH+4 efflux increasing with N loading, organic matter content, and temperature (Nixon, 1981; Boynton and Kemp, 1985; Nowicki, 1994). In Waquoit Bay, we observed NH+4 fluxes that were partially consistent with these previous studies. Metoxit Point, the station with the second highest N load, had significantly greater rates of NH+4 production than South Basin, the other main basin station only 1 km away but less impacted by N loading. Most of the NH+4 fluxes were positive, indicating a release of NH+4 from the sediments. However, from the station least impacted by excess N (Sage Lot Pond) we also measured high rates of NH+4 flux relative to South Basin. This is likely a result of the organic rich sediments found in the productive eelgrass beds of Sage Lot Pond (Table 1), which can promote microbial decomposition and mineral regeneration (Nixon et al., 1980; Nixon, 1981; Kemp et al., 2005).
Concentrations of NO−3 and NO−2 were low and often below the detection limit of our analysis. The historic Waquoit Bay studies also report low NO−3 and NO−2 concentrations and fluxes (LaMontagne, 1996; Kirkpatrick and Foreman, 1998; LaMontagne et al., 2002). There is a broad range of literature NO−3 flux values from other estuaries exhibiting both uptake and release. Kemp et al. (1990) exclusively measured nitrate uptake in the Chesapeake Bay with a flux range from −100 to 0 μmol N m−2 h−1 while other systems were balanced between uptake and release (Gardner et al., 2006; Giblin et al., 2010). Fulweiler et al. (2010) found a maximum nitrate flux of −60 μmol N m−2 h−1 at the Providence River estuary, which corresponded to the highest NH+4 release and thus was suggestive of dissimilatory nitrate reduction to ammonium (DNRA).
Direct Measure of Net Sediment N2 Flux
Net sediment N2 fluxes directly measured from water samples were not significantly different from each other except that Metoxit Point was significantly lower than the other stations because of negative N2 fluxes (indicating net N-fixation) measured there. We hypothesize that these negative N2 fluxes are because of the inhibition of coupled nitrification-denitrification at this site. Under frequent and intense low oxygen and sulfidic conditions, nitrification would be diminished thereby decreasing the amount of NO−3 available for denitrification. This finding is supported by Rysgaard et al. (1994, 1995) who found lowest rates of denitrification in the summer when water column oxygen and nitrate concentrations were at a minimum thus inhibiting coupled nitrification-denitrification in the sediments.
Since Childs River Estuary is also greatly influenced by anthropogenic N loads, we might expect that net N2 flux rates would be more similar to the Metoxit Point station. However, we observed important differences between these two stations. For example, at Childs River Estuary we did not observe extensive macroalgae mats and sulfidic sediments as we did at Metoxit Point. Additionally, Childs River Estuary cores typically had a small, light oxic layer while Metoxit Point sediments were always uniformly dark and likely anaerobic to the surface. These qualitative observations suggest that coupled nitrification-denitrification was less inhibited in Childs River Estuary sediments, which is why rates of net N2 flux were significantly greater than at Metoxit Point.
Although Metoxit Point and Sage Lot Pond had similar sediment O2 uptake, presumably because of their high productivity, they exhibited opposite trends in net N2 fluxes. In fact, at Metoxit Point we only measured net N fixation while the highest rate of net denitrification was measured at Sage Lot Pond. This distinction is an important reminder as to some of the deleterious and perhaps unexpected effects of nutrient pollution and eutrophication. While increased nutrient loading may stimulate organic matter production (Nixon et al., 2001), it also changes the ecosystems biological structure and chemical composition. For example, the loss of eelgrass and associated bioturbating infaunal community is likely to diminish oxic regions within the sediments and therefore decrease areas where coupled nitrification-denitrification can occur. Inhibition of this crucial microbial process is significant as denitrification has the potential, in many coastal systems, to nearly completely filter out reactive N inputs (Seitzinger, 1988). Metoxit Point and Sage Lot Pond may both have high productivity, but the station more strongly altered by anthropogenic N loads (Metoxit Point) is the least capable at providing this important ecosystem service.
Historic Comparisons
During the early and mid-1990s sediment O2 uptake, dissolved inorganic nitrogen, and N2 sediment flux measurements were made in Waquoit Bay (LaMontagne and Valiela, 1995; LaMontagne, 1996; Kirkpatrick and Foreman, 1998; LaMontagne et al., 2002). These historic studies employed both similar experimental design (i.e., sealed sediment core incubations), as well as similar sample analyses to our current study. LaMontagne (1996) measured O2 uptake, dissolved inorganic nitrogen, and N2 fluxes between 1992 and 1994 in two of the stations measured here (Sage Lot Pond and Childs River Estuary).
Sediment O2 uptake, measured on 33 occasions during this period, ranged from 662 to 7103 μmol O2 m−2 h−1, with the highest rates occurring in the summer (LaMontagne, 1996). The highest O2 uptake we measured (July-October 2011) was approximately 3016 μmol O2m−2 h−1. Using only measurements between July and October, the historic (1992–1994) mean (± standard error) O2 consumption rates for Sage Lot Pond and Childs River Estuary were 5270 (±1001) and 4144 (±346) μmol O2m−2 h−1, respectively (LaMontagne, 1996). These historic rates are 32 and 61% greater than the mean sediment O2 uptake we measured (2510 (±265) and 1604 (±7.6) μmol O2m−2 h−1, p = 0.009 and p = 0.006, Sage Lot Pond and Childs River Estuary respectively) (Figure 4).
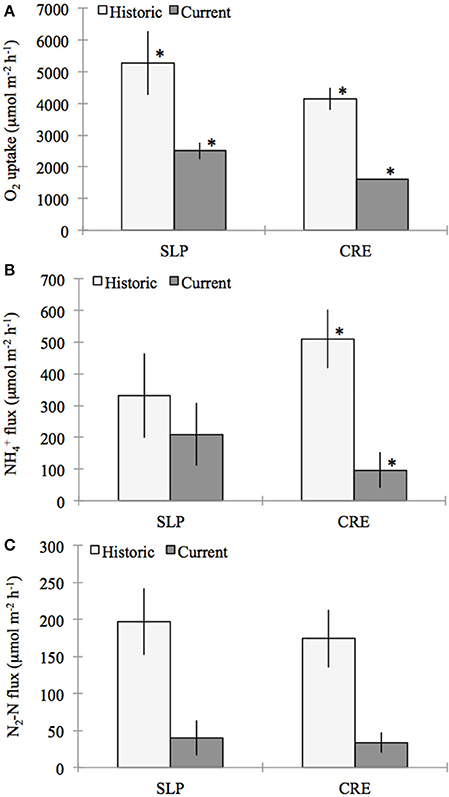
Figure 4. Comparison of historic (July–October, 1992–1994) (LaMontagne, 1996) and current (July–October, 2011–2012) benthic flux rates of (A) oxygen (O2), (B) ammonium (NH+4), and (C) di-nitrogen gas per mole nitrogen (N−2N) (for direct measurements made from sealed cores collected from Sage Lot Pond (SLP) and Childs River Estuary (CRE) in Waquoit Bay. Bars represent station means (± standard error) from incubation dates (SLP Historic n = 4, SLP Current n = 3 except for N2-N flux n = 2, CRE Historic n = 10 except for NH+4 n = 9, CRE Current n = 3). For the comparison between historic and current means for each station stars above the bars indicate fluxes that are significantly different from each other (α = 0.05).
Compared to historical NH+4 flux rates measured in Waquoit Bay our values are again substantially lower for Childs River Estuary, however the difference was not significant for Sage Lot Pond. The average rates we measured (± standard error) were 209 (±99) and 97 (±56) μmol N m−2 h−1 for Sage Lot Pond and Childs River Estuary respectively. LaMontagne (1996) published mean (± standard error) July–October NH+4 flux rates of 331 (±133) and 511 (±93) μmol N m−2 h−1 from Sage Lot Pond and Childs River Estuary respectively (p = 0.530 (SLP) and p = 0.024 (CRE)) (Figure 4). Furthermore, values reported for Childs River Estuary by Kirkpatrick and Foreman (1998) are over 6 times higher than those we measured (606 μmol N m−2 h−1).
Similar to our findings the historic studies in Waquoit Bay (LaMontagne and Valiela, 1995; LaMontagne, 1996; Kirkpatrick and Foreman, 1998; LaMontagne et al., 2002) also measured extremely low concentrations and fluxes of NOx and NO−2 during the summer. This may be a result of assimilation by primary producers. It is also indicative of highly reducing sediments with low nitrification or sediments where nitrification and denitrification are tightly coupled.
Finally, historic net N2 fluxes from Waquoit Bay sediments were nearly an order of magnitude greater than the net N2 fluxes we measured when pooling both stations together (p = 0.012). The difference was not statistically significant when stations were separated due to a small sample size in the current study (n = 3 and n = 2, Childs River Estuary and Sage Lot Pond, respectively). The mean net N2 flux rates (±SE) reported between July and October during 1992–1994 by LaMontagne (1996) for Sage Lot Pond and Childs River Estuary are 197 (±45) and 174 (±39) μmol N2-N m−2 h−1 respectively compared to the current means of 40 (±24) and 34 (±14) μmol N2-N m−2 h−1 [p = 0.102 (SLP) and p = 0.059 (CRE)] (Figure 4). The historic mean net N2 flux rate for both stations together is nearly 80% greater than the mean net N2 flux rate we observed in our study (p = 0.012).
Using July-October net N2 rates from dark incubations, we scaled up fluxes for the Childs River to the water body surface area of the sub-estuary for an entire year, in order to compare the estimated percentage of anthropogenic N inputs removed. Assuming that these rates are representative of rates for the entire Childs River sub-estuary and throughout the year, we found that the mean historic rate (2818 (±632) kg N y−1) could have removed 51% (±11%) of the annual external N inputs (5536 N y−1, Valiela et al., 2000), while the current rate [551 (±227) kg N y−1] accounts for only 10% (±4%) of the external N inputs.
The decrease in net N2 flux rates may be explained by fundamental alterations of the ecological structure and functioning in Waquoit Bay. Alternatively, our observed trend could be a result of high year-to-year variability, methodological differences between our two studies, or a combination of these factors. Although the field and incubation procedures were nearly identical, the methods used to directly measure the N2 concentration of the water samples differed. Both techniques have similar limitations including gas disequilibria from changing temperatures or from methane ebullition (Cornwell et al., 1999), however the N2/Ar MIMS method is much more precise than the gas stripping GC method (coefficient of variance 0.03% and 0.5% for N2/Ar and GC methods, respectively) (Devol, 1991; Kana et al., 1994).
While we propose that the differences observed between our net N2 flux rates and the historic values are not caused exclusively by the method differences, we are cautious with this interpretation, as denitrification is an extremely difficult process to measure (Cornwell et al., 1999; Groffman et al., 2006). However, the fact that we also see dramatic declines in sediment O2 uptake, benthic DIN fluxes (which use the same methods) across a range of years in the early 1990s and in our current study suggests that these decreases are caused, at least in part, by larger ecosystem level differences.
In our comparison of net ecosystem daytime production and nighttime respiration, we once again found that current (2011–2012) rates of production and respiration in the Childs River Estuary were lower than historic rates (1991–1992, D'Avanzo et al., 1996) during the July–October sampling period (ANOVA, p < 0.0001 for both production and respiration) (Figure 5). The mean daily rate (± standard error) for daytime net production during this 4-month time period was 4.4 (±0.3) g O2 m−2 d−1 in 2011–2012 compared to 7.2 (±0.4) g O2 m−2 d−1 in 1991–1992. Absolute nighttime respiration rates in 2011–2012 were also lower than the 1991–1992 values [4.6 (±0.2) and 7.4 (±0.4) g O2 m−2 d−1, 2011–2012 and 1991–1992 respectively]. During most months of the year, the monthly mean of daytime net production was greater in the historic dataset (above the 1:1 line, Figure 6A). The exceptions to this relationship included two winter data points (November, December monthly averages) where historic and current rates were equivalent (on the 1:1 line, Figure 6A) and two spring month data points (March, April monthly averages) where the current rates were greater than the historic (below the 1:1 line, Figure 6A). Monthly means of daily respiration rates were always greater in the 1991–1992 dataset compared to the 2011–2012 data except for March (Figure 6B). Daytime net production and respiration monthly mean rates during the 2011–2012 months of sediment core sampling (July–October) were significantly higher in 1991–1992 compared to 2011–2012 (p = 0.026 and p = 0.004, production and respiration, respectively). While we acknowledge that our calculation of net ecosystem production and respiration is simplistic due to our use of a constant gas exchange coefficient (see Methods section), our aim here was to provide an additional way to examine changes in the system.
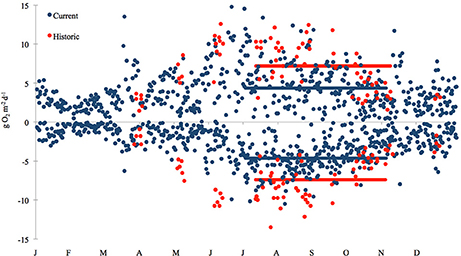
Figure 5. Temporal variation in net daytime primary production (positive values) and nighttime respiration (negative values) rates at the Childs River Estuary station. The current data (blue circles) were calculated using continuous 15-min interval conductivity, temperature, and dissolved oxygen data from deployed WBNERR YSI 6600 data-sondes during 2011 and 2012 (NOAA, 2012). The historic data (red circles) are from D'Avanzo et al. (1996, Figure 1). They include data collected from Childs River Estuary over a year (Jul–Dec 1991, Jan–Jun 1992) in 10 deployments (5–25 days) of automated ENDECO model 1184 meters. The filled bars above zero indicate mean net daytime productivity rates for the sampling time frame (July–October) for the historic 7.18 g O2 m−2 y−1 (red bar), and current 4.36 g O2 m−2 y−1 (blue bar) time frames, respectively. The filled bars below zero indicate mean nighttime respiration rates for historic −7.39 g O2 m−2 y−1 (red bar) and current −4.36 g O2 m−2 y−1 (blue bar) time frames respectively. Differences between current and historic daily rates for both production and respiration during the July-October time frames were significant (ANOVA, p < 0.0001).
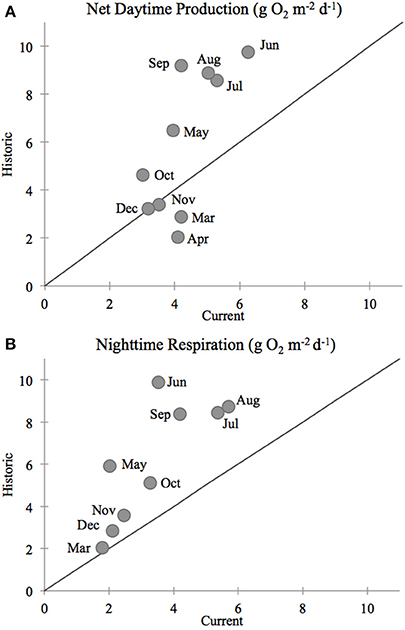
Figure 6. Comparison between Childs River Estuary measurements of (A) daytime net productivity and (B) nighttime respiration rates between the current (2011–2012, this study, WBNERR data) and historic (1991–1992, D'Avanzo et al., 1996) rates. Each data point represents the monthly mean of daily primary production and respiration. The number of days included in those monthly means varies. The number of days included in monthly means was 44 for the current study (2011 and 2012) and 8 for the historic study (1991 and 1992). Monthly averaged daytime production and nighttime respiration values were statistically lower for the current time period compared to the historic (ANOVA p = 0.026 and p = 0.004, production and respiration means, respectively). Line indicates a 1:1 comparison between the current and historic rates.
In Waquoit Bay, macrophytes are the dominant primary producers (Valiela et al., 1992, 1997b) and drive trends in diel dissolved oxygen concentrations (D'Avanzo and Kremer, 1994). In an effort to explain this decreased production and respiration, we compared macroalgae biomass data from the early 1990s (Hersh, 1996) and 2000s (Fox, 2008; Fox et al., 2008) in Waquoit Bay (Table 3). We find that in both the Childs River Estuary and Sage Lot Pond sub-estuaries mean biomass of the dominant macroalgae species (Cladophora vagabunda and Gracilaria tikvahiae) decreased from the early 1990s compared to the early 2000s. And in Sage Lot Pond the biomass of eelgrass, Zostera marina, also decreased. While more extensive analyses including the compilation of all available Waquoit Bay macrophyte survey data and estimates of error would strengthen the validity of this trend, we find this preliminary comparison compelling. Changes in the dominant primary producer and the abundance of this production provide a plausible explanation for decreased benthic sediment oxygen uptake and nitrogen cycling dynamics. Reduced macrophyte biomass would reduce production and respiration for this system and diminish organic matter loading to the sediment. We would expect that decreased organic matter availability would result in lower benthic fluxes as correlations between autochthonous and allocthonous carbon supply and benthic sediment oxygen uptake and nutrient regeneration (Nixon, 1981; Hopkinson and Smith, 2005) as well as with N2 fluxes (Cornwell et al., 1999; Fulweiler et al., 2008, 2013; Eyre et al., 2013) are well established. Further, the findings of decreases in primary production and benthic fluxes mimic those observed in a nearby estuary, Narragansett Bay (further discussion below).
Proposed Mechanisms of Change
The question remains as to what could be driving the observed differences in system productivity and nitrogen cycling between the early 1990s and 2000s? While at this point we cannot assign a single answer to this question we suggest three plausible explanations, and all may be at least partially contributing to the observed changes.
First, dampened fluxes could be caused by high annual variability. High variability in sediment N2 fluxes (−257 to 154 μmol m−2 h−1), directly related to water column chlorophyll a variability, have been observed in a unique 9 year continuous study in Narragansett Bay (Fulweiler and Heiss, 2014). Large seasonal and inter-annual fluctuations of macroalgae and eelgrass biomass have been measured historically in Waquoit Bay (Hersh, 1996; Valiela et al., 1997b; Fox, 2008; Fox et al., 2008) and this variance tends to be more pronounced with higher N loads (Fox, 2008; Fox et al., 2008). It is known that changes in the quantity of organic matter deposited to the benthos will alter decomposition rates and thus rates of nutrient remineralization (Nixon, 1981; Hopkinson and Smith, 2005) and denitrification (Cornwell et al., 1999; Fulweiler et al., 2008, 2013; Eyre et al., 2013). Thus, we could simply be observing the benthic response to year-to-year changes in primary production.
A second explanation could be that dampened benthic fluxes could be the next stage of impacts driven by N pollution and that we are witnessing the birth of “dead zone.” Based on land use data from MassGIS (www.mass.gov) and the Boyer (Boyer et al., 2002) model it is possible that N loading to Waquoit Bay could be currently increasing, albeit more slowly than 50 years ago. Nevertheless, ecosystems may reach a threshold or tipping point in N inputs where beyond a certain point the system is fundamentally altered (Scheffer et al., 2001; Webster and Harris, 2004; Duarte et al., 2009). While, at this point we can only suggest a likely scenario based on the information at hand, we propose the following. Take the Childs River Estuary where we measured the most dramatic changes from historic rates as an example: the high macroalgae production and frequent anoxic conditions over time would result in diminished oxygen availability and high sulfide concentrations causing coupled nitrification-denitrification to cease. In time, these conditions would become toxic to bioturbating organisms, aerobic bacteria, and even the macroalgae that once thrived there. Instead, the community would be replaced by slow growing anaerobic organisms, which result in the dampened fluxes we observe. While this explanation may work for the high N load station it does not explain the concurrent decreases observed in the low N load station (Sage Lot Pond).
Thus, other mechanisms driving either high inter-annual variability and/or significant declines of primary production in this system over the past 20 years must include larger scale phenomena. For example, in nearby Narragansett Bay, similar declines in benthic metabolism and nitrogen cycling were reported (Fulweiler et al., 2007; Fulweiler and Nixon, 2009, 2011). The changes in Narragansett Bay were hypothesized to be driven by increased water temperatures, decreased wind speed, and alterations in the timing and magnitude of the winter-spring phytoplankton bloom (Nixon et al., 2009). Although Waquoit Bay is not a phytoplankton-based ecosystem, it is conceivable that changes in meteorological parameters such as temperature, precipitation, and wind speed are driving the changes we observe in Waquoit Bay as well. Perhaps not surprisingly due to their proximity, many meteorological changes observed in Narragansett Bay are also observed in Waquoit Bay. For example, as in Narragansett Bay surface temperatures in coastal Cape Cod waters have also been increasing over the past 4 decades (Nixon et al., 2004, 2009). Temperature data collected from the Woods Hole Oceanographic Pier shows significant warming from 1970 to 2002 at a rate of 0.04°C per year and an overall mean annual increase of 1.2°C (Nixon et al., 2004). We found that over the past 20 years there has also been a significant increase in total annual rainfall (p = 0.002) and discharge from Quashnet River to Waquoit Bay (p = 0.001) (Figure 7). Finally, decade long wind data from the Waquoit Bay National Estuarine Research Reserve show that while mean annual wind speed from 2002 to 2013 had not significantly changed wind speed between May and October has significantly declined (p = 0.016) over this same time period.
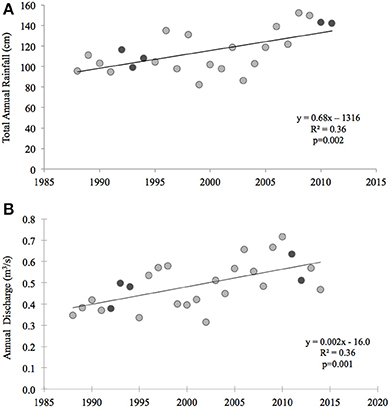
Figure 7. Total annual rainfall and freshwater discharge in the Waquoit Bay watershed. (A) Annual rainfall (centimeters (cm)) was measured from 1988 to 2012 at the Department of Conservation and Recreation's rainfall station (FAL904) in Falmouth, MA (data can be downloaded at http://www.mass.gov/eea/agencies/dcr/water-res-protection/water-data-tracking/rainfall-program.html) (B) Annual freshwater discharge (cubic meters per second (m3/s)) was measured from 1988 to 2015 at the U.S. Geological Survey's Quashnet River station (USGS 011058837) in Waquoit Village, MA (data can be downloaded at http://waterdata.usgs.gov/nwis/dv/?site_no=011058837&agency_cd=USGS&referred_module=sw). Dark gray symbols represent the years of the historic (1992–1994) and current (2011–2012) studies. Equations and the coefficient of determination (R2) for linear models are displayed next to the curves.
Determining how all of these factors combine to ultimately impact benthic fluxes in Waquoit Bay is beyond the scope of this paper, but is the focus of our current and future efforts. Here we can only hypothesize some ways in which these climatic patterns may alter ecosystem function. First, warming temperatures will increase metabolic activity of both autotrophs and heterotrophs (Hopkinson and Smith, 2005; Harris et al., 2006; Anderson et al., 2014). While at first this might lead to an increase in photosynthetic activity ultimately when macroalgae are exposed to temperatures beyond their thermal optimum photosynthesis declines rapidly (Davison, 1991). Additionally, an autotroph's response to increased temperature may vary when combined with changes in other environmental variables. For example, seagrass response to increased temperature is positive under high light conditions but negative under low light conditions (Bulthuis, 1987). The effect of temperature on eelgrass (Zostera marina) in large mesocosm studies was significantly increased under elevated inorganic nutrients and is the proposed mechanism driving major eelgrass declines in the Northeast (Bintz et al., 2003). Of course, primary producers would also be impacted by the observed changes in precipitation, freshwater discharge, and wind speeds of Waquoit Bay. While the data do not exist for the major tributaries of Waquoit Bay it is reasonable to suspect that the increase precipitation and freshwater discharge has also led to an increase in total suspended solids and colored dissolved organic matter which would attenuate light and decrease primary production (Anderson et al., 2014). Finally, decreased wind speeds in May through October (arguably the dominant metabolic period of the year), has likely resulted in decreased vertical mixing and enhanced water column stratification (Nixon et al., 2009). As such, bottom water exchange with the atmosphere would be limited and even though there is evidence of decreased primary production, the lack of water column mixing may increase low oxygen conditions in bottom waters. In turn, this could cause a shift from aerobic to anaerobic respiration, declines in sediment macroafuana abundance and activity, and lower rates of benthic fluxes. Despite not being able to pinpoint the mechanisms driving our observations, the fact that we report similar changes to those found for nearby Narragansett Bay suggests that larger scale climatic patterns are responsible for the decrease in benthic fluxes. Thus, anthropogenic impacts on coastal systems are no longer simply local, instead they are part of the global change that has come to dominate our planet.
Conclusions
Positioned at the interface between land and sea, estuarine systems are influenced by local stressors such as N loading and also larger, regional and climate scale perturbations. Alterations of the physical and chemical nature of ocean systems can have direct and profound impacts on ecological structure and functioning of estuaries (Cloern et al., 2007; Nixon et al., 2009). In the spatial scope of this study we did not find a clear relationship between the load of N and benthic flux rates across the four sampling stations. However by taking a broader perspective and comparing our results to historic values, we find significantly lower rates than those measured two decades ago in Sage Lot Pond and Childs River Estuary. Rates of net ecosystem production and respiration were 39 and 38% lower than historic rates, respectively (p < 0.0001). Sediment O2 uptake and NH+4 flux for both SLP and CRE combined were less than half of historical rates (p = 0.001 and p = 0.023, O2 and NH+4, respectively). Perhaps one of the most important changes observed is the 80% reduction in net N2 efflux rates from sediments (p = 0.012). If this is truly a long-term trend then this represents a substantial loss in the important ecosystem service of reactive N removal. Alternatively, if this is simply year-to-year variability then these findings suggest that the coastal sediment N cycling in general and N2 fluxes in particular are more dynamic than previously realized. And finally, a better understanding of how powerful global-scale forcings (e.g., changes in temperature, precipitation, sea level, light, and wind) interact with local-scale impacts (e.g., changing nutrient loads) to impact whole system functioning is crucial in our prediction of long-term ecological trajectories and for better management strategies for coastal regions.
Conflict of Interest Statement
The authors declare that the research was conducted in the absence of any commercial or financial relationships that could be construed as a potential conflict of interest.
Acknowledgments
This research was supported by a grant to Robinson W. Fulweiler from Woods Hole Sea Grant, by support of Robinson W. Fulweiler from the National Science Foundation Project ICER-1343802, and by the Sloan Foundation in the form of a fellowship to Robinson W. Fulweiler. The Waquoit Bay National Estuarine Research Reserve (WBNERR) System-Wide Monitoring Program (SWMP) water quality data used in this publication is supported by an award from the Estuarine Reserves Division, Office of Ocean and Coastal Resource Management, National Ocean Service, National Oceanic and Atmospheric Administration (NOAA, 2012). We would like to thank the WBNERR personnel, especially C. Weidman and M. K. Fox, who provided us with the boats and facilities to use during our field sampling. We received additional help in the field and lab from E. Heiss (Boston University) and from participants in the Boston University Marine Program: M. K. Rogener, R. Schweiker, A. Banks, D. Forest, S. Andrews, and J. Luthringer. We would also like to thank the following people for their lab analyses: K. Czapla, E. Heiss, and M. K. Rogener. We are grateful to W. Boynton and C. Sperling (Chesapeake Bay Laboratory, University of Maryland Center for Environmental Science) for the use of an automated Excel spreadsheet developed by D. Jasinski for the calculation of ecosystem production and respiration. We would also like to thank J. Sparks for his assistance adjusting the spreadsheet code. Finally, we thank our two reviewers who provided helpful comments and suggestions, which greatly improved our manuscript.
References
Anderson, D. M. (2009). Approaches to monitoring, control and management of harmful algal blooms (HABs). Ocean Coast. Manag. 52, 342–347. doi: 10.1016/j.ocecoaman.2009.04.006
Pubmed Abstract | Pubmed Full Text | CrossRef Full Text | Google Scholar
Anderson, D. M., Glibert, P. M., and Burkholder, J. M. (2002). Harmful algal blooms and eutrophication: nutrient sources, composition, and consequences. Estuaries 25, 704–726. doi: 10.1007/BF02804901
Anderson, I. C., Brush, M. J., Piehler, M. F., Currin, C. A., Stanhope, J. W., Smyth, A. R., et al. (2014). Impacts of climate-related drivers on the benthic nutrient filter in a shallow photic estuary. Estuaries Coasts 37, 46–62. doi: 10.1007/s12237-013-9665-5
Banta, G. T., Giblin, A. E., Hobbie, J. E., and Tucker, J. (1995). Benthic respiration and nitrogen release in Buzzards Bay, Massachusetts. J. Mar. Res. 53, 107–135. doi: 10.1357/0022240953213287
Benson, B. B., and Krause, D. (1984). The concentration and isotopic fractionation of oxygen dissolved in freshwater and seawater in equilibrium with the atmosphere. Limnol. Oceanogr. 29, 620–632. doi: 10.4319/lo.1984.29.3.0620
Bintz, J. C., Nixon, S. W., Buckley, B. A., and Granger, S. L. (2003). Impacts of temperature and nutrients on coastal lagoon plant communities. Estuaries 26, 765–776. doi: 10.1007/BF02711987
Bowen, J. L., and Valiela, I. (2001). The ecological effects of urbanization of coastal watersheds: historical increases in nitrogen loads and eutrophication of Waquoit Bay estuaries. Can. J. Fish. Aquat. Sci. 58, 1489–1500. doi: 10.1139/f01-094
Boyer, E. W., Goodale, C. L., Jaworski, N. A., and Howarth, R. W. (2002). Anthropogenic nitrogen sources and relationships to riverine nitrogen export in the Northeastern USA. Biogeochemistry 57, 137–169. doi: 10.1023/A:1015709302073
Boynton, W. R., and Kemp, W. M. (1985). Nutrient regeneration and oxygen consumption by sediments along an estuarine salinity gradient. Mar. Ecol. Prog. Ser. 23, 45–55. doi: 10.3354/meps023045
Bricker, S. B., Longstaff, B., Dennison, W., Jones, A., Boicourt, K., Wicks, C., et al. (2008). Effects of nutrient enrichment in the nation's estuaries: a decade of change. Harmful Algae 8, 21–32. doi: 10.1016/j.hal.2008.08.028
Bulthuis, D. A. (1987). Effects of temperature on photosynthesis and growth of seagrasses. Aquat. Bot. 27, 27–40. doi: 10.1016/0304-3770(87)90084-2
Caffrey, J. M. (2003). “Production, respiration and net ecosystem metabolism in US estuaries,” in Coastal Monitoring through Partnerships: Proceedings of the Fifth Symposium on the Environmental Monitoring and Assessment Program (EMAP) Pensacola Beach, FL, U.S.A. Vol. 81, eds B. D. Melzian, V. Engle, M. McAlister, and S. S. Sandhu (Netherlands: Springer), 207–219. doi: 10.1007/978-94-017-0299-7_19
Caffrey, J. M. (2004). Factors controlling net ecosystem metabolism in U.S. Estuaries. Estuaries 27, 90–101. doi: 10.1007/BF02803563
Pubmed Abstract | Pubmed Full Text | CrossRef Full Text | Google Scholar
Canfield, D. E., Stewart, F. J., Thamdrup, B., De Brabandere, L., Dalsgaard, T., Delong, E. F., et al. (2010). A cryptic sulfur cycle in oxygen-minimum–zone waters off the Chilean coast. Science 330, 1375–1378. doi: 10.1126/science.1196889
Pubmed Abstract | Pubmed Full Text | CrossRef Full Text | Google Scholar
Caraco, N. F., and Cole, J. J. (1999). Human impact on nitrate export: an analysis using major world rivers. Ambio 28, 167–170.
Cloern, J. E., Jassby, A. D., Thompson, J. K., and Hieb, K. A. (2007). A cold phase of the East Pacific triggers new phytoplankton blooms in San Francisco Bay. Proc. Natl. Acad. Sci. U.S.A. 104, 18561–18565. doi: 10.1073/pnas.0706151104
Pubmed Abstract | Pubmed Full Text | CrossRef Full Text | Google Scholar
Colt, J. E. (1984). Computation of Dissolved Gas Concentrations in Water as Functions of Temperature, Salinity, and Pressure Bethesda, MD: American Fisheries Society Special Publication, 14.
Conley, D. J., Paerl, H. W., Howarth, R. W., Boesch, D. F., Seitzinger, S. P., Havens, K. E., et al. (2009). Controlling eutrophication: nitrogen and phosphorus. Science 323, 1014–1015. doi: 10.1126/science.1167755
Pubmed Abstract | Pubmed Full Text | CrossRef Full Text | Google Scholar
Cornwell, J. C., Kemp, W. M., and Kana, T. M. (1999). Denitrification in coastal ecosystems: methods, environmental controls, and ecosystem level controls, a review. Aquat. Ecol. 33, 41–54. doi: 10.1023/A:1009921414151
Dalsgaard, T., Nielsen, L. P., Brotas, V., Viaroli, P., Underwood, J. C., Nedwell, D. B., et al. (2000). “Sediment characteristics,” in Protocol Handbook for NICE: Nitrogen Cycling in Estuaries: A Project under the EU Research Programme: MARINE Science and Technology (MAST III), ed T. Dalsgaard (Silkeborg: National Environmental Research Institute), 53–54.
D'Avanzo, C., and Kremer, J. N. (1994). Diel oxygen dynamics and anoxic events in an eutrophic estuary of Waquoit Bay, Massachusetts. Estuaries 17, 131–139. doi: 10.2307/1352562
D'Avanzo, C., Kremer, J., and Wainright, S. C. (1996). Ecosystem production and respiration in response to eutrophication in shallow temperate estuaries. Mar. Ecol. Prog. Ser. 141, 263–274. doi: 10.3354/meps141263
Davison, I. R. (1991). Environmental effects on algal photosynthesis: temperature. J. Phycol. 27, 2–8. doi: 10.1111/j.0022-3646.1991.00002.x
Devol, A. H. (1991). Direct measurement of nitrogen gas fluxes from continental shelf sediments. Nature 349, 319–321. doi: 10.1038/349319a0
Diaz, R. J., and Rosenberg, R. (2008). Spreading dead zones and consequences for marine ecosystems. Science 321, 926–929. doi: 10.1126/science.1156401
Pubmed Abstract | Pubmed Full Text | CrossRef Full Text | Google Scholar
Duarte, C. M., Conley, D. J., Carstensen, J., and Sánchez-Camacho, M. (2009). Return to Neverland: shifting baselines affect eutrophication restoration targets. Estuaries Coasts 32, 29–36. doi: 10.1007/s12237-008-9111-2
Eyre, B. D., Rysgaard, S., Dalsgaard, T., and Christensen, P. B. (2002). Comparison of isotope pairing and N2:Ar methods for measuring sediment denitrification - assumptions, modifications, and implications. Estuaries 25, 1077–1087. doi: 10.1007/BF02692205
Eyre, B. D., Santos, I. R., and Maher, D. T. (2013). Seasonal, daily and diel N2 effluxes in permeable carbonate sediments. Biogeosciences 10, 2601–2615. doi: 10.5194/bg-10-2601-2013
Fox, S. E. (2008). Ecological Effects of Nitrogen Loading to Temperate Estuaries: Macrophyte and Consumer Community Structure and Food Web Relationships. Ph.D. thesis, Boston University, Boston, MA.
Fox, S. E., Stieve, E., Valiela, I., Hauxwell, J., and McClelland, J. (2008). Macrophyte abundance in Waquoit Bay: effects of land-derived nitrogen loads on seasonal and multi-year biomass patterns. Estuaries Coasts 31, 532–541. doi: 10.1007/s12237-008-9039-6
Fulweiler, R. W., Brown, S. M., Nixon, S. W., and Jenkins, B. D. (2013). Evidence and a conceptual model for the co-occurrence of nitrogen fixation and denitrification in heterotrophic marine sediments. Mar. Ecol. Prog. Ser. 482, 57–68. doi: 10.3354/meps10240
Fulweiler, R. W., and Heiss, E. M. (2014). A decade of directly measured sediment N. Oceanography 27, 184. doi: 10.5670/oceanog.2014.22
Fulweiler, R. W., and Nixon, S. W. (2009). Responses of benthic–pelagic coupling to climate change in a temperate estuary. Hydrobiologia 629, 147–156. doi: 10.1007/s10750-009-9766-0
Fulweiler, R. W., and Nixon, S. W. (2011). Net sediment N2 fluxes in a southern New England estuary: variations in space and time. Biogeochemistry 111, 111–124. doi: 10.1007/s10533-011-9660-5
Fulweiler, R. W., Nixon, S. W., and Buckley, B. A. (2010). Spatial and temporal variability of benthic oxygen demand and nutrient regeneration in an anthropogenically impacted New England Estuary. Estuaries Coasts 33, 1377–1390. doi: 10.1007/s12237-009-9260-y
Fulweiler, R. W., Nixon, S. W., Buckley, B. A., and Granger, S. L. (2007). Reversal of the net dinitrogen gas flux in coastal marine sediments. Nature 448, 180–182. doi: 10.1038/nature05963
Pubmed Abstract | Pubmed Full Text | CrossRef Full Text | Google Scholar
Fulweiler, R. W., Nixon, S. W., Buckley, B. A., and Granger, S. L. (2008). Net sediment N2 fluxes in a coastal marine system—experimental manipulations and a conceptual model. Ecosystems 11, 1168–1180. doi: 10.1007/s10021-008-9187-3
Galloway, J. N., Dentener, F., Capone, D. G., Boyer, E. W., Howarth, R. W., Seitzinger, S. P., et al. (2004). Nitrogen cycles: past, present, and future. Biogeochemistry 70, 153–226. doi: 10.1007/s10533-004-0370-0
Gardner, W. S., McCarthy, M. J., An, S., and Sobolev, D. (2006). Nitrogen fixation and dissimilatory nitrate reduction to ammonium (DNRA) support nitrogen dynamics in Texas estuaries. Limnol. Oceanogr. 51, 558–568. doi: 10.4319/lo.2006.51.1_part_2.0558
Geyer, W. R. (1997). Influence of wind on dynamics and flushing of shallow estuaries. Estuar. Coast. Shelf Sci. 44, 713–722. doi: 10.1006/ecss.1996.0140
Giblin, A. E., Hopkinson, C. S., and Tucker, J. (1997). Benthic metabolism and nutrient cycling in Boston Harbor, Massachusetts. Estuaries 20, 346–364. doi: 10.2307/1352349
Giblin, A. E., Weston, N. B., Banta, G. T., Tucker, J., and Hopkinson, C. S. (2010). The Effects of salinity on nitrogen losses from an oligohaline estuarine sediment. Estuaries Coasts 33, 1054–1068. doi: 10.1007/s12237-010-9280-7
Gong, Z., and Xie, P. (2001). Impact of eutrophication on biodiversity of the macrozoobenthos community in a Chinese shallow lake. J. Freshw. Ecol. 16, 171–178. doi: 10.1080/02705060.2001.9663802
Groffman, P. M., Altabet, M. A., Bohlke, J. K., Butterbach-Bahl, K., David, M. B., Firestone, M. K., et al. (2006). Methods for measuring denitrification: diverse approaches to a difficult problem. Ecol. Appl. 16, 2091–2122. doi: 10.1890/1051-0761(2006)016[2091:MFMDDA]2.0.CO;2
Pubmed Abstract | Pubmed Full Text | CrossRef Full Text | Google Scholar
Hansen, H. P., and Koroleff, F. (1999). “Determination of nutrients,” in Methods of Seawater Analysis, eds K. Grasshoff, K. Kremling, and M. Ehrhardt (Weinheim: Wiley-VCH Verlag GmbH, D-69469), 159–228.
Harris, L. A., Duarte, C. M., and Nixon, S. W. (2006). Allometric laws and prediction in estuarine and coastal ecology. Estuaries Coasts 29, 340–344. doi: 10.1007/BF02782002
Hauxwell, J., Cebrian, J., and Valiela, I. (2003). Eelgrass Zostera marina loss in temperate estuaries: relationship to land-derived nitrogen loads and effect of light limitation imposed by algae. Mar. Ecol. Prog. Ser. 247, 59–73. doi: 10.3354/meps247059
Heck, K. L. J., Able, K. W., Roman, C. T., and Fahay, M. P. (1995). Composition, abundance, biomass, and production of macrofauna in a New England estuary: comparisons among eelgrass meadows and other nursery habitats. Estuaries 18, 379–389. doi: 10.2307/1352320
Hersh, D. (1996). Abundance and Distribution of Intertidal and Subtidal Macrophytes in Cape Cod: The Role of Nutrient Supply and Other Controls. Ph.D. thesis, Boston University, Boston, MA.
Hopkinson, C. S., and Smith, E. M. (2005). “Estuarine respiration: an overview of benthic, pelagic, and whole system respiration,” in Respiration in Aquatic Ecosystems, eds P. A. del Giorgio and P. J. L. Williams (New York, NY: Oxford University Press), 122–146. doi: 10.1093/acprof:oso/9780198527084.003.0008
Howarth, R. W., Hayn, M., Marino, R. M., Ganju, N., Foreman, K., McGlathery, K., et al. (2014). Metabolism of a nitrogen-enriched coastal marine lagoon during the summertime. Biogeochemistry 118, 1–20. doi: 10.1007/s10533-013-9901-x
Hurlbut, P., D'Avanzo, C., Sethi, D., and Giulfoyle, K. (1994). Effects of algal biomass on benthic nitrogen flux in nutrient-loaded estuaries of Waquoit Bay, Massachusetts. Biol. Bull. 187, 283–284.
Johnson, K. S., and Petty, R. L. (1983). Determination of nitrate and nitrite in seawater by flow injection analysis. Limnol. Oceanogr. 28, 1260–1266. doi: 10.4319/lo.1983.28.6.1260
Kana, T. M., Darkangelo, C., Hunt, M. D., Oldham, J. B., Bennett, G. E., and Cornwell, J. C. (1994). Membrane inlet mass spectrometer for rapid high-precision determination of N2, O2, and Ar in environmental water samples. Anal. Chem. 66, 4166–4170. doi: 10.1021/ac00095a009
Kana, T. M., Sullivan, M. B., Cornwell, J. C., and Groszkowski, K. M. (1998). Denitrification in estuarine sediments determined by membrane inlet mass spectrometry. Limnol. Oceanogr. 43, 334–339. doi: 10.4319/lo.1998.43.2.0334
Kemp, W. M., Boynton, W. R., Adolf, J. E., Boesch, D. F., Boicourt, W. C., Brush, G., et al. (2005). Eutrophication of Chesapeake Bay: historical trends and ecological interactions. Mar. Ecol. Prog. Ser. 303, 1–29. doi: 10.3354/meps303001
Kemp, W. M., Sampou, P., Caffrey, J., Mayer, M., Henriksen, K., and Boynton, W. R. (1990). Ammonium recycling versus denitrification in Chesapeake Bay sediments. Limnol. Oceanogr. 35, 1545–1563. doi: 10.4319/lo.1990.35.7.1545
Kirkpatrick, J., and Foreman, K. (1998). Dissolved inorganic nitrogen flux and mineralization in Waquoit Bay sediments as measured by core incubations. Biol. Bull. 195, 240–241. doi: 10.2307/1542859
LaMontagne, M. G. (1996). Denitrification and the Stoichiometry of Organic Matter Degradation in Temperate Estuarine Sediments: Seasonal Pattern and Significance as a Nitrogen Sink. Ph.D. thesis, Boston University, Boston, MA.
LaMontagne, M. G., Astorga, V., Giblin, A. E., and Valiela, I. (2002). Denitrification and the stoichiometry of nutrient regeneration in Waquoit Bay, Massachusetts. Estuaries 25, 272–281. doi: 10.1007/BF02691314
LaMontagne, M. G., and Valiela, I. (1995). Denitrification measured by a direct N2 flux method in sediments of Waquoit Bay, MA. Biogeochemistry 31, 63–83. doi: 10.1007/BF00000939
Lam, P., Lavik, G., Jensen, M. M., van de Vossenberg, J., Schmid, M., Woebken, D., et al. (2009). Revising the nitrogen cycle in the Peruvian oxygen minimum zone. Proc. Natl. Acad. Sci. U.S.A. 106, 4752–4757. doi: 10.1073/pnas.0812444106
Pubmed Abstract | Pubmed Full Text | CrossRef Full Text | Google Scholar
Li, Y., and Smayda, T. J. (1998). Temporal variability of chlorophyll in Narragansett Bay, 1973–1990. ICES J. Mar. Sci. 55, 661–667. doi: 10.1006/jmsc.1998.0383
Marino, R., and Howarth, R. W. (1993). Atmospheric oxygen exchange in the Hudson River: Dome measurements and comparison with other natural waters. Estuaries 16, 433–445. doi: 10.2307/1352591
McGlathery, K. J. (2001). Macroalgal blooms contribute to the decline of seagrass in nutrient−enriched coastal waters. J. Phycol. 37, 453–456. doi: 10.1046/j.1529-8817.2001.037004453.x
Middelburg, J. J., and Levin, L. A. (2009). Coastal hypoxia and sediment biogeochemistry. Biogeosciences 6, 1273–1293. doi: 10.5194/bg-6-1273-2009
Nixon, S. W. (1981). “Remineralization and nutrient cycling in coastal marine sediments,” in Estuaries and Nutrients, eds B. Nielsen and L. Cronin (Clifton, NJ: Humana Press), 111–138.
Nixon, S. W., Buckley, B. A., Granger, S. L., and Bintz, J. (2001). Responses of very shallow marine ecosystems to nutrient enrichment. Hum. Ecol. Risk Assess. 7, 1457–1481. doi: 10.1080/20018091095131
Pubmed Abstract | Pubmed Full Text | CrossRef Full Text | Google Scholar
Nixon, S. W., and Fulweiler, R. W. (2009). “Nutrient pollution, eutrophication, and the degradation of coastal marine ecosystems,” in Global Loss of Coastal Habitats: Rates, Causes and Consequences, ed C. M. Duarte (Bilbao: Fundacion BBVA), 23–58.
Nixon, S. W., Fulweiler, R. W., Buckley, B. A., Granger, S. L., Nowicki, B. L., and Henry, K. M. (2009). The impact of changing climate on phenology, productivity, and benthic-pelagic coupling in Narragansett Bay. Estuarine Coast. Shelf Sci. 82, 1–18. doi: 10.1016/j.ecss.2008.12.016
Nixon, S. W., Granger, S., Buckley, B. A., Lamont, M., and Rowell, B. (2004). A one hundred and seventeen year coastal water temperature record from Woods Hole, Massachusetts. Estuaries 27, 397–404. doi: 10.1007/BF02803532
Nixon, S. W., Kelly, J. R., Furnas, B. N., Oviatt, C. A., and Hale, S. S. (1980). “Phosphorus regeneration and the metabolism of coastal marine bottom communities,” in Marine Benthic Dynamics, eds K. R. Tenore and B. C. Coull (Columbia, SC: University of South Carolina Press), 219–242.
NOAA. (2012). National Oceanic and Atmospheric Administration, Office of Ocean and Coastal Resource Management, National Estuarine Research Reserve System-wide Monitoring Program. Centralized Data Management Office, Baruch Marine Field Lab, University of South Carolina. Available online at: http://cdmo.baruch.sc.edu/data/citation.cfm
Nowicki, B. L. (1994). The Effect of temperature, oxygen, salinity, and nutrient enrichment on estuarine denitrification rates measured with a modified nitrogen gas flux technique. Estuarine Coast. Shelf Sci. 38, 137–156. doi: 10.1006/ecss.1994.1009
Odum, H. T. (1956). Primary production in flowing waters. Limnol. Oceanogr. 1, 102–117. doi: 10.4319/lo.1956.1.2.0102
Oviatt, C., Doering, P., Nowicki, B. L., Reed, L., Cole, J. J., and Frithsen, J. (1995). An ecosystem level experiment on nutrient limitation in temperate coastal marine enviornments. Mar. Ecol. Prog. Ser. 116, 171–179. doi: 10.3354/meps116171
Oviatt, C., Keller, A., and Reed, L. (2002). Annual primary production in Narragansett Bay with no bay-wide winter–spring phytoplankton bloom. Estuar. Coast. Shelf Sci. 54, 1013–1026. doi: 10.1006/ecss.2001.0872
Rysgaard, S., Christensen, P. B., and Nielsen, L. P. (1995). Seasonal variation in nitrification and denitrification in estuarine sediment colonized by benthic microalgae and bioturbating infauna. Mar. Ecol. Prog. Ser. 126, 111–121. doi: 10.3354/meps126111
Rysgaard, S., Risgaard-Petersen, N., Sloth, N. P., Jensen, K., and Nielsen, L. P. (1994). Oxygen regulation of nitrification and denitrification in sediments. Limnol. Oceanogr. 39, 1643–1652. doi: 10.4319/lo.1994.39.7.1643
Scheffer, M., Carpenter, S., Foley, J. A., Folke, C., and Walker, B. (2001). Catastrophic shifts in ecosystems. Nature 413, 591–596. doi: 10.1038/35098000
Pubmed Abstract | Pubmed Full Text | CrossRef Full Text | Google Scholar
Seitzinger, S., Harrison, J. A., Bohlke, J. K., Bouwman, A. F., Lowrance, R., Peterson, B., et al. (2006). Denitrification across landscapes and waterscapes: a synthesis. Ecol. Appl. 16, 2064–2090. doi: 10.1890/1051-0761(2006)016[2064:DALAWA]2.0.CO;2
Pubmed Abstract | Pubmed Full Text | CrossRef Full Text | Google Scholar
Seitzinger, S., and Kroeze, C. (1998). Global distribution of nitrous oxide production and N inputs in freshwater and coastal marine ecosystems. Glob. Biogeochem. Cycles 12, 93–113. doi: 10.1029/97GB03657
Seitzinger, S. P. (1988). Denitrification in freshwater and coastal marine ecosystems: ecological and geochemical significance. Limnol. Oceanogr. 33, 702–724. doi: 10.4319/lo.1988.33.4_part_2.0702
Seitzinger, S. P., and Giblin, A. E. (1996). Estimating denitrification in North Atlantic continental shelf sediments. Biogeochemistry 35, 235–260. doi: 10.1007/BF02179829
Selman, M., Greenhalgh, S., Diaz, R., and Sugg, Z. (2008). Eutrophication and Hypoxia in Coastal Areas: A Global Assessment of the State of Knowledge. Washington, DC: World Resources Institute Policy Note. Available online at: http://www.wri.org/publication/eutrophication-and-hypoxia-coastal-areas
Smayda, T. J. (1990). “Novel and nuisance phytoplankton blooms in the sea: evidence for a global epidemic,” in Toxic Marine Phytoplankton, eds E. Gramli, B. Sundstrom, L. Edler, and D. M. Anderson (New York, NY: Elsevier), 29–40.
Solorzano, L. (1969). Determination of ammonia in natural waters by the phenolypochlorite method. Limnol. Oceanogr. 14, 799–801. doi: 10.4319/lo.1969.14.5.0799
Pubmed Abstract | Pubmed Full Text | CrossRef Full Text | Google Scholar
Thébault, J., Schraga, T. S., Cloern, J. E., and Dunlavey, E. G. (2008). Primary production and carrying capacity of former salt ponds after reconnection to San Francisco Bay. Wetlands 28, 841–851. doi: 10.1672/07-190.1
Valiela, I., Collins, G., Kremer, J., Lajtha, K., Geist, M., Seely, B., et al. (1997a). Nitrogen loading from coastal watersheds to receiving estuaries: new method and application. Ecol. Appl. 7, 358–380. doi: 10.1890/1051-0761(1997)007[0358:NLFCWT]2.0.CO;2
Valiela, I., Foreman, K., LaMontagne, M. G., Hersh, D., Costa, J., Peckol, P., et al. (1992). Couplings of watersheds and coastal waters: sources and consequences of nutrient enrichment in Waquoit Bay, Massachusetts. Estuaries 15, 443–457. doi: 10.2307/1352389
Valiela, I., Geist, M., McClelland, J., and Tomasky, G. (2000). Nitrogen loading from watersheds to estuaries: verification of the Waquoit Bay nitrogen loading model. Biogeochemistry 49, 277–293. doi: 10.1023/A:1006345024374
Pubmed Abstract | Pubmed Full Text | CrossRef Full Text | Google Scholar
Valiela, I., McClelland, J., Hauxwell, J., Behr, P. J., Hersh, D., and Foreman, K. (1997b). Macroalgal blooms in shallow estuaries: controls and ecophysiological and ecosystem consequences. Limnol. Oceanogr. 42, 1105–1118. doi: 10.4319/lo.1997.42.5_part_2.1105
Vaquer-Sunyer, R., and Duarte, C. M. (2008). Thresholds of hypoxia for marine biodiversity. Proc. Natl. Acad. Sci. U.S.A. 105, 15452–15457. doi: 10.1073/pnas.0803833105
Pubmed Abstract | Pubmed Full Text | CrossRef Full Text | Google Scholar
Vieillard, A. M., and Fulweiler, R. W. (2012). Impacts of long-term fertilization on salt marsh tidal creek benthic nutrient and N2 gas fluxes. Mar. Ecol. Prog. Ser. 471, 11–22. doi: 10.3354/meps10013
Webster, I. T., and Harris, G. P. (2004). Anthropogenic impacts on the ecoystems of coastal lagoons: modelling fundamental biogeochemical processes and management implications. Mar. Freshw. Res. 55, 67–78. doi: 10.1071/MF03068
Keywords: benthic nitrogen cycling, sediment oxygen demand, net denitrification, Waquoit Bay, historic variability, spatial variability
Citation: Foster SQ and Fulweiler RW (2014) Spatial and historic variability of benthic nitrogen cycling in an anthropogenically impacted estuary. Front. Mar. Sci. 1:56. doi: 10.3389/fmars.2014.00056
Received: 17 July 2014; Accepted: 06 October 2014;
Published online: 04 November 2014.
Edited by:
Paulina Martinetto, Consejo Nacional de Investigaciones Científicas y Técnicas-Universidad Nactional de Mar Del Plata, ArgentinaReviewed by:
Isaac R. Santos, Southern Cross University, AustraliaIris C. Anderson, College of William and Mary, USA
Copyright © 2014 Foster and Fulweiler. This is an open-access article distributed under the terms of the Creative Commons Attribution License (CC BY). The use, distribution or reproduction in other forums is permitted, provided the original author(s) or licensor are credited and that the original publication in this journal is cited, in accordance with accepted academic practice. No use, distribution or reproduction is permitted which does not comply with these terms.
*Correspondence: Robinson W. Fulweiler, Department of Earth and Environment, Boston University, 685 Commonwealth Avenue Rm. 130, Boston, MA 02215, USA e-mail: rwf@bu.edu