Revealing the regime of shallow coral reefs at patch scale by continuous spatial modeling
 Antoine Collin
 Philippe Archambault
 Serge Planes2
- 1Nadaoka Laboratory, Department of Mechanical and Environmental Informatics, Tokyo Institute of Technology, Tokyo, Japan
- 2USR 3278 CNRS-EPHE, Centre de Recherches Insulaires et Observatoire de l'Environnement (CRIOBE), Papetoai, French Polynesia
- 3Institut des Sciences de la Mer, Université du Québec à Rimouski, Rimouski, Canada
Reliably translating real-world spatial patterns of ecosystems is critical for understanding processes susceptible to reinforce resilience. However, the great majority of studies in spatial ecology use thematic maps to describe habitats and species in a binary scheme. By discretizing the transitional areas and neglecting the gradual replacement across a given space, the thematic approach may suffer from substantial limitations when interpreting patterns created by many continuous variables. Here, local and regional spectral proxies were used to design and spatially map at very fine scale a continuous index dedicated to one of the most complex seascapes, the coral reefscape. Through a groundbreaking merge of bottom-up and top-down approach, we demonstrate that three to seven-habitat continuous indices can be modeled by nine, six, four, and three spectral proxies, respectively, at 0.5 m spatial resolution using hand- and spaceborne measurements. We map the seven-habitat continuous index, spanning major Indo-Pacific coral reef habitats through the far red-green normalized difference ratio over the entire lagoon of a low (Tetiaroa atoll) and a high volcanic (Moorea) island in French Polynesia with 84 and 82% accuracy, respectively. Further examinations of the two resulting spatial models using a customized histoscape (density function of model values distributed on a concentric strip across the reef crest-coastline distance) show that Tetiaroa exhibits a greater variety of coral reef habitats than Moorea. By designing such easy-to-implement, transferrable spectral proxies of coral reef regime, this study initiates a framework for spatial ecologists tackling coral reef biodiversity, responses to stresses, perturbations and shifts. We discuss the limitations and contributions of our findings toward the study of worldwide coral reef resilience following stochastic environmental change.
Introduction
Elucidating emergent properties of complex adaptive ecosystems composed of interacting ecological patches (i.e., elements of a hierarchy) requires an innovative conceptual, theoretical, and methodological framework (Holling, 2001). An overarching component of this framework is to better understand the non-linear dynamics of the ecological patches across various organizational and spatial scales (Cumming, 2011). Identifying the spatial patterns of these patches is traditionally done by quantifying the surface area occupied by the targeted elements (Gotelli and Colwell, 2001; Rooney et al., 2004; Collin et al., 2008). The ecological patches are thereby spatially referred to as homogeneous discrete patches. Depending on the level of ecological organization studied, patches are composed of either individual organisms or assemblages as well as habitats (Forman, 1995). Classifying populations, communities or habitats into categorical types has traditionally been accepted by ecologists (Turner et al., 2001). Studies so far mainly strive to monitor evolution between alternate spatially-enclosed domains of attraction or regimes (Folke, 2006). Since the advent of digital data acquisition, computation and storage, ecological research has increasingly used images to outline ecological patches separated from each other by sharp boundaries. However, the detection of these boundaries is heavily dependent on the capabilities of sensors and statistical classifiers. In addition, the binary approach underlying these boundaries has sparked off a wide-ranging theoretical debate on the ecological representativeness between real world and digitalized information (Austin, 2002, 2007).
Investigating the spatial patterns of ecological patches in a continuous (or non-thematic) way has received relatively little attention so far. However, it is obvious that a continuous approach is better suited for describing natural pattern-process interactions that are emerging from a range of gradients and resources (Austin, 2007). The continuously ranging approach provides insights into the spatial modeling of species diversity (Harborne et al., 2008; Mellin et al., 2009) and can successfully map the variations in ecological processes by means of appropriate indicators such as the functional index (Borja et al., 2000), the resilience index (Rowlands et al., 2012), and the vegetation index (Tucker, 1979). Moreover, the latter two indices are of high importance in natural resource management as they may reveal or predict high biodiversity areas or hotspots (Myers et al., 2000).
Since the Normalized Difference Vegetation Index (NDVI) was designed by Tucker (1979), it has benefited from self-selection in terrestrial ecology work and come to the forefront of the study of global change in, for instance, shedding light on the increased plant growth in northernmost latitudes (Myneni et al., 1997; Sturm, 2010), and assessing the carbon balance and net primary production of terrestrial ecosystems (Piao et al., 2009; Zhao and Running, 2010). Based on the light interaction with vegetation, absorbing the red wavelengths and reflecting the near-infrared, the NDVI enables tree species, tree phenology and bare ground to be reliably discriminated over a vast range of spatial scales. Even though the use of the NDVI has become a key component for ecologists (Pettorelli et al., 2005), use of the index is strongly confined to terrestrial ecosystems. This is due to the fact that near-infrared wavelengths are substantially absorbed by water, incurring a great reduction in signal return/detection (Smith and Baker, 1981). Marine ecologists inevitably limit their investigation of ecological patch's spectral signatures to wavelengths constrained by the visible spectrum, i.e., 400–700 nm (Hochberg et al., 2003; Collin and Planes, 2012).
An in-depth examination of the water-attenuated gamut near both range boundaries shows that a larger spectral window has the potential of delivering meaningful information from particular ecological patches, hitherto neglected (Pegau et al., 2003; Leon et al., 2012). Specifically, insofar as the attenuation coefficient is moderately high in clear seawaters (Maritorena et al., 1994), the very near-infrared (between 700 and 750 nm) can reveal targets interacting with light at these wavelengths. The interaction can correspond to (1) the overall reflection by the chlorophyll patches (i.e., red-shift effect), or, conversely, (2) the absorption by the chlorophyll photosystem I (while the photosystem II absorbs the red wavelengths, Koning, 1994), or (3) the absorption by the recently discovered chlorophyll f, allowing reef building stromatolites to absorb light around a 706 nm centered peak (Chen et al., 2010). If the interplay of these sparse findings turns out to be fruitful, it would enhance the monitoring of shallow ecosystems, such as coral reefs, which are at the top marine biodiversity hotspots.
Remote surveying of coastal and marine ecosystem patterns at high (~10 m) and very high (~1 m) spatial resolution is increasingly required. The launch of the WorldView-2 (WV2) sensor in 2009 has been an incentive that greatly stimulates this study. This spaceborne sensor has doubled the spectral capabilities (notably a far red waveband) of all very high resolution counterparts whilst furnishing ecological information down to 0.5 m. Based on the WV2 synergistic spectral dataset, the coastal habitats and bathymetry can now be mapped at the submeter scale over ecosystems showing clear waters, typically over coral reefscapes (Collin and Planes, 2011; Collin and Hench, 2012). The shallow seascapes were thereby selected as the study cases by virtue of their current socio-ecological paramountcy. Coral reefscapes are regarded as the beacon seascape given the essential ecological services they provide and the increased number of abiotic and biotic factors threatening them (Emanuel, 2005; Hoegh-Guldberg et al., 2007; Wilkinson, 2008; AMAP Expert Group, 2011). Rapidly monitoring the regime of coral reefscapes across various spatial scales, while using a reliable proxy with little ground-truthing, constitutes an inevitable issue to be addressed in the near future, owing to the accelerating pace of reef loss (De'ath et al., 2012). In this study, the regime of the coral reefscape refers to the set of the habitats that has the same essential structure, function and feedbacks (Walker et al., 2004).
The purpose of this study is to design, validate, and use a continuously ranging spatial model of coral reefscape regime for the first time. Co-evolving with cutting-edge imagery (ground based and remotely sensed), this model, dedicated to an ecologically complex seascape, must be able to (1) concur with comprehensive ground measurements, and (2) reliably map components (i.e., highlight live coral colonies) across various spatial scales while being decreasingly sensitive to various algae taxa, bleached coral and sediment. As a first use, (3) the spatial model is employed to portray the regime akin to two entirely-modeled high (volcano) and low islands (atoll) in French Polynesia, outlining its potential key role in assessing the resilience of shallow coral reefs to global environmental change.
Materials and Methods
Study Site
Indo-Pacific reefs exhibit diversified benthic communities, ranging from the sediment to healthy coral colonies through various genera of macroalgae. This high degree of seascape diversity seemed ideally suited to test and validate a continuous (non-thematic) coral index. The study was conducted around the islands of Tetiaroa (17°0′S, 149°33′W) and Moorea (17°47′S, 149°80′W) in the Archipelago of the Society Islands (French Polynesia) (Figure 1). Tetiaroa, located 53 km North of Tahiti, is a 34 km2 atoll (crown of reef peaking at 3 m), comprising 13 islets (motu) and a 30 m deep lagoon with no reef pass. Benefiting from a relative anthropogenic-related protection due to its ownership history (sacred location of the Tahitian kingship and finally property of the Brando family), Tetiaroa shelters various coral colonies (Porites sp., Synarea sp., Acropora sp., Pavona cactus) with attached lagoon organisms (pink whipray Himanturafai, black tip shark Carcharhinus melanopterus). Contrary to Tetiaroa, Moorea, as a 187 km2 volcanic island, peaked at 1207 m and experiences an increase of demography pressure compounded with runoff disturbances (16,490 inhabitants, 2007 census population). Located 17 km North-West of Tahiti, Moorea is situated at the southeastern end of the Society volcanic chain, displacing to the northwest as the Pacific plate. Given the wide spectrum of habitats and species and the ease of sampling (clear, warm, and shallow waters), both islands fit the requirements for our study.
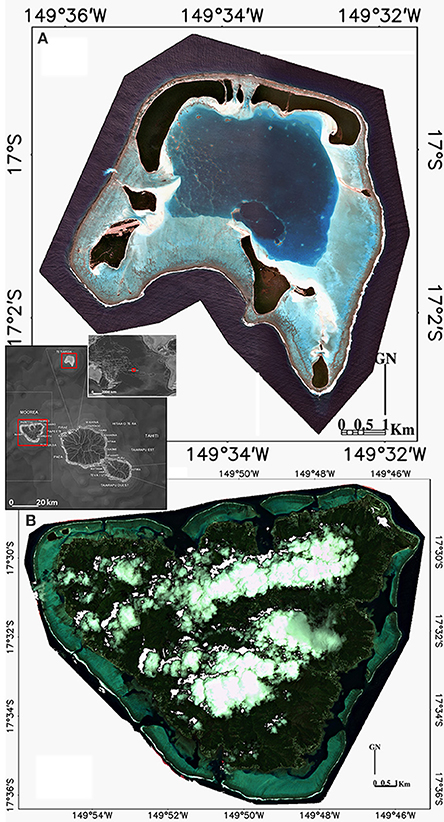
Figure 1. Location and true color composite images (RGB:532) of the two islands composing our study area in the Archipelago of the Society Islands, French Polynesia: (A) Tetiaroa atoll and (B) Moorea volcanic island.
Coral Reef Habitats
A field campaign conducted over the two islands between 21 June 2010 and 16 November 2011, enabled a total of 897 sites to be characterized in respect to their geographic location, water depth and benthic habitats. Supporting the accuracy assessment of the spatial model and bridging the hand- and spaceborne measurements, these sites were classified in eight benthic habitats based on an influential classification scheme (Hochberg et al., 2003) deemed representative of main habitats in global coral reefs (Roff and Mumby, 2012): brown stony coral (Acropora hyancinthus, Acropora pulchra, Pavona cactus, Pocillopora damicornis, Porites sp., Synarearus), blue stony coral (Montipora sp., Porites sp.), bleached stony coral (all previous taxa), brown fleshy algae (Padina boryana, Sargassum pacificum, Turbinaria ornata), red fleshy algae (Actinotrichia fragilis), green fleshy algae (Halimeda opuntia, Cladophora patentiramea), red calcareous algae (Lithotamniae), and calcareous sand. Over every site, a georeferenced 0.5 × 0.5 m quadrat (matching the satellite spatial resolution) allowed the quantification of benthic habitats using a digitally-superimposed 6 × 6 grid. Since the quadrat was recorded using a high-resolution digital RGB camera, each of the 36 grid squares composing the grid were thoroughly examined (2.10−4 m resolution). The habitat dominating the grid composition (>18 sub-quadrats) was considered as being representative of the site. Since all grids were analyzed and classified by the same analyst, we assume that the vision-inherent bias is sufficiently buffered by the 36 sub-quadrats for an acceptable accuracy in quadrat assignment. Benthic habitats not included in our classification scheme (i.e., Echinodermata and Porifera phyla) were recorded when encountered. Further, there was no effect of including them as these habitats did not dominate any quadrat and hence, affect site classification.
In addition to the photograph-derived habitat reconnaissance, the water depth was recorded for each georeferenced site using a 0.1 m accuracy acoustic system. Whilst water depths greater than 1 m were surveyed with an aluminum boat and sea kayak, in Moorea and Tetiaroa, respectively, shallower sites were investigated by foot on and around both islands.
Local Scale Measurements
Targeting a statistical robustness, a total of 2300 spectral signatures collected for the eight coral reef habitats were individually measured between 7 and 22 November 2011 in a coral nursery enclosed in the Moorea Intercontinental Resort. The proximity of the samples to a dry and powered pontoon enabled for a controlled recording, requiring calm conditions and a continuous connection between the portable spectrographic instrument and the software-supplied laptop. Provided with one nm wavelength accuracy (hyperspectral), each spectral measurement was recorded as a reflectance (R) signature (ratio situated between 0 and 1) by virtue of the white correction. Reflectance signatures were then averaged across replicates to provide a mean spectral signature representative of each benthic habitat (Figure 2). The spectral range (spanning 350–750 nm) recorded in this study overcomes the gamut traditionally covered (400–700 nm) by other studies (Hochberg et al., 2003; Leiper et al., 2009). The traditional limitations take the light attenuation in water into account, measured by the attenuation coefficient (Mobley et al., 2002). However, given (1) the magnitude of the coefficient encompassed in the new spectrum (Maritorena et al., 1994), and (2) the ground measured reflectance that remains exploitable (coefficient < 2 m−1 and R < 1, respectively), we point out upfront that the spectral information tied to wavelengths slightly greater (until 750 nm) than the arbitrary upper limit (i.e., 700 nm) has the potential for underpinning the design of the coral reef indices. This assumption may be confirmed by the amount of underwater habitats detectable by remotely-sensed wavelengths of interest.
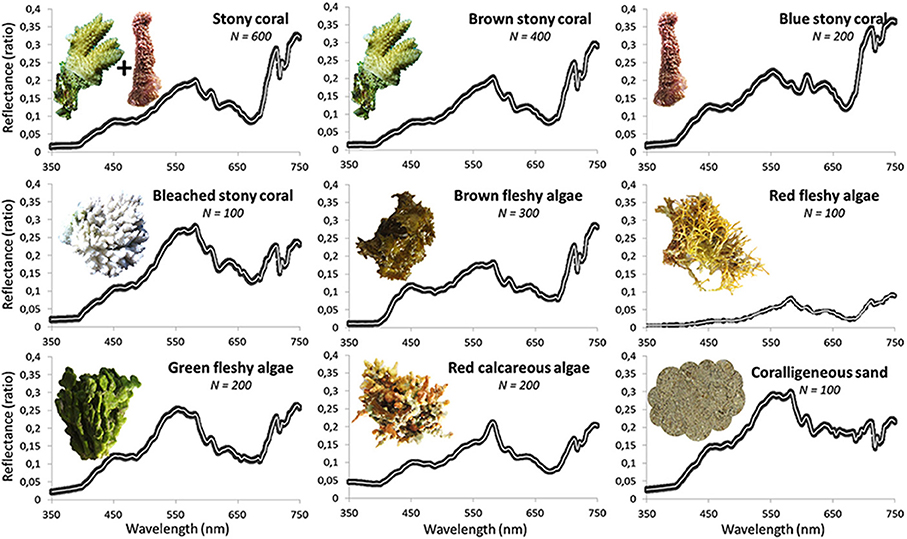
Figure 2. Line plots of mean and standard error reflectances of the eight coral reef habitats across wavelengths (350–750 nm with 1 nm accuracy). The left hand corner line plot, entitled stony coral, synthesizes all reflectance measurements of brown and blue stony coral. The white and gray lines represent the means and the standard errors, respectively.
Measurements of the reflectance hyperspectral signatures akin to the seven targeted habitats consist of the initial step related to the first approach employed in this study. Depicted as bottom-up (see green ring in Figure 3), the approach is dedicated to identify the coral reef indices based on their spectral signatures, further discernable at regional scale by remote sensing.
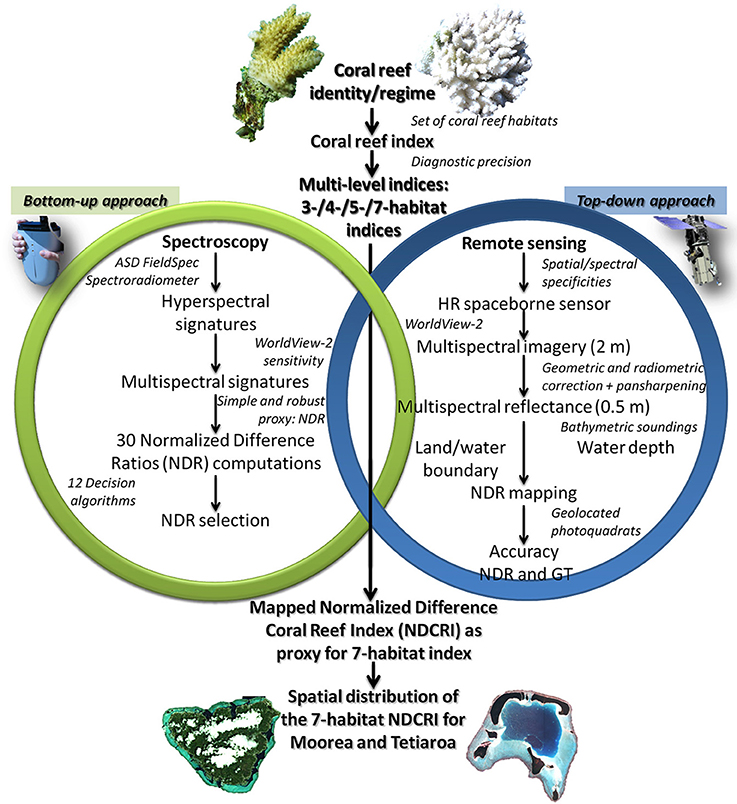
Figure 3. Flowchart of the overarching methodology portraying the necessary steps leading to the spatial model of the Normalized Difference Coral Reef Index (NDCRI). The overlapping zone between the bottom-up (green ring) and the top-down (blue ring) approaches is of great importance and could only be made possible through the ecologically-relevant spectral link.
Regional Scale Measurements
The WV2 is the remote sensor selected for its capabilities of spatial coverage and its high ratio linking the number of spectral optical bands with the spatial resolution. Providing both six optical bands (including the “red edge” band, 705–745 nm) with a 2 m spatial resolution and one overarching band, called panchromatic, with a 0.5 m spatial resolution across a 16.4 km swath, WV2 currently outperforms any space- and airborne sensors for mapping coral reef habitats very finely over regional areas (Collin et al., 2013). The underlying premise of this sensor selection is that coral reef indices will be operational for both space- and airborne sensors fitted with a greater amount of optical bands, irrespective of the decay of their spatial resolution. A total of four WV2 images covering 388 km2 (1.552 billion 0.5 m pixels) were collected over Moorea and Tetiaroa islands on 12 February and 14 October 2010, respectively. WV2 imagery was corrected for geometric distortions and atmospheric attenuation using the MODTRAN-4 algorithm (Matthew et al., 2000), resulting in six water-leaving reflectance matrices for each island (see blue ring in Figure 3 and Collin et al., 2013 for further details). The innovative use of the “red edge” band is encouraged to the extent that the amount of reliable information, empirically measured, is significant up to 2 m deep (Figure 4). The pansharpening method is then applied to scale up the spatial resolution of the six bands (i.e., 2 m) to that of the panchromatic band (i.e., 0.5 m) using a reliable fine-tuning procedure (Collin et al., 2013). Focusing only on benthic habitats (possibly overshadowed by higher signals common to air and terrestrial features), clouds and land were masked out based on the probability density function of the strongly-attenuated eighth band.
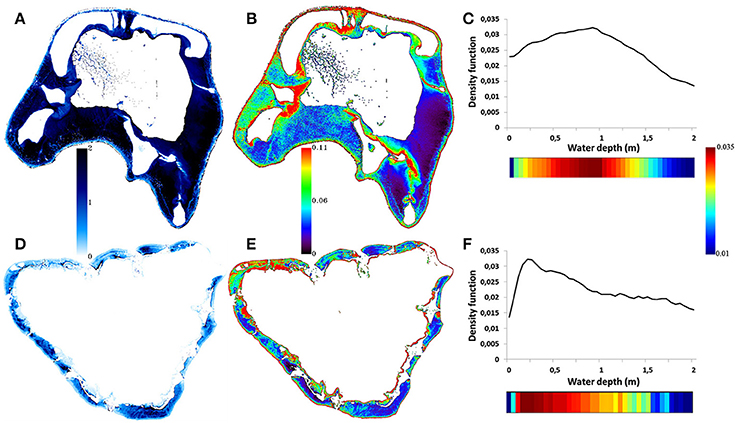
Figure 4. Digital models of the water depth and reflectance of the “red edge” band compounded with the water depth in respect to the density function of the reflectance of the “red edge” band related to Tetiaroa (A–C), and to Moorea (D–F). The water depth is positively correlated with the darkness of the blue gradient (0–2 m). The reflectance of the “red edge” is here represented by a rainbow-scaled gradient (0–0.11). Electro-magnetic radiation akin to the 705–745 nm gamut (i.e., spectral range of the “red edge” band) is reflected from benthos as deep as 2 m, as revealed by the positive values of the density function values in both islands.
Water depth was mapped using the 897 field measurements coupled with the ratio transform (Stumpf et al., 2003) applied to the first and third WV2 bands (“coastal” and green, respectively), selected based on a systematic analysis (Collin and Hench, 2012). Based on the differential attenuation of optical wavelengths by water, the transform “ratios” the natural logarithms of the two bands and furnishes a relative water depth model, suitable for obtaining actual water depths after calibration (Figures 4A,D). Given the increasing loss of benthic information in respect to the water depth, areas deeper than 2 m were masked out, namely 63.48% (32.37 km2) and 88.31% (14.73 km2) of Moorea and Tetiaroa lagoon parts, respectively (Figure 4).
The pre-processing steps leading to the reflectance multispectral images are required to initialize the second approach. Described here as top-down (see blue ring in Figure 3), this approach aims to test the regional scale applicability of the coral reef indices derived from local scale measurements.
Coral Reef Indices
The methodology revolves around the fusion of the bottom-up and top-down approaches. The success of the methodology lies in the bridging of outcomes derived from the two processes(see rings in Figure 3). Based on hyperspectral data, the local scale characterization requires conversion with the spatial tool which will allow interpolation at the regional scale (based on multispectral data). The WV2 spectral sensitivity of the first six bands illustrates the key function of joining the 500-bin hyperspectral measurements to the six-bin multispectral pixel data (Figure 5). Once the conversion is done for each hyperspectral signature, reflectance multispectral signatures are averaged by benthic habitat so that coral reef indices can be designed.
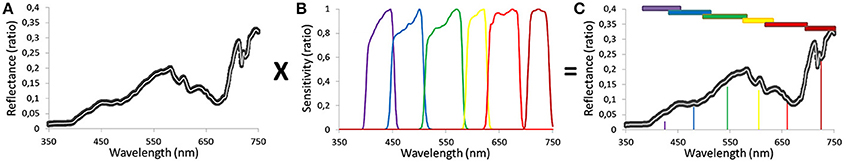
Figure 5. Sequence of line plots describing (A) the local scale measurement of hyperspectral reflectance data along with (B) the spectral sensitivity of the regional scale sensor (WorldView-2) and (C) the product of combining (A,B) to obtain the multispectral reflectance signature, suitable for regional scale spatial modeling.
The core principle of the design consists in establishing indices which allow attribution of the highest values for living coral, medium values for algae, and the lowest values for bleached coral and sediment. Beyond the traditional coral health index aiming at discriminating healthy and unhealthy corals in a dualistic (even simplistic) way, our bespoke indices have the potential to overarch the common Indo-Pacific shallow coral habitats in a rapid, spatially-fine and extensive way. Logical expressions of 12 coral reef indices, based on three, four, five and seven habitats, are built to surrogate four categories of diagnostic precision (Figure 6). Each diagnostic category is subdivided into three coral reef indices accounting for either one coral super habitat or two coral habitats depending on their color, i.e., blue or brown (Hochberg et al., 2003) (see Index name column in Figure 6). For each coral reef index, the logical expressions between habitats are portrayed by strict inequality signs (like thresholds values) except for the three algae habitats for which there is no logical hierarchy (see < or > in Figure 6). Encompassing the three algae habitats, a algae super habitat is created since the far-reaching studies demonstrated the ecological differentiation occurring between general coral- and macroalgae-dominated reefs (Bellwood et al., 2004; Roff and Mumby, 2012).
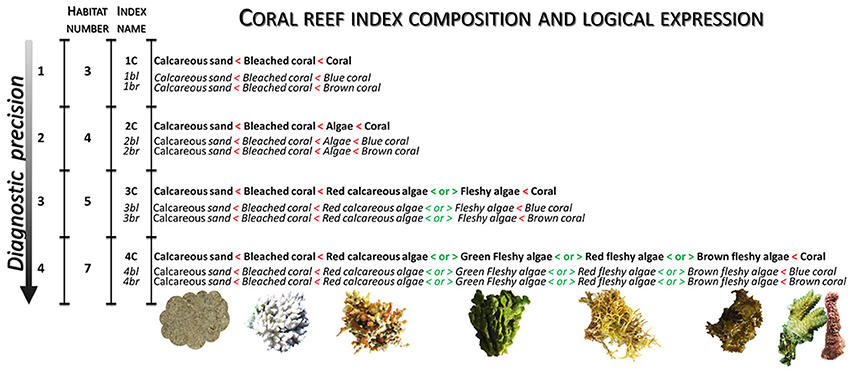
Figure 6. Design of the 12 coral reef indices defined by their habitat composition and logical expressions linking up to the 11 coral reef habitats, index names, number of habitats involved, and level of the diagnostic precision.
Given the substantial scope of the NDVI spectral index in major land-based ecological studies (Myneni et al., 1997; Pettorelli et al., 2005; Piao et al., 2009; Sturm, 2010; Zhao and Running, 2010) and its facilitated use, the coral reef indices will be revealed in the form of spectral Normalized Difference Ratios (NDR), mathematically formulated as follows:
where i, j ∈ {“coastal,” blue, green, yellow, red, “red edge” two-dimensional matrices} and i ≠ j. An exploratory dataset of 30 NDR was computed as a result of the pair combinations of the six optical bands. NDR are named according to the number index of the two bands involved, i.e., “coastal,” blue, green, yellow, red, “red edge” related to 1, 2, 3, 4, 5, 6, respectively. An array of 30 potential NDR by 11 habitats (eight single habitats + three super habitats: coral, algae, fleshy algae) is then subject to the 12 logical expressions (see structure of Table 1). When one logical expression is successfully addressed by a NDR, the matching cell is highlighted in Table 1.
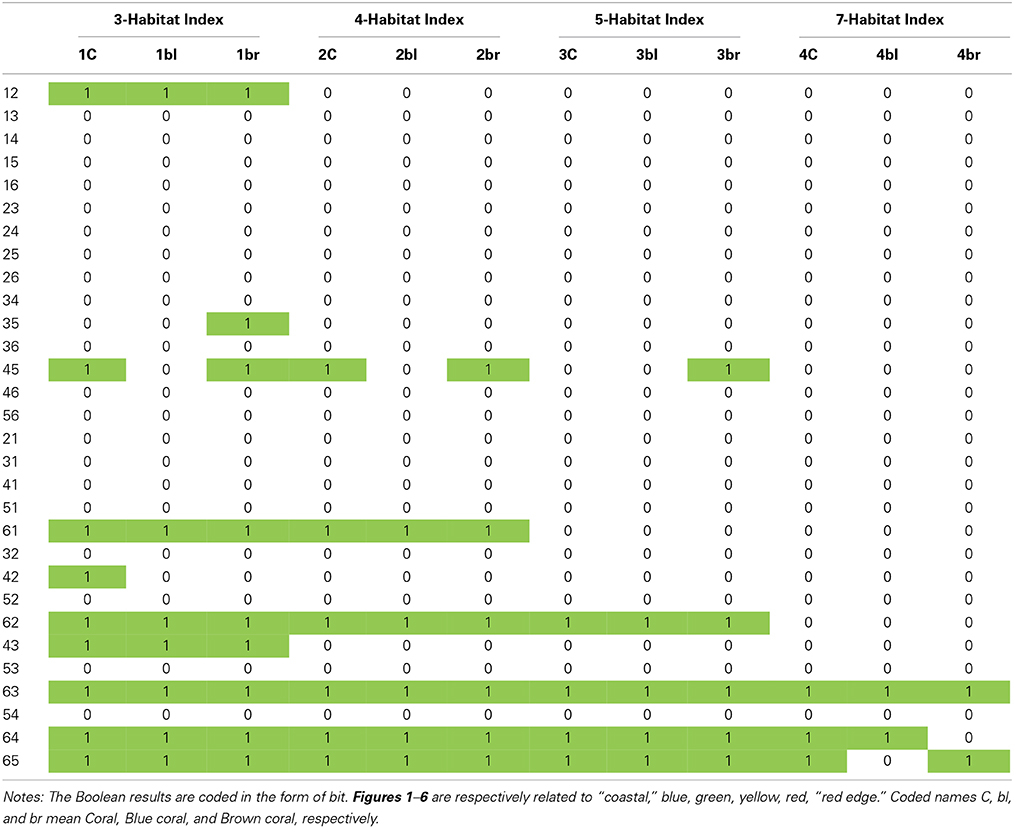
Table 1. Boolean results of the 30 regional scale Normalized Difference Ratio (NDR) successfully responding to logical expressions associated with the 12 different coral reef indices.
Spatial Analysis
The spatial mapping of the retained NDR is realized in applying Equation (1) at each pixel of the two island imageries. Resulting spatial models are then corrected for the water depth using a non-linear least squares fit, called the Gaussfit function (Research Systems 2005), based on a six-termed linear combination of Gaussian and quadratic functions. NDR residual values of the spatial model need only be scaled to the actual NDR values; namely:
in which NDCRI means Normalized Difference Coral Reef Index, X refers to retained NDR, m is a tunable constant to scale the NDR residuals, and A0, A1, A2, A3, A4, and A5 are the unknown parameters of the non-linear depth regression.
The accuracy assessment of the processed spatial models is sourced from the statistical relationships manifesting between the georeferenced measurements and associated pixel values retrieved from the spatial models. Since the models do not need any training data, all 897 measurements are used in the accuracy assessment. Whilst the dataset of measurements appears in the form of classification, the models are made of continuous values, matching the purpose of this study. One way around this dilemma is to convert the continuous model into a discrete one through the data slicing of the model into intervals intrinsic to the outcome of the index design. Boundaries separating intervals result from the mean value between index values of two contiguous habitats. The consistency between the classified measurements and sliced model is appraised in computing the contingency matrix, for each island, summarized by the user's accuracy (UA), the producer's accuracy (PA) and the overall accuracy (OA). OA is the number of correct observations divided by the total number of observations; UA and PA detail errors of commission and omission, respectively (Congalton and Green, 1999). The spatial model associated with the most relevant NDR (highest diagnostic precision and data amplitude) is segmented into the number of classes corresponding to the diagnostic level. Note that the discretization of the spatial model is a necessary method to validate our models, but appears as a temporary result compounded with intrinsic limitations, mentioned in the introduction, that this study searches to overcome.
Once model validation is done, the ecological status of each island is determined using the NDCRI featuring both the highest diagnostic precision and amplitude. A novel quantitative method aiming at reliably and synoptically diagnosing the structure and likely near-future shifts of coral reef regime is designed by outlining the shape of the reef crest surrounding the island and by calculating the distance between coastline and reef crest. The gradient of the distance is then mapped across the island, producing 2640 contour lines ranging from 0 to 1320 m by 0.5 m increments. A probability density function of the NDCRI is then computed for each contour line in the form of histogram. Plotting the 2640 histograms in respect to the distance from the coastline frames a quantitative tool, so-called histoscape, having the potential to help visualize the NDCRI-related basins of habitat and ecological distances between them, within the coral reefscape. Whilst the gradient of data values is tightly linked to the abundance of related coral reef habitats, the horizontal and vertical dimensions of a basin of habitat may be related to its spatial variability and landward sprawl, respectively. The distance between two basins may furthermore be associated with the habitat inertia, i.e., the inverse likelihood of shifting toward the neighbor habitat.
Results
Coral Reef Indices
The nested bottom-up and top-down approaches provide insight into the dataset of NDR successfully responding to the constraints enacted by the logical sequences of designed indices (see Figure 6). The amount of successful NDR decreases with the diagnostic precision (accounting for the 10 successful NDR types across the 12 designed indices): 25 for three-habitat level, 17 for four-habitat level, 13 for five-habitat level, and 7 for seven-habitat level (Table 1). A substantial amount (n = 49 or 79%) of successful NDR include the “red edge” band. Combining the “red edge” band with the “coastal,” blue and green bands satisfactorily respect the requirements related to the three-, four-, and five-habitat levels, respectively, regardless the coral habitat. Although the NDR based on the “red edge” band and the yellow or the red bands adequately translate the indices up to the five-habitat level for all coral habitats, the “red edge”-yellow does not correctly translate the seven-habitat level overarched by the Brown coral. Also, the “red edge”-red does not address the seven-habitat level headed by the Blue coral. The Coral and Brown coral show a greater amount of successful NDR (n = 22) than Blue coral (n = 18).
The 10 successful NDR types are plotted for each of the 12 coral reef indices so that their evolution across and amplitude among habitats can be quantitatively embraced (Figure 7). Corroborating the trend shown in the Table 1, where the “red edge” band plays a key role in pivotal indices, the highest amplitudes (0.17–0.43 range) akin to retained NDR are intricately associated with the “red edge”-included NDR, as the degree of slope visually confirms it (Figure 7). One exception is the NDR combining red and yellow bands (0.1–0.2 range). It is the only NDR built from conventionally-limited visible spectrum (400–700 nm) displaying an amplitude greater than 0.1 (0.12 for 1br, 2br, and 3br in Figure 7). Striving to maximize the ecological information conveyed by the spectral tool, we choose the NDR type (1) able to translate the detailed seven-habitat level index (4C), (2) evidently crossing the zero value, and (3) endowed with the highest amplitude, i.e., “red edge”-green ratio (0.41 for 1C, 2C, 3C, and 4C in Figure 7). This “red edge”-green NDR neatly illustrates the outcome of the bottom-up approach enhanced by the top-down by means of the spectral sensitivity of the regional scale sensor.
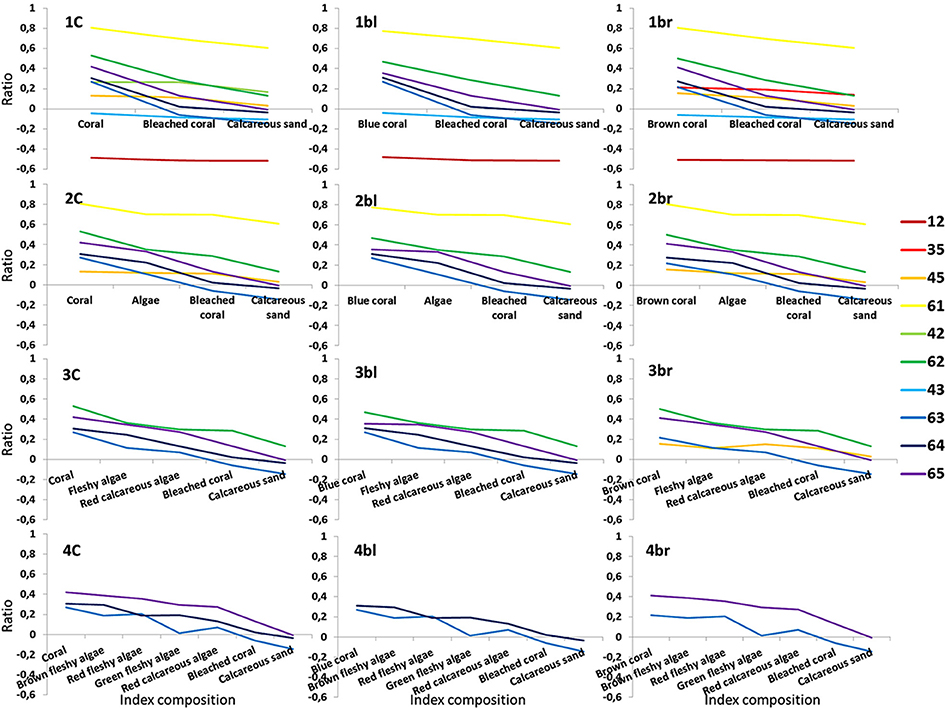
Figure 7. Line plots of the 10 Normalized Difference Ratio (NDR) types in respect to the 12 coral reef indices. Figures 1–6 are respectively related to “coastal,” blue, green, yellow, red, “red edge.” Coded names 1C, 1bl, 1br mean Coral, Blue coral, Brown coral, respectively.
Spatial Modeling of the Coral Reef Index
Supported by the result originating from the bottom-up process, the top-down approach can be achieved in testing the validity of the spatial modeling of the NDCRI based on the most compelling NDR type, i.e., “red edge”-green. The accuracy summarizing the relationships between the seven-habitat field observations and partitioned “red edge”-green NDCRI is assessed using the 340 and 557 georeferenced quadrat-pixels related to Tetiaroa and Moorea, respectively (Table 2). Surpassing 80%, both accuracies are obviously high with a slight advantage to Tetiaroa (83.53 vs. 81.69%). Diagonal cells consistently highlight Coral, Bleached coral and Calcareous sand at the expense of Algae habitats across both islands, indicating correct matching between observed and modeled quadrat-pixels. Conversely, the off diagonal cells reveal that Algae habitats both self-undermine and undermine Coral habitat, and that Bleach coral and Calcareous sand mutually overshadow, attesting misclassified accuracy control points. Measuring how accurately (1) the slicing-based classification performs (rows) and (2) the analyst assigns classes (columns), the UA and PA interestingly demonstrate opposite patterns in respect to the island. UA are, on the one hand, greater than PA concerning Coral and Algae habitats, and on the other hand, lesser than PA regarding Bleached coral and Calcareous sand for Tetiaroa. Also, UA are lesser and greater than PA about the Coral-Algae habitats and the Bleached coral-Calcareous sand clusters, respectively, for Moorea.
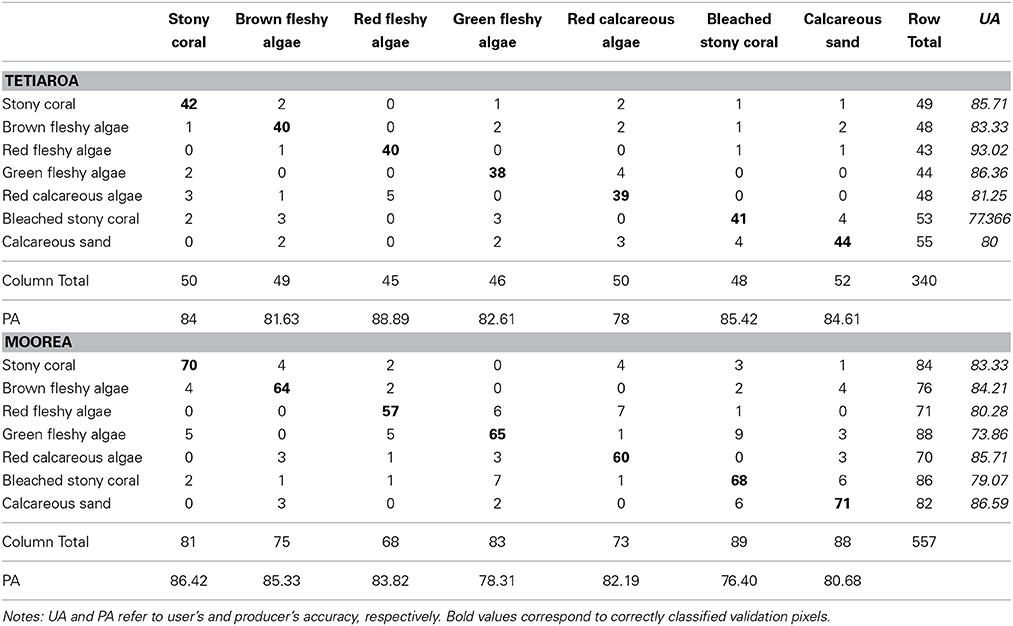
Table 2. Contingency matrices depicting Tetiaroa (n = 340) and Moorea (n = 557) field-observed coral reef habitats vs. their classification based on the seven-habitat slicing of the spatial model built from the Normalized Difference Ratio combining the “red edge” and the green WorldView-2 bands.
The spatial modeling of the NDCRI shows marking similarities as well as dissimilarities in the structural patterns of the islands (Figures 8A,C). Resemblances lie in high values of the NDCRI in the barrier reef, medium values within the reef flat area and low values near the coastlines. Discrepancies emerge from specificities pertaining to each island, such as Tetiaroa eastern plain and lagoon reef network, characterized by low and high values, respectively, and Moorea outer slope of the fringing reef featured by high values. Driven by optimally exploiting the spatial information included in the NDCRI models, we embrace the histoscape derived from a continuous variable spanning the entire study area rather than the traditional thematic classes distributed along discrete transects.
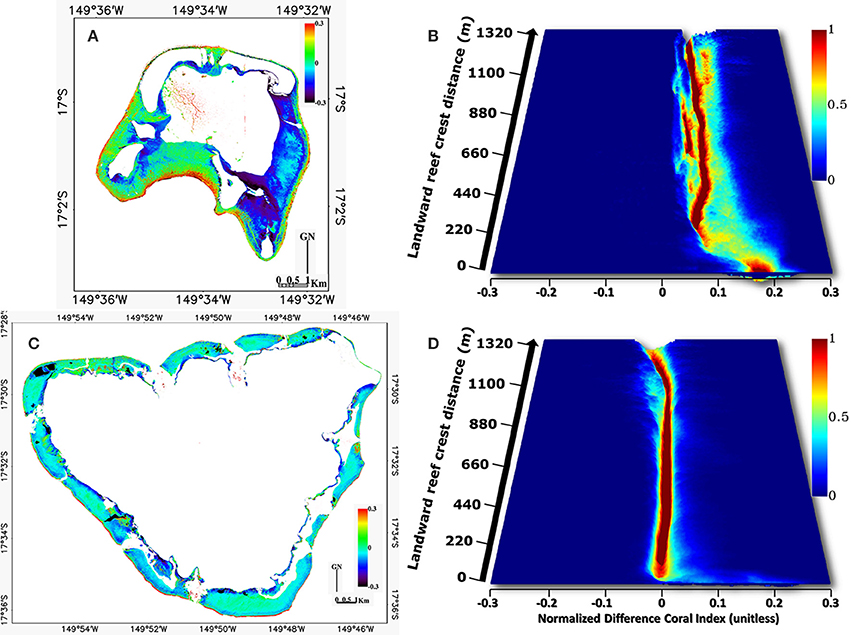
Figure 8. Digital models of the Normalized Difference Coral Reef Index (NDCRI) based on the “red edge” and green satellite spectral bands in (A) Tetiaroa and (C) Moorea with related customized histoscapes (B,D, respectively), plotting the probability density functions of the NDCRI across the reef crest-coastline distance.
Histoscape results exacerbate differences occurring between the two islands (Figures 8B,D). Although the first dozens of meters of the histograms across the reef crest-coastline distance show a predominance of high NDCRI values (x-axis) in the two islands, the gap widens between them for the rest of the gradient. The Tetiaroa zone along the reef crest (close to 0 on the y-axis) is characterized by extensive xyz data values in a Coral-dominated, wide and deep basin within the histoscape. Conversely, Moorea's counterpart exhibits restrained yz dimensions, appearing in the form of a very surficial depression. Medium-high x values are observed leaving Tetiaroa reef crest toward the coastline, being relatively widespread and abundant around 0.05–0.1 x values, characterized by a Coral-mediated stream bed with an Algae-dominated channel and meanders in the histoscape. Otherwise, Moorea's counterpart of the histoscape is defined by low x values, confined to 0 with a marked decline close to the coastline, characterized by a Green fleshy algae-dominated trench ending by Bleached coral and a Calcareous sand basin. Two overall trends unequivocally typify the histoscapes inherent to the atoll and volcanic island: a Coral/Algae-dominated wide stream bed with intertwined channels and a narrow Green fleshy algae-mediated channel, respectively.
Discussion
Synergistically coupling bottom-up and top-down approaches, we find a continuous index discriminating and ranking the main coral reef habitats and we spatially model it across two ecogeomorphologically opposed coral reefscapes. The histoscapes explicitly highlight basins of habitat along the reef crest-coastline distance and show distinctions between the two islands.
Advances and Limitations of the Coral Reef Index
Opting for a continuous spatial model to identify and quantify the structure of complex ecosystems like coral reefs presents substantial advantages compared to thematic models, also called classifications. Tailored to mimic subtle variations in spatial patterns akin to the real world (Austin, 2007), continuous modeling can also suitably document linear and non-linear dynamics (May, 2001; Harborne et al., 2006; Hastings and Wysham, 2010). Conversely, thematic modeling tends to perform well when defining non-linear processes endowed with thresholds around which regime shifts occur (Ives and Dakos, 2012), while aggregating heterogeneous data into an average unit assigned to an overarching class. Specifically, spatial aggregation is very conducive in inducing misclassification when the related surface area encompasses the unit, and the variability is substantial between neighbor or within-aggregate units. Interestingly, an array of coral reef indices positively respond to the designed logical sequences against the diagnostic precision, i.e., the number of habitats involved. Although the amount of successful NDR declines with the precision, their variety shows great promise in addressing a broad list of purposes. In this study, the seven-habitat index is the only index examined in-depth, mostly because of its suitability to our detailed analysis but also for the challenge it represents. Notwithstanding, the proxies for three-, four-, and five-habitat indices have the obvious potential to help stakeholders examine coral bleaching, regime shifts occurring between coral and algae, and between coral and fleshy algae, respectively. A large body of literature seeking to demonstrate the regime shifts intrinsic to coral reefs focuses on the ratio of the abundance of the coral and algae habitats (macroalgae more specifically) (see in Hughes et al., 2010). However, a very recent study shows that the traditional coral-macroalgae ratio may have a low informational value (i.e., poor correlation) in terms of identifying the regime shift, but these limitations may be overcome using a ratio built on coral and fleshy macroalgae (Smith, 2012). Including the habitats commonly tackled in coral reef studies, such as soft coral, seagrass or terrigeneous mud (Hochberg et al., 2003) would allow real world patterns to be better elucidated. Manifesting versatility against purposes, the developed continuous models turn out promising in quantifying the volume of primary coral reef habitats by associating the water depth as the vertical proxy.
Using the spectral tool as a proxy in characterizing the ecological regime of coral reefscapes facilitates the dissemination and promotion of the NDCRI given its ease of implementation and increasing commonness in reef ecologists' toolbox. Doing so ensures that coral reef habitats are reliably detected and discerned over large extents at very high spatial scales, especially when performed in clear oligotrophic waters. Inspired by research dedicated to coastal waters, coral reef scientists employing a spectrally-based methodology do not delve into expanding the conventional 400–700 nm gamut, owing to the quantity of information already provided (Hochberg et al., 2003; Leiper et al., 2009). The thorough examination of the 700–745 nm spectrum (i.e., “red edge”) nevertheless testifies that shallow benthic habitats can be better detected and discerned (see Figures 2, 4B,D). This assessment concurs with the review of light attenuation by pure and oceanic water. It demonstrates that the visible wavelengths span 350–750 nm and the measurements precisely superimpose each other for wavelengths equal to and greater than 500 nm (White et al., 2002, with a special emphasis on their Figure 4). We plotted the measurement of the absorption and penetration of the 350–750 gamut by oligotrophic oceanic water (Smith and Baker, 1981) so that the maximum depth of benthic investigation can be predicted and incorporated into future coral reef studies using spectral proxies (Figure 9). By integrating the spectral capabilities of various satellite sensors (i.e., regional-scale instruments), this figure will aid scientists and managers replicate and scale up the spectral proxies so that multiscale-reliant patterns and processes can be elucidated and enhanced (from any single sub- and tropical island to the Great Barrier Reef). It is crucial to bear in mind that the use of the spectrum beyond 700 nm is restricted to examine shallow coral reefs no deeper than 2 m. The shorter a proxies' wavelengths are, the deeper coral reef habitats will be detected. To know the maximum penetration of a proxy, we recommend referring to the penetration length tied to the mean wavelength of the spectral band with the highest wavelengths. For instance, the NDCRI based upon the “red edge” and the green spectral bands could be provided by the WV2, Hyperion, MERIS, MODIS, and SeaWiFS at 0.5, 10, 260, 1000, and 1100 m up to 0.4 m deep. By contrast the NDCRI based upon the blue and “coastal” spectral bands, liable to discriminate and rank three coral reef habitats (see Table 1), might be derived from all sensors presented in Figure 9 up and to 30 m deep. However, the indicated water depths have to be considered as theoretical thresholds that may over- or under-estimate the actual limits. Even though the theoretical limit of the “red edge” band is near 0.7 m depth (Figure 9), the empirical relationships between the associated reflectance and water depth reveal a limit approximating 1.5 m depth (Figures 4C,F). Theoretical limits are deemed informational insofar as the magnitude of the sun glint and water clarity can be neglected. Integrating these two limitation factors into a decision-support tool will refine outcomes of the Figure 9 in order to optimize the spatial data acquisition and selection.
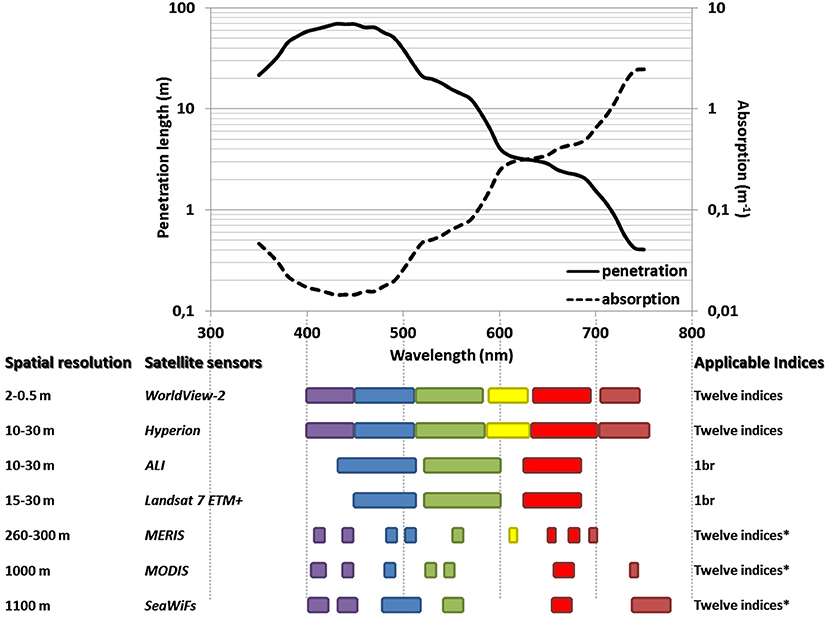
Figure 9. Theoretical limit of water depth detection in regard to the spectral capabilities of the satellite sensors. The seven sensors, including WV2 studied here, are very susceptible to provide meaningful spatial data for coral reefs at various scales (ranging from 0.5 to 1100 m). Based on the spectral windows inherent to each sensor, the name of the coral reef indices liable to be implemented are shown. The coded name 1br means Brown coral.
Continuous Spatial Models
The spatial modeling of ecological indicators has proven to be excessively helpful in achieving conservation purposes during the process of area selection. From planning to outreach, any conservation projects to date are to use maps. The spatially-explicit quantification of ecologically-relevant proxies proposes a visual support that may facilitate understanding to many stakeholders, irrespective of their technical skills. By virtue of its versatility compared to sensors, and its ease to build through any open-source Geographical Information System and/or Remote Sensing software, the NDCRI lends strong support to managers tasking with coral reef sustainability and ecologists delving into understanding coral reef regime shifts. Initiating the latter aspect, we design, deepen and apply the histoscape concept to the Tetiaroa Pacific atoll and Moorea volcanic island. Summarizing the spatial distribution of the NDCRI across the reef crest-coastline distance, histoscapes tied to both islands evidently manifest multiple basins composed of Coral, Brown, Red, and Green algae and a single deep basin of Green algae, for the atoll and the high island, respectively. The differences in the topology (field of study of geometry and set theory) of both histoscapes may be caused by the sediment-, nutrient- and pollutant-laden runoff intrinsic to the populated high island. Specifically, the increased nutrient and pollutant discharge form urban and agricultural development are well known to drastically reduce the water quality required so that coral reef can thrive (Bellwood et al., 2004; Fabricius, 2005). The land-based anthropogenic inductions may thus explain why the fringing part depicted in Moorea's histoscape (1100–1300 m in Figure 8D) reveals lower NDCRI values, corresponding to Red calcareous algae and Bleached coral.
The histoscape tends to exemplify the probability density function of the NDCRI values in respect to the reef crest-coastline distance. The spatial gradient selected results from the decision process aimed at finding patterns that better suit the dynamics of coral reef ecosystems tied to islands (high and low), i.e., a centripetal growth starting from the surrounding reef crest pseudo-circle. Rather than investigating the coral reef area of an island monolithically, the histoscape may be insightful when applied to a set of areas segmented in respect to the spatial ecology. For instance, an East-West partition would be advocated to meet the explicative scale of NDCRI changes in response to the yearly-dominant Eastern winds and driven swell. In addition, to aid in addressing long-term issues, the histoscape may also finely diagnose mid- and short-term variations following anthropogenic and cyclone perturbations.
Implications for Coral Reef Resilience
Even though this study focuses on a single mapping of coral reef regime, precluding any considerations of stressors or temporal analyses, the NDCRI histoscape may bridge the empirical characterization of coral reef ecosystems and some theoretical aspects of the ecological resilience (Holling, 1973). The depth of a histoscape basin is very amenable to correlate with the magnitude of disturbance that a habitat can absorb while conserving its intrinsic topology. Defining the complexity of a geometrical figure, a comprehensive topology would require supplementary parameters such as the length and width of the surface of a basin, which can intuitively be associated with the area of the (1) dominance occupied by a habitat and (2) influence exerted by a habitat toward its neighborhood. The influence of a habitat stops at the edge of the basin (threshold), beyond it another habitat predominates. The depth, length and width of a histoscape basin obviously remind the Resistance and Latitude terms forged with the stability landscape (Walker et al., 2004). Since the histoscape represents the empirical basins of habitat across a spatial gradient, it does not have to be confounded with the stability landscape in which a single ecosystem is a point defined by tridimensional coordinates into a state space diagram constituting of putative basins of attraction (Walker et al., 2004). However, both landscapes can assist in weaving trends of the foreseeable dynamics. The histoscape, as regime or identity landscape, provides the actual habitat (basin) most likely to influence a concentric strip summarizing an evenly-habitated distribution (plain). The stability landscape indicates the position of the ecosystem within its basin of attraction bottomed by the equilibrium state (the attractor), thus influencing the ecosystem's trajectory. As a concise snapshot of the ecosystem's regime, the histoscape is strongly subject to changes due to external forces (e.g., runoff) and internal processes (e.g., coral succession, predator-prey cycles), such as changes in the number and topology of the basins. The decrease in the number of basins may be caused by a basin sprawl (increased surface area of a habitat) to the detriment of neighbors and explained by a linear growth followed by a non-linear phenomenon of coalescence, i.e., process by which two or more basins rapidly merge during contact to form a single daughter basin. In addition to taking the length and width of a basin into account, the topology will incorporate in further studies the overall and inherent structural complexity and diversity, such as the rugosity and the entropy of morphometric features, respectively, since these readily interrelate with the degree of self-organization that an ecosystem and nested habitats can demonstrate. From the glimpse of the dynamical aspect, we point out upfront that Tetiaroa, typified by multiple shallow basins, is more conducive to exhibit ongoing adaptations to perturbations, comparatively to Moorea, characterized by a single deep channel. The parameters retrieved from the histoscape, such as depth, intrinsic topology and the overall complexity and diversity respectively suit with the three components of the definition of resilience commonly admitted (Carpenter et al., 2001): (1) the amount of disturbance that a system can absorb while still remaining within the same identity, (2) the degree to which the system is capable of self-organization, and (3) the degree to which the system can build and increase its capacity for adaptation and learning. Although learning is not explicitly documented here, some studies have revealed that corals that have experienced bleaching episodes may become thermally tolerant through adapted symbionts, suggesting an acclimation rather than genetic adaptation (Hoegh-Guldberg et al., 2002; Rowan, 2004). Importantly, the scale, as critical issues for understanding pattern-process interactions (Levin, 1992; Levin and Lubchenco, 2008), may be partly examined through the histoscape. Offering the possibility to modulate both the spatial (nested basins) and the diagnostic (habitat and super habitat) scale, the histoscape can tangibly investigate the scaling relationships of the NDCRI. The resilience of coral reefs can be acutely augmented in scaling up the organizational level, that is to say in encapsulating the sociological aspect into the system at stake. By networking coral reefs through multiscale marine protected areas and stimulating ecological memory (Nystrom and Folke, 2001) through human incentives, scales of human demands and ecological supplies (Cumming, 2011) will be matched. The implementation of our easy-to-interpret spectral proxies of coral reef regime into decision-making process has the potential to reinforce positive feedback loops essential for growing a resilient coral reefscape coping with inevitable stochasticity.
Conflict of Interest Statement
The authors declare that the research was conducted in the absence of any commercial or financial relationships that could be construed as a potential conflict of interest.
Acknowledgments
This study is part of the CREM (Coral Reefscape Ecology and Mapping) project, funded by the Marie Curie FP7-PEOPLE-2010-RG. The first author gratefully acknowledges the French Agency of Marine Protected Areas and the University of Quebec in Rimouski for the purchase of Moorea's imagery and the use of the handborne spectroradiometer, respectively. Ground-based hyperspectral measurements have been achieved with the CRIOBE's support, which has developed the coral nursery jointly with the Total Foundation for the Biodiversity, Te Mana o te Moana association and Moorea Intercontinental Resort. We are indebted to CRIOBE staff for collecting 897 georeferenced photographs and water depths.
References
AMAP Expert Group. (2011). Climate Change and POPS: Predicting the Impacts, Arctic Monitoring and Assessment Programme. Oslo: Report of the UNEP/AMAP Expert Group.
Austin, M. P. (2002). Spatial prediction of species distribution: an interface between ecological theory and statistical modelling. Ecol. Model. 157, 101–118. doi: 10.1016/S0304-3800(02)00205-3
Austin, M. P. (2007). Species distribution models and ecological theory: a critical assessment and some possible new approaches. Ecol. Modell. 200, 1–19. doi: 10.1016/j.ecolmodel.2006.07.005
Bellwood, D. R., Hughes, T. P., Folke, C., and Nyström, M. (2004). Confronting the coral reef crisis. Nature 429, 827–833. doi: 10.1038/nature02691
Pubmed Abstract | Pubmed Full Text | CrossRef Full Text | Google Scholar
Borja, A., Franco, J., and Pérez, V. (2000). A marine biotic index to establish the ecological quality of soft-bottom benthos within European estuarine and coastal environments. Mar. Pollut. Bull. 40, 1100–1114. doi: 10.1016/S0025-326X(00)00061-8
Carpenter, S. R., Walker, M., Anderies, J. M., and Abel, N. (2001). From metaphor to measurement: resilience of what to what? Ecosystems 4, 765–781. doi: 10.1007/s10021-001-0045-9
Chen, M., Schliep, M., Willows, Z. R., Cai, D.-L., Neilan, B. A., and Scheer, H. (2010). A red-shifted chlorophyll. Science 329, 1318–1319. doi: 10.1126/science.1191127
Pubmed Abstract | Pubmed Full Text | CrossRef Full Text | Google Scholar
Collin, A., Archambault, P., and Planes, S. (2013). Bridging ridge-to-reef patches: seamless classification of the coast using very high resolution satellite. Remote Sens. 5, 3583–3610. doi: 10.3390/rs5073583
Collin, A., and Hench, J. (2012). Towards deeper measurements of tropical reefscape structure using the worldview-2 spaceborne sensor. Remote Sens. 4, 1425–1447. doi: 10.3390/rs4051425
Collin, A., Long, B., and Archambault, P. (2008). Mapping the shallow water seabed habitat with the SHOALS. IEEE Trans. Geosci. Remote Sens. 46, 2947–2955. doi: 10.1109/TGRS.2008.920020
Collin, A., and Planes, S. (2011). “What is the value added of 4 bands within the submetric remote sensing of tropical coastscape? Quickbird-2 vs WorldView-2,” in Proceedings of the 31st IGARSS (Vancouver, BC).
Collin, A., and Planes, S. (2012). Enhancing coral health detection using spectral diversity indices from worldview-2 imagery and machine learners. Remote Sens. 4, 3244–3264. doi: 10.3390/rs4103244
Congalton, R., and Green, K. (1999). “Basic analysis techniques,” in Assessing the Accuracy of Remotely Sensed Data: Principles and Practices, Chapter 5, eds R. Congalton and K. Green (Boca Raton, FL: CRC Press).
Cumming, G. S. (2011). Spatial resilience: integrating landscape ecology, resilience, and sustainability. Landsc. Ecol. 26, 899–909. doi: 10.1007/s10980-011-9623-1
De'ath, G., Fabricius, K. E., Sweatman, H., and Puotinen, M. (2012). The 27-year decline of coral cover on the GreatBarrier Reef and its causes. Proc. Natl. Acad. Sci. U.S.A. 109, 17995–17999. doi: 10.1073/pnas.1208909109
Pubmed Abstract | Pubmed Full Text | CrossRef Full Text | Google Scholar
Emanuel, K. (2005). Increasing destructiveness of tropical cyclones over the past 30-years. Nature 436, 686–688. doi: 10.1038/nature03906
Pubmed Abstract | Pubmed Full Text | CrossRef Full Text | Google Scholar
Fabricius, K. (2005). Effects of terrestrial runoff on the ecology of corals and coral reefs: review and synthesis. Mar. Pollut. Bull. 50, 125–146. doi: 10.1016/j.marpolbul.2004.11.028
Pubmed Abstract | Pubmed Full Text | CrossRef Full Text | Google Scholar
Folke, C. (2006). Resilience: the emergence of aperspective for social-ecological system analyses. Glob. Environ. Change 16, 253–267. doi: 10.1016/j.gloenvcha.2006.04.002
Forman, R. T. T. (1995). Land Mosaics: the Ecology of Landscapes and Regions. Cambridge: Cambridge University Press.
Gotelli, N. J., and Colwell, R. K. (2001). Quantifying biodiversity: procedures and pitfalls in the measurement and comparison of species richness. Ecol. Lett. 4, 379–391. doi: 10.1046/j.1461-0248.2001.00230.x
Harborne, A. R., Mumby, P. J., Kappel, C. V., Dahlgren, C. P., Micheli, F., Holmes, K. E., et al. (2008). Tropical coastal habitats as surrogates of fish community structure, grazing, and fisheries value. Ecol. Appl. 18, 1689–1701. doi: 10.1890/07-0454.1
Pubmed Abstract | Pubmed Full Text | CrossRef Full Text | Google Scholar
Harborne, A. R., Mumby, P. J., Zychaluk, K., Hedley, J. D., and Blackwell, P. G. (2006). Modeling the beta diversity of coral reefs. Ecology 87, 2871–2881. doi: 10.1890/0012-9658(2006)87[2871:MTBDOC]2.0.CO;2
Pubmed Abstract | Pubmed Full Text | CrossRef Full Text | Google Scholar
Hastings, A., and Wysham, D. B. (2010). Regime shifts in ecological systems can occur with no warning. Ecol. Lett. 13, 464–472. doi: 10.1111/j.1461-0248.2010.01439.x
Pubmed Abstract | Pubmed Full Text | CrossRef Full Text | Google Scholar
Hochberg, E. J., Atkinson, M. J., and Andréfouët, S. (2003). Spectral reflectance of coral reef bottom-types worldwide and implications for coral reef remote sensing. Remote Sens. Environ. 85, 159–173. doi: 10.1016/S0034-4257(02)00201-8
Hoegh-Guldberg, O., Jones, R. J., Ward, S., and Loh, W. K. (2002). Communication arising. Is coral bleaching really adaptive? Nature 415, 601–602. doi: 10.1038/415601a
Pubmed Abstract | Pubmed Full Text | CrossRef Full Text | Google Scholar
Hoegh-Guldberg, O., Mumby, P. J., Hooten, A. J., Steneck, R. S., Greenfield, P., Gomez, E., et al. (2007). Coral reefs under rapid climate change and ocean acidification. Science 318, 1737–1742. doi: 10.1126/science.1152509
Pubmed Abstract | Pubmed Full Text | CrossRef Full Text | Google Scholar
Holling, C. S. (1973). Resilience and stability of ecological systems. Annu. Rev. Ecol. Syst. 4, 1–23. doi: 10.1146/annurev.es.04.110173.000245
Holling, C. S. (2001). Understanding the complexity of economic, ecological, and social systems. Ecosystems 4, 390–405. doi: 10.1007/s10021-001-0101-5
Hughes, T. P., Graham, N. A. J., Jackson, J. B. C., Mumby, P. J., and Steneck, R. S. (2010). Rising to the challenge of sustaining coral reef resilience. Trends Ecol. Evol. 25, 633–642. doi: 10.1016/j.tree.2010.07.011
Pubmed Abstract | Pubmed Full Text | CrossRef Full Text | Google Scholar
Ives, A. R., and Dakos, V. (2012). Detecting dynamical changes in nonlinear time series using locally linear state-space models. Ecosphere 3, 58. doi: 10.1890/ES11-00347.1
Koning, R. E. (1994). Light. Plant Physiology Information Website. Available online at: http://plantphys.info/plant_physiology/phytochrome.shtml (Accessed August 11, 2012).
Leiper, I. A., Siebeck, U. E., Marshall, N. J., and Phinn, S. R. (2009). Coral health monitoring: linking coral colour and remote sensing techniques. Can. J. Remote Sens. 35, 276–286. doi: 10.5589/m09-016
Leon, J. X., Phinn, S. R., Hamylton, S., and Saunders, M. I. (2012). Filling the ‘white ribbon’ - a seamless multisource digital elevation/depth model for Lizard Island, northern Great Barrier Reef. Int. J. Remote Sens. 34, 6337–6354. doi: 10.1080/01431161.2013.800659
Levin, S. A. (1992). The problem of pattern and scale in ecology. Ecology 73, 1943–1967. doi: 10.2307/1941447
Levin, S. A., and Lubchenco, J. (2008). Resilience, robustness, and marine ecosystem-based management. Bioscience 58, 1–6. doi: 10.1641/B580107
Maritorena, S., Morel, A., and Gentili, B. (1994). Diffuse reflectance of oceanic shallow waters: influence of water depth and bottom albedo. Limnol. Oceanogr. 39, 1689–1703. doi: 10.4319/lo.1994.39.7.1689
Pubmed Abstract | Pubmed Full Text | CrossRef Full Text | Google Scholar
Matthew, M. W., Adler-Golden, S. M., Berk, A., Richtsmeier, S. C., Levine, R. Y., Bernstein, L. S., et al. (2000). Status of atmospheric correction using a MODTRAN4-based algorithm. SPIE Proc. 4049, 199–207. doi: 10.1117/12.410341
Pubmed Abstract | Pubmed Full Text | CrossRef Full Text | Google Scholar
May, R. M. (2001). Stability and Complexity in Model Ecosystems. Princeton, NJ: Princeton University Press.
Mellin, C., Andréfouët, S., Kulbicki, M., Dalleau, M., and Vigliola, L. (2009). Remote sensing and fish–habitat relationships in coral reef ecosystems: review and pathways for systematic multi-scale hierarchical research. Mar. Pollut. Bull. 58, 11–19. doi: 10.1016/j.marpolbul.2008.10.010
Pubmed Abstract | Pubmed Full Text | CrossRef Full Text | Google Scholar
Mobley, C. D., Sundman, L. K., and Boss, E. (2002). Phase function effects on oceanic light fields. Appl. Opt. 41, 1035–1050. doi: 10.1364/AO.41.001035
Pubmed Abstract | Pubmed Full Text | CrossRef Full Text | Google Scholar
Myers, N., Mittermeier, R. A., Mittermeier, C., Da Fonseca, G. A. B., and Kent, J. (2000). Biodiversity hotspots for conservation priorities. Nature 403, 853–858. doi: 10.1038/35002501
Pubmed Abstract | Pubmed Full Text | CrossRef Full Text | Google Scholar
Myneni, R. B., Keeling, C. D., Tucker, C. J., Asrar, G., and Nemani, R. R. (1997). Increased plant growth in the northern high latitudes from 1981 to 1991. Nature 386, 698–702. doi: 10.1038/386698a0
Nystrom, M., and Folke, C. (2001). Spatial resilience of coral reefs. Ecosystems 4, 406–417 doi: 10.1007/s10021-001-0019-y
Pegau, S., Zaneveld, J. R. V., Mitchell, B. G., Mueller, J. L., Kahru, M., Wieland, J., et al. (2003). Inherent Optical Properties: Instruments, Characterizations, Field Measurements and Data Analysis Protocols. Ocean Optics Protocols for Satellite Ocean Color Sensor Validation. NASA Tech Memo, 211621.
Pettorelli, N., Vik, J. O., Mysterud, A., Gaillard, J.-M., Tucker, C. J., and Stenseth, N. C. (2005). Using the satellite-derived NDVI to assess ecological responses to environmental change. Trends Ecol. Evol. 20, 503–510. doi: 10.1016/j.tree.2005.05.011
Pubmed Abstract | Pubmed Full Text | CrossRef Full Text | Google Scholar
Piao, S., Fang, J., Ciais, P., Peylin, P., Huang, Y., Sitch, S., et al. (2009). The carbon balance of terrestrial ecosystems in China. Nature 458, 1009–1013. doi: 10.1038/nature07944
Pubmed Abstract | Pubmed Full Text | CrossRef Full Text | Google Scholar
Roff, G., and Mumby, P. J. (2012). Global disparity in the resilience of coral reefs. Trends Ecol. Evol. 27, 404–413. doi: 10.1016/j.tree.2012.04.007
Pubmed Abstract | Pubmed Full Text | CrossRef Full Text | Google Scholar
Rooney, T. P., Wiegmann, S. M., Rogers, D. A., and Waller, D. M. (2004). Biotic impoverishment and homogenization in unfragmented forest understory communities. Conserv. Biol. 18, 787–798. doi: 10.1111/j.1523-1739.2004.00515.x
Rowan, R. (2004). Coral bleaching: thermal adaptation in reef coral symbionts. Nature 430, 742. doi: 10.1038/430742a
Pubmed Abstract | Pubmed Full Text | CrossRef Full Text | Google Scholar
Rowlands, G., Purkis, P., Riegl, B., Bruckner, B., and Renaud, P. (2012). Satellite imaging coral reef resilience at regional scale. Mar. Pollut. Bull. 64, 1222–1237. doi: 10.1016/j.marpolbul.2012.03.003
Pubmed Abstract | Pubmed Full Text | CrossRef Full Text | Google Scholar
Smith, J. (2012). “Baselines and degradation of central Pacific benthic reef communities,” in Proceedings of the 12th International Coral Reef Symposium (Cairns, QLD).
Smith, R. C., and Baker, K. S. (1981). Optical properties of the clearest naturalwaters (200-800nm). Appl. Opt. 20, 177–184. doi: 10.1364/AO.20.000177
Pubmed Abstract | Pubmed Full Text | CrossRef Full Text | Google Scholar
Stumpf, R. P., Holderied, K., and Sinclair, M. (2003). Determination of water depth with high-resolution satellite imagery over variable bottom types. Limnol. Oceanogr. 48, 547–556. doi: 10.4319/lo.2003.48.1_part_2.0547
Sturm, M. (2010). Arctic plants feel the heat. Sci. Am. 302, 48–55. doi: 10.1038/scientificamerican0510-66
Pubmed Abstract | Pubmed Full Text | CrossRef Full Text | Google Scholar
Tucker, C. J. (1979). Red and photographic infrared linear combinations for monitoring vegetation. Remote Sens. Environ. 8, 127–150. doi: 10.1016/0034-4257(79)90013-0
Turner, M. G., Gardner, R. H., and O'Neill, R. V. (2001). Landscape Ecology in Theory and Practice. New-York, NY: Springer-Verlage.
Walker, B., Holling, C. S., Carpenter, S. R., and Kinzig, A. (2004). Resilience, adaptability and transformability in social–ecological systems. Ecol. Soc. 9:5. Available online at: http://www.ecologyandsociety.org/vol9/iss2/art5/
White, S. N., Chave, A. D., and Reynolds, G. T. (2002). Investigations of ambient light emission at deep-sea hydrothermal vents. J. Geophys. Res. 107, B1. doi: 10.1029/2000JB000015
Wilkinson, C. (2008). Status of Coral Reefs of the World: 2008. Townsville, QLD: Global Coral Reef Monitoring Network and Reef and Rainforest Research Centre.
Zhao, M., and Running, S. W. (2010). Drought-induced reduction in global terrestrial net primary production from 2000 through 2009. Science 329, 940–943. doi: 10.1126/science.1192666
Pubmed Abstract | Pubmed Full Text | CrossRef Full Text | Google Scholar
Keywords: non-thematic mapping, coral reefs, spectral proxy, reefscape ecology, Moorea, Tetiaroa, French Polynesia, resilience
Citation: Collin A, Archambault P and Planes S (2014) Revealing the regime of shallow coral reefs at patch scale by continuous spatial modeling. Front. Mar. Sci. 1:65. doi: 10.3389/fmars.2014.00065
Received: 13 May 2014; Accepted: 05 November 2014;
Published online: 21 November 2014.
Edited by:
Alberto Basset, University of Salento, ItalyReviewed by:
Simonetta Fraschetti, University of Salento and Consorzio Nazionale Interuniversitario per le Scienze del Mare, ItalyAlberto Basset, University of Salento, Italy
Copyright © 2014 Collin, Archambault and Planes. This is an open-access article distributed under the terms of the Creative Commons Attribution License (CC BY). The use, distribution or reproduction in other forums is permitted, provided the original author(s) or licensor are credited and that the original publication in this journal is cited, in accordance with accepted academic practice. No use, distribution or reproduction is permitted which does not comply with these terms.
*Correspondence: Antoine Collin, Nadaoka Laboratory, Department of Mechanical and Environmental Informatics, Tokyo Institute of Technology, O-okayama 2-12-1-W8-13, Meguro-ku, Tokyo, 152-8552, Japan e-mail: antoinecollin1@gmail.com