Tales from a thousand and one ways to integrate marine ecosystem components when assessing the environmental status
 Angel Borja1*
  Theo C. Prins2
  Nomiki Simboura3
  Jesper H. Andersen4
  Torsten Berg5
  Joao-Carlos Marques6
  Joao M. Neto6
  Nadia Papadopoulou7
  Johnny Reker8
  Heliana Teixeira9
  Laura Uusitalo10
- 1AZTI-Tecnalia, Marine Research Division, Pasaia, Spain
- 2Deltares, Delft, Netherlands
- 3Hellenic Centre for Marine Research, Institute of Oceanography, Anavissos, Greece
- 4NIVA Denmark Water Research, Copenhagen, Denmark
- 5MariLim Aquatic Research GmbH, Schönkirchen, Germany
- 6MARE - Marine and Environmental Sciences Centre, Faculty of Sciences and Technology, University of Coimbra, Coimbra, Portugal
- 7Hellenic Centre for Marine Research, Institute of Marine Biological Resources and Inland Waters, Crete, Greece
- 8European Environment Agency, Copenhagen, Denmark
- 9European Commission, Joint Research Centre, Institute for Environment and Sustainability, Ispra, Italy
- 10Finnish Environment Institute (SYKE), Helsinki, Finland
Assessing the environmental status of marine ecosystems is useful when communicating key messages to policymakers or the society, reducing the complex information of the multiple ecosystem and biodiversity components and their important spatial and temporal variability into manageable units. Taking into account the ecosystem components to be addressed (e.g., biological, chemical, physical), the numerous biodiversity elements to be assessed (e.g., from microbes to sea mammals), the different indicators needed to be studied (e.g., in Europe, 56 indicators of status have been selected), and the different assessment scales to be undertaken (e.g., from local to regional sea scale), some criteria to define spatial scales and some guidance on aggregating and integrating information is needed. We have reviewed, from ecological and management perspectives, the approaches for aggregating and integrating currently available for marine status assessment in Europe and other regions of the world. Advantages and shortcomings of the different alternatives are highlighted. We provide some guidance on the steps toward defining rules for aggregation and integration of information at multiple levels of ecosystem organization, providing recommendations on when using specific rules in the assessment. A main conclusion is that any integration principle used should be ecologically-relevant, transparent and well documented, in order to make it comparable across different geographic regions.
Introduction
The requirement to assess the environmental status of marine waters is growing across continents (Borja et al., 2008). It is also one of the challenging tasks to be accomplished in Europe, within the Marine Strategy Framework Directive (MSFD) (European Commission, 2008). The different legislative mandates to asses status coming from the MSFD, Water Framework Directive (WFD) (2000/60/EC) and Habitats Directive (92/43/EEC) and other international initiatives have produced numerous methodologies that can be applied to different ecosystem components, such as various taxonomic or functional groups, habitats, traits, physical features, or to the whole ecosystem (Birk et al., 2012; Halpern et al., 2012). Despite this wealth of methods, determining environmental status and assessing marine ecosystems health in an integrative way is still one of the grand challenges in marine ecosystems ecology research and management (Borja, 2014).
Different attempts to understand, define and assess ecosystem health have been made in recent years (Costanza and Mageau, 1999; Ulanowicz, 2000; Mee et al., 2008; Ojaveer and Eero, 2011; Borja et al., 2013; Tett et al., 2013). The concept of “good environmental status” (GEnS) integrates physical, chemical and biological aspects, together with the services provided by ecosystems, including a sustainable use of the marine resources by society (Borja, 2014). However, synthesizing these aspects into a single value will never appropriately reflect all aspects considered to derive the value (Purvis and Hector, 2000; Derous et al., 2007). Still, this step is useful when communicating key messages to policymakers or the society, reducing the complex information of the multiple ecosystem components and their important spatial and temporal variability into manageable units, which can be used in ecosystem management. Following the recommendation from Mee et al. (2008), we use the GEnS acronym because the meaning of “environmental,” within the MSFD, and “ecological” (good ecological status), within the WFD, is different (see Borja et al., 2010, for differences between both concepts), implying a different emphasis between these two major pieces of legislation.
In the case of the MSFD, an appropriate integration process might be even more complex, since the assessment of the status is based upon 11 qualitative descriptors (i.e., D1: biological diversity; D2: non-indigenous species; D3: exploited fish and shellfish; D4: food webs; D5: human-induced eutrophication; D6: seafloor integrity; D7: hydrographical condition; D8: contaminants; D9: contaminants in fish and seafood; D10: litter; and D11: energy and noise), which are further divided into 29 criteria and 56 indicators of health (European Commission, 2010). An overview of MSFD descriptors, criteria and indicators is shown in Table 1.
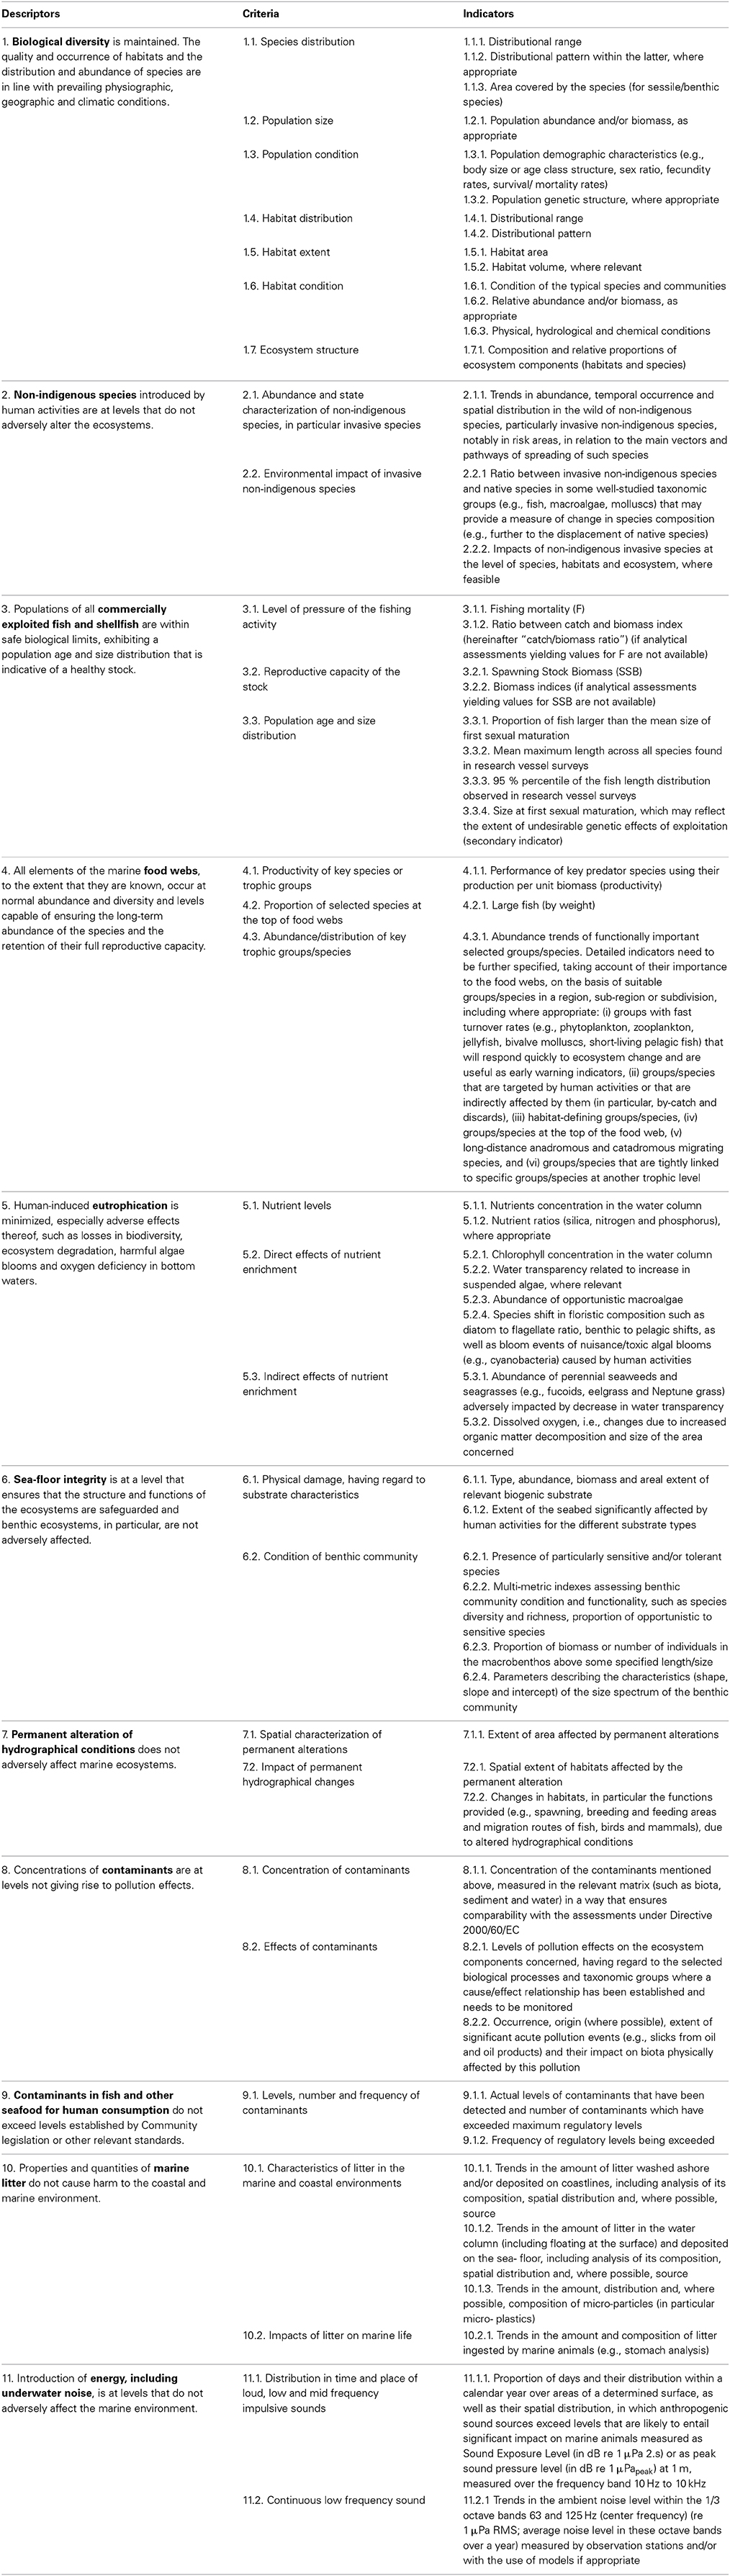
Table 1. Descriptors, criteria and indicators selected by the European Commission (2010), for ecosystem-based assessment and management of European seas, within the Marine Strategy Framework Directive.
The aim of this work is to present an overview of the different methods currently available to synthesize the ecosystem complexity, by aggregating and integrating information when assessing the status, focusing mostly on the descriptors related to biodiversity, namely D1, D2, D4, D6 (Cardoso et al., 2010; Prins et al., 2014). This overview would assist managers, through the guidelines provided, in taking decisions for a better management of the marine ecosystems.
Ecosystem Components Combination Requirements in Assessing the Status
There are different methods that can be applied to combine indicators and criteria within descriptors and across descriptors to eventually result in an assessment of GEnS for a specific geographic area. This combination both involves aggregation and integration. The term aggregation is here used for the combination of comparable elements across temporal and spatial scales, indicators and criteria, within a descriptor. The term integration is used for the combination of different elements (e.g., across descriptors). Both combination methods (aggregation and integration) may involve numeric calculations.
In Europe, the MSFD defines environmental status as “the overall state of the environment in marine waters, taking into account the structure, function, and processes of the constituent marine ecosystems together with natural physiographic, geographic, biological, geological and climatic factors, as well as physical, acoustic and chemical conditions, including those resulting from human activities inside or outside the area concerned.”
Taking this definition into account, Borja et al. (2013) have proposed an operational definition: “GEnS is achieved when physicochemical (including contaminants, litter and noise) and hydrographical conditions are maintained at a level where the structuring components of the ecosystem are present and functioning, enabling the system to be resistant (ability to withstand stress) and resilient (ability to recover after a stressor) to harmful effects of human pressures/activities/impacts, where they maintain and provide the ecosystem services that deliver societal benefits in a sustainable way (i.e., that pressures associated with uses cumulatively do not hinder the ecosystem components in order to retain their natural diversity, productivity and dynamic ecological processes, and where recovery is rapid and sustained if a use ceases).”
This latter definition includes all MSFD descriptors. Hence, to assess whether or not GEnS has been achieved, some aggregation within and integration across the 11 descriptors is required to move from the evaluation at the level of indicators (the 56 indicators and 29 criteria described in the Commission Decision (European Commission, 2010, see also Table 1) to a global assessment of status, as mentioned also in Cardoso et al. (2010). The problem is how to deal with the complex task of combining a high number of indicators and descriptors. To develop a common understanding on this, it is important that Member States are transparent on (i) the process of selecting the indicators to be monitored; (ii) the approaches and combination methods they have used; and (iii) the uncertainties in their indicators and methods.
General Principles for Combination
Based on a literature review, we identified a number of different approaches for combining a number of variables (which could be metrics, indicators, or criteria) into an overall assessment. Some of them have been used within the WFD, others within the RSCs and some others in the MSFD. An overview of the methods is given in Table 2.
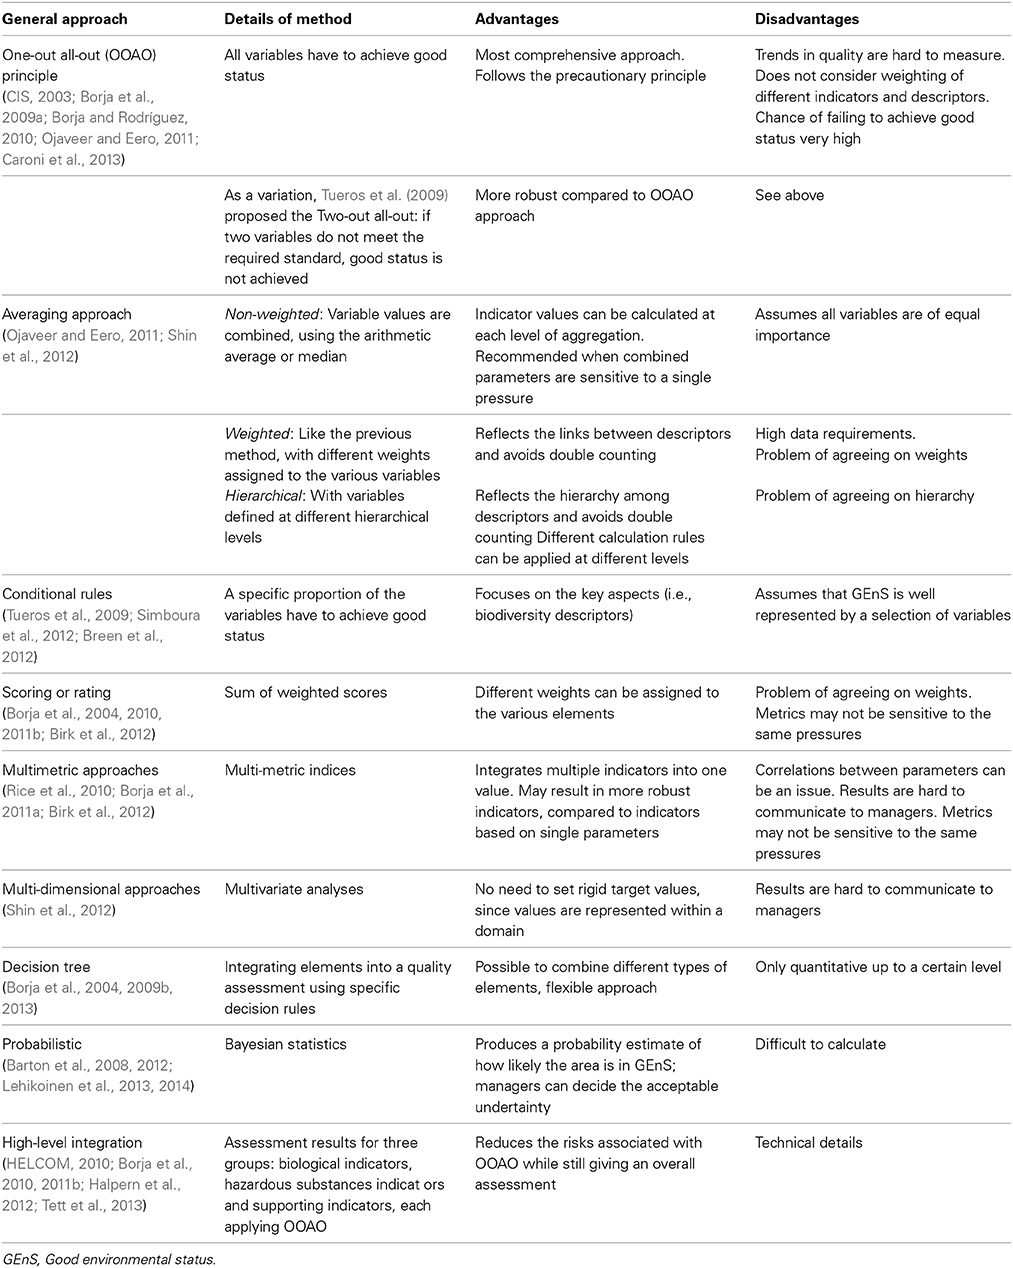
Table 2. Approaches for combining different metrics, indicators or criteria to assess the status, including the advantages and disadvantages of each approach, as considered by the authors.
When considering the aggregation of indicators, an important factor to be taken into account is the reliability of the individual indicators to be aggregated. With each indicator, it is always possible to make a type I error, i.e., to get a non-GEnS result when the system in fact is in GEnS. The probability of this false positive (FP) signal varies (i) between indicators (Murtaugh, 1996), depending on the natural variability; (ii) with the amount of data used to define the indicator value; and (iii) with the target level compared to the situation in the nature. The risk of getting a FP from each of the individual indicators should affect the aggregation rule as well: if the risk of a FP is a uniform 5% per indicator, on average 1 out of 20 indicators is expected to give a FP; a problem if all indicators should in fact show GEnS. In order to come up with an aggregated assessment in which the risk level is within reasonable bounds, this aspect cannot be overlooked.
One-Out, All-Out (OOAO)
The OOAO approach is used in the WFD to integrate within and across Biological Quality Elements (BQEs) (CIS, 2003), in order to reach the ecological status of a water body. This approach follows the general concept that the ecological status assigned to a water body depends on the BQE with the lowest status, and consequently, the OOAO approach results in a “worst case.”
A prerequisite for the aggregation of various indicators is that they are sensitive to the same pressure (Caroni et al., 2013). In such a case, different aggregation methods can be used to combine parameters (medians, means, etc.). Caroni et al. (2013) recommend an OOAO approach when the combination involves parameters/indicators that are sensitive to different pressures. The application of averaging rules may lead to biased results in those cases. The WFD Classification Guidance (CIS, 2003) also advises to use OOAO when combining parameters/indicators that are sensitive to different pressures.
Borja et al. (2009a) discussed the challenge of assessing ecological integrity in marine waters, and suggest that simple approaches, such as the “OOAO” principle of the WFD, may be a useful starting point, but eventually should be avoided. The ecological integrity of an aquatic system should be evaluated using all information available, including as many biological ecosystem elements as is reasonable, and using an ecosystem-based assessment approach. The OOAO rule can be considered a rigorous approach to the precautionary rule, in an ideal world where the status based on each BQE can be measured without error. It results in very conservative assessments (Ojaveer and Eero, 2011). In practice, the inevitable uncertainty associated with monitoring and assessment for each metric and BQE leads to problems of probable underestimation of the true overall status. The OOAO principle has therefore been criticized as it increases the probability of committing a false positive error, leading to an erroneous downgrading of the status of a water body as it has been observed especially within the WFD (Borja and Rodríguez, 2010; Ojaveer and Eero, 2011; Borja et al., 2013; Caroni et al., 2013). In the case of the MSFD, with such large number of descriptors, criteria and indicators, the probability of not achieving good status becomes very high and, probably, unmanageable in practical terms (Borja et al., 2013).
Alternative methods for integrating multiple BQEs in the WFD are currently being considered (Caroni et al., 2013).
Averaging Approach
The averaging approach is the most commonly used method to aggregate indicators (Shin et al., 2012) and consists of simple calculations, using methods such as arithmetic average, hierarchical average, weighted average, median, sum, product or combinations of those rules, to come up with an overall assessment value.
Ojaveer and Eero (2011) showed that in cases where a large number of indicators is available, the choice of e.g., either medians or averages in aggregating indicators did not substantially influence the assessment results. However, this might not necessarily be the case when only a few indicators are available. In such a situation, the result will depend to a larger degree on the distribution of the values involved. A skewed distribution reflecting some major factors and a few ones with very different values will result in very different assessment results for the median compared to assessments based on means. Apart from the mathematical applicability of either method based on the underlying data (e.g., homoscedasticity), the choice of the actual averaging method may be driven by policy decisions focusing on either central trends without much attention to extreme values (median) or focusing on weighting the individual values by their magnitude (arithmetic mean).
The way the indicators are hierarchically arranged influences the assessment results as well, but Ojaveer and Eero (2011) found that these effects were considerably less important than the effects of applying different aggregation rules.
Differential weighting applied to the various indicators can be used when calculating means or medians. An adequate basis for assigning weights is not always available and in such cases an equal weight is recommended by Ojaveer and Eero (2011). Assigning weights often involves expert judgment, and Aubry and Elliott (2006) point out that in some cases, expert opinions on weights can show important divergence.
Conditional Rules
Conditional rules (a specific proportion of the variables have to achieve good status) are an approach where indicators can be combined in different ways for an overall assessment, depending on certain criteria. This provides an opportunity to use expert judgment when combining indicators, in a transparent way. An example of this approach is the application of a conditional rule of at least two out of three indicators (one biotic index and two structural or diversity indices) should pass the threshold in order to achieve GEnS for benthic community condition under D6 in Hellenic waters (Simboura et al., 2012). Tueros et al. (2009) present another example of the conditional rule in which when integrating water and sediment variables into an overall assessment of the chemical status and only one sediment or water variable does not meet the objective, while the rest of the variables meet, the final chemical status achieves the objective. This work was also mentioned under the “two out, all out” approach considering the case when two variables do not meet the objective and the final status fails.
Breen et al. (2012) used several risk criteria rules and worst-case or integrated approaches when combining evidence before a final assessment. Following Cardoso et al. (2010) the integrated approach was applied to Biodiversity, Non-indigenous species, Eutrophication and Seafloor Integrity descriptors, while all other descriptors used a worst case approach following the OOAO principle whereby if one set of evidence suggested that the risk was “high” then “high” was automatically assessed for the entire descriptor.
Scoring or Rating
In this method different scores are assigned to a status level (for example, ranging from 1 to 5), for a number of different elements. The scores are summed up to derive a total score which is then rated according to the number of elements taken into account. Different weights can be assigned to the various elements. This method was proposed by Borja et al. (2004) to calculate an integrative index of quality and is the basis of many multimetric indices used within the WFD and the MSFD combining different parameters or metrics using the weighted scoring or rating rule into one integrative multimetric index (Birk et al., 2012). It must be recognized here that this approach implies the score values being on a cardinal scale and acting as weighting factors. Otherwise, using an ordinal scale for the scores, summing up the individual elements is mathematically not defined.
Another example is the method developed by Borja et al. (2010, 2011b) for a cross-descriptor integration, combining the 11 descriptors of MSFD based on the WFD, HELCOM (2009a,b, 2010) and OSPAR (2010, 2012) experiences. An Ecological Quality Ratio (EQR) was calculated for each indicator of the various MSFD descriptors, with the EQR for the whole descriptor being the average value of the EQR of the indicators. Then, by multiplying the EQR with the percent weight assigned to each descriptor (and summing up to 100), an overall environmental status value was derived.
Multimetric Indices to Combine Indicators
Within the WFD there are many examples of multimetric indices developed for different biological elements, driven by the need to fulfill the detailed requirements of the WFD (see Birk et al., 2012 for a complete synthesis).
In addition, within the MSFD, the European Commission established a number of Task Groups consisting of technical experts to help inform the discussions on how to reach a common understanding of the 11 descriptors. Hence, Task Group 6 report on seafloor integrity (Rice et al., 2010) recommends the use of multimetric indices or multivariate techniques for integrating indicators of species composition attributes of this descriptor, such as diversity, distinctness, complementarity/(dis)similarity, or species-area relationships.
There are various other examples of multi-metric indices used to assess the status of the macrobenthos (see Borja et al., 2011a for an overview). Multimetric methods to combine multiple parameters in one assessment may result in more robust indicators, compared to indicators based on single parameters. However, scaling of a multimetric index may be less straightforward, and ideally the various parameters should not be inter-correlated (e.g., the discussion on the TRIX index in Primpas and Karydis, 2011).
Multidimensional Approaches
Multivariate methods, such as Discriminant Analysis or Factor Analysis combine parameters in a multi-dimensional space. For assessment purposes, areas need to be classified into groups of GEnS and non-GEnS.
Multivariate methods have the advantage of being more robust and less sensitive to correlation between indicators. However, interpretation is less intuitive than other methods, as information on individual indicators in each ecosystem is lost (Shin et al., 2012) and links to management options are less obvious.
Decision Tree
Decision trees provide the opportunity to apply different, specific, rules to combine individual assessments into an overall assessment. A decision tree allows implementing individual rules at each of its nodes and thus incorporates arbitrary decisions at each step within the decision tree. The decision rules can be quantitative or qualitative as well as based on expert judgment. This gives room for a high degree of flexibility in reaching the final assessment and can thus be used where the other principles fail to represent the intricate interactions, feedback loops and dependencies involved in ecosystem functioning between the ecosystem components.
A simple version of a decision tree involves only having a few conditional rules where a specific proportion or certain individually specified indicators have to achieve good status in order to achieve GEnS. Borja et al. (2013) implicitly propose using this kind of decision tree when they take the view that for biodiversity (D1) to be in good status, all other descriptors must be in good status and if one of the pressure descriptors fails, then D1 also fails.
Borja et al. (2004, 2009b) describe a methodology that integrates several biological elements (phytoplankton, benthos, algae, phanerogams, and fishes), together with physicochemical elements (including pollutants) into a quality assessment. The proposed methodologies accommodate both WFD and the MSFD. They suggest that the decision tree should give more weight to individual elements taking into account the spatial and temporal variability and the availability of accurate methodologies for some of them (i.e., benthos) and to individual assessment methods which have been used broadly by authors other than the proposers of the method, tested for several different human pressures, and/or intercalibrated with other methods.
Probabilistic Approach
Each of the indicator results are uncertain, due to several factors e.g., natural variation in the sampling sites, random variation in the samples, insufficient scientific understanding about what should be the reference value for good status, etc. Some indicators are bound to include more uncertainty that others, due to differences in the amount of data used, the extent of scientific understanding regarding the issue, and the amplitude of natural variation. If these uncertainties can be approximated, this gives rise to the possibility of taking this information into account when integrating the indicators. The more uncertain indicators will get less weight in the integrated assessment, while the more certain ones will be more reliable and hence get more weight. The calculus of the integrated assessment can be based on Bayesian statistics, giving transparent and coherent rules by which the final score is calculated.
This approach can be combined to one or several of the above-mentioned approaches: for example, conditional rules can be set in addition to the probabilistic integration rule to include expert judgment; and the principles outlined in the decision tree approach can be applied as well.
Barton et al. (2012) demonstrate how to use the probabilistic approach in the DPSIR framework in the case of eutrophication management. There are several other examples in the recent literature about how to evaluate various management measures under uncertainty to optimize one target, such as eutrophication (Barton et al., 2008; Lehikoinen et al., 2014) and oil spill severity (Lehikoinen et al., 2013). This approach could be expanded to include several descriptors or indicators.
Probabilistic combination of uncertain indicators would naturally lead to a probability estimate of how likely it is that a marine area is in GEnS; we would, for example, end up with an estimate that the sea area is in GEnS with 70% probability. The managers would then have to decide how much uncertainty they are willing to tolerate; i.e., are they happy if the probability of GEnS is above 50%, or whether they want a higher certainty?
High-Level Integration
An example of a high-level integration, where assessments for several ecosystem components are merged into a final assessment, is the HELCOM-HOLAS project (HELCOM, 2010). The report presents an indicator-based assessment tool termed HOLAS (“Holistic Assessment of Ecosystem Health Status”). The indicators used in the thematic assessments for eutrophication (HEAT), hazardous substances (CHASE) and biodiversity (BEAT) were integrated into a Holistic Assessment of “ecosystem health.” The HOLAS tool presented assessment results for three groups: biological indicators, hazardous substances indicators and supporting indicators, and then applied the OOAO principle on the assessment results of those three groups for the final assessment (Figure 1).
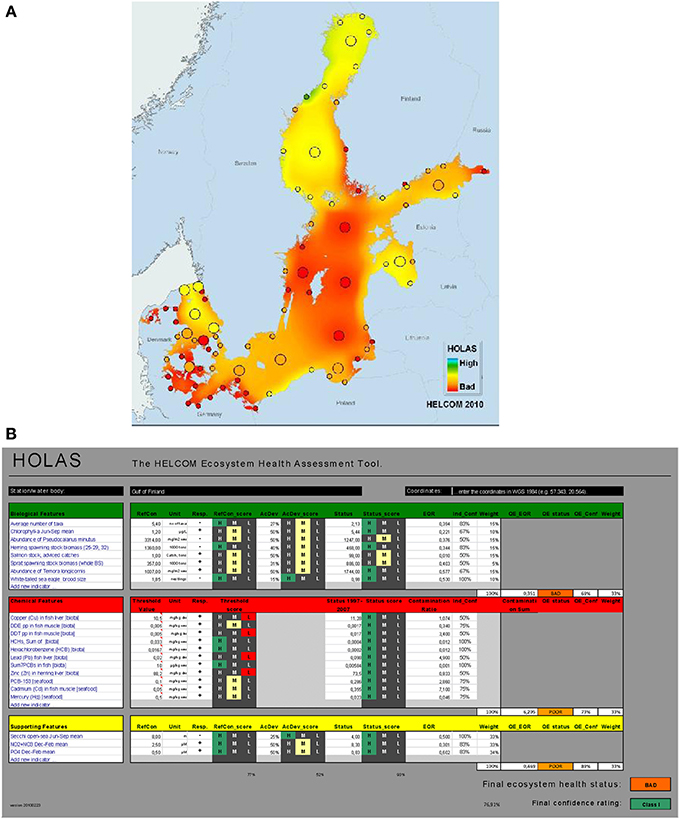
Figure 1. (A) Example of an integrated assessment of ecosystem health in the Baltic Sea 2003–2007 based on the HOLAS tool. (B) Screenshot to illustrate how the HOLAS classification tool for the Gulf of Finland works. See HELCOM (2010) for details. Courtesy by Helsinki Commission.
This approach, which includes the selection of an agreed reduced set of indicators and agreed weighting rules, could be considered a pragmatic compromise, reducing the risks associated with OOAO while still giving an overall assessment.
An example of such a high level aggregation is the integrative method of Borja et al. (2010, 2011b), which includes a weighted scoring or rating method proposed for the MSFD in the southern Bay of Biscay. After aggregating the indicators within each descriptor, each descriptor was weighted according to the human pressure supported by the area. Then the value of each descriptor (i.e., an EQR) was multiplied by the weighting and added to obtain a final value between 0 and 1, being 0 the worst environmental status and 1 the best. This high-level integration was done at spatial and temporal scale. Although these authors combine values across descriptors, leading to a single value of environmental status, it could also be reported as “x out of 11 descriptors” having reached GEnS. In both cases, this allows to take management measures on those human activities impacting more in some of the descriptors or indicators not achieving good status, as shown in Borja et al. (2011b).
Halpern et al. (2012) developed another method, based more upon human activities and pressures, which presents a high-level integration at country level, using internationally available datasets (Ocean Health Index http://www.oceanhealthindex.org). Similarly, Micheli et al. (2013) looked at cumulative impacts to the marine ecosystems of the Mediterranean and the Black Sea as a whole, while producing impact scores and maps for seven ecoregions and the territorial waters of EU Member states.
A Baltic Sea Health Index (BSHI) will be developed based on: (i) the existing HELCOM toolbox (HEAT, BEAT, CHASE and HOLAS), the MSFD (European Commission, 2008, 2010), and (ii) the Ocean Health Index (Halpern et al., 2012).
Finally, there is a recent high-level integration example in Tett et al. (2013), for the North Sea, which includes five steps in the calculation: (i) identify (spatial extent) of ecosystem; (ii) identify spatial granularity and extent of repetitive temporal variability, and decide how to average or integrate over these; (iii) select state variables; (iv) plot trajectory in state space and calculate Euclidian (scalar) distance from (arbitrary) reference condition; and (v) calculate medium-term variability about trend in state space, and use this variability as proxy for (inverse) resilience.
Considerations and Recommendations when Using Specific Rules
As shown in the previous section, the considerations to be used in combining values and assessing the environmental status are not easily defined. From the lessons learned above, some guidance can be offered:
(1) OOAO is appropriate when:
• Legal criteria are involved, (e.g., contaminants exceeding legal quality standards, species or habitats failing favorable conservation status under Birds or Habitat Directives, commercial fish stocks failing Maximum Sustainable Yield targets under Common Fisheries Policy).
• Different pressures are addressed (but in that case other methods can be also used).
• There is an impact or risk on a future impact.
• The precautionary principle is applied (e.g., in the case when little information from only a few indicators is available).
(2) OOAO cannot be used:
• In cases where indicators show a high level of uncertainty, when various indicators are sensitive to the same pressure, etc. In practice, the uncertainty associated with monitoring and assessment for each indicator/descriptor leads to problems of probable underestimation of the true overall class. Hence, if the error associated to the method used to assess the status of each indicator/descriptor is too high the OOAO approach is not advisable.
• Note: Often, not all indicators are in the same state of development, or are scientifically sound and fully tested. In some cases P-S-I (Pressure-State-Impact) relations are uncertain. Also, sometimes multiple indicators are used to describe state. While not all of those indicators may be equally important or even comparable, this is done to include indicators that are used as supportive indicators, where P-S-I relations are uncertain. In those cases an aggregation rule such as OOAO should not be applied.
(3) A “two out, all out” approach can be considered in cases where several methods are combined in one assessment; e.g., when several matrices are used in pollutants to give a broader view of the status (e.g., pollutants in water for an instant picture, pollutants in sediments or biota for a time-integrated result, Tueros et al., 2009).
(4) Averaging is appropriate when combined variables or indicators are of equal importance or sensitive to the same pressure.
(5) Scoring or decision tree approaches are appropriate when:
• The methods to assess the status of the different indicators/descriptors are in different levels of development. In this case, consider giving more weight to those indicator/assessment methods which have been: (i) used broadly by authors other than the proposers of the method; (ii) tested for several different human pressures; and/or (iii) intercalibrated with other methods.
• It is important to be able to track the different steps involved in the assessment, making the path to the final assessment result transparent.
• Note: Consider different weights for individual indicators/descriptors taking into account the relationship with the pressures within the assessment (sub)region. E.g., if the area is under high fishing pressure the most affected descriptors will be D1, D3, D4, D6 and D11; in turn, D2, D5, D7, D8, D9 and D10 will be less affected.
(6) Probabilistic approach:
• Consider carefully the uncertainties related to all of the various parts of the problem; be sure not to overestimate the well-known uncertainties (e.g., natural variance and sampling bias) and underestimate the poorly known uncertainties (e.g., insufficient knowledge or competing hypotheses about ecological interactions; combined effects of various pressures that may be strengthen or weaken each other, etc.).
• Consider using expert knowledge in evaluating the various uncertainties.
• If using expert judgment to weigh the different indicators in addition to the uncertainty estimate, make sure that the weighing is based on the relative importance of the indicators, not on the perceived uncertainty; otherwise you will end up double counting the effect of uncertainty in the final evaluation.
(7) Multimetric and multivariate methods are appropriate when:
• Integrating several indicators of species composition or several indicators of eutrophication or seafloor integrity (e.g., in D1, D5, D6).
• It is advisable to verify that stakeholders and managers can understand the interpretation of the results, and results must be presented in a clear way.
(8) For any of the described methods take into account that:
• Using as many ecosystem components/indicators/criteria as reasonable and available will make the analysis more robust.
• Integrate across state descriptors (D1, D3, D4, D6) differently than across pressure descriptors (D2, D5, D7, D8, D9, D10, D11), giving higher weight to state-based descriptors.
Application of Combination Rules in Assessments
As shown above, the WFD focuses on the structure of the ecosystem using a limited number of biodiversity components (the BQEs), that are combined through the precautionary OOAO approach (Borja et al., 2010). In contrast, the MSFD can be considered to follow a “holistic functional approach,” as it takes into account not only structure (biodiversity components, habitats), but also function (e.g., food webs, seafloor integrity) and processes (e.g., biogeochemical cycles) of the marine ecosystems. The MSFD also uses descriptors that not only relate to biological and physicochemical state indicators but also to pressure indicators (Borja et al., 2010, 2013). The MSFD requires the determination of GEnS on the basis of the qualitative descriptors in Annex I, but does not specifically require one single GEnS assessment, in contrast to the WFD.
There are many methodological challenges and uncertainties involved in establishing a holistic ecosystem assessment, when it is based on the large number of descriptors, associated criteria and indicators defined under the MSFD. The choice of indicator aggregation rules is essential, as the final outcome of the assessment may be very sensitive to those indicator aggregation rules (Ojaveer and Eero, 2011; Borja et al., 2013; Caroni et al., 2013). As shown in the previous section, different methodologies can be applied for aggregating indicators, which vary, amongst others, in the way the outliers influence the aggregate value.
When aggregating indicators most researchers agree that multiple accounting should be avoided. For example, phytoplankton indicators under D1 should be indicative of biodiversity state while under D5 it should be an estimator of the level of eutrophication. Similarly, macroinvertebrates under D1 should represent biodiversity state and under D6 also the state change from pressures on the seafloor. In these cases, although the datasets used could be the same, the main characteristics of the indicators to be used within each descriptor should be different, e.g., the value of macroinvertebrates indicators under D1 (rarity of species, endangered species, engineer species presence, etc.) and the condition of benthic community under D6 (ratio of opportunistic/sensitive, multimetric methods to assess the status, etc.). Of course, for aggregating indicators within the same criterion it is important that all indicators have the same level of maturity and that sufficient data are available.
There are at least four levels of combination required to move from evaluation of the individual metrics or indicators identified by the Task Groups to an assessment of GEnS (Cardoso et al., 2010). As an example, using D6 (Seafloor integrity), Figure 2 shows: (i) aggregation of metrics/indices within indicators (see names of indicators in Table 1); (ii) aggregation of indicators within the criteria of a descriptor (for complex descriptors), e.g., criteria 6.1 (physical damage) and 6.2 (condition of benthic community); (iii) status across all the criteria of a descriptor; and (iv) integration of status across all descriptors.
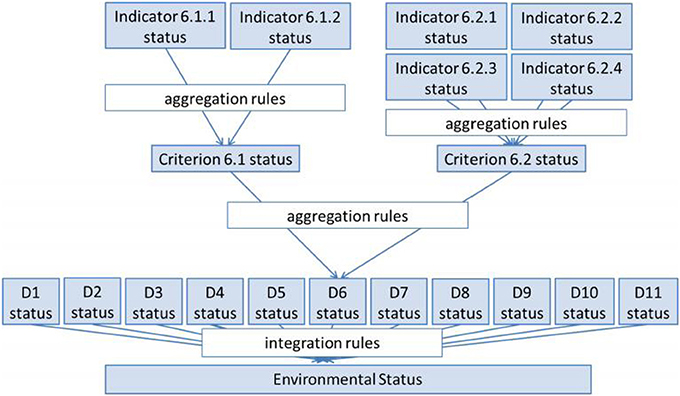
Figure 2. Diagram of a possible approach for aggregation of indicators and criteria and integration of descriptors (D), using D6 as an example. For indicators and criteria description, see Table 1.
As one moves up the scale from metric/indicator level to overall GEnS, the diversity of features that have to be combined increases rapidly (Figure 2). This poses several challenges arising from the diversity of metrics, scales, performance features (sensitivity, specificity, etc.) and inherent nature (state indicators, pressure indicators, impact indicators) of the metrics that must be integrated.
Aggregation of Indicators and Criteria (Combination within a Descriptor)
Cardoso et al. (2010) summarize the methods for an integration within a MSFD descriptor, categorizing them into two wider categories: (i) integrative assessments combining indicators and/or attributes appropriate to local conditions; and (ii) assessment by worst case (in this context, “worst case” means that GEnS will be set at the environmental status of the indicator and/or attribute assessed at the worst state for the area of concern).
Table 3 summarizes the approaches to aggregate attributes within each descriptor. In some cases the MSFD Task Groups propose deconstructing the ecosystem into “descriptor indicators” and then recombining them again to give a pass/fail for the GEnS, using (in four cases) the OOAO principle (Table 3). Borja et al. (2013) emphasize that such a “deconstructive structural approach” makes large assumptions about the functioning of the system and does not consider the weighting of the different indicators and descriptors. It implies that recombining a set of structural attributes gives an accurate representation of the ecosystem functioning.
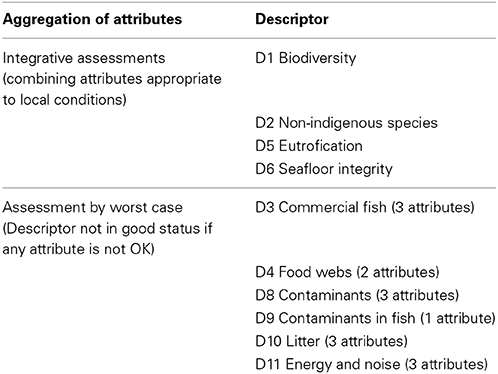
Table 3. Summary of Task Group approaches to aggregate attributes within a Descriptor (Cardoso et al., 2010).
An example of this accurate representation is shown by Tett et al. (2013), who assess the ecosystem health of the North Sea, using different attributes and components of the ecosystem. These components include structure or organization, vigor, resilience, hierarchy and trajectory in state space. All the information from the different components are combined and synthesized for a holistic approach to assess the ecosystem health.
Other approaches have been used in aggregating indicators within each descriptor. For example, Borja et al. (2011b) use the biodiversity valuation approach, in assessing biodiversity within the MSFD, integrating several biodiversity components (zooplankton, macroalgae, macroinvertebrates, fishes, cetaceans and seabirds). Biodiversity valuation maps aim at the compilation of all available biological and ecological information for a selected study area and allocate an integrated intrinsic biological value to the subzones (Derous et al., 2007). Details on valuation methodology can be consulted in Pascual et al. (2011) (see Figure 4 in that paper). This methodology provides information for each of the components and their integrative valuation, together with the reliability of the result, taking into account spatial and temporal data availability (Derous et al., 2007). The advantage of this method is that the current information used to valuate biodiversity can be adapted to the requirements of the MSFD indicators. Moreover, this method can avoid duplication of indicators in two descriptors (e.g., D1 and D6), since the metrics used could be different. This information can be converted into environmental status values, as shown in Borja et al. (2011b).
Integration of Descriptors (Combination Across Descriptors)
Discussion on how to integrate the results of each descriptor into an overall assessment of GEnS for regions or subregions was not part of the Terms of Reference for the Task Groups. However, work within Task Group 6 (Sea floor integrity) identified a method for integration and assessment that might also be appropriate, if applied across all descriptors, at a regional scale (Cardoso et al., 2010). As these authors pointed out, cross-descriptor integration at the scale of (sub)regional seas runs the risk of blending and obscuring the information that is necessary to follow progress toward GEnS and to inform decision-makers about the effects and the efficiency of policies and management. It may lead to masking of problems within specific descriptors.
Borja et al. (2013) describe at least 8 options to determine GEnS in a regional sea context (Table 4). These authors detail the concept behind these options, and propose the decision rule more adequate for the assessment method to be used, depending on the circumstances i.e., data availability, lack of monitoring, etc. In addition, these authors consider what type and amount of data are required, and then discuss the pros and cons of the different options. The implementation of a complex directive, such as the MSFD, requires a high amount of data to assess the environmental status in a robust way. Hence, the options from 1 to 8 proposed in Table 4 are sequentially less demanding of new data, and the degree of detailed environmental assessment is also decreasing.
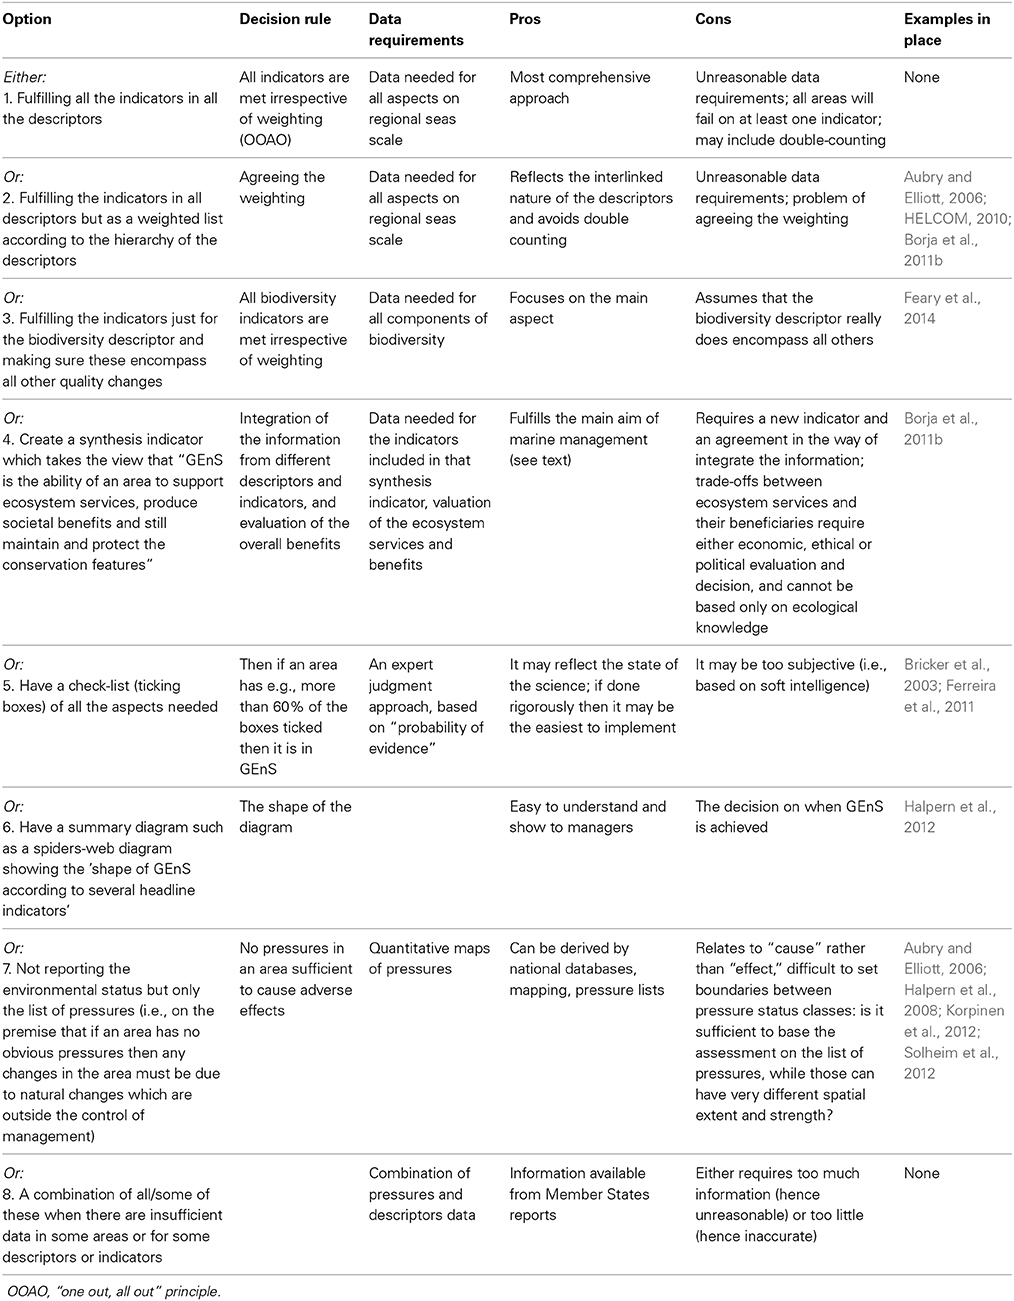
Table 4. Options for determining if an area/regional sea is in Good Environmental Status (GEnS) (modified from Borja et al., 2013).
As such, Option 1, which is most similar to the WFD approach, deconstructs GEnS into the 11 descriptors and then into the component indicators, assessing each components for each area before attempting to produce an overall assessment (Table 4). However, having a complete dataset covering all descriptors and indicators for the assessment is difficult, if not impossible to achieve in practical terms. The use of pressure maps as an estimator of the environmental status and possible impacts to marine ecosystems could be considered instead (see Table 4). This would, however, build on the substantial assumption that the level of pressure is adequately representing the current state on all different levels of ecosystem components. Option 7, in contrast, only uses published data for the activities, and then infers a static relationship between activity, pressures, state changes and impacts both on the natural and the human system. Here, the number of underlying assumptions is even larger than using pressure maps, since the method relies on predefined and static DPSIR relations. Between these extremes, there are several intermediate options to integrate and present information, each with its own requirements, pros and cons (Table 4).
One-out, all-out (OOAO)
Although the MSFD describes the GEnS individually for each of the 11 descriptors, this does not necessarily imply the ability to have GEnS at the level of all the descriptors, nor does it mean that each descriptor should necessarily be graded individually in a binary way (i.e., good or not good environmental status) (Borja et al., 2013).
It could be argued that the 11 descriptors together summarize the way in which the ecosystem functions in terms of the MSFD view. As Member States have to consider each of the descriptors to determine good environmental status, this could be interpreted as a requirement to achieve GEnS for each of these descriptors. In that case, applying OOAO is the only integration method that can be applied to arrive at an overall assessment of GEnS, leading to a high probability of not achieving GEnS.
This assumes that the 11 descriptors, and the associated indicators, can be considered a coherent and consistent framework that adequately reflects the environmental status. In that situation, state descriptors not achieving GEnS would be accompanied by pressure descriptors not achieving GEnS, if the reaction of the ecosystem components is immediate, acting on the same time scale as the pressures. If this is not the case, for example if a pressure descriptor (e.g., D5 or D8) indicates that the level of the pressure is too high to achieve GEnS, while state descriptors (e.g., D1 or D4) do not reflect this, there is clearly an inconsistency in the assumed MSFD assessment framework, indicating that it does not capture delayed responses of state indicators to changing pressure indicators. That could be interpreted as a need for further research on the nature of P-S-I relations and the consistency in environmental targets for the descriptors involved, since our current state of knowledge on quantitative causal relations between pressures, state changes and impacts is limited. In addition, nearly all ecosystem components are subject to the true cumulative effects of many simultaneous pressures related to a range of human activities (Crain et al., 2008; Stelzenmüller et al., 2010; Knights et al., 2013). This means that, for some descriptors at least, there is a large scientific uncertainty associated with the definition of environmental targets and GEnS. Uncertainties in target setting, in the performance of an action (e.g., ecosystem state post-management) or in the contribution of individual driver(s) causing state change can undermine decision making when implementing environmental policy and can limit our ability to identify what should be managed, and what the impact of management might be (Knights et al., 2014). Consequently, developing a consistent assessment framework for all descriptors and indicators is an extremely challenging task, and using the OOAO approach is not appropriate.
Alternative approaches
The usefulness of integrating descriptors to one single value (overall GEnS assessment based on combination of the 11 descriptors) is under discussion by the Member States and the European Commission groups for the implementation of the MSFD. An argument against integration across descriptors is that it may not be informative any more since it results in loss of information at a crucial level where different elements are combined that cannot be integrated without major concessions.
The abovementioned groups have suggested that an integration across the biodiversity-related descriptors (D1, D2, D4, D6) might be an option, splitting those descriptors into various groups (e.g., functional or species groups). If a species or species group is assessed under more than one descriptor different aspects should be considered (e.g., chlorophyll a under D5 and phytoplankton species composition under D1).
However, if an integration across all descriptors is decided, Borja et al. (2010) suggest that the 11 descriptors are hierarchical and do not have an equal weighting when assessing the overall GEnS. Hence, Borja et al. (2013) suggest that for biodiversity (D1) to be fulfilled requires all others to be met and similarly if one of the stressor or pressure-related descriptors (e.g., D11, energy including noise) fails then by definition the biodiversity will be adversely affected at some point. This approach addresses the conceptual drawback of the OOAO principle and allows to have delayed responses to changing pressure regimes without drawing false conclusions and still being precautionary.
In addition to the problem of combining indicators (seen in the previous section) and descriptors the MSFD requires Member States to integrate and geographically scale-up the assessments at the level of a region or subregion (Borja et al., 2010). This differs strongly from the approach under the WFD, which is restricted to quality assessments at the scale of a water body (Hering et al., 2010). This means that the GEnS assessments of the different Member States within a regional sea need to be comparable and should avoid anomalies at the borders of Member States in order to enable synthesizing of the assessments into a region-wide assessment (Borja et al., 2013). This requires both comparable methods and associated combination rules to ensure minimum standards for GEnS reporting across Member States. As such, we advocate a set of common principles (expanded from Claussen et al., 2011, as shown in Borja et al., 2013):
– The combination across levels of different complexity should accommodate different alternatives, i.e., aggregation below descriptor level (across indicators within criteria, and criteria within descriptors, as shown in the previous section) and can certainly differ from descriptor level integration.
– Integration across state descriptors (D1, D3, D4, D6) should be done differently than across pressure descriptors (D2, D5, D7, D8, D9, D10, D11), but avoiding double counting of indicators in different descriptors (e.g., phytoplankton under D1 and D5, macroinvertebrates under D1 and D6).
– Consideration of a different contribution of the two types of descriptors for the overall GEnS evaluation—giving state descriptors a higher weight, as receptors of the impacts caused by pressures. The rationale for this, as recognized by Claussen et al. (2011), is that “in principle, where GEnS for state-based descriptors (D1, 3, 4, 6) is achieved it follows that GEnS for pressure-based descriptors should also be met.” This principle makes the assumption that the state eventually will reflect ceasing pressures. When the state descriptors finally reach a satisfactory level then the pressures must be having a limited (or mitigated) impact.
Visualizing and communicating the status
The outlined alternative approach also shows that concerns on integration across descriptors do not necessarily have to be a problem. There are some methods which have demonstrated that integrating the information into single values (Borja et al., 2011b), maps (HELCOM, 2010) or radar schemes (Halpern et al., 2012) is still helpful and informative for ecosystem management, despite the involved loss of information that is inherent to a single number. Information can be retained when always presenting that single number together with the main underlying data, ideally visualizing the different levels of aggregation, allowing the lookup of the status at any level and relating the status with the actual pressures that lead to the synthesized value.
As an example, the Ocean Health Index (Halpern et al., 2012) provides weighted index scores for environmental health, both a global area-weighted average and scores by country (Figure 3). The outer ring of the radar scheme is the maximum possible score for each goal, and a goal's score and weight (relative contribution) are represented by the petal's length and width, respectively. This way of visualizing the integration could be adapted for the MSFD, integrating at the level of region or subregion, but also showing the values within each descriptor. This would still allow managers to extract relevant information and take actions at different levels: small (or local) scale, large (regional) scale, integrative (whole ecosystem status), or for each descriptor.
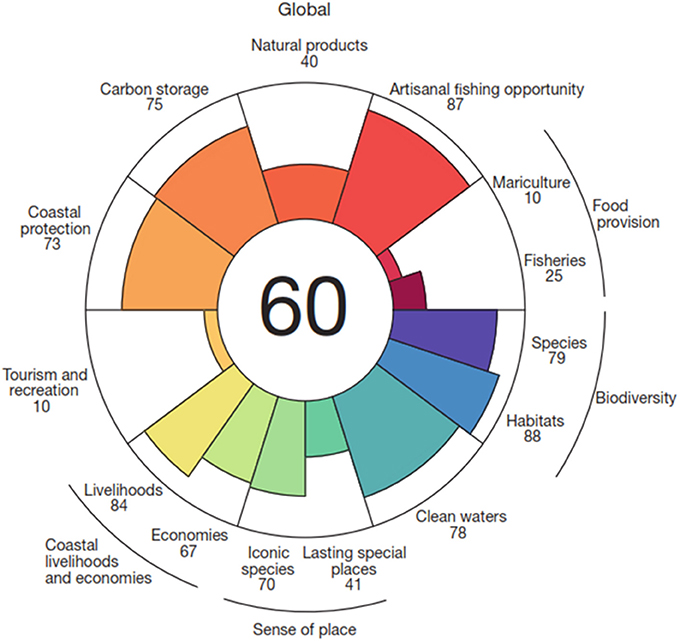
Figure 3. Ocean Health Index scores (inside circle) and individual goal scores (colored petals) for global area-weighted average of all studied countries (modified from Halpern et al., 2012).
Another example, applied specifically for the MSFD, using all descriptors and most of the indicators, can be consulted in Borja et al. (2011b). These authors studied a system in which the main driver for the whole area is fishing, whilst at local level some pressures such as waste discharges are important. Although the overall environmental status of the area was considered good, after the integration of all indicators and descriptors, two of the descriptors (fishing and food webs) were not in good status (Table 5). Interestingly, biodiversity was close to the boundary to good status (Table 5), suggesting that the system could be unbalanced by fishing, but affecting various biological descriptors to different degrees. This means that the pressure must be managed to avoid problems in the future, especially because the descriptors already in less than good status showed a negative trend (Table 5).
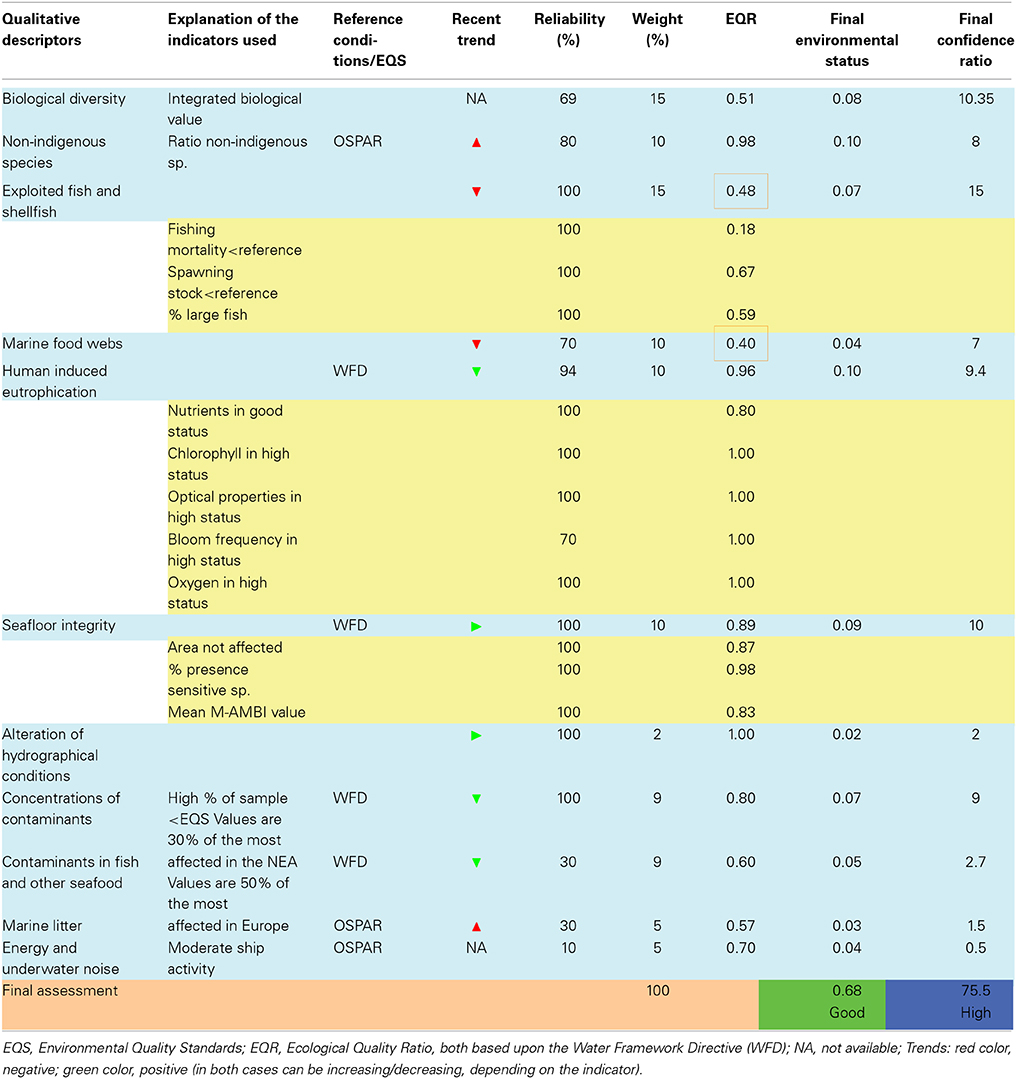
Table 5. Example of an assessment of the environmental status, within the Marine Strategy Framework Directive, in the Basque Country offshore waters (Bay of Biscay) (modified from Borja et al., 2011b).
Hence, from the examples above and the given reasoning, both main choices are still useful: either integrate or not integrate information across descriptors. Irrespectively of which combination proposal(s) is adopted and at which level, the precautionary principle should always be followed in absence of more robust knowledge (Borja et al., 2013). As a summary, the pros and cons of each decision are shown in Table 6.
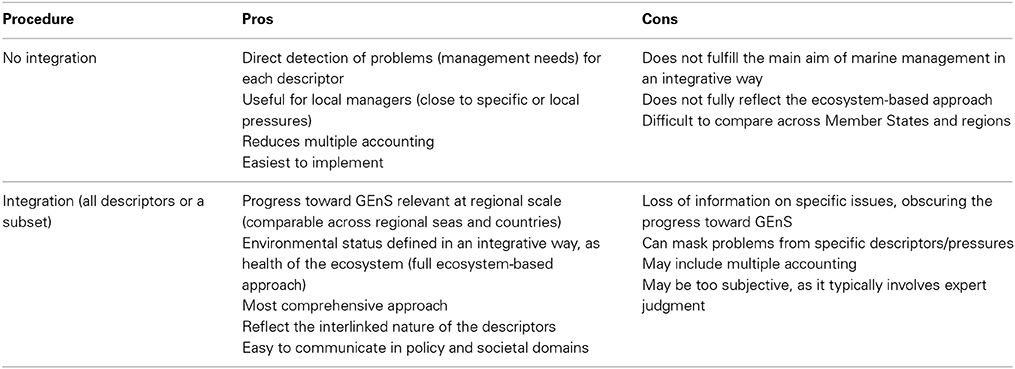
Table 6. Pros and cons of the decision of integrating the information across descriptors.
Proposed Steps for Combination
As a possible approach for the combination of assessments we propose the following steps (Figure 4):
– Assessments start at a low level, viz. the level of indicators and spatial scales that were defined for each specific indicator. This would result in assessment results for each indicator and each assessment area incorporating the levels of spatial assessment that was described as a nested approach (Step 1—spatial scales).
– Within one descriptor, this could result in a number of assessments for the different indicators, that all use the same scales for their assessment areas. This could be the case for descriptors like D5 and D8. In those cases, the assessments at indicator level can be aggregated to assessments at descriptor level for each assessment area, using suitable aggregation rules (Step 2—aggregation within a descriptor). These steps are already commonly used procedures in OSPAR (2009) and HELCOM assessments for eutrophication and contaminants.
– For other descriptors, the spatial scales for indicators may not be the same for all indicators. This could be the case for biodiversity, where a different spatial scale may be used depending on the species or habitat. Although integration of different biodiversity components and functional groups is required, methods need further development, and a number of EU projects are focussing on this issue.
Aggregation up to this level gives a detailed assessment result that suits the information needs for identifying environmental problems and needs for measures. The result of those steps at European level would be a very high number of assessment results, for each descriptor and assessment area (comparable to presenting the WFD assessments at water body level).
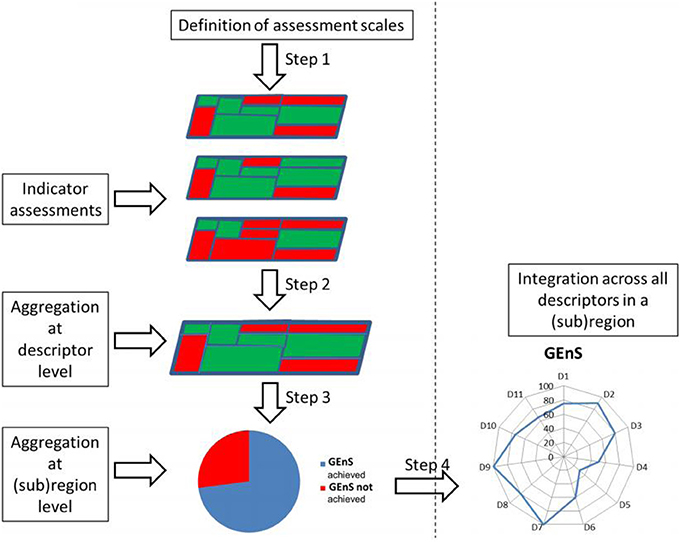
Figure 4. Schematic view of steps for combination toward an assessment at subregional level. GEnS: Good Environmental Status.
The following steps could provide information at a higher level of integration presenting the required overview of the current status of the overall environmental state and the progress toward GEnS:
– Within a descriptor, the assessment results of all assessment areas within a subregion can be presented in a more integrated way (Step 3—spatial aggregation).
• Generally, use of OOAO (if one assessment area fails GEnS, the whole subregion fails) is not useful, as it gives a very conservative result and is not informative. Also, if the pressure is highly localized this approach is not adequate, since the whole subregion could fail GEnS due to a single location (which, of course, will need specific management measures).
• In some cases, for example if a pressure is more or less homogeneous across a whole subregion (fishing, shipping), it could be useful to apply OOAO.
– Percentage of surface area achieving GEnS: This could be a more useful approach, if the extent and intensity of a pressure can be quantified. For example, if the pressure is present in 45% of the surface area of a subregion, but the surface area not achieving GEnS is only 2%, it could be concluded that the subregion does not achieve GEnS in 2% of its area, where management measures are needed.
– Other metrics.
For some descriptors, surface area may be a good measure to express status at a subregional level: for example, D5, D8, and D10. For other descriptors, surface area is not suitable but other metrics should be considered, e.g., D1: numbers of species/habitats failing to achieve favorable conservation status; D3: number of stocks failing to meet “Maximum Sustainable Yield.”
The end result of Step 3 could present the level at which GEnS is achieved at subregional scale as a pie chart. The aggregation results of Step 3 could be integrated across descriptors in a final presentation per subregion, using methods such as radar plots, or methods similar to the Ocean Health Index (Step 4—aggregation across descriptors). In this step, weighted approaches as suggested in previous sections would be considered.
Concluding Remarks
From the information provided in this overview, some conclusions can be highlighted:
– Some kind of integration across indicators, criteria and descriptors is required to arrive at assessment of GEnS or “ecosystem health.”
– Integration principles should be ecologically-relevant, transparent and documented.
– Integrated assessment should not only present a classification result (primary assessment) but also address uncertainties and assess confidence of the classification result (as a secondary assessment). When carrying out an assessment at a specific scale, the decisions made in regard to integration principles/rules should be available as a sort of third assessment or backlog.
– Assessments should be planned around the question(s) to be addressed and the tool(s) to be used. Monitoring should subsequently be designed to meet the requirements of the planned assessments.
– This study provides information on combining methods to integrate ecosystem components to assess status and guidelines for scientists and managers on the steps to be followed, when deciding on assessment scales and combination approaches. Integration of taxonomic, functional and key or keystone biodiversity components into an overall biodiversity assessment able to link to GEnS and to ecosystem service provision and the sustainable management of detrimental human activities is the next challenge.
Conflict of Interest Statement
The authors declare that the research was conducted in the absence of any commercial or financial relationships that could be construed as a potential conflict of interest.
Acknowledgments
The opinions expressed in this document are the sole responsibility of the authors and do not represent the official position of the European Commission. This work has been done under Framework contract No ENV.D2/FRA/2012/0019 (Coherent geographic scales and aggregation rules in assessment and monitoring of Good Environmental Status—analysis and conceptual phase), of the European Directorate General of Environment; and DEVOTES project (DEVelopment Of innovative Tools for understanding marine biodiversity and assessing good Environmental Status) funded by the European Union under the 7th Framework Program “The Ocean of Tomorrow” Theme (grant agreement no. 308392) (www.devotes-project.eu). JHA was supported by the WATERS project (Waterbody Assessment Tools for Ecological Reference conditions and status in Sweden). María C. Uyarra (AZTI-Tecnalia) and Mike Elliott (University of Hull) provided constructive comments to the first version of the manuscript. This is contribution number 674 from the Marine Research Division (AZTI-Tecnalia).
References
Aubry, A., and Elliott, M. (2006). The use of environmental integrative indicators to assess seabed disturbance in estuaries and coasts: Application to the Humber Estuary, UK. Mar. Pollut. Bull. 53, 175–185. doi: 10.1016/j.marpolbul.2005.09.021
Pubmed Abstract | Pubmed Full Text | CrossRef Full Text | Google Scholar
Barton, D. N., Saloranta, T., Moe, S. J., Eggestad, H. O., and Kuikka, S. (2008). Bayesian belief networks as a meta-modelling tool in integrated river basin management - Pros and cons in evaluating nutrient abatement decisions under uncertainty in a Norwegian river basin. Ecol. Econ. 66, 91–104. doi: 10.1016/j.ecolecon.2008.02.012
Barton, D. N., Kuikka, S., Varis, O., Uusitalo, L., Henriksen, H. J., Borsuk, M., et al. (2012). Bayesian networks in environmental and resource management. Integr. Environ. Assess. Manage. 8, 418–429. doi: 10.1002/ieam.1327
Pubmed Abstract | Pubmed Full Text | CrossRef Full Text | Google Scholar
Birk, S., Bonne, W., Borja, A., Brucet, S., Courrat, A., Poikane, S., et al. (2012). Three hundred ways to assess Europe's surface waters: an almost complete overview of biological methods to implement the Water Framework Directive. Ecol. Indic. 18, 31–41. doi: 10.1016/j.ecolind.2011.10.009
Borja, A. (2014). Grand challenges in marine ecosystems ecology. Front. Mar. Sci. 1:1. doi: 10.3389/fmars.2014.00001
Borja, A., and Rodríguez, J. G. (2010). Problems associated with the ‘one-out, all-out’ principle, when using multiple ecosystem components in assessing the ecological status of marine waters. Mar. Pollut. Bull. 60, 1143–1146. doi: 10.1016/j.marpolbul.2010.06.026
Borja, A., Valencia, V., Franco, J., Muxika, I., Bald, J., Belzunce, M. J., et al. (2004). The water framework directive: water alone, or in association with sediment and biota, in determining quality standards? Mar. Pollut. Bull. 49, 8–11. doi: 10.1016/j.marpolbul.2004.04.008
Borja, A., Bricker, S. B., Dauer, D. M., Demetriades, N. T., Ferreira, J. G., Forbes, A. T., et al. (2008). Overview of integrative tools and methods in assessing ecological integrity in estuarine and coastal systems worldwide. Mar. Pollut. Bull. 56, 1519–1537. doi: 10.1016/j.marpolbul.2008.07.005
Pubmed Abstract | Pubmed Full Text | CrossRef Full Text | Google Scholar
Borja, A., Ranasinghe, A., and Weisberg, S. B. (2009a). Assessing ecological integrity in marine waters, using multiple indices and ecosystem components: challenges for the future. Mar. Pollut. Bull. 59, 1–4. doi: 10.1016/j.marpolbul.2008.11.006
Pubmed Abstract | Pubmed Full Text | CrossRef Full Text | Google Scholar
Borja, A., Bald, J., Franco, J., Larreta, J., Muxika, I., Revilla, M., et al. (2009b). Using multiple ecosystem components, in assessing ecological status in Spanish (Basque Country) Atlantic marine waters. Mar. Pollut. Bull. 59, 54–64. doi: 10.1016/j.marpolbul.2008.11.010
Pubmed Abstract | Pubmed Full Text | CrossRef Full Text | Google Scholar
Borja, A., Elliott, M., Carstensen, J., Heiskanen, A. S., and van de Bund, W. (2010). Marine management–towards an integrated implementation of the European Marine Strategy Framework and the Water Framework Directives. Mar. Pollut. Bull. 60, 2175–2186. doi: 10.1016/j.marpolbul.2010.09.026
Pubmed Abstract | Pubmed Full Text | CrossRef Full Text | Google Scholar
Borja, A., Barbone, E., Basset, A., Borgersen, G., Brkljacic, M., Elliott, M., et al. (2011a). Response of single benthic metrics and multi-metric methods to anthropogenic pressure gradients, in five distinct European coastal and transitional ecosystems. Mar. Pollut. Bull. 62, 499–513. doi: 10.1016/j.marpolbul.2010.12.009
Pubmed Abstract | Pubmed Full Text | CrossRef Full Text | Google Scholar
Borja, A., Galparsoro, I., Irigoien, X., Iriondo, A., Menchaca, I., Muxika, I., et al. (2011b). Implementation of the European Marine Strategy Framework Directive: a methodological approach for the assessment of environmental status, from the Basque Country (Bay of Biscay). Mar. Pollut. Bull. 62, 889–904. doi: 10.1016/j.marpolbul.2011.03.031
Pubmed Abstract | Pubmed Full Text | CrossRef Full Text | Google Scholar
Borja, A., Elliott, M., Andersen, J. H., Cardoso, A. C., Carstensen, J., Ferreira, J. G., et al. (2013). Good Environmental Status of marine ecosystems: What is it and how do we know when we have attained it? Mar. Pollut. Bull. 76, 16–27. doi: 10.1016/j.marpolbul.2013.08.042
Pubmed Abstract | Pubmed Full Text | CrossRef Full Text | Google Scholar
Breen, P., Robinson, L. A., Rogers, S. I., Knights, A. M., Piet, G., Churilova, T., et al. (2012). An environmental assessment of risk in achieving good environmental status to support regional prioritisation of management in Europe. Mar. Policy 36, 1033–1043. doi: 10.1016/j.marpol.2012.02.003
Bricker, S. B., Ferreira, J. G., and Simas, T. (2003). An integrated methodology for assessment of estuarine trophic status. Ecol. Modell. 169, 39–60. doi: 10.1016/S0304-3800(03)00199-6
Cardoso, A. C., Cochrane, S., Doemer, H., Ferreira, J. G., Galgani, F., Hagebro, C., et al. (2010). Scientific support to the European Commission on the Marine Strategy Framework Directive. Management Group Report. EUR 24336 EN, (Luxembourg: Joint Research Centre) Office for Official Publications of the European Communities: 57.
Caroni, R., Bund, W., Clarke, R. T., and Johnson, R. K. (2013). Combination of multiple biological quality elements into waterbody assessment of surface waters. Hydrobiologia 704, 437–451. doi: 10.1007/s10750-012-1274-y
CIS (2003). “Overall Approach to the Classification of Ecological Status and Ecological Potential,” in Water Framework Directive Common Implementation Strategy Working Group 2 A Ecological Status (ECOSTAT), Rome, 53.
Claussen, U., Connor, D., de Vrees, L., Leppänen, J. M., Percelay, J., Kapari, M., et al. (2011). Common Understanding of (Initial) Assessment, Determination of Good Environmental Status (GES) and Establishment of Environmental Targets (Articles 8, 9 and 10 MSFD). European Commission, 73.
Costanza, R., and Mageau, M. (1999). What is a healthy ecosystem? Aquat. Ecol. 33, 105–115. doi: 10.1023/A:1009930313242
Crain, C. M., Kroeker, K., and Halpern, B. S. (2008). Interactive and cumulative effects of multiple human stressors in marine systems. Ecol. Lett. 11, 1304–1315. doi: 10.1111/j.1461-0248.2008.01253.x
Pubmed Abstract | Pubmed Full Text | CrossRef Full Text | Google Scholar
Derous, S., Agardy, T., Hillewaert, H., Hostens, K., Jamieson, G., Lieberknecht, L., et al. (2007). A concept for biological valuation in the marine environment. Oceanologia 49, 99–128.
European Commission. (2008). Directive 2008/56/EC of the European Parliament and of the Council establishing a framework for community action in the field of marine environmental policy (Marine Strategy Framework Directive). Official J. Eur. Union L164, 19–40.
European Commission. (2010). Commission Decision of 1 September 2010 on criteria and methodological standards on good environmental status of marine waters (notified under document C(2010) 5956)(2010/477/EU). Official J. Eur. Union L232, 12–24.
Feary, D. A., Fowler, A. M., and Ward, T. J. (2014). Developing a rapid method for undertaking the World Ocean Assessment in data-poor regions – A case study using the South China Sea Large Marine Ecosystem. Ocean Coast. Manage. 95, 129–137. doi: 10.1016/j.ocecoaman.2014.04.006
Ferreira, J. G., Andersen, J. H., Borja, A., Bricker, S. B., Camp, J. M., et al. (2011). Overview of eutrophication indicators to assess environmental status within the European Marine Strategy Framework Directive. Est. Coast. Shelf Sci. 93, 117–131. doi: 10.1016/j.ecss.2011.03.014
Halpern, B. S., Walbridge, S., Selkoe, K. A., Kappel, C. V., Micheli, F., D'Agrosa, C., et al. (2008). A global map of human impact on marine ecosystems. Science 319, 948–952. doi: 10.1126/science.1149345
Pubmed Abstract | Pubmed Full Text | CrossRef Full Text | Google Scholar
Halpern, B. S., Longo, C., Hardy, D., McLeod, K. L., Samhouri, J. F., Katona, S. K., et al. (2012). An index to assess the health and benefits of the global ocean. Nature 488, 615–620. doi: 10.1038/nature11397
Pubmed Abstract | Pubmed Full Text | CrossRef Full Text | Google Scholar
HELCOM. (2009a). Eutrophication in the Baltic Sea – An integrated thematic assessment of the effects of nutrient enrichment and eutrophication in the Baltic Sea region. Balt. Sea Environ. Proc. 115B, 152.
HELCOM. (2009b). Biodiversity in the Baltic Sea – An integrated thematic assessment on biodiversity and nature conservation in the Baltic Sea. Balt. Sea Environ. Proc. 116B, 192.
HELCOM. (2010). Ecosystem Health of the Baltic Sea 2003–2007: HELCOM Initial Holistic Assessment. Balt. Sea Environ. Proc. 122, 68.
Hering, D., Borja, A., Carstensen, J., Carvalho, L., Elliott, M., Feld, C. K., et al. (2010). The European Water Framework Directive at the age of 10: a critical review of the achievements with recommendations for the future. Sci. Total Environ. 408, 4007–4019. doi: 10.1016/j.scitotenv.2010.05.031
Pubmed Abstract | Pubmed Full Text | CrossRef Full Text | Google Scholar
Knights, A. M., Koss, R. S., and Robinson, L. A. (2013). Identifying common pressure pathways from a complex network of human activities to support ecosystem-based management. Ecol. Appl. 23, 755–765. doi: 10.1890/12-1137.1
Pubmed Abstract | Pubmed Full Text | CrossRef Full Text | Google Scholar
Knights, A. M., Culhane, F., Hussain, S. S., Papadopoulou, K. N., Piet, G. J., Raakær, J., et al. (2014). A step-wise process of decision-making under uncertainty when implementing environmental policy. Environ. Sci. Policy 39, 56–64. doi: 10.1016/j.envsci.2014.02.010
Korpinen, S., Meski, L., Andersen, J. H., and Laamanen, M. (2012). Human pressures and their potential impact on the Baltic Sea ecosystem. Ecol. Indic. 15, 105–114. doi: 10.1016/j.ecolind.2011.09.023
Lehikoinen, A., Helle, I., Klemola, E., Mäntyniemi, S., Kuikka, S., and Pitkänen, H. (2014). Evaluating the impact of nutrient abatement measures on the ecological status of coastal waters: a Bayesian network for decision analysis. Int. J. Multicriteria Decis. Mak. 4, 114–134. doi: 10.1504/IJMCDM.2014.060426
Lehikoinen, A., Luoma, E., Mantyniemi, S., and Kuikka, S. (2013). Optimizing the recovery efficiency of Finnish oil combating vessels in the Gulf of Finland using Bayesian Networks. Environ. Sci. Technol. 47, 1792–1799. doi: 10.1021/es303634f
Pubmed Abstract | Pubmed Full Text | CrossRef Full Text | Google Scholar
Mee, L. D., Jefferson, R. L., d'A Laffoley, D., and Elliott, M. (2008). How good is good? Human values and Europe's proposed Marine Strategy Directive. Mar. Pollut. Bull. 56, 187–204. doi: 10.1016/j.marpolbul.2007.09.038
Pubmed Abstract | Pubmed Full Text | CrossRef Full Text | Google Scholar
Micheli, F., Halpern, B. S., Walbridge, S., Ciriaco, S., Ferretti, F., Fraschetti, S., et al. (2013). Cumulative human impacts on mediterranean and black sea marine ecosystems: assessing current pressures and opportunities. PLoS ONE 8:e79889. doi: 10.1371/journal.pone.0079889
Pubmed Abstract | Pubmed Full Text | CrossRef Full Text | Google Scholar
Murtaugh, P. A. (1996). The statistical evaluation of ecological indicators. Ecol. Appl. 6, 132–139. doi: 10.2307/2269559
Ojaveer, H., and Eero, M. (2011). Methodological challenges in assessing the environmental status of a marine ecosystem: case study of the Baltic Sea. PLoS ONE 6:e19231. doi: 10.1371/journal.pone.0019231
Pubmed Abstract | Pubmed Full Text | CrossRef Full Text | Google Scholar
OSPAR (2009). Eutrophication Status of the OSPAR Maritime Area. Second OSPAR Integrated Report. Eutrophication Series. OSPAR Commission, London, 107. Available online at: http://qsr2010.ospar.org/media/assessments/p00372_Second_integrated_report.pdf
OSPAR (2012). MSFD Advice Manual and Background Document on Biodiversity. London, Publication Number: 581/2012, 141.
Pascual, M., Borja, A., Eede, S. V., Deneudt, K., Vincx, M., Galparsoro, I., et al. (2011). Marine biological valuation mapping of the Basque continental shelf (Bay of Biscay), within the context of marine spatial planning. Est. Coast. Shelf Sci. 95, 186–198. doi: 10.1016/j.ecss.2011.08.031
Primpas, I., and Karydis, M. (2011). Scaling the trophic index (TRIX) in oligotrophic marine environments. Environ. Monit. Assess. 178, 257–269. doi: 10.1007/s10661-010-1687-x
Pubmed Abstract | Pubmed Full Text | CrossRef Full Text | Google Scholar
Prins, T., van der Meulen, M., Boon, A., Simboura, N., Tsangaris, C., Borja, A., et al. (2014). “Coherent geographic scales and aggregation rules in assessment and monitoring of Good Environmental Status” Analysis and conceptual phase” Deltares – The Netherlands October 2014 Analytical report under Framework contract No NV.D2/FRA/2012/0019. Available online at: http://ec.europa.eu/environment/marine/publications/
Purvis, A., and Hector, A. (2000). Getting the measure of biodiversity. Nature 405, 212–219. doi: 10.1038/35012221
Pubmed Abstract | Pubmed Full Text | CrossRef Full Text | Google Scholar
Rice, J., Arvanitidis, C., Borja, A., Frid, C., Hiddink, J., Krause, J., et al. (2010). Marine Strategy Framework Directive – Task Group 6 Report Seafloor integrity. EUR 24334 EN, Luxembourg: Joint Research Centre; Office for Official Publications of the European Communities. 73.
Shin, Y.-J., Bundy, A., Shannon, L. J., Blanchard, J. L., Chuenpagdee, R., Coll, M., et al. (2012). Global in scope and regionally rich: an IndiSeas workshop helps shape the future of marine ecosystem indicators. Rev. Fish Biol. Fish 22, 835–845. doi: 10.1007/s11160-012-9252-z
Simboura, N., Zenetos, A., Pancucci-Papadopoulou, M. A., Reizopoulou, S., and Streftaris, N. (2012). Indicators for the Sea-floor Integrity of the Hellenic Seas under the European Marine Strategy Framework Directive: establishing the thresholds and standards for Good Environmental Status. Medit. Mar. Sci. 13, 140–152. doi: 10.12681/mms.31
Solheim, A. L., Austnes, K., Kristensen, P., Peterlin, M., Kodes, V., Collins, R., et al. (2012). Ecological and Chemical Status and Pressures in European Waters. Thematic Assessment for EEA Water 2012 Report. Prague: ETC/ICM Technical Report, 1:146.
Stelzenmüller, V., Lee, J., South, A., and Rogers, S. I. (2010). Quantifying cumulative impacts of human pressures on the marine environment: a geospatial modelling framework. Mar. Ecol. Prog. Ser. 398, 19–32. doi: 10.3354/meps08345
Tett, P., Gowen, R. J., Painting, S. J., Elliott, M., Forster, R., Mills, D. K., et al. (2013). Framework for understanding marine ecosystem health. Mar. Ecol. Prog. Ser. 494, 1–27. doi: 10.3354/meps10539
Tueros, I., Borja, A., Larreta, J., Rodríguez, J. G., Valencia, V., and Millán, E. (2009). Integrating long-term water and sediment pollution data, in assessing chemical status within the European Water Framework Directive. Mar. Pollut. Bull. 58, 1389–1400. doi: 10.1016/j.marpolbul.2009.04.014
Pubmed Abstract | Pubmed Full Text | CrossRef Full Text | Google Scholar
Keywords: ecosystems, marine, indicators, Marine Strategy Framework Directive, descriptors, criteria, assessment, integration
Citation: Borja A, Prins TC, Simboura N, Andersen JH, Berg T, Marques J-C, Neto JM, Papadopoulou N, Reker J, Teixeira H and Uusitalo L (2014) Tales from a thousand and one ways to integrate marine ecosystem components when assessing the environmental status. Front. Mar. Sci. 1:72. doi: 10.3389/fmars.2014.00072
Received: 17 May 2014; Accepted: 20 November 2014;
Published online: 05 December 2014.
Edited by:
Stelios Katsanevakis, University of the Aegean, GreeceReviewed by:
Angel Pérez-Ruzafa, Universidad de Murcia, SpainHenn Ojaveer, University of Tartu, Estonia
Sabine Cochrane, Akvaplan-niva, Norway
Copyright © 2014 Borja, Prins, Simboura, Andersen, Berg, Marques, Neto, Papadopoulou, Reker, Teixeira and Uusitalo. This is an open-access article distributed under the terms of the Creative Commons Attribution License (CC BY). The use, distribution or reproduction in other forums is permitted, provided the original author(s) or licensor are credited and that the original publication in this journal is cited, in accordance with accepted academic practice. No use, distribution or reproduction is permitted which does not comply with these terms.
*Correspondence: Angel Borja, AZTI-Tecnalia, Marine Research Division, Herrera Kaia, Portualdea S/N, 20110 Pasaia, Spain e-mail: aborja@azti.es