Overview of distribution patterns of zooxanthellate Scleractinia
 John Veron
 Mary Stafford-Smith1
  Lyndon DeVantier
- 1Coral Reef Research, Townsville, QLD, Australia
- 2Department of Marine and Tropical Biology, James Cook University, Townsville, QLD, Australia
- 3Department of Earth Sciences, University of Queensland, Brisbane, QLD, Australia
- 4Australian Centre for Tropical Freshwater Research, James Cook University, Townsville, QLD, Australia
This publication is an overview of a detailed study of coral distribution, diversity and affinities worldwide. The species distribution maps in www.coralsoftheworld.com are based on comprehensive global assessments of the world's 150 coral ecoregions. Original surveys by the authors cover 4941 sites in 85 ecoregions worldwide. These are combined with a thorough summation of all biogeographic, taxonomic and related literature as well as an extensive review of museum and photographic collections worldwide and extensive inter-personal communications. Species occurrences in ecoregions are recorded as confirmed, strongly predicted, uncertain or absent. These data are used to present global maps of diversity and affinity at species level. There are two templates of Indo-Pacific diversity and affinity: one dominated by the Coral Triangle and one created by poleward continental boundary currents. There is a high degree of uniformity within the main body of the Coral Triangle; diversity and affinities both decrease in all directions. The Sunda Shelf ecoregion now qualifies for inclusion in the Coral Triangle and the Java Sea ecoregion is borderline. There is very little Indo-Pacific provincialism. Two separate centers of diversity occur in the Indian Ocean: the subequatorial west, and the Red Sea. Most species of the far eastern Pacific occur in the central Pacific. The Caribbean dominates Atlantic distribution and affinities and also has high uniformity. Individual ecoregions have very varying data comprehensiveness. Distribution patterns that distinguish between geographic variation within a species and the geographic overlap of sister species support the concept of reticulate evolution.
Introduction
As with most biogeographic studies, coral biogeography has followed in the wake of taxonomy, the latter having had three very distinct historical phases: (1) museum-based studies of coral collections from early expeditions of discovery, (2) in-situ studies using scuba which led to a global unification, and (3) molecular studies which are currently offering new insights into species phylogenies (Veron, 2013). The biogeography associated with the first of these phases was, of necessity, confined to the generic level and represented by contour maps (Wells, 1954; Rosen, 1971; Stehli and Wells, 1971; Coudray and Montaggioni, 1982; Veron, 1986). These maps differ in detail but not in essence; all indicated that the central Indo-Pacific and the Great Barrier Reef of Australia, was the global center of coral diversity. By the early 1990s, developments in coral taxonomy toward a single global coverage allowed these generic distributions to be replaced by species distributions. By that time extensive revisions by several taxonomists using scuba had been completed for the eastern and western coasts of Australia (summarized by Veron and Marsh, 1988; Veron, 1993, respectively), the Philippines (summarized by Veron and Hodgson, 1989) and Japan (Veron, 1992) as well as global studies of specific taxa including Hoeksema's (1989) revision of the Fungiidae. Biogeographic aspects of these revisions were then integrated with a somewhat patchy coverage of other Indo-Pacific studies by Veron (1993), a step that initiated the development of Coral Geographic as a global electronic database.
Species-level diversity data from Coral Geographic were first published by Veron (1995), a study essentially affirming the overall diversity pattern of previous publications but with one major exception; it showed that the Great Barrier Reef was, in fact, not part of the global center of diversity as earlier publications indicated. This finding created widespread consternation among conservation agencies because the Great Barrier Reef, by then given World Heritage status and managed by a major Australian Government agency, had long been assumed to offer permanent protection for the world's center of coral diversity. The alternative that this study indicated was that few of the world's mega-diverse reefs occurred within a marine park and none had any effective protection. Worse, these reefs were believed to be confined to the Indonesian-Philippines archipelago, a region characterized by high population pressures and a record of reef exploitation. It is well-known history that these concerns soon precipitated one of the biggest information quests in the history of marine biology—to delineate the global center of coral diversity, a region that became known as the “Coral Triangle.”
By this time, a single broadly cohesive coral taxonomy had become firmly established and well-supported species-level distribution maps were generated by Coral Geographic (in Veron, 2000). In consequence, these volumes combined with an electronic identification guide (Veron and Stafford-Smith, 2002) gave impetus to field studies throughout the Indo-Pacific, a movement strongly promoted by increasing awareness that mass bleaching events were seriously impacting coral reefs (Glynn, 1984, 1991; Brown, 1997; Berkelmans and Oliver, 1999; Hoegh-Guldberg, 1999 and others).
Importantly as far as the Coral Triangle was concerned, the quest for its delineation revealed that the center of coral diversity was not just the Indonesian-Philippines archipelago, but that the center extended east to the reefs of eastern Papua New Guinea and the Solomon Islands.
Political response to the final delineating of the Coral Triangle was prompt. In September 2007, 21 world leaders attending the Asia Pacific Economic Cooperation (APEC) summit in Sydney recommended the establishment of the Coral Triangle Initiative, a move endorsed by the Indonesian Government and launched at the United Nations Framework Convention on Climate Change, Bali in December of that year (Veron et al., 2009a). Up to and since that time there have been many scientific publications and several popular books about the Coral Triangle (in Hoegh-Guldberg et al., 2009), deeply entrenching its position not only as the global center of coral diversity but as the center of diversity of most major groups of tropical marine taxa, a fact earlier elucidated by Gerald Allen from his many publications about coral reef fishes.
Curiously, despite the extraordinary level of scientific, political and popular interest about the Coral Triangle, the detailed data by which it was delineated has not been published. This is largely because the volume of information needed to do so necessitated an electronic medium, a need only now being met by Coral Geographic, a major component of www.coralsoftheworld.com, of which this article is an overview. Nevertheless, this article has a broader objective, which is to provide a definitive description of fundamental global patterns of coral distributions and diversity worldwide.
In so doing, it cannot be overstressed that corals are under enormous threat from climate change with the horrific prognosis that reefs, and the corals that build them, will progressively deteriorate during this century with the real possibility of Scleractinia facing partial or total extinction (Guinotte et al., 2003; Hoegh-Guldberg et al., 2007, 2009; Baker et al., 2008; Carpenter et al., 2008; Veron, 2008; Veron et al., 2009a,b and others). The present publication is not intended to address this deterioration nor review future prognoses, but rather to provide a biogeographic template for investigating these processes.
The organizational basis of Coral Geographic is 150 ecoregions (Figure 1), an effective methodology (Spalding et al., 2007; Green and Mous, 2008) where each ecoregion has a known internal consistency and significant external differences from other ecoregions. This system, with periodic refinement, was initiated in 1997 and has been the source of extensive mapping of coral distribution and diversity ever since.
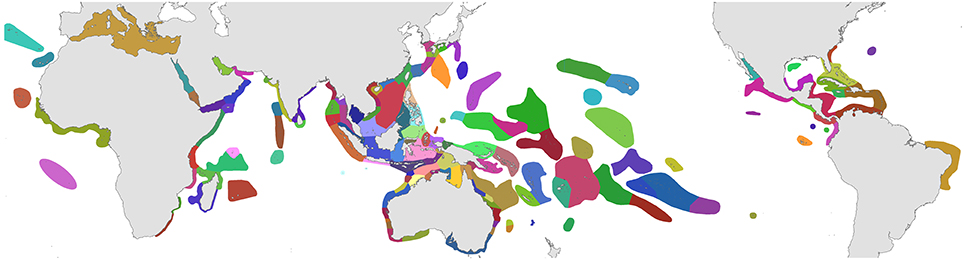
Figure 1. Ecoregions of corals used in the present study. Ecoregions of the Coral Triangle generally accord with Green and Mous (2008). For coral biogeographic references consulted, a brief description, and numbers of species in each ecoregion, see Supplementary Material 1: “List of ecoregions and associated data.”
Methods
Comprehensive accounts of Indo-Pacific species distributions require extensive taxonomic knowledge as well as time and funding. Field work by the present authors has taken 119 expeditions and over 20 person/years of expert effort. Even so, this level of commitment has resulted in comprehensive coverage of only about half the world's coral ecoregions. Thus, our data has been extensively augmented by the array of information sources indicated in Supplementary Material 1 and Acknowledgments. In summary, data detailed in the Corals of the World website were obtained as follows.
Data Sources
1. Original fieldwork. The geographic coverage of studies undertaken by the authors are indicated in dark green in Figure 2 and itemized in Supplementary Material 2 “Summary of original fieldwork by the authors.” This includes (a) comprehensive studies of 4507 stations in 50 ecoregions, (b) incomplete field studies targeting specific taxa of 248 stations in 18 ecoregions and (c) transitory field observations of 186 stations in 13 ecoregions. This fieldwork was sometimes undertaken concurrently by one of us with our associates on the same expedition and sometimes on different expeditions as time and opportunity allowed. In total, our coverage to 2013 has involved 4941 stations in 85 of the world's 150 ecoregions after separate studies in the same ecoregion are combined.
Each station typically involved between 1 and 5 scuba dives depending on the nature and extent of the work being undertaken. Where available, local knowledge and/or satellite imagery were used to select sites of greatest diversity in unfamiliar ecoregions and additional stations were then selected to include habitats with different substrate types, depth, current regimes and levels of exposure to wave action. With rare exception, fieldwork was undertaken via expeditions specifically dedicated to taxonomic and abundance studies. Importantly, inter-observer taxonomic issues were minimized through shared fieldwork and extensive checking of specimens and underwater photographs.
2. Taxonomic literature. Many taxonomic monographs stemming from early expeditions of discovery provide little insight into coral distributions. There are others, however, pre-dating the age of in situ studies which are more elucidating, especially those linked to the generic-level biogeographic publications noted above. Most taxonomic publications subsequent to that time provide geographic records and in total over 1000 taxonomic publications contribute to the Coral Geographic database.
3. Biogeographic literature. This is smaller in terms of number of publications and is variable in quality. In principal, species names in any biogeographic publication are only useful if they can be associated with entities that are recognizable in the field. Species which are not recognizable (unstudied “nominal” species) are not included in this study, nor are unverified records used which cannot be attributed to a recognizable species. See Supplementary Material 1 “List of ecoregions and associated data” for principal biogeographic references consulted for each ecoregion. Those not included have either been superseded, include only species that are already recorded by listed authors, do not present credible records, or are among a few that have yet to be entered into Coral Geographic.
4. Ecological literature. Studies involving individual species or groups of species in surveys of mass bleaching, Acanthaster outbreaks, disease and other species-specific research have been taken into account in the present study where authors are known to have appropriate identification skills.
5. Collections. Veron's collection of approximately 28,000 specimens originally held at the Australian Institute of Marine Science and subsequently moved in part to the Museum of Tropical Queensland, Australia included voucher specimens of species under taxonomic review collected from ecoregions shown in green in Figure 2 as well as extensive contributions from other ecoregions from colleagues. However, since the mid-1990s, restrictions due to the Convention on International Trade in Endangered Species (CITES) have made such specimen transfers increasingly problematic and many collections remain in their country of origin even though some have no facilities for their long-term curation.
Coral collections in 48 museums and research institutions were studied for both taxonomic and biogeographic purposes, see Acknowledgments. Collections specific to well-studied regions, especially in the Philippines, Australia and Japan, have proven particularly valuable for such purposes.
6. Photography. In situ photographs of some genera, notably Porites and Montipora, are seldom helpful for species recognition, but many records of other taxa have been suggested or confirmed by photographs. More than 90 photographers are cited on the Corals of the World website with the number of identifiable photographs from each varying from one to several hundred.
7. Personal communications. This has been an extensive and much valued source of records and verification of records, see Acknowledgments.
Despite the extent of all these information sources it is stressed that they can never be up-to-date let alone complete, especially for ecoregions that remain poorly known or are currently under study, see Discussion.
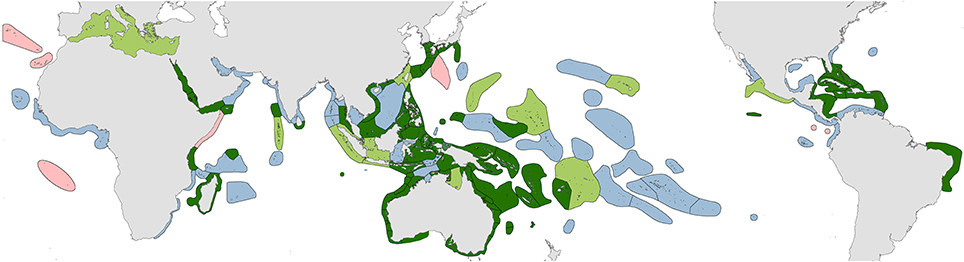
Figure 2. Distribution of original studies by the authors. Dark green, detailed original field studies leading to species inventories; pale green, original but incomplete field studies, mostly of specific taxa; blue, studies of collections; pink, unstudied ecoregions.
Ecoregion-Based Data
Pre-assessed data from combined sources (above) were collated into ecoregion-specific files that compared the various sources and highlighted potential anomalies for further scrutiny. This process, through many reiterations, progressively narrowed decision-making to the point where additional data searches specifically targeted individual species. All data were scored as “no record,” a “confirmed record,” a “strongly predicted” record or a “published record considered by the authors to warrant further investigation.” All records were transferred to a mapping platform and accessed through a custom-built website; Figure 3 is a typical example of a species map. For the purposes of analyses, strongly predicted and confirmed data points are combined. Any data not meeting at least “strongly predicted” standards are excluded (see “Data reliability” below for justification). Strongly predicted records for individual species in individual ecoregions were only added if all the following conditions were met: (a) the species was present in one or more immediately adjacent upstream ecoregions, (b) all known habitat requirements of the species were present, and (c) there were no known reasons (such as environment degradation) for the species not to be present. The inclusion of strongly predicted records is thus both highly intuitive and conservative and these have an essential role in the analyses below. They vary greatly among ecoregions so that at one extreme few records are confirmed and 85% or more are strongly predicted (5% of ecoregions) and at the other extreme (60% of ecoregions) have <15%, if any, strongly predicted records because they have been well studied and most records have been confirmed. The south-west coast of the Indonesian island arc is poorly known compared with the rest of Indonesia and the use of strongly predicted records for remote reefs of the south Pacific is relatively speculative because pathways of ocean surface currents are both weak and variable in direction. In addition, previously confirmed records were downgraded to strongly predicted where recent taxonomic, identification, or data quality queries had been identified that were not sufficiently significant to exclude the species at this time.
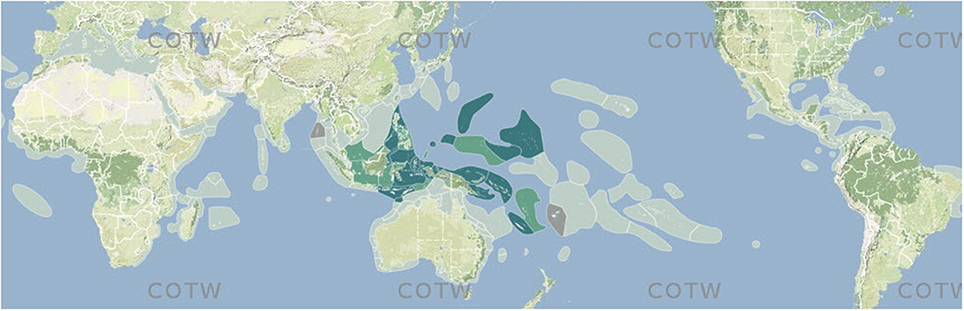
Figure 3. Example of a species map from Corals of the World. Off-white, no record; dark green, confirmed record; pale green, strongly predicted record; tan, published record that warrants further investigation.
Species-Specific Data
Just as ecoregions have far from equal coverage, so have species. Records of all species, irrespective of the ecoregion in which they were recorded, were attributed to one of the following three categories of data robustness. (1) Data robust species have highly indicative distributions where within-ecoregion records are suitable for detailed assessment and where gaps within the overall distribution range are more likely to be due to non-occurrence (in well-studied ecoregions) rather than missing records. (2) Data incomplete species have indicative distributions where gaps within the overall range may have any number of causes including, for example, missing records and non-occurrence. Quantitative assessments of these two groups of species include both confirmed and strongly predicted occurrences in ecoregions as described above. (3) Data deficient species have poorly known distributions which may be due to taxonomic or identification difficulties, rarity or where the species occurs in seldom visited habitats. Species that have been described or validated after Veron (2000) may also have poorly known distributions.
In total, our data currently consist of 845 species of which 567, 170, and 108 belong to data robust, data incomplete and data deficient categories, respectively. Details are given in Coral Geographic.
Except for the global pattern of diversity, all analyses below exclude species and within-ecoregion records belonging to the data deficient category.
Data Reliability
It is emphasized that this study has had to confront a wide range of data quality issues, both taxonomic and geographic. Coral Geographic gives details on both these subjects yet both constantly change with new information. Table 1 indicates the principal issues and our response to them. This overview should therefore be viewed as a hypothesis, one well-grounded in detail yet containing significant areas of doubt. Some of the following issues are raised elsewhere in this publication.
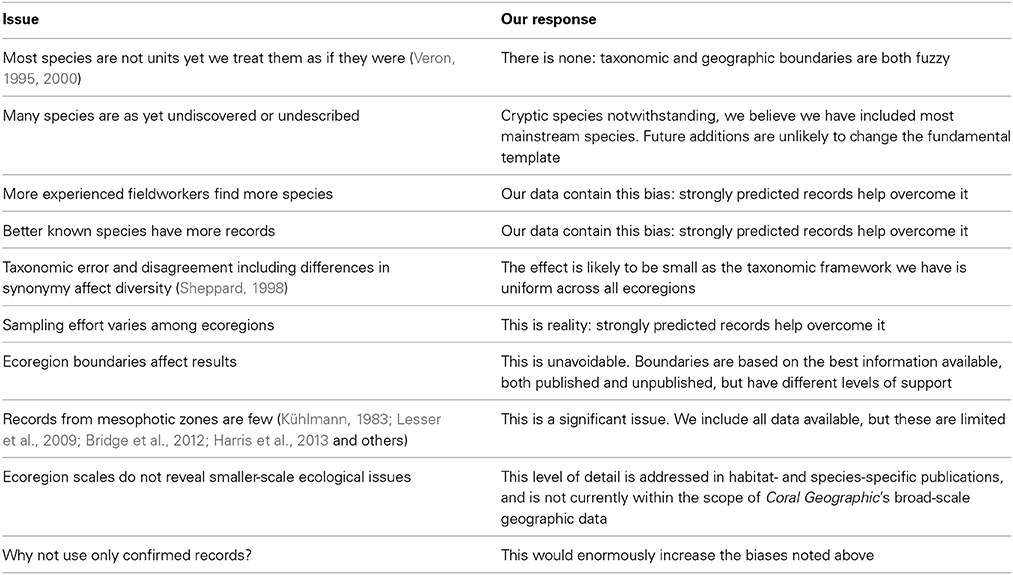
Table 1. Core issues and how they are managed in this publication.
Analyses
This study differentiates between patterns of species diversity (meaning species richness) where the identity of species is not necessary (Figures 4, 17), and patterns of species affinity where it is (all other figures).
Figure 4, global diversity, was calculated by adding all records of occurrence (the addition of all species maps) using ArcMap 10.2.1 (ESRI, 2013).
Dendrograms of affinity (Figures 5–14) were carried out in XLSTAT using the Dice coefficient (which ignores negative co-occurrence) and unweighted pair group averages. Additional explanation of analytical protocols where relevant are given in the figure captions. In order to reduce information noise, all analyses of affinity exclude four outlying ecoregions: the Mediterranean (4 species), Christmas Island (which is isolated and where there is little original data), the Madeira Islands (4 species, also isolated) and North Florida to Carolina (6 species).
Figure 15, showing geographic ranges and Figure 16, showing numbers of confirmed and strongly predicted Indo-Pacific species richness, were both generated by Excel directly from the Coral Geographic database.
Figure 17, centroid positions (meaning the center of gravity of each ecoregion polygon) were calculated (in two dimensions, longitude and latitude) by averaging the coordinates of all of vertices along the perimeter of each polygon. Centroid calculations were performed in ArcMap 10.2.1 (ESRI, 2013) on spatial layers displayed using a WGS84/PDC Mercator projection.
Figure 18, levels of endemism in the central Indo-Pacific, were calculated by the endemism richness index (Crisp et al., 2001; Kier and Barthlott, 2001; see Casagranda et al., 2012 for comparison with other methods of describing endemicity). For each ecoregion in which a species occurs, the ecoregion x species cell value is calculated from the proportion of the species' total number of occurrences. For example, if a species is endemic to an ecoregion (does not occur elsewhere) it has a value of 1 for that ecoregion. If a species also occurs in 99 other ecoregions, the value becomes 1/100 or 0.01 for that ecoregion. Values for all species in each ecoregion are then summed. Since endemism is correlated with the absolute number of species in an ecoregion, the endemism richness index is then corrected by the ecoregion species richness to give the corrected endemism richness index shown in the figure (Crisp et al., 2001).
Results
Some observations made below go beyond data indicated in the diagrams; details are in Coral Geographic.
The Global Pattern
The pattern of global diversity (Figure 4) is similar to that of Veron (2000) with the epicenter of diversity in the Coral Triangle. Secondary centers occurring in the Red Sea and in the region of northern Madagascar are now identified.
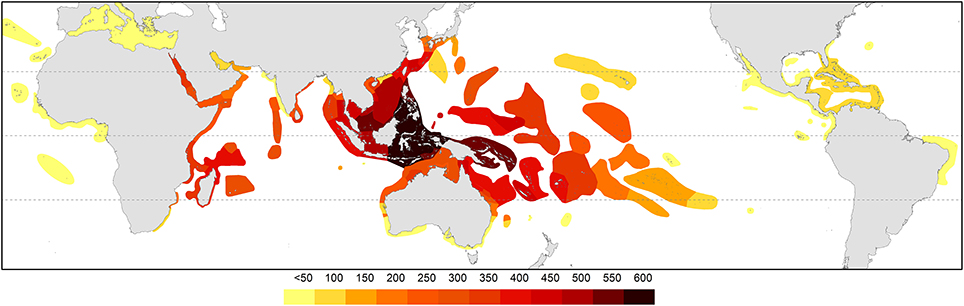
Figure 4. Global diversity indicated by all records of occurrences. Diversity values were derived from GIS layering of all species maps.
Global affinities of ecoregions (Figure 5) show three well-defined provinces within the Atlantic. However, delineation of provinces within the Indo-Pacific is somewhat arbitrary. Further details are given below.
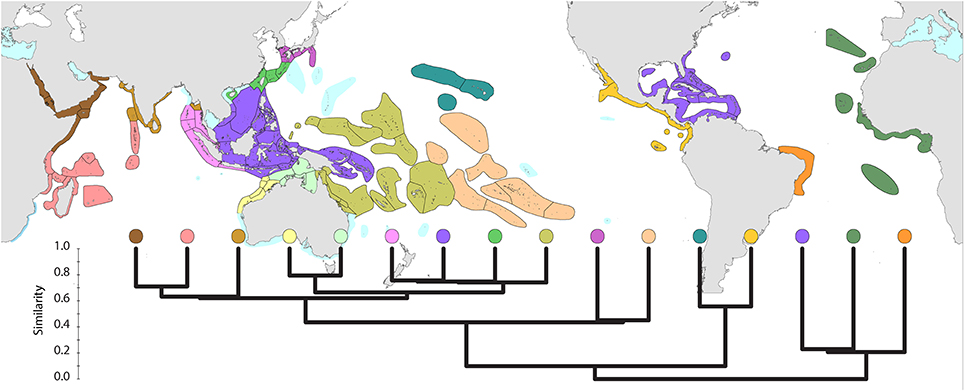
Figure 5. Global pattern of affinity truncated at the highest 22 divisions in order to provide clarity. Note (a) that excluded ecoregions (colored pale blue) are included in relevant regional diagrams below and (b) that the similarity scale indicates the position of nodes only. Each tine above these nodes represents ecoregions of matching color.
Regional Patterns
In addition to this general template, there are three regions characterized by latitudinal attenuation (or “species drop-out”) along the path of major continental boundary currents: the Kuroshio from the Philippines to mainland Japan, the Leeuwin Current of west Australia, and the East Australian Current.
The central Indo-Pacific
The Coral Triangle (Figure 6) is at the heart of global coral distributions with a band from the Sulu Sea to the “Bird's Head” at the western-most point of New Guinea being the global center of diversity of corals (see Figure 4) as well as many other marine taxa (Veron et al., 2009a). This region, delineated by Veron et al. (2009a), is divided into two groups of ecoregions, the main group in the west and three ecoregions to the east. The level of similarity of ecoregions within the main group is so high that the whole region almost qualifies as being one large ecoregion, similar in this respect to the Caribbean.
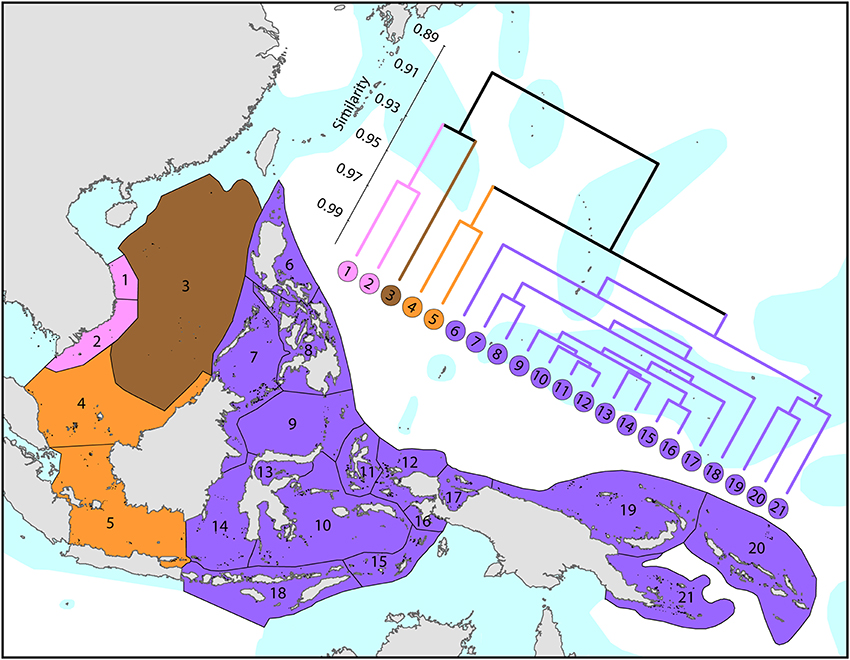
Figure 6. Affinities of ecoregions in and adjacent to the Coral Triangle. This dendrogram was produced by the progressive exclusion of outlying ecoregions; there were no internal exclusions. See Supplementary Material 1: “List of ecoregions and associated data” for number of species within ecoregions.
On a broader scale (Figure 7), the Coral Triangle, with 627 species in total, is only weakly delineated from surrounding ecoregions as Veron et al. (2009a) noted. Of the latter, the coral fauna of the Java Sea (numbered 5) and the Sunda Shelf (numbered 4) is very similar to those of the Coral Triangle. The ecoregions from South China Sea and Vietnam also have a close affinity with the Coral Triangle but the diversity is lower. Of conservation importance, these high diversity ecoregions to the west have 7 species not found in the Coral Triangle.
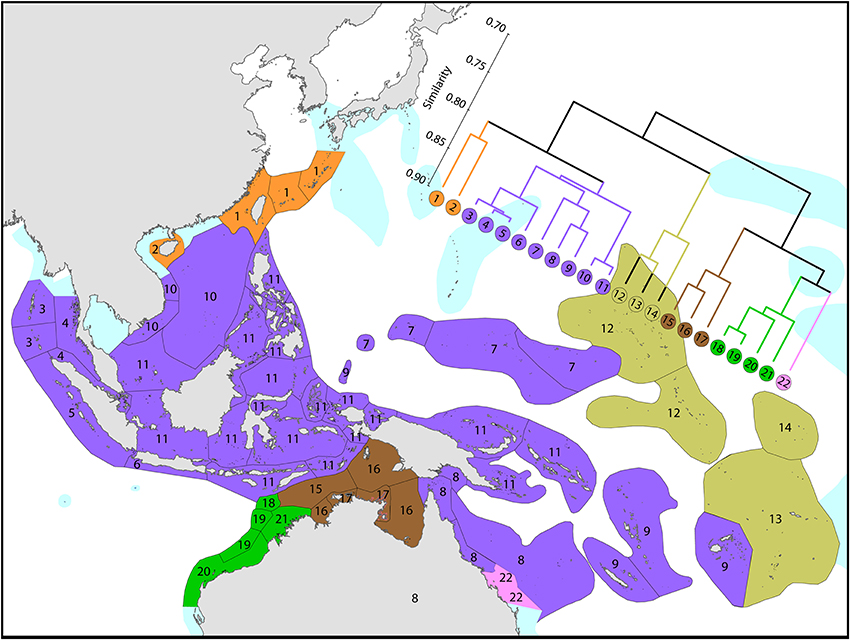
Figure 7. Affinities of ecoregions in and around the Central Indo-Pacific. This dendrogram was produced by the progressive exclusion of outlying ecoregions; there were no internal exclusions. See Supplementary Material 1: “List of ecoregions and associated data” for number of species within ecoregions.
Diversity and affinity both decrease with distance in all directions from the Coral Triangle, but do so at unequal rates. To the west the ecoregions from Sumatra to the Andaman Sea retain substantial affinity with the central Indo-Pacific. These have been the subject of several recent reports although our data do not currently support claims of very high diversity in the Andaman and Nicobar islands. A majority of Indian Ocean species are found in the central Indo-Pacific with only approximately 2–3% of Indo-Pacific species restricted to the Indian Ocean. The fauna of NW Australia (numbered 18–21) is clearly delineated from that of the Coral Triangle (see also Figure 9).
Attenuation to the north and south
To the north (Figure 8), the Kuroshio, one of the world's strongest boundary currents, clearly creates the pattern of diversity illustrated.
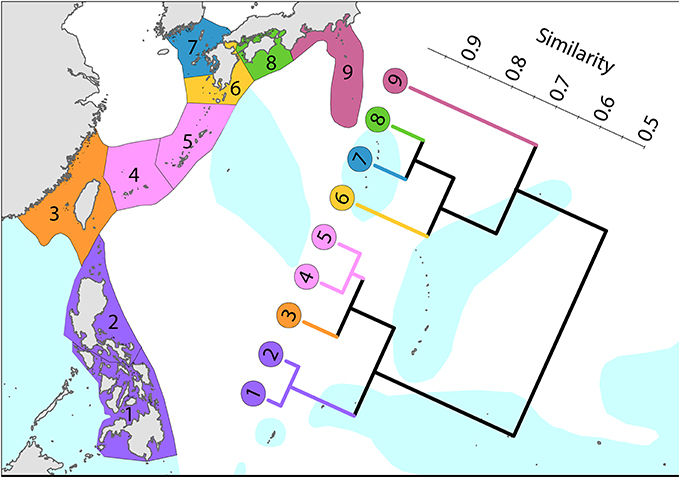
Figure 8. Latitudinal attenuation of affinity and diversity of ecoregions along the path of the Kuroshio. Ecoregions in the Coral Triangle (numbered 1 and 2) are strongly delineated from other ecoregions. Ecoregions to the north with coral reefs (numbered 3–5) are strongly delineated from those without reefs (numbered 6–9). Ecoregions excluded (Hong Kong, Ogasawara and Okinotorishima) are outliers in this classification. Hong Kong is very depauperate and the Japanese locations are peripheral to the core of the Kuroshio. See Supplementary Material 1: “List of ecoregions and associated data” for number of species within ecoregions.
Coral affinities of all tropical Australian reefs are sharply differentiated from the Coral Triangle, the separation being due to the shallow turbid water as well as the strong tidal regimes of the Timor Sea. The corals of the west Australian coast (Figure 9) have a marginally lesser affinity with the Coral Triangle than those of the northern Great Barrier Reef (Figure 10).
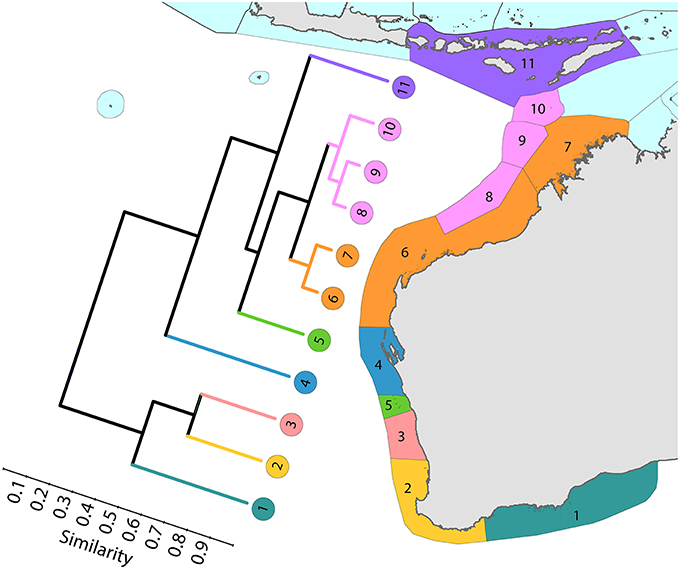
Figure 9. Latitudinal attenuation of affinity and diversity of ecoregions along the path of the Leeuwin Current. The primary divisions in the dendrogram are between the Lesser Sunda Islands of the Coral Triangle (numbered 11), the offshore reefs of NW Australia (numbered 8–10), the coastal reefs of NW Australia (numbered 6 and 7), subtropical reefs (numbered 4 and 5) and temperate non-reef ecoregions (numbered 1–3). See Supplementary Material 1: “List of ecoregions and associated data” for number of species within ecoregions.
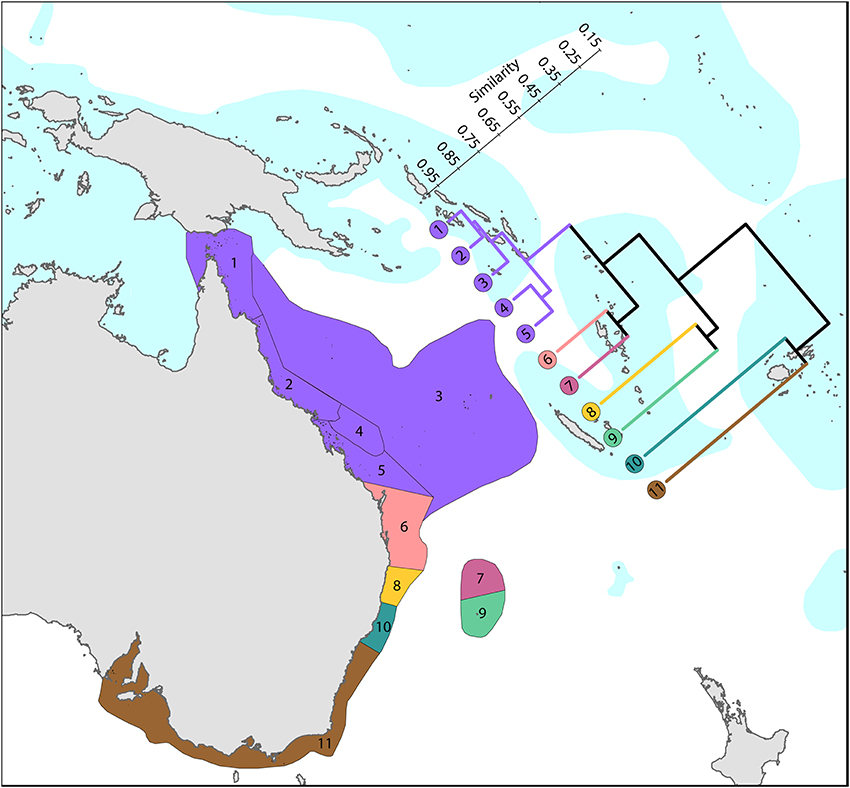
Figure 10. Latitudinal attenuation of affinity and diversity of ecoregions along the path of, or under the influence of, the East Australian Current. The two southern coastal ecoregions (numbered 10 and 11) are depauperate outliers whilst the Solitary Islands (numbered 8) groups with ecoregions which have reefs, reflecting their nearshore location. The ecoregions of the Great Barrier Reef (numbered 1, 2, 4, and 5) show a weak latitudinal attenuation. See Supplementary Material 1: “List of ecoregions and associated data” for number of species within ecoregions.
Harriott and Banks (2002) give a useful analysis of latitudinal variation of eastern Australian corals, which remains relevant with updated material provided here.
The central and western Indian Ocean and Red Sea
Ecoregions of this region (Figure 11) are divisible into four groups:
1. The Red Sea and nearby ecoregions, numbered 13–17. The northern Red Sea has the northernmost consolidated coral reefs in the world, reef development being limited by the geographic extent of the Red Sea, not by temperature as are the northernmost reefs of Japan. The Red Sea has a similar diversity to ecoregions to the south and has the highest level of endemism in the Indian Ocean region. The number of species in the northern and southern Red Sea is similar (305 and 302′ respectively) although compositions are marginally different probably due to differences in the ranges of habitats. Thus, of the 340 species found in the Red Sea, 333 occur elsewhere; the remainder are endemics. Species attenuate abruptly from this peak to ecoregions in and around the Gulf of Aden. The Gulf of Aden, especially the north coast, has few reefs due to the influence of cold upwelling, a major barrier to distribution as is the shallow water of the entrance to the Red Sea which forms a complete barrier during intervals of low sea levels during deep glacial cycles, as noted by Sheppard et al. (1992) and many geological publications. The east Somali coast, the Socotra islands and Yemen (numbered 13–15) are also affected by monsoonal upwelling although the north coast of Socotra has a relatively high diversity.
2. Southern hemisphere ecoregions of high diversity, numbered 3–10. This is the Indian Ocean center of diversity which most of the historic contour maps, mentioned above, vaguely indicated. The northern and southern Seychelles have substantially different faunas to each other as they are dominated by fringing reefs of continental islands and atolls, respectively. The Mascarene Islands (numbered 10) have near-shore fringing reefs but a lesser habitat diversity than other ecoregions of this group.
3. Chagos and the Maldives. Chagos archipelago (numbered 12) acts as a crossroad, called the “Chagos Stricture” by Veron (1995), between the east and west Indian Ocean with no known endemics, Ctenella chagius having been found in the Mascarene Islands and Madagascar. The Maldives (numbered 11) and Chagos Islands have closer affinities with the west than with the higher diversity ecoregions to the east which come into the range of influence of the Coral Triangle.
4. Higher latitude ecoregions of low diversity. Two ecoregions on the south-east African coast (numbered 1 and 2), two in the northern gulfs (numbered 21 and 24) and those on or near the coast of India (numbered 19, 20, 24, and 25) have relatively lower diversities. The Agulhas Current controls latitudinal attenuation along the south-east African coast but as it forms gyres rather than a unidirectional flow it does not create a clear latitudinal attenuation in the Mozambique Channel. Both the Arabian Sea monsoonal upwelling and the impact of harsh continental climates contribute to the isolation of the northern gulfs.
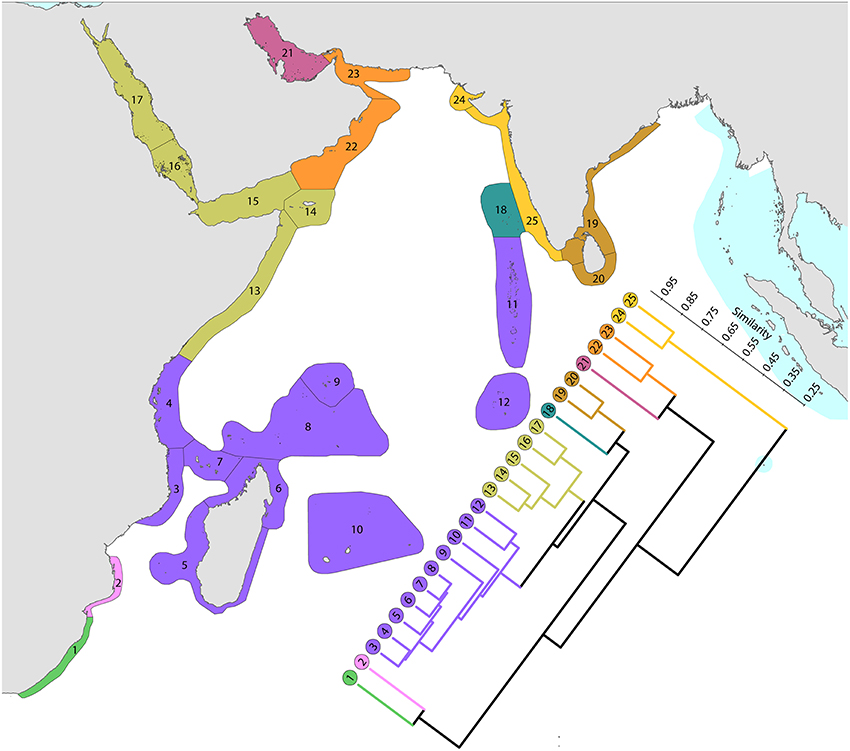
Figure 11. Affinity and diversity of ecoregions of the western Indian Ocean and Red Sea. This dendrogram was produced by the progressive exclusion of outlying ecoregions; there were no internal exclusions. See Supplementary Material 1: “List of ecoregions and associated data” for number of species within ecoregions.
Oceanic central and western tropical Pacific
This province is divisible into two main sub-provinces, each with outlying ecoregions (Figure 12).
1. Western Pacific. The westernmost ecoregions (numbered 1–14) have affinities with the Coral Triangle of which ecoregions numbered 2–4 are a part. Revisions of the corals of Marianas Islands (numbered 1) currently being undertaken may reveal closer affinities with neighboring ecoregions to the south than indicated here.
2. Central Pacific. Ecoregions of the central Pacific (numbered 15–21) are distinct from all others but have distant affinities with each-other. Some of these are among the least well studied ecoregions in the world with affinities and diversities known so far being only tentative.
3. Pitcairn Island group. These islands have relatively distant affinity to others in the region.
It should be noted that surface currents throughout this region are weak and non-directional compared with most other parts of the Indo-Pacific so that genetic connectivity is also likely to be weak.
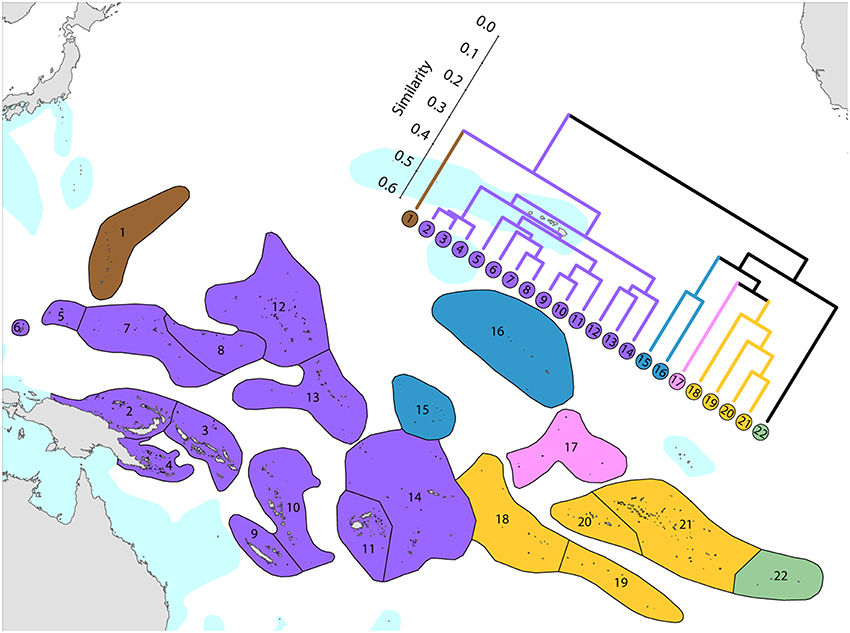
Figure 12. Affinity and diversity of ecoregions of the central and western tropical Pacific. Ecoregions in the Coral Triangle (numbered 2–4) are strongly differentiated from other ecoregions. This dendrogram was produced by the progressive exclusion of outlying ecoregions; there were no internal exclusions. See Supplementary Material 1: “List of ecoregions and associated data” for number of species within ecoregions.
Central and far eastern Pacific
Ecoregions of this region (Figure 13) are divisible into three main groups and three outlying ecoregions.
1. Central Pacific. The core group (numbered 4–10) is included in order to provide context for other ecoregions.
2. Far eastern Pacific. These ecoregions (numbered 14–21) have been well studied and form a highly distinctive group. Numbers of species are limited with a total of 36 for the region, ranging from 12 to 26 per ecoregion.
3. Hawaii and Johnston Atoll. These ecoregions have been well studied and form a depauperate highly isolated group totaling 72 species and hosting regional endemics, see below.
4. Outlying ecoregions. The Marquesas Islands (numbered 11) are poorly known. Clipperton Atoll (numbered 12) has been well studied and is an outlier because of isolation and very low diversity (11 species). Easter Island (numbered 13) is also very isolated and depauperate (14 species), with no true reef development.
All but five species of the far eastern Pacific occur in the central Pacific suggesting that a wide variety of taxa are capable of very long distance dispersal. The five that do not occur in the central Pacific have most likely gone extinct or have yet to be found there as they are unlikely to have survived glacial conditions in the east.
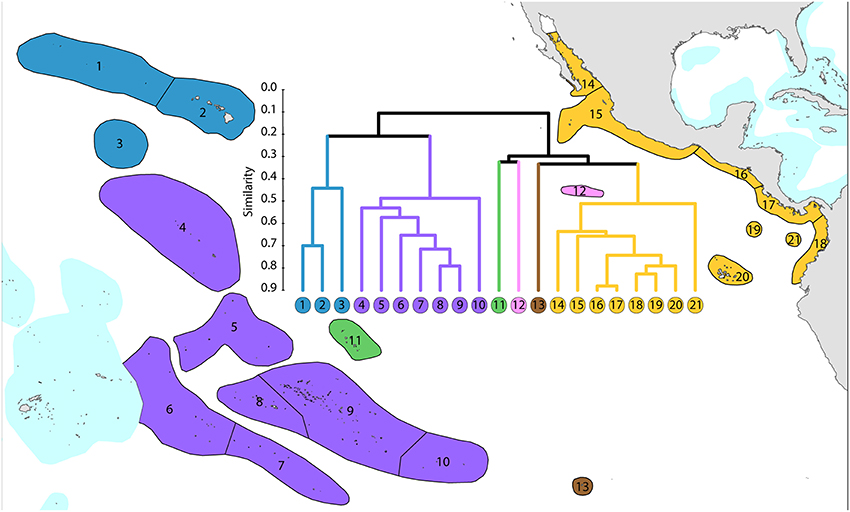
Figure 13. Affinity and diversity of ecoregions of the central and far eastern Pacific. This dendrogram was produced by the progressive exclusion of outlying ecoregions; there were no internal exclusions. See Supplementary Material 1: “List of ecoregions and associated data” for number of species within ecoregions.
The Atlantic Ocean
This study re-affirms that there are no species in common between the Atlantic and Indo-Pacific. The level of similarity of ecoregions within the Caribbean, numbered 2–7, Figure 14, is so high that the whole region arguably qualifies as being one large ecoregion and what differences there are may well be due to incomplete records or recent local declines or extinctions (Gardner et al., 2003 and others). Except for the south-west Gulf of Mexico (which has similar fauna to the Caribbean), northern Florida and the Flower Gardens in the northern Gulf of Mexico (which have no shallow reef habitat), the affinities and diversities of ecoregions at increasing distance from the Caribbean are attributable to isolation. Exceptions are the two species of Schizoculina which are endemic to the west African coast and the corals of Brazil which include the three species of Mussismilia and Favia leptophylla, arguably the only genuine Favia of the Atlantic (Veron, 2013). All ecoregions outside the immediate vicinity of the Caribbean have relatively low affinities with each-other.
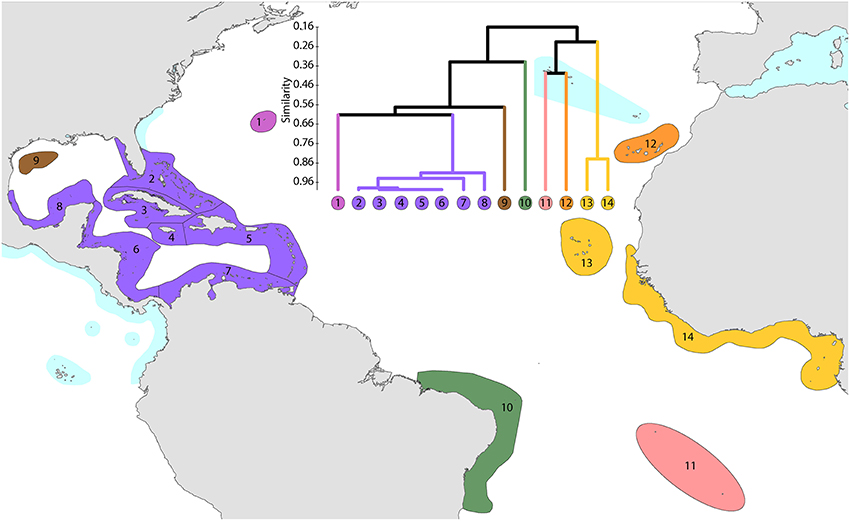
Figure 14. Affinity and diversity of ecoregions of the Atlantic Ocean. This dendrogram was produced by the progressive exclusion of outlying ecoregions; there were no internal exclusions. See Supplementary Material 1: “List of ecoregions and associated data” for number of species within ecoregions.
Distribution Characteristics of Species
When detailed maps of Corals of the World (of which Figure 3 is an example) are combined they show the following general characteristics.
Geographic ranges
Because of their capacity for long distance dispersal as well as their geological longevity, a high proportion of species have very extensive geographic ranges (Figure 15). In this diagram, the two tallest (red) columns show that about half of all species occur in temperate latitudes of both hemispheres. Longitudinal ranges are very variable, but nearly half of all species have ranges at least as wide as the Indian Ocean.
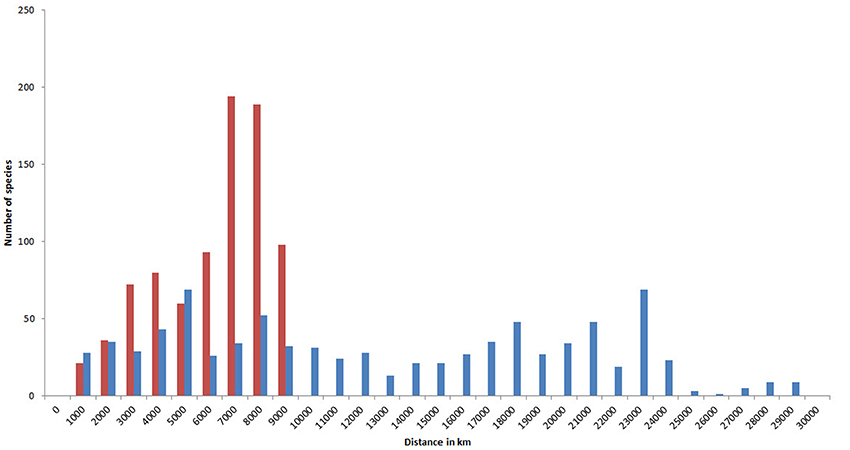
Figure 15. Geographic ranges of confirmed and strongly predicted Indo-Pacific species. Red, latitudinal ranges; blue, longitudinal ranges.
A high proportion of species also occupy a large number of ecoregions, with 270 occupying over 50% of all Indo-Pacific ecoregions (Figure 16).
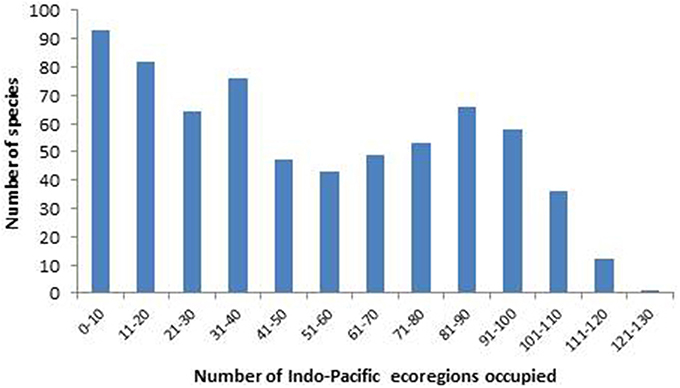
Figure 16. Number of confirmed and strongly predicted Indo-Pacific species in ecoregions.
Latitudinal attenuation
Latitudinal attenuations along three of the Indo-Pacific's continental boundary currents (illustrated by Figures 8–10) create a biogeographic template second in importance only to the existence of the Coral Triangle. These patterns are influenced by high-latitude endemics, but unlike most other major taxa they are primarily due to latitudinal extension of tropical species rather than replacement of tropical by temperate species.
Amphitropical distributions
These are disjunct distributions where species occur sub-tropically both sides of the tropics. They have most commonly been recorded in fish and have attracted many evolutionary explanations. This study reinforces the conclusion that coral species do not show amphitropical patterns, but if Australian endemic species are discounted, high latitude Japanese and Australian ecoregions form a cluster within global patterns of affinity which overrides geographic positions (Veron, 1995). This shows that species found in high latitudes are relatively environmentally tolerant (an implication of “Rapoport's Rule”) although, in contrast to fish, most also occur equatorially.
Centroid positions
Indo-Pacific coral genera have centroid positions (the geographic center of all species within all ecoregion records) near the equator and, except for two genera, have similar longitudinal centroid positions near the center of the Coral Triangle (Figure 17). The two exceptions are Stylophora and Pocillopora. All Stylophora species have ranges extending to the Red Sea whereas Pocillopora has highest diversity in the Pacific.
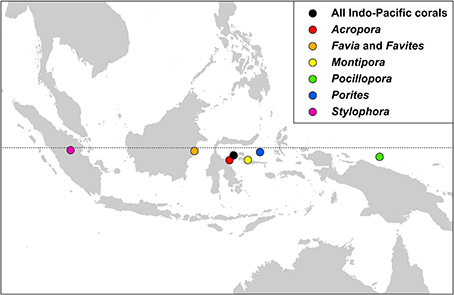
Figure 17. The centroid position of all Indo-Pacific coral records, and those of some major generic groups, see text.
Endemicity
Calculations of endemicity are always dominated by relative area (reviewed by Casagranda et al., 2012) and thus change if the area under consideration is changed. At overview level, the Red Sea (with 7 endemics, or 2.1% of the total) has the highest level of endemism in the Indian Ocean. The Coral Triangle as a whole, with 21 endemics, or 3.35% of the total, has the highest level of endemism of all diverse ecoregions in the world although (as Veron, 1995 noted), the diversity of the region is primarily due to the overlapping of large species ranges as opposed to the presence of large number of endemics (Figure 18). The low levels of endemism in the south Pacific are due to the prevalence of highly dispersed species reaching these isolated locations and thus all ecoregions have low endemicity at species level but probably high endemicity at sub-species levels. These interpretations may change when undescribed species known by the authors to exist in the Coral Triangle and some other ecoregions are factored in. They may also reflect sampling effort within the Coral Triangle.
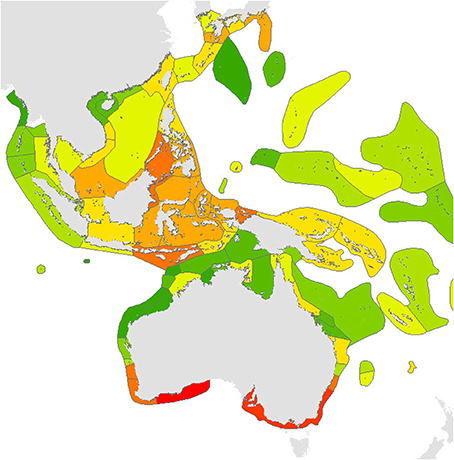
Figure 18. Endemism Index of central Indo-Pacific ecoregions calculated by the methodology of Kier and Barthlott (2001) and Crisp et al. (2001). Deep red = highest levels of endemism intergrading to dark green indicating no endemism, see text. It should be noted that the four highest levels of endemism within the Coral Triangle may reflect the amount of fieldwork that these areas have received.
Disjunct distributions
Most of the species recorded by Veron (1995) as having disjunct distributions have now been recorded in connecting ecoregions, but not all. For example, the exceptionally distinctive Catalaphyllia jardinei is known from the northern Philippines but nowhere further north except Kushimoto, mainland Japan. More recently Stylophora kuehlmanni (Scheer and Pillai, 1983) and (less convincingly) Stylophora danae (Milne Edwards and Haime, 1850) have both been reported in the Philippines (Licuanan and Capili, 2004), species previously known only in the western Indian Ocean where they are distinctive. Most such occurrences are likely to reflect relict distributions; others may be due to recent dispersion.
High latitude ecoregions
In general (and except for the central and southern Pacific), ecoregions in high latitudes have less similarity with their nearest neighbor than ecoregions of the tropics.
Northern Indian Ocean. There is little or no development of consolidated reefs in all these outlying ecoregions (Persian Gulf, Gulf of Oman, Gulf of Kutch, Bangladesh, north Myanmar and Gulf of Martaban) and species compositions are mostly made up of those that are both widespread and commonly found in high latitude locations elsewhere plus a small number of regional endemics. All species in these ecoregions occur in reef as well as non-reef habitats.
High latitude Australia. There is no reef development in the ecoregions numbered 1–3 in Figure 9 and 8, 10, and 11 in Figure 10, see Supplementary Material 1: “List of ecoregions and associated data.” The coral fauna of these ecoregions form a distinct group (not illustrated) which have closest affinity with that of the Kermadec Islands where there is also little or no reef development.
High latitude Japan. There is little or no consolidated reef development in the ecoregions of mainland Japan, see Supplementary Material 1: “List of ecoregions and associated data” and the coral fauna is strongly differentiated from ecoregions to the south (Figure 8). Except for the presence of endemic species this fauna has closest affinity with high latitude fauna of Australia (not illustrated, see “Amphitropical distributions” above) and has more distant affinities with low diversity ecoregions of the central Pacific (Figure 5) although this association is tentative.
Discussion
The long history of development of Coral Geographic to its point of publication has created significant issues for both users and the present authors. The necessity of delineating the Coral Triangle before the amalgamation of all relevant records was completed, let alone published, has meant that the process has had to be reiterated here. Likewise, IUCN's production of a coral Red List (Carpenter et al., 2008, co-authored by three of the present authors) went ahead of necessity using unfinished mapping. It is now common to see two maps of the same species being compared (for example by Brainard et al., 2011) when both are re-worked versions of the same original maps accredited to different sources. In fact digitized versions of Veron (2000) maps were shared with those authors who asked for them and re-digitized by others who didn't. Some authors have considered these maps to be public domain information and others, with minor modification, have claimed them to be their own work. Given the level of taxonomic knowledge and the effort required to build detailed species maps (described in the Introduction, Supplementary Material 2: “Summary of original fieldwork by the authors,” Acknowledgments) the difference between these categories is readily apparent.
Two points of general concern remain that seriously affect the data quality of all recent coral biogeographic publications. The first is that the thumbnail maps of Veron (2000) reflect coral biogeography and taxonomy of the late 1990s. Therefore, they do not include most studies relevant to the Coral Triangle, nor any species revealed by molecular techniques, nor any fieldwork undertaken during the past 15 years. The second is that of the spectrum of information offered by other websites, the maps of the Ocean Biogeographic Information System (OBIS) contain a high proportion of unsupported records from undisclosed sources and often do not include key records such as type locality. Coral Geographic does not give credence to a website production of the Australian Institute of Marine Science (AIMS) obtained from OBIS or to Hughes et al. (2013). The faunal provinces of Keith et al. (2013), derived from “detailed maps” of Hughes et al. (2013) are unrecognizable in this study.
Finally, we note that several authors have claimed higher diversity than we have recorded for individual ecoregions. In some cases, species remain “possible” candidates for inclusion in Coral Geographic pending further confirmation. However, many of these assertions are derived from a biased use of taxonomic literature, unverified records and inclusion of synonyms.
Regional Studies
On regional scales many biogeographic publications are nothing more than “armchair” repetitions of records from pre-existing sources with little or no value added, a process now enormously aided by data accessibility via the internet. Others are insightful and detailed, reflecting substantial original work. The data used in the latter studies have been shared with us, see Acknowledgments.
Indian Ocean
The early biogeography of corals focused on the Indian Ocean more than any other part of the world, presumably because knowledge of the existence of the Coral Triangle has been a relatively recent development. In a review of the formidable array of the literature of his time, Scheer (1984) found three incremental phases in data development: (1) isolated generic compilations before Wells' (1954) review, (2) the generic compilations of Rosen (1971), and (3) regional compilations after Rosen. However, it was Sheppard's (1987) study based on compilations of species synonymies that produced the first true measures of regional affinities, a study which essentially supported the main conclusion derived from earlier generic contour maps, that there is a high level of contiguous distribution across the Indian Ocean with peak diversity located somewhere in the western southern hemisphere. We now know that the Red Sea almost shares that position, but this study is in agreement with the notion that there is not much provincialism in the Indian Ocean. Obura (2012) has revisited this subject using a fine data grid of surveyed locations south of the Red Sea. His conclusion that the northern Mozambique Channel has the highest diversity is supported by the present study (which includes Obura's records) although patterns of affinity surrounding it may be different.
The Red Sea has a higher than previously recognized species diversity and the highest level of endemism for any species-rich ecosystem in the region. The affinities of ecoregions of the Red Sea region are robust as the region is self-contained by its constricted entrance. The corals and reefs of the Persian Gulf are well documented (most comprehensively by Riegl and Purkis, 2012), central aspects being the notoriously harsh temperature extremes of Persian Gulf waters, severe human-induced degradation and the fact that the region is only flooded during inter-glacial cycles. It should be noted that reef-like (but basically unconsolidated rubble) accumulations are largely confined to the south-east and that the separation of the Persian Gulf and Gulf of Oman significantly depends on where the ecoregion geographic boundary is placed.
The reefs of the east Somali coast are poorly known; most records used in our analysis being predicted, not confirmed (see Methods) although a repeat analysis with lesser constraints on predictions does not change the pattern of affinity shown here. The same cannot be said of the Seychelles (especially the southern Seychelles) and the Mascarene Islands, both of which are likely to have more species than currently recorded. Eastern Madagascar is also poorly known although there is little reef development. In contrast, the north and north-west coasts of Madagascar are confirmed as the western Indian Ocean center of diversity alluded to in early publications.
Central Indo-Pacific
The coral fauna of Australia, the Coral Triangle and Japan has been studied in detail and has been at the core much of the original fieldwork supporting this overview (Figure 2). As there has been an extensive array of original publications and reviews about these ecoregions (see Introduction and Supplementary Material 1: “List of ecoregions and associated data”) only new broad-scale findings are noted here. One such finding is that the global center of biodiversity originally attributed to the Birds Head of western New Guinea now includes the Sulu Sea ecoregion. This may be an artifact of the timing as work on the Bird's Head has not been updated since 2003 and a significant number of undescribed species are now known to occur there. Huang et al.'s (2014) finding of extreme diversity for the “South China Sea” (numbered 3 in Figure 6) is not comparable as it overlaps 12 of our ecoregions of which 3 are in the Coral Triangle. Of more relevance to the Coral Triangle Initiative, the Sunda Shelf (numbered 4 in Figure 6) now qualifies for inclusion in the Coral Triangle and the Java Sea (numbered 5 in Figure 6) is borderline for inclusion.
Western and central Pacific Ocean
The study of Wells (1954) of the corals of the Marshall Islands has had a dominant influence on much of the early taxonomic publications of this region, including the extensive work (published and unpublished) of Maragos especially from the Marshall Islands to Hawaii and the northern Line Islands, and Randall (also published and unpublished) from the Marianas Islands to all Micronesia. It has been a challenge, for all those concerned, to amalgamate all species in these studies within the taxonomic framework of Corals of the World as it is often not possible to simply replace one name with another. The extensive collections of Randall, currently being revised, are likely to assist this amalgamation.
Polynesia and the central Pacific
This is the least well known of all the major provinces. Much of the data presented here, with the exception of American Samoa, Hawaii, Johnston Atoll and the Phoenix Islands, has been obtained from photographic and museum collections. As previously noted, inventories of remote island groups are likely to remain dissimilar as all are isolated and there are significant taxonomic issues with many species. This effort has been significantly aided by recent collections and photography of the corals of the southern Line Islands.
Far eastern Pacific
The question as to how Pacific corals crossed the vast emptiness of the Eastern Pacific Barrier was once much debated until their capacity for long-distance dispersal was recognized. Nevertheless, the separation of the coral faunas west and east of the Barrier is deep, strongly indicating that ocean crossings are very rare events (except for Pocillopora and some other species) where corals are rafted on floating objects (Jokiel, 1990 and subsequent publications). Of the ecoregions indicated in Figure 13, those of Hawaii and Johnston Atoll as well as the Far Eastern Pacific have been well studied, and recent accounts of the biogeography of the province by Glynn and Ault (2000) and others are in general agreement with this study. Likewise is Glynn et al.'s (2007) account of the biogeography of Easter Island corals.
The Atlantic Ocean
The biogeography of this province is well known; the present study confirming previously described patterns.
The Future
Irrespective of data sources and the taxonomic issues that accompany them, the basic question that arises with any biogeographic study is “how closely do the results presented describe the real world”? Our data, in keeping with other field studies of corals, shows that a high proportion of corals are very widely distributed, so widely that genetic cohesion over such a range must be exceedingly weak. Most species of corals show this; it underpins reticulate evolution and the morphological, genetic and geographic fuzziness this concept embraces. Future developments in coral biogeography will increasingly take in molecular determination of species, especially of genera which have species that are difficult to separate morphologically. The latter are highly dependent on the co-occurrence of the species in question whereas molecular studies have no such constraint and will therefore be particularly informative about the diversity of isolated ecoregions, especially those of high latitudes.
Author's Note
www.coralsoftheworld.com is being progressively released to reviewers and testers. Until it is open access, please direct enquiries concerning its content to the corresponding author.
Conflict of Interest Statement
The authors declare that the research was conducted in the absence of any commercial or financial relationships that could be construed as a potential conflict of interest.
Acknowledgments
All data presented in this publication were obtained from the website Coral Geographic, a component of Corals of the World designed and edited by Mary Stafford-Smith in conjunction with Gaia Resources Pty Ltd whose expertise we gratefully acknowledge. We thank Stuart Kininmonth, Claudia Milbredt and Tom Bridge for their work in building prototype maps and Rohan Brooker, Nathan Morris and Susannah Leahy for assistance with data preparation and analysis. Numerous colleagues have been very generous in providing unpublished data and regional taxonomic expertise. With apologies to many not mentioned here we particularly thank Gerald Allen, Francesca Benzoni, Chuck Birkeland, Dave Burdick, Mark Erdmann, Doug Fenner, Zac Forsman, Peter Glynn, Peter Houk, Russell Kelley, Al Licuanan, Ed Lovell, Jim Maragos, Denise McCorry, Moritaka Nishihira, David Obura, Gustav Paulay, Dick Randall, Bernhard Riegl, Charles Sheppard, Julian Sprung, Krishnamoorthy Venkataraman, Mark Vermeij, Rob van Woesik and Ernesto Weil as well as >90 people acknowledged in Corals of the World for allowing us access to their photographic collections. This project has been very fortunate to have had so much support from coral experts around the world.
More people have given time to logistic support than we can record, but special thanks are due to Rupert Ormond, Michael Pearson and the staff of the Ras Mohammed National Park, the National Commission for Wildlife Conservation and Development in Saudi Arabia, Virginie Tiliot and Alain Jeudy of the Eritrea Coastal Marine Biodiversity Program, Catherine Cheung, Malik Abdul-Aziz and the UNDP Socotra Biodiversity Project in Yemen, Ron Johnson and Sibylle Riedmiller in Tanzania, Pierre Vasseur in Madagascar, Alec Dawson Shepherd and John Collie in the Seychelles, Suki Ekartane in Sri Lanka, Gregor Hodgson, Vo Si Tuan and the Nha Trang Institute of Oceanology, IUCN and WWF in Vietnam, Gregor Hodgson, Ed Gomez, Al Licuanan and many other colleagues in the Philippines, Hasnah Ibrahim and Department of Fisheries in Brunei Darussalam, Denise McCorry, Alan Chen and the Agriculture, Fisheries and Conservation Department in Hong Kong, Moritaka Nishihira and many other colleagues in Japan, Tim Werner in Papua New Guinea, Suharsono and the Indonesian Ministry of Sciences, Chris Paporakis, Michael Cortenbach and many other colleagues in Indonesia and Ed Lovell in Fiji. Of course we give special thanks to unsung heroes of the Coral Triangle expeditions: in particular Alison Green and Rod Salm of The Nature Conservancy and Sheila McKenna and Mark Erdmann of Conservation International. Fieldwork on the Great Barrier Reef was supported by James Cook University and the Australian Institute of Marine Science, and most ecoregions of Western Australia including remote reefs and atolls by the Western Australian Museum. We thank Julian Sprung for organizing fieldwork in the Bahamas, marine stations in the Caribbean by the Smithsonian and other institutions, and Ricardo Miozzo and the Brazil Coral Reef Society for work at the Abrolhos Islands. In addition, many expeditions around the world have been organized and funded by individuals, small organizations and marine stations. Institutional support has been extensive and we thank the Australian Institute of Marine Science for its early assistance with this project. Further thanks go to all curators that facilitated access to collections. These included the British Museum (Natural History); Department of Zoology, University of Glasgow; University Museum of Zoology, Cambridge; Rijksmuseum van Natuurlijke Historie; Zoological Museum, Amsterdam; Museum National d'Histoire Naturelle, Paris; Station Marine d'Endoume, Marseille; Universitets Zoologiske Museum, Copenhagen; Hessisches Landesmuseum, Darmstadt; Museum fϋr Naturkunde der Humboldt Universitat, Berlin; University of Tel Aviv; Phuket Marine Biological Centre, Thailand; University of Singapore; Hong Kong University; University of the Philippines, Manilla; Marine Science Institute of the Philippines, Quezon City; Bolinao Marine Laboratory, the University of San Carlos; Siliman University; Institute of Geology and paleontology, Tohoku University; University of the Ryukyus; Iriomote Marine Research Centre of Tokai University; Sesoko Marine Science Centre; Biology Department, University of the Ryukyus; ETMER, Akajima; Amakusa Marine Biological Laboratory of Kyushu University; Seto Marine Biological Laboratory of Kyoto University; Yaeyama Marine Park Research Station, Shirahama; Sabiura Marine Park Research Station, Kushimoto; Shimoda Marine Research Centre, University of Tsukuba; University of the Ryukyus, Okinawa; Banda Marine Laboratory, Tokyo University of Fisheries; Amitori Research Centre, Iriomote Island, Western Australian Museum; Museums and Art Galleries of the Northern Territory, Darwin; South Australian Museum; Museum of Tropical Queensland, Townsville; Queensland Museum; Queensland University; Australian Museum; Motupore Research Centre, Papua New Guinea; University of Papua New Guinea; University of the South Pacific, Fiji; Bernice P. Bishop Museum, Honolulu; United States National Museum; Museum of Comparative Zoology, Harvard University; Yale Peabody Museum, New Haven; Cornell University, Ithaca; Rosenstiel School of Marine and Atmospheric Science, University of Miami; Discovery Bay Marine Laboratory, Jamaica; Glover's Reef Marine Station, Belize and Bellair's Research Institute of McGill University, Barbados.
This publication is an end-product for a project that reaches back over 15 years. Work specifically for Corals of the World website has been supported by Ocean Ark Alliance (thanks to Dave Hannan), Google Earth, Atlas of Living Australia, EcoForce (thanks to Kenton Campbell), the Henry Foundation (thanks to Wolcott Henry), Odyssey Publishing (thanks to the late John Jackson), PIJAC, the Western Pacific Regional Fishery Management Council of NOAA, and the Australian Research Council.
Supplementary Material
The Supplementary Material for this article can be found online at: http://www.frontiersin.org/journal/10.3389/fmars.2014.00081/abstract
Literature Cited
For biogeographic literature consulted see Supplementary Material 1: “List of ecoregions and associated data.” For taxonomic literature consulted, see www.coralsoftheworld.com. Biogeographic information has also been obtained from taxonomic literature combining these fields, in particular Hoeksema (1989), Wallace (1999) and Wallace et al. (2012).
References
Baker, A. C., Glynn, P. W., and Riegl, B. (2008). Climate change and coral reef bleaching: an ecological assessment of long-term impacts, recovery trends and future outlook. Estuar. Coast. Shelf Sci. 80, 435–471. doi: 10.1016/j.ecss.2008.09.003
Berkelmans, R., and Oliver, J. K. (1999). Large-scale bleaching of corals on the Great Barrier Reef. Coral Reefs 18, 55–60. doi: 10.1007/s003380050154
Pubmed Abstract | Pubmed Full Text | CrossRef Full Text | Google Scholar
Brainard, R. E., Birkeland, C., Eakin, C. M., McElhany, P., Miller, M. W., Patterson, M., et al. (2011). “Status review report of 82 candidate coral species petitioned under the U.S. endangered species act,” in NOAA Technical Memorandum NMFS-PIFSC-27 (Washington, DC: National Oceanic and Atmospheric Administration).
Bridge, T. C. L., Fabricius, K. E., Bongaerts, P., Wallace, C. C., Muir, P. R., Done, T. J., et al. (2012). Diversity of Scleractinia and Octocorallia in the mesophotic zone of the Great Barrier Reef, Australia. Coral Reefs 31, 179–189. doi: 10.1007/s00338-011-0828-1
Brown, B. E. (1997). Coral bleaching: causes and consequences. Coral Reefs 16, S129–S138. doi: 10.1007/s003380050249
Carpenter, K. E., Abrar, M., Aeby, G., Aronson, R. B., Banks, S., Bruckner, A., et al. (2008). One-third of reef-building corals face elevated extinction risk from climate change and local impacts. Science 321, 560–563. doi: 10.1126/science.1159196
Pubmed Abstract | Pubmed Full Text | CrossRef Full Text | Google Scholar
Casagranda, M. D., Taher, L., and Szumik, C. A. (2012). Endemicity analysis, parsimony and biotic elements: a formal comparison using hypothetical distributions. Cladistics 28, 645–654. doi: 10.1111/j.1096-0031.2012.00410.x
Coudray, J., and Montaggioni, L. (1982). Coraux et récifs coralliens de la province Indo-Pacific: répartition géographique et altitudinale en relation avec la tectonique globale. Bull. Soc. Géol. Fr. 24, 981–933.
Crisp, M. D., Laffan, S., Linder, H. P., and Monro, A. (2001). Endemism in the Australian flora. J. Biogeogr. 28, 183–198. doi: 10.1046/j.1365-2699.2001.00524.x
Gardner, T. A., Côté, I. M., Gill, J. A., Grant, A., and Watkinson, A. R. (2003). Long-term region-wide declines in Caribbean corals. Science 301, 958–960. doi: 10.1126/science.1086050
Pubmed Abstract | Pubmed Full Text | CrossRef Full Text | Google Scholar
Glynn, P. W. (1984). Widespread coral mortality and the 1982-83 El Nino warming event. Environ. Conserv. 11, 133–146. doi: 10.1017/S0376892900013825
Glynn, P. W. (1991). Coral reef bleaching in the 1980s and possible connections with global warming. Trends Ecol. Evol. 6, 175–179. doi: 10.1016/0169-5347(91)90208-F
Pubmed Abstract | Pubmed Full Text | CrossRef Full Text | Google Scholar
Glynn, P. W., and Ault, J. (2000). A biogeographic analysis and review of the far eastern Pacific coral reef region. Coral Reefs 19, 1–23. doi: 10.1007/s003380050220
Glynn, P. W., Wellington, G. M., Riegl, B., Olson, D. B., Borneman, E., and Wieters, E. A. (2007). Diversity and biogeography of the scleractinian coral fauna of Easter Island (Rapa Nui). Pac. Sci. 61, 67–90. doi: 10.1353/psc.2007.0005
Green, A. L., and Mous, P. J. (2008). Delineating the Coral Triangle, its Ecoregions and Functional Seascapes. Version 5.0. TNC Coral Triangle Program Report 1/08, 1–44.
Guinotte, J. M., Buddemeier, R. W., and Kleypas, J. A. (2003). Future coral reef habitat marginality: temporal and spatial effects of climate change in the Pacific basin. Coral Reefs 22, 551–558. doi: 10.1007/s00338-003-0331-4
Harriott, V., and Banks, S. (2002). Latitudinal variation in coral communities in eastern Australia: a qualitative biophysical model of factors regulating coral reefs. Coral Reefs 21, 83–94. doi: 10.1007/s00338-001-0201-x
Harris, P. T., Bridge, T. C. L., Beaman, R. J., Webster, J. M., Nichol, S. L., and Brooke, B. P. (2013). Submerged banks in the Great Barrier Reef, Australia, greatly increase available coral reef habitat. ICES J. Mar. Sci. 70, 284–293. doi: 10.1093/icesjms/fss165
Hoegh-Guldberg, O. (1999). Climate change, coral bleaching and the future of the world's coral reefs. Mar. Freshwater Res. 50, 839–866. doi: 10.1071/MF99078
Hoegh-Guldberg, O., Hoegh-Guldberg, H., Veron, J. E. N., Green, A., Gomez, E. D., Lough, J., et al. (2009). The Coral Triangle and Climate Change: Ecosystems, People and Societies at Risk. Brisbane: WWF.
Hoegh-Guldberg, O., Mumby, P. J., Hooten, A. J., Steneck, R. S., Greenfield, P., Gomez, E., et al. (2007). Coral reefs under rapid climate change and ocean acidification. Science 318, 1737–1742. doi: 10.1126/science.1152509
Pubmed Abstract | Pubmed Full Text | CrossRef Full Text | Google Scholar
Hoeksema, B. W. (1989). Taxonomy, phylogeny and biogeography of mushroom corals (Scleractinia: Fungiidae). Zool. Verhandel. 254, 1–295.
Huang, D., Licuanan, W. Y., Hoeksema, B. W., Chen, C. A., Ang, P. O., Huang, H., et al. (2014). Extraordinary diversity of reef corals in the South China Sea. Mar. Biodivers. doi: 10.1007/s12526-014-0236-1
Hughes, T. P., Connolly, S. R., and Keith, S. A. (2013). Geographic ranges of reef corals (Cnidaria: Anthozoa: Scleractinia) in the Indo-Pacific. Ecology 94, 1659. doi: 10.1890/13-0361.1
Jokiel, P. L. (1990). Transport of reef corals into the Great Barrier Reef. Nature 347, 665–667. doi: 10.1038/347665a0
Keith, S. A., Baird, A. H., Hughes, T. P., Madin, J. S., and Connolly, S. R. (2013). Faunal breaks and species composition of Indo-Pacific corals: the role of plate tectonics, environment and habitat distribution. Proc. R. Soc. B. Biol. Sci. 280, 20130818. doi: 10.1098/rspb.2013.0818
Pubmed Abstract | Pubmed Full Text | CrossRef Full Text | Google Scholar
Kier, G., and Barthlott, W. (2001). Measuring and mapping endemism and species richness: a new methodological approach and its application on the flora of Africa. Biodivers. Conserv. 10, 1513–1529. doi: 10.1023/A:1011812528849
Kühlmann, D. H. H. (1983). Composition and ecology of deep-water coral associations. Helgoländer Meeresun. 36, 183–204. doi: 10.1007/BF01983856
Lesser, M. P., Slattery, M., and Leichter, J. J. (2009). Ecology of mesophotic coral reefs. J. Exp. Mar. Biol. Ecol. 375, 1–8. doi: 10.1016/j.jembe.2009.05.009
Licuanan, W. Y., and Capili, E. B. (2004). New records of stony corals from the Philippines previously known from peripheral areas of the Indo-Pacific. Raffles Bull. Zool. 52, 285–288.
Milne Edwards, H., and Haime, J. (1850). Recherches sur les polypiers; cinquième mémoire. Monographie des oculinides. Ann. Sci. Nat. 13, 63–110.
Obura, D. (2012). The diversity and biogeography of Western Indian Ocean reef-building corals. PLoS ONE 7:e45013. doi: 10.1371/journal.pone.0045013
Pubmed Abstract | Pubmed Full Text | CrossRef Full Text | Google Scholar
Riegl, B. M., and Purkis, S. J. (eds.). (2012). Coral Reefs of the Gulf: Adaptation to Climatic Extremes. Dordrecht: Springer Science+Business Media B.V. doi: 10.1007/978-94-007-3008-3_1
Rosen, B. R. (1971). The distribution of reef coral genera in the Indian Ocean. Symp. Zool. Soc. Lond. 28, 263–299.
Scheer, G. (1984). The distribution of reef-corals in the Indian Ocean with a historical review of its investigation. Deep Sea Res. A. 31, 885–900. doi: 10.1016/0198-0149(84)90046-3
Scheer, G., and Pillai, C. S. G. (1983). Report on the stony corals from the Red Sea. Zoologica 45, 1–198.
Sheppard, C. R. C. (1987). Coral species of the Indian Ocean and adjacent seas: a synonymized compilation and some regional distributional patterns. Atoll Res. Bull. 307, 1–32. doi: 10.5479/si.00775630.307.1
Sheppard, C. R. C. (1998). Biodiversity patterns in Indian Ocean corals, and effects of taxonomic error in data. Biodivers. Conserv. 7, 847–868. doi: 10.1023/A:1008830222860
Sheppard, C. R. C., Price, A. R. G., and Roberts, C. J. (1992). Marine Ecology of the Arabian Area. Patterns and Processes in Extreme Tropical Environments. London: Academic Press.
Spalding, M. D., Fox, H. E., Allen, G. R., Davidson, N., Ferdaña, Z. A., Finlayson, M., et al. (2007). Marine ecoregions of the world: a bioregionalization of coastal and shelf areas. Bioscience 57, 573–583. doi: 10.1641/B570707
Stehli, F. G., and Wells, J. W. (1971). Diversity and age patterns in hermatypic corals. Syst. Biol. 20, 115–126.
Veron, J. E. N. (1986). Corals of Australia and the Indo-Pacific. Hawai'i: Hawai'i University Press.
Veron, J. E. N. (1993). A Biogeographic Database of Hermatypic Corals, Species of the Central Indo-Pacific, Genera of the World. Townsville: Australian Institute of Marine Science.
Veron, J. E. N. (2000). Corals of the World, Vol. 1-3. Townsville: Australian Institute of Marine Science.
Veron, J. E. N. (2008). A Reef in Time: The Great Barrier Reef from Beginning to End. Cambridge, MA: Harvard University Press.
Veron, J. E. N. (2013). Overview of the taxonomy of zooxanthellate Scleractinia. Zool. J. Linn. Soc. 169, 485–508. doi: 10.1111/zoj.12076
Pubmed Abstract | Pubmed Full Text | CrossRef Full Text | Google Scholar
Veron, J. E. N., Devantier, L. M., Turak, E., Green, A. L., Kininmonth, S., Stafford-Smith, M., et al. (2009a). Delineating the coral triangle. Galaxea 11, 91–100. doi: 10.3755/galaxea.11.91
Veron, J. E. N., and Hodgson, G. (1989). Annotated checklist of the hermatypic corals of the Philippines. Pac. Sci. 43, 234–287.
Veron, J. E. N., Hoegh-Guldberg, O., Lenton, T. M., Lough, J. M., Obura, D. O., Pearce-Kelly, P., et al. (2009b). The coral reef crisis: the critical importance of <350 ppm CO2. Mar. Pollut. Bull. 58, 1428–1436. doi: 10.1016/j.marpolbul.2009.09.009
Pubmed Abstract | Pubmed Full Text | CrossRef Full Text | Google Scholar
Veron, J. E. N., and Marsh, L. M. (1988). Hermatypic corals of Western Australia. Records and annotated species list. Re. West. Aust. Mus. Suppl. 29, 1–136.
Veron, J. E. N., and Stafford-Smith, M. G. (2002). Coral ID (First Release 2002). Townsville: Australian Institute of Marine Science.
Wallace, C. C. (1999). Staghorn Corals of the World. A Revision of the Genus Acropora. Collingwood: CSIRO Publishing.
Keywords: coral, biogeography, distributions, diversity, affinity, species
Citation: Veron J, Stafford-Smith M, DeVantier L and Turak E (2015) Overview of distribution patterns of zooxanthellate Scleractinia. Front. Mar. Sci. 1:81. doi: 10.3389/fmars.2014.00081
Received: 22 August 2014; Accepted: 19 December 2014;
Published online: 18 February 2015.
Edited by:
Thomas K. Frazer, University of Florida, USAReviewed by:
Hector Reyes-Bonilla, Universidad Autonoma de Baja California Sur, MexicoCharles Sheppard, Warwick University, UK
Copyright © 2015 Veron, Stafford-Smith, DeVantier and Turak. This is an open-access article distributed under the terms of the Creative Commons Attribution License (CC BY). The use, distribution or reproduction in other forums is permitted, provided the original author(s) or licensor are credited and that the original publication in this journal is cited, in accordance with accepted academic practice. No use, distribution or reproduction is permitted which does not comply with these terms.
*Correspondence: John Veron, Coral Reef Research, 10 Benalla Road, Oak Valley, Townsville, QLD 4811, Australia e-mail: j.veron@coralreefresearch.com