Low concentrations of PAHs induce tolerance in nitrifying bacteria
 J. Fredrik Lindgren
 Ida-Maja Hassellöv
 Hanna Landquist
 Ingela Dahllöf
- 1Department of Shipping and Marine Technology, Chalmers University of Technology, Gothenburg, Sweden
- 2Department of Biological and Environmental Sciences, University of Gothenburg, Gothenburg, Sweden
The ability of marine microbes to develop tolerance to polycyclic aromatic hydrocarbons (PAHs) was examined in a 90-day experiment. PAH levels in sediment were increased 0.3 and 1.6 times compared to the control sediment. Day 30, 60, and 90 the microbes were re-exposed to PAHs in a short-term toxicity test to detect tolerance, where nitrification and denitrification were used as endpoints. In addition, molecular analysis of the microbial communities was performed to detect possible differences in proportions of nitrifying bacteria compared to total bacterial abundance (amoA/rpoB-ratio) between treatments and control. We here show PAH-induced tolerance in nitrifying microbial communities after 60 and 90 days of pre-exposure, as potential nitrification EC10-values were significantly higher in the low treatment (L) after 60 days and in both treatments after 90 days compared to control. Tolerance development in denitrification was not detected. Furthermore, the developed tolerance resulted in reduced nitrification efficiency, compared to control. It was also shown that the induced tolerance produced dissimilar amoA/rpoB-ratio between treatments and control, indicating that development of tolerance changed the community composition and that the development time depended on initial exposure. The results from this study have implications for future studies or environmental monitoring programs of long-term oil and PAH-contaminated sites. The possibility for development of tolerance needs to be taken into account and potential nitrification can be used for evaluation of marine microbial health. Furthermore, changed proportions of nitrifying microbes can alter the capacity of ammonium oxidizing in benthic marine sediments.
Introduction
Microbes are ubiquitous, constitute an essential part of the marine food web and mediate several important ecosystem services, such as degradation of organic material and production and recycling of inorganic nutrients (Dahllöf and Karle, 2005; Azam and Malfatti, 2007). They have short generation time, and are often sensitive to pollutants (van Beelen, 2003; Dahllöf and Karle, 2005; Azam and Malfatti, 2007; Papageorgiou et al., 2007). Benthic microbial communities are frequently exposed to hazardous substances, as such substances tend to adsorb to particles and sediment to the sea floor (Levin and Kimball, 1985; Hack et al., 2007; Gong et al., 2014). A change in the potential capacity of the microbial community to perform processes, such as nitrification and denitrification, can be used to evaluate sub-lethal effects on the community, and furthermore pin-point what parts of the community that are affected (Schafer et al., 2007).
We have previously shown that low additions of PAHs (130 and 1300 μg/kg [dw]) to marine sediment had negative effects on meiofaunal and microbial communities (Lindgren et al., 2012, 2014). The effects were changes in meiofaunal community composition and reduced ΣNOx efflux and potential nitrification 60 days after exposure. There were also effects on potential denitrification in one of the earlier experiments, but denitrification was not as severely affected by PAH exposure as potential nitrification (Lindgren et al., 2014).
We could not conclude whether the observed effects on nutrient turnover were transient effects on nitrification and denitrification or a result of more permanent effects, such as development of tolerance to the PAHs. The induction of tolerance to PAHs in marine benthic organisms is not well-examined. Therefore, the purpose of this study was to evaluate if marine microbial communities exposed to low additions of PAHs for 90 days develop tolerance, and if the potentially developed tolerance leads to a less efficient community with respect to nutrient turnover. If exposure to PAHs induced tolerance then tolerance could also be used as the end-point for assessing PAH contamination.
Pollution Induced Community Tolerance (PICT) can be used to assess whether tolerance has developed. The PICT concept builds on the assumption that exposure to a hazardous substance can lead to selection of more tolerant organisms within a community. If such a community is then re-exposed, the effects are reduced compared to a community that not previously has been exposed (Blanck, 2002; Ogilvie and Grant, 2008). Functional endpoints, such as photosynthesis, respiration or nitrification are measured when the communities are re-exposed in short-term toxicity tests. Effect concentrations are then compared between previously exposed and non-exposed communities and a significant reduction in sensitivity for previously exposed communities indicates tolerance. This induced tolerance also suggests that the community is still affected from the earlier exposure (van Beelen, 2003). PICT has been observed for several common hazardous substances, for example heavy metals, antifouling agents and pesticides but not PAHs (Blanck and Dahl, 1996; Gustavson et al., 1999; Knauer et al., 1999; Lehmann et al., 1999; Blanck, 2002; Wakelin et al., 2014), and microbial nutrient fluxes have prior successfully been used in PICT studies with sediment mesocosms (Dahllöf et al., 1998). In a long-term study a non-lethal endpoint such as EC10 or EC20 is generally preferred (Jorgensen, 2010), as the most sensitive microorganisms are targeted.
If induced tolerance can be detected, then there should be indications of changes in the community composition. The use of molecular studies to further analyse the possible induced community tolerance effects of e.g., a PAH addition can provide a reliable description of changes in the community (Dahllöf et al., 2000; Zhao et al., 2014). One way to assess changes in the nitrification community is to compare abundance of the ammonia oxidizing bacterial gene amoA (13) to total bacterial abundance, approximated by abundance of the rpoB gene (Dahllöf et al., 2000).
Materials and Methods
Sampling and Experimental Setup
Sediment was collected in October 2012 from 62 meters depth in the Gullmar Fjord, Sweden (58° 16.42 N, 11° 29.14 E) with an Olausson Box corer (0.3 × 0.3m). The top 2 cm of the core were removed, dry sieved (Ø 1 mm) to remove macrofauna, and used in the study. This was repeated several times until sufficient amount (~4 kg) were retrieved, after which the total amount of sediment was thoroughly mixed and used in the study.
Spiking of the sediment with petroleum (MK-1 diesel) was performed in a step-wise procedure to produce a dilution series for the short-term tests, as well as the sediments for long-term exposure. First 75.0 ml of diesel was thoroughly mixed into 500 g of autoclaved sediment. Subsequently 17.2 g and 56.0 g of the spiked sediment were thoroughly mixed into 200 g of autoclaved sediment, respectively. These two stock sediments, with nominal concentrations of 58,442 and 161,438 μg PAH/ kg (dw), were left to weather over night to simulate an actual spill of petroleum, where lighter fractions evaporate to a higher extent. The remaining dilutions, with nominal concentrations of 1614, 5844 and 16,144 μg PAH/kg (dw), were made by mixing 20 g of respective stock sediment with 180 g autoclaved sediment. For control sediment autoclaved sediment was used. The dilution series, including control were at day 30, 60, and 90 used to re-contaminate the long-term exposed sediment in short-term potential nitrification and denitrification experiments. The dilutions series were kept frozen (−20°C) to avoid further evaporation of PAHs.
The two PAH contaminated sediments for the long-term exposure were created using 82.5 g from the 1614 μg PAH/kg (dw) and the 16,144 μg PAH/kg (dw) spiked sediment, and mixed thoroughly into 750 g of non-autoclaved sediment. This produced sediment batches with PAH concentrations of 160 and 1600 μg/kg (dw) sediment. For the long-term control 82.5 g autoclaved sediment were mixed into 750 g non-autoclaved sediment. From each batch 15 replicates (five replicates per time point) with ~35 g sediment were put in experimental plugs (Petri dish, Nunc., Denmark, Ø 60 mm), and randomly lowered into five aquariums. The 160 μg/kg (dw) and 1600 μg/kg (dw) and control treatments will hereafter be referred as L (Low), H (High), and C (control) treatments. The aquaria were placed in a climate room (14°C) with a low but constant flow of sea water (32 PSU, 4°C) entering underneath the Petri dishes to avoid spreading of PAHs between treatments. Sampling was performed after 30, 60, and 90 days. At each sampling occasion five replicates from each treatment, in total 15 treatment plugs, were randomly selected, although one replicate from each aquarium was always selected to ensure a correct experimental setup. Each replicate was then thoroughly mixed and used in short-term exposure experiments, equaling six short-term experiments per pre-exposure. Differences in average potential to perform nitrification and denitrification were analyzed to elucidate a potential PICT effect.
Short-Term Toxicity Measurements
Potential Nitrification
For measurement of potential nitrification a modified protocol from Lindgren et al. (2012) was used. Initial concentrations, representing t0 of the nitrification incubation, were sampled first from filtered sea water (Ø 20 μm, 32 PSU) and filtered (cellulose acetate filter, 0.45 μm, Sigma–Aldrich, St. Louis, USA) into plastic bottles. 6 × 1 g sediment from each replicate (15 in total) was then added to Petri dishes (90 in total) (Nunc., Denmark, Ø 60 mm). To each Petri dish 0.1 g PAH spiked sediment mixed together with 10 ml of filtered sea water (Ø 20 μm, 32 PSU) were added, after an hour excess ammonium and phosphate and was then incubated 12 h. This created exposures of 0, 161, 580, 1610, 5800 or 16,100 μg PAH/kg sediment (dw) (n = 5). The overlying water in the small Petri dish was then sampled (t1) and filtered as above and stored in plastic bottles. Stored samples were later analyzed for nitrate on a Skalar autoanalyser (Breda, NL) using standard spectrophotometric methods. Potential nitrification was then calculated as differences between t1 and t0.
Potential Denitrification
For measurement of potential denitrification 6 × 3 g of sediment from each experimental plug (15 in total) and 0.3 g of spiked sediment was mixed with 4 ml of Helium (He) flushed seawater (4°C, 32 PSU) and incubated in Exetainer vials (90 in total) (12 ml, Labco, Lampeter, UK) creating treatments of 0, 161, 580, 1610, 5800 or 16,100 μg PAH/kg sediment (dw) (n = 5). The vial headspace was flushed with He using a syringe trough the septa, vortexed for 5 s, headspace flushed with He and then once again vortexed for 10 s. After 1 h 100 μl of 8 mM 15NO3− was added through the septa with a Hamilton syringe (Sigma-Aldrich, St. Louis, USA), the vials were once again vortexed and left to incubate in the dark for 2 h. Finally the incubation was terminated by adding ZnCl2 (200 μl, 50% [wt/vol]). The nitrogen gas produced during the incubation were analyzed by isotopic composition of N2 and N2O at the department of Biology, University of Southern Denmark, Denmark.
PAH Analysis
Sediment was taken from the two stock sediments, control and H and L treatments to be analyzed for PAH content and to account for potential degradation of PAHs during the experiment. The sediment was analyzed for PAH30 content at the Department of Environmental Sciences, Aarhus University, Denmark according to their accredited method, using Soxhlet extraction and GC–MS.
Molecular Analysis
Analysis of molecular microbial community diversity was performed using 0.2 g of homogenized sediment from control, H and L treatment replicates at day 60 and day 90. Sediment was frozen in 1.5 ml screw-cap cryotubes until processing. DNA extraction was performed by bead beating and then using FastDNA™ SPIN Kit for Soil (MP Biomedicals, Santa Ana, USA) following the provided protocol. The abundance of nitrifying bacteria and total bacterial was assessed using quantitative PCR with primers for the amoA and rpoB gene, respectively. Primers used were amoA-1F (5′-GGGGTTTCTACTGGTGGT-3′), amoA-2R (5′-CCCCTCKGSAAAGCCTTCTTC-3′), rpoB-1698f (5′-AACATCGGTTTGATCAAC-3′), and rpoB-2041r (5′-CGTTGCATGTTGGTACCCAT-3′), and were supplied by Eurofins genomics (Ebersberg, Germany). Quantitative PCR was run on a CFX Connect Real-Time PCR unit (Bio-Rad, Hercules, USA) at the Department of Biological and Environmental sciences, Gothenburg, Sweden. A mix for one well-contained 5 μl SsoAdvanced Universal SYBR Green Supermix (Bio-Rad, Hercules, USA), 0.5 μl of each primer, 1.5 μl of RNase free water and 2.5 μl template (5 ng DNA). Thermal cycling conditions were as follows for the amoA gene: initial denaturing and activation of polymerase for 3 min at 98°C followed by 39 cycles consisting of denaturing for 10 s at 95°C, annealing for 30 s at 59°C, extension for 30 s at 72°C. Thermal cycling conditions for the rpoB gene were the same, except for an annealing temperature of 51°C. Ratios between quantification cycle values (Cq-values), the cycle value where amplification fluorescence exceeds the background fluorescence, of amoA and rpoB were then used to analyse potential differences in proportions of ammonium oxidizing bacteria compared to total bacterial density between control and treatments at the various time-points.
Statistical Analysis
EC10-values for potential nitrification and denitrification were calculated using the RegTox macro with Microsoft Excel. Differences in EC10-values of potential nitrification and denitrification as well as differences in Cq-ratio between the amoA and rpoB genes were analyzed using the statistical software SPSS ver. 19.0.0 (IBM Corporation). Analysis of variance (ANOVA) was used to distinguish differences in EC10-values as well as Cq-ratios between the amoA and rpoB genes. Tukey's post-hoc test was used to distinguish differences in Cq-ratios between time-point and treatments.
Results
PAH-Analysis
The diesel additions caused increased concentrations of thirteen (13) PAHs out of the analyzed PAH30. The total added concentrations in the L and H treatment sediments of these 13 PAHs compared to control sediment were 70 μg/kg (dw) in Low and 360 μg/kg (dw) in High. This represented an increase of 0.3 times in Low and 1.6 times in High, compared to levels in the control sediment.
Potential Nitrification
The production rate of ΣNOX in the control sediment did not vary over the course of the 90-day experiment, and short-term PAH additions lowered nitrification rates in a dose-response manner in all of the tested treatments and at all time-points.
After 30 days the highest PAH concentration in the short-term toxicity test gave a reduction in ΣNOX rates in the control sediment of 13%, in the L treatment 17% and in the H treatment 14%. The H treatment was in all tested intervals less or equally inhibited compared to the control and L treatment. The L treatment was at all tested intervals inhibited in roughly the same degree as the control. There were no differences in EC10-values did between control and the treatments.
After 60 days the L treatment had significantly higher average EC10-value compared to the control and the H treatment (ANOVA, p < 0.05) (Figure 1), but the H treatment was more inhibited compared to control, at most about 25%. Control was at most inhibited by 17% and L only by 10%.
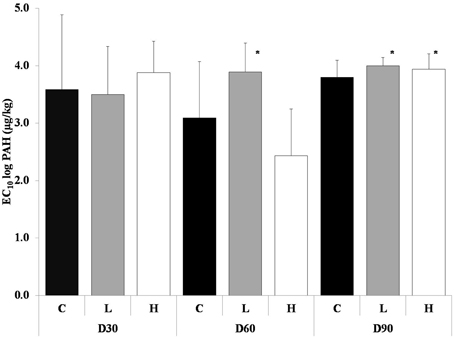
Figure 1. Average EC10-values from the short-term toxicity tests with potential nitrification as endpoint, after 30, 60, and 90 days. The different treatments are shown as C, Control; L, Low; H, High. Values are shown as mean EC10 log PAH concentration + 1 standard deviation (n = 5). * indicates a significant difference to control.
After 90 days both PAH treatments had significantly higher average EC10-value compared to control (ANOVA, p < 0.05) (Figure 1). The nitrification was at most inhibited by 26% in control, 19.5% in L and 21% in H.
Furthermore, it was shown that at on average the L and H treatments had lower ΣNOX production rates compared to control treatment in the short-term toxicity test, when no additional PAH was added (Figure 2). This difference was significant at day 30 and 90, when H treatment differed from both L and control (ANOVA, p < 0.05).
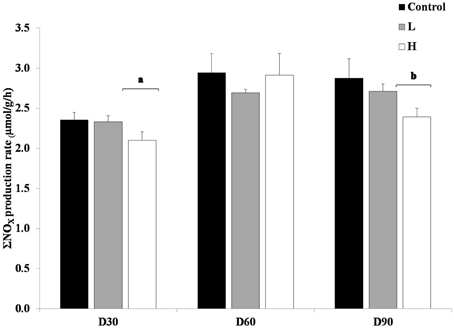
Figure 2. Produced ΣNOX with no re-exposure of PAHs, after 30, 60, and 90 days. The different treatments are shown as C, Control; L, Low; H, High. Values are shown as mean + 1 standard deviation (n = 5). Square brackets with letters (a and b) refers to treatments within a sampling occasion significant different from the other treatment and control (ANOVA).
Inhibition in the short-term tests did not go below 74% at any time using a 1-h exposure time, which concurred with prior measurements in Lindgren et al. (2012) where nitrification was inhibited by 51% after 48 h and by 92% after 30 days using the same concentrations.
Potential Denitrification
The denitrification rates in the control sediment declined over the course of the experiment. PAH exposed sediment in general produced more N2 compared to the control sediment, H in a significant manner compared to both control and L, after 60 and 90 days (ANOVA, p < 0.05) (Figure 3). Development of tolerance to PAHs could not be detected at any of the tested time points. At day 30 the PAH treatments and control sediment were affected by the short-term toxicity test in dose-responsive manner. After 60 and 90 days no dose-response was detected for any of the sediments.
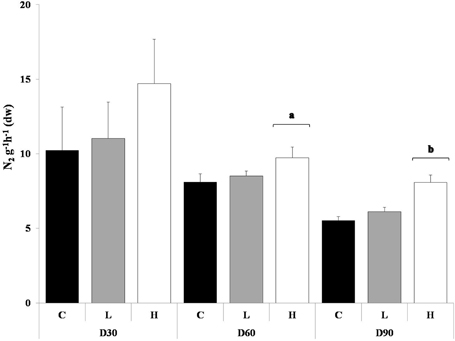
Figure 3. Produced N2 g−1h−1 (dw) with no re-exposure of PAHs, after 30, 60, and 90 days. The different treatments are shown as C, Control; L, Low; H, High. Values are shown as mean + 1 standard deviation (n = 5). Square brackets with letters (a and b) refers to treatments within a sampling occasion significant different from the other treatments (ANOVA).
Microbial Abundance
At the start of the experiment there was no difference in the amoA/rpoB-ratio between L, H treatments and control. The ratio of ammonium oxidizing bacteria and total bacterial abundance (amoA/rpoB) in the control sediment increased between day 60 and 90, whereas the ratio remained the same in the L treatment. In both sediments total and nitrifier abundance was reduced, but reduction in nitrifiers was relatively larger in L than in the control. The H treatment on the other hand had an increased ratio compared to control both on day 60 and 90. At day 90 it differed significantly on the 0.1 level compared to L treatment (Figure 4) (ANOVA, p < 0.1). The higher ratio in H on day 60 was due to a lower total abundance, whereas the higher ratio on day 90 was due to a higher abundance of nitrifiers, compared to control (data not shown).
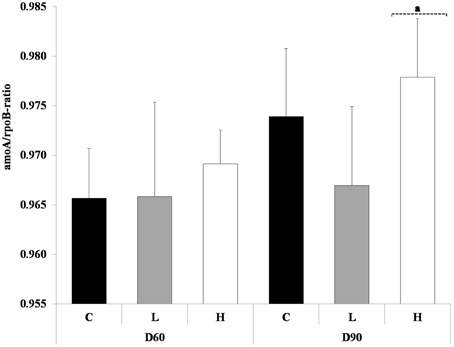
Figure 4. Displayed are the ratios of amoA and rpoB at day 60 and 90. The different treatments are shown as C, control; L, Low; H, High. Ratios are shown as average + 1 standard deviation (n = 5). Square bracket with dashed line and letter a refers to treatment within a sampling occasion significant different on the 0.1 level, compared to L treatment (ANOVA).
Discussion
In this study we have experimentally analyzed if marine microorganisms can, over time, develop a tolerance to PAHs and if so, that entails a change in the proportion in different types of bacteria. Moreover, we wanted to evaluate if development of tolerance leads to a less productive community. Marine nitrifying bacteria exposed to low concentrations of PAHs do, as hypothesized, develop tolerance detected through short-term test with a re-exposure to PAHs, but the process was slow. It took 60 days before the L treatment had significantly higher ΣNOXEC10-values compared to control and 90 days before tolerance was detected in the H treatment. The slower tolerance development in the H treatment could be due to a more severely acutely affected community at the start of the experiment, also indicated by the lower ΣNOX production in the H treatment on day 30 (Figure 2). The overall slow development of tolerance can be explained by the low growth rate of nitrifying bacteria that has been reported in ranges of 0.017–0.088 h−1, in comparison with E. coli growth rates of 0.4–1.7 h−1 (Marr, 1991; Prosser and Nicol, 2008).
This arisen tolerance in marine nitrifying bacteria to PAHs was reflected in the molecular study. The proportion of nitrifying bacteria in the L treatment compared to the overall amount of bacteria did not increase between day 60 and 90, indicating a stable community. However, we have no information of what ammonium oxidizing bacterial strains that resided in the samples. The composition of strains could have changed through the development of the tolerance still leaving the amoA/rpoB-ratio unchanged. The higher amoA/rpoB ratio in the H treatment compared to control and low at day 60 indicates that other bacterial groups than ammonium oxidizers were more affected by the higher addition of PAHs. At day 90, when tolerance was detected in H, both total and ammonium oxidizer abundance had increased, but the latter to a higher extent, which suggests growth of tolerant strains, but again more detailed community analysis is needed, before such conclusions can safely be drawn.
Tolerance to pollutants can come at a fitness cost. It can result in an altered community composition with loss of genetic diversity, as it is likely that organisms with a more tolerant genotype to the stress are selected for in a population while more sensitive organisms succumb to the stress or gets eliminated through competition (Evenden and Depledge, 1997; Baker et al., 2001; Petersen et al., 2004; Sun et al., 2012). When evaluating sub-lethal community effects in the field there is a risk that the negative effects originating from the hazardous substance might be hidden due to adaptation of the community (Grant, 2002). Results might then be misinterpreted as healthy status when in fact the community is, at a fitness cost, altered due to exposure to a hazardous substance. If the tolerant community is moved to an unpolluted environment or the pollution is removed, this might manifest itself as a reduced growth, survival, and fecundity. This will often in the end, through competition, lead to the removal of the tolerant organisms (Grant, 2002; Meyer and Di Giulio, 2003). The lower ΣNOX rates in L and H compared to the control sediment (Figure 2) can be interpreted as a fitness cost as the tolerant communities produced less ΣNOX when not re-exposed to any PAHs. When tolerance was induced in the L treatment the amoA/rpoB-ratio was unchanged or at lower level compared to the control. At the same time the L treatment had lower ΣNOX production in a non-re-exposed situation. This relationship was even more pronounced in the H treatment, when tolerance was induced. The amoA/rpoB-ratio was higher compared to the control and L at the same time as it had a significantly lower ΣNOX production compared to L and control in a non-re-exposed situation. In conclusion, the development of tolerance had produced a bacterial community that could endure re-exposures to PAHs, but at a cost of being less competitive in a situation not re-exposed to PAHs. When these microorganisms were eliminated the ΣNOX was lowered by 6–17%.
Tolerance to PAHs was not developed in the marine denitrifying bacteria that was analyzed in the study. At the two latter time-points no dose-response behavior could be detected, hence, no comparisons could be made between EC10-values. The declining N2 production rates over time (Figure 3) can be explained by more oxygenated sediment in the experimental plugs, resulting in lower number of microbes performing denitrification processes. In a previous study using sediment from the same site (Lindgren et al., 2014) it was shown that PAH concentrations of 1300 μg/kg (dw) over the course of 60 days had a similar effect as seen here. In general the contaminated sediment was stimulated and produced more N2 compared to the control sediment. This is probably due to the fact that there were less bioturbation by meiofauna, which was affected by the PAH addition, resulting in more anoxic sediment and hence increased number of denitrifiers.
We have here shown that PAH levels classified as average levels according to the Swedish EPA (EPA, 1999), can induce tolerance in nitrifying bacteria. That ammonium oxidizing bacteria can develop tolerance to PAHs should therefore be considered when evaluating negative effects of low concentrations of petroleum products e.g., during field studies or environmental monitoring programs. As investigations in the field might already be flawed by relating effects only to sum16PAH, not considering bioavailability and alkylated PAHs (Lindgren et al., 2014), avoiding further bias is of importance. In addition, our results indicate that the introduction of tolerance, through e.g., oil spillage by increased shipping or leisure boating, in an area can lead to a lower turnover of organic material to nitrogen gas, further contributing to eutrophication effects in near-coastal areas, such as the Gullmar Fjord.
Conclusions
We have here shown that ammonium oxidizing microorganisms can develop a tolerance when exposed to low concentrations of PAHs for 90 days. This was manifested in significantly higher potential nitrification EC10-values, compared to control sediment, during short-term toxicity tests after 60 and 90 days. Furthermore, the developed tolerance led to reduced potential nitrification capacities. Molecular analysis at the tested time-points showed that the proportion of microorganisms performing nitrification was unchanged or increased.
Conflict of Interest Statement
The authors declare that the research was conducted in the absence of any commercial or financial relationships that could be construed as a potential conflict of interest.
Acknowledgments
Financial support for this project was provided by the Swedish Research Council FORMAS Grant No. 2008-1510 and Swedish Maritime Administration No. 1399-14-01942-6. The authors like to thank the crew of the research vessel Oscar von Sydow for assistance in the sediment sampling, Pia Engström for assistance with analysis of potential nitrification and Linda Hasselberg Frank with assistance with the qPCR analysis.
References
Azam, F., and Malfatti, F. (2007). Microbial structuring of marine ecosystems. Nat. Rev. Microbiol. 5, 782–791. doi: 10.1038/nrmicro1747
Baker, R. J., Bickham, J. W., Bondarkov, M., Gashak, S. P., Matson, C. W., Rodgers, B. E., et al. (2001). Concequences of polluted environments on population structure: the bank vole (Clethrionomys glareolus) at Chernobyl. Ecotoxicology 10, 211–216. doi: 10.1023/A:1016665226716
Blanck, H. (2002). A critical review of procedures and approaches used for assessing Pollution-Induced Community Tolerance (PICT) in biotic communities. Hum. Ecol. Risk Assess. 8, 1003–1034. doi: 10.1080/1080-700291905792
Blanck, H., and Dahl, B. (1996). Pollution induced community tolerance (PICT) in marine periphyton in a gradient of tri-n-butyltin (TBT) contamination. Aquat. Toxicol. 35, 59–77. doi: 10.1016/0166-445X(96)00007-0
Dahllöf, I., Baillie, H., and Kjelleberg, S. (2000). rpoB-Based micorbial community analysis avoids limitations inherent in 16S rRNA gene intraspecies heterogeneity. Appl. Environ. Microbiol. 66, 3376–3380. doi: 10.1128/AEM.66.8.3376-3380.2000
Dahllöf, I., Blanck, H., and Hall, P. (1998). Short-term effects on Tri-n-butyl-tin on marine sediment samples using nutrient fluxes as effect indicators. Environ. Toxicol. Chem. 18, 850–857.
Dahllöf, I., and Karle, I. M. (2005). Effect on marine sediment nitrogen fluxes caused by organic matter enrichment with varying organic carbon structure and nitrogen content. Mar. Chem. 94, 17–26. doi: 10.1016/j.marchem.2004.07.008
EPA. (1999). Report 4914 - Organic Pollutants in Sediment. Stockholm: Swedish Environmental Protection Agency.
Evenden, J. A., and Depledge, M. H. (1997). Genetic susceptibility in ecosystems: the challenge for exotoxicology. Environ. Health Perspect. 105, 849–854. doi: 10.1289/ehp.97105s4849
Gong, Y., Zhao, X., Cai, Z., O'Reilly, S. E., Hao, X., and Zhao, D. (2014). A review of oil, dispersed oil and sediment interactions in the aquatic environment: influence on the fate, transport and remediation of oil spills. Mar. Pollut. Bull. 79, 16–33. doi: 10.1016/j.marpolbul.2013.12.024
Grant, A. (2002). Pollution-tolerant species and communities: intriguing toys or invaluable monitoring tools? Hum. Ecol. Risk Assess. 8, 955–970. doi: 10.1080/1080-700291905765
Gustavson, K., Petersen, S., Pedersen, B., Stuer-Lauridsen, F., Pedersen, S., and Wängberg, S.-Å. (1999). Pollution induced community tolerance (PICT) in coastal phytoplankton communities exposed to copper. Hydrobiologia 416, 125–138. doi: 10.1023/A:1003811419842
Hack, L. A., Tremblay, L. A., Wratten, S. D., Lister, A., and Keesing, V. (2007). Benthic meiofauna community composition at polluted and non-polluted sites in New Zealand intertidal environments. Mar. Pollut. Bull. 54, 1801–1812. doi: 10.1016/j.marpolbul.2007.07.009
Knauer, K., Behra, R., and Hemond, H. (1999). Toxicity of inorganic and methylated arsenic to algal communities from lakes along an arsenic gradient. Aquat. Toxicol. 46, 221–230. doi: 10.1016/S0166-445X(98)00131-3
Lehmann, V., Tubbing, G. M. J., and Admiraal, W. (1999). Induced metal tolerance in microbenthic communities in three lowland rivers with different metal loads. Arch. Environ. Contam. Toxicol. 36, 384–391. doi: 10.1007/PL00006610
Levin, S. A., and Kimball, S. F. (1985). New perspectives in ecotoxicology. Environ. Manage. 8, 375–442. doi: 10.1007/BF01871807
Lindgren, J. F., Hassellöv, I. M., and Dahllöf, I. (2012). Meiofaunal and bacterial community response to diesel additions in a microcosm study. Mar. Pollut. Bull. 64, 595–601. doi: 10.1016/j.marpolbul.2011.12.014
Lindgren, J. F., Hassellöv, I. M., and Dahllöf, I. (2014). PAH effects on meio- and microbial benthic communities strongly depend on bioavailability. Aquat. Toxicol. 146, 230–238. doi: 10.1016/j.aquatox.2013.11.013
Meyer, J. N., and Di Giulio, R. T. (2003). Heritable adaptation and fitness costs in killifish (Fundulus heteroclitus) inhabiting a polluted estuary. Ecol. Appl. 13, 490–503. doi: 10.1890/1051-0761(2003)013[0490:HAAFCI]2.0.CO;2
Ogilvie, L. A., and Grant, A. (2008). Linking pollution induced community tolerance (PICT) and microbial community structure in chronically metal polluted estuarine sediments. Mar. Environ. Res. 65, 187–198. doi: 10.1016/j.marenvres.2007.10.002
Papageorgiou, N., Moreno, M., Marin, V., Baiardo, S., Arvanitidis, C., Fabiano, M., et al. (2007). Interrelationships of bacteria, meiofauna and macrofauna in a Mediterranean sedimentary beach (Maremma Park, NW Italy). Helgol. Mar. Res. 61, 31–42. doi: 10.1007/s10152-006-0051-6
Petersen, D. G., Dahllöf, I., and Nielsen, L. P. (2004). Effects of zinc pyrithione and copper pyrithione on microbial community function and structure in sediments. Environ. Toxicol. Chem. 23, 921–928. doi: 10.1897/03-196
Prosser, J. I., and Nicol, G. W. (2008). Relative contributions of archaea and bacteria to aerobic ammonia oxidation in the environment. Environ. Microbiol. 10, 2931–2941. doi: 10.1111/j.1462-2920.2008.01775.x
Schafer, A. N., Snape, I., and Siciliano, S. D. (2007). Soil biogeochemical toxicity endpoints for sub-Antartic islands contaminated with petroleum hydrocarbons. Environ. Toxicol. Chem. 26, 890–897. doi: 10.1897/06-420R.1
Sun, M. Y., Dafforn, K. A., Brown, M. V., and Johnston, E. L. (2012). Bacterial communities are sensitive indicators of contaminant stress. Mar. Pollut. Bull. 64, 1029–1038. doi: 10.1016/j.marpolbul.2012.01.035
van Beelen, P. (2003). A review on the application of microbial toxicity tests for deriving sediment quality guidelines. Chemosphere 53, 795–808. doi: 10.1016/S0045-6535(03)00716-1
Wakelin, S., Gerard, E., Black, A., Hamonts, K., Condron, L., Yuan, T., et al. (2014). Mechanisms of pollution induced community tolerance in a soil microbial community exposted to Cu. Environ. Pollut. 190, 1–9. doi: 10.1016/j.envpol.2014.03.008
Keywords: PAH, microbial communities, nitrification, denitrification, PICT, qPCR
Citation: Lindgren JF, Hassellöv I-M, Landquist H and Dahllöf I (2015) Low concentrations of PAHs induce tolerance in nitrifying bacteria. Front. Mar. Sci. 2:35. doi: 10.3389/fmars.2015.00035
Received: 09 April 2015; Accepted: 20 May 2015;
Published: 02 June 2015.
Edited by:
Rathinam Arthur James, Bharathidasan University, IndiaCopyright © 2015 Lindgren, Hassellöv, Landquist and Dahllöf. This is an open-access article distributed under the terms of the Creative Commons Attribution License (CC BY). The use, distribution or reproduction in other forums is permitted, provided the original author(s) or licensor are credited and that the original publication in this journal is cited, in accordance with accepted academic practice. No use, distribution or reproduction is permitted which does not comply with these terms.
*Correspondence: J. Fredrik Lindgren, Department of Shipping and Marine Technology, Chalmers University of Technology, 41296 Göteborg, Sweden, f.lindgren@chalmers.se