Species-specific variation in the phosphorus nutritional sources by microphytoplankton in a Mediterranean estuary
 Marly C. Martínez-Soto1*
  Gotzon Basterretxea1
  Esther Garcés2
  Sílvia Anglès1,3
  Antoni Jordi1
  Antonio Tovar-Sánchez4,5
- 1Department of Ecology and Marine Resources, Mediterranean Institute for Advanced Studies, Universidad de las Islas Baleares - Consejo Superior de Investigaciones Científicas, Esporles, Spain
- 2Departament de Biologia Marina i Oceanografia, Institut de Ciències del Mar, Consejo Superior de Investigaciones Científicas, Barcelona, Spain
- 3Department of Oceanography, Texas A&M University, College Station, TX, USA
- 4Department Ecology and Coastal Management, Instituto de Ciencias Marinas de Andalucía, Consejo Superior de Investigaciones Científicas, Campus Universitario Río San Pedro, Cádiz, Spain
- 5Department of Global Change Research, Mediterranean Institute for Advanced Studies, Universidad de las Islas Baleares - Consejo Superior de Investigaciones Científicas, Esporles, Spain
We investigated the species-specific phosphorus (P) nutritional strategies in the microphytoplankton community in the Mahon estuary (Minorca, Western Mediterranean) in 2011, under two contrasting hydrographic scenarios. Estuarine flow, nutrient concentrations, phytoplankton community composition, and enzyme-labeled fluorescence (ELF) were measured in June and October, corresponding to the beginning and the end of summer. Dissolved inorganic nitrogen (DIN) and inorganic phosphate (Pi) exhibited enhanced concentrations in the inner estuary where N:P molar ratios suggested P-limitation in both surveys. Pi was low and variable (0.09 ± 0.02 μmol L−1 in June and 0.06 ± 0.02 μmol L−1 in October), whereas organic phosphorus remained a more readily available P source. Even though ambient Pi concentrations were slightly higher on June, when the microphytoplankton assemblage was dominated by dinoflagellates, the percentage of ELF labeled cells was notably higher (65 ± 9% of total cells) than in October (12 ± 10%), when the presence of diatoms characterized the microphytoplankton community. Alkaline phosphatase activity (AP) was mainly expressed by dinoflagellate taxa, whereas diatoms only displayed significant AP in the inner estuary during the June survey. A P-addition bioassay in which response of AP to Pi enrichment was evaluated showed marked reduction in AP with increasing Pi. However, some dinoflagellate species maintained AP even when Pi was supplied in excess. We suggest that in the case of some dinoflagellate species AP is not as tightly controlled by ambient Pi as previously believed. AP activity in these species could indicate selective use of organic phosphorus, or slow metabolic response to changes in P forms, rather than physiological stress to low Pi availability. We emphasize the importance of identifying the species-specific phosphorus requirements and their capability for P assimilation in order to understand the contribution of microphytoplankton to the whole community response to biogeochemical perturbations.
Introduction
The escalating input of nutrients from anthropogenic activities near the coast is considered as one of the greatest threats to worldwide coastal ecosystems. The consequences of this process include changes in species composition, reduction in aquatic biodiversity, alteration of food webs, uneven growth of primary producers, including algal blooms, with an increase of respiration rates in response to the rapid production of organic matter (Nixon, 1995; Cloern, 2001). These effects are pervasive in coastal aquatic systems, and reveal a major influence of nutrient availability on the distribution of marine microbial communities. Predicting and managing the effects of eutrophication requires an understanding of these nutrient-algae relationships. However, the complexity posed by the influence of various physical and bio-chemical factors makes the implementation of effective nutrient management strategies a challenging prospect (e.g., Carstensen et al., 2011).
Bottom-up control of phytoplankton growth is exerted through the imbalance between supply and demand of each nutrient involved in cell physiology (Conley et al., 2009). In spite of the fact that the co-limitation between N and P is not rare in a number of world areas, several studies emphasize the importance of phosphorus (P) as the principal limiting nutrient in the open ocean regions, and in some nearshore and estuarine environments (e.g., Krom et al., 1991; Thingstad et al., 1998; Ammerman et al., 2003). Traditionally, the inorganic P (Pi) form orthophosphate was considered as the sole form of P that could be utilized by phytoplankton to satisfy cellular requirements (Cembella et al., 1984). However, it is now widely accepted that despite the preferential use of orthophosphate, many phytoplankton taxa have the capability to utilize dissolved organic phosphorus (DOP) and other Pi forms such as polyphosphate (Currie and Kalff, 1984; Cotner and Wetzel, 1992; Nicholson et al., 2006).
In order for phytoplankton cells to take up DOP they must first hydrolyze the labile fraction into orthophosphate (Hoppe, 1993; Jansson et al., 1988). This process is mediated mainly by alkaline phosphatase (AP), an enzyme that has broad substrate specificity and hydrolyzes ester bonds between P and organic molecules (Cembella et al., 1984; Huang et al., 2005). In many phytoplankton species AP is regulated (induced or repressed) by ambient Pi concentrations, or by intracellular concentrations (Chröst and Overbeck, 1987; Nicholson et al., 2006). AP activity is therefore considered as indicative of Pi limitation. Indeed, AP activity has been used to indicate phytoplankton P-stress in both freshwater and marine environments (Cotner et al., 2000; Hernández et al., 2002; Vidal et al., 2003).
Previous research on marine AP activity used a bulk enzyme assay method focusing on areas with low Pi concentrations or elevated nitrogen (N) to P ratios (Li et al., 1998; Cotner et al., 2000; Ivancic et al., 2010). In addition, the technique of single cell enzyme-labeled fluorescence (ELF) was developed to determine which specific cells within a phytoplankton community are using AP (Dyhrman and Palenik, 1999; Nicholson et al., 2006). The phytoplankton cells existing in a particular environment may respond in different ways to the P availability in the medium, depending on their previous physiological state and their capacity to take up the nutrients rapidly, thereby displaying diverse AP responses.
The objective of this study is to examine the species-specific assimilating capacity of the available P forms (inorganic/organic) by the microphytoplankton cells at Mahon estuary (Balearic Islands, Mediterranean Sea), and its relationship to the hydrodynamic conditions. In the Balearic Islands, available nitrogen concentrations are frequently higher than those of other elements, as result of human activities, and the low concentrations of Pi limit coastal productivity (Basterretxea et al., 2007, 2010; Tovar-Sánchez et al., 2014). Consequently, the use of alternative P sources becomes a fundamental factor for understanding phytoplankton growth and community composition along the Mediterranean coasts. Furthermore, the ability of some microphytoplankton species to switch between Pi and DOP sources may explain the sustainability of primary production during summer stratified conditions and, through trophic interactions, the subsistence of other components of the coastal food web (such as zooplankton and fish larvae).
Data and Methods
Site Description
Mahon is an elongated (5.5 km long) and deep (>30 m) estuary on the east coast of Minorca (Balearic Islands, Mediterranean Sea; Figure 1). The geomorphology of the estuary is conditioned by a NW-SE running geological fault over which the estuary settles. The inner part of the estuary is shallow with mean depths of < 12 m, and contains a commercial harbor. Drains from the municipal network of Mahon concentrate in this area. The center part of the estuary is deeper (>15 m) around a narrow band to the south of Isla del Rey, and shallower to the north. In this section of the harbor population concentrates in the town of Es Castell. The mouth of the harbor is very narrow (~300 m) and a sill greatly restricts the exchange with offshore waters.
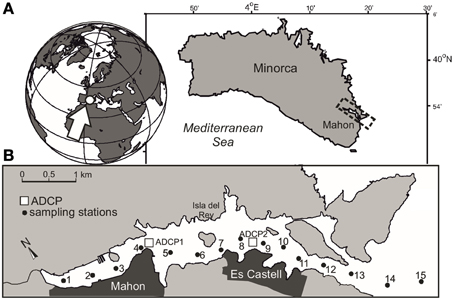
Figure 1. (A) Map showing the location of Mahon in Minorca Island (Mediterranean Sea) and (B) the sampling stations (black dots) and location of the ADCPs (open squares).
Climate in the area is characterized by mild winters and relatively hot and dry summers. Mahon receives fresh water inputs through groundwater seepage, and irregular surface flows in the head of the estuary that may be torrential during fall and early winter. Conversely, low freshwater inflow, together with strong evaporation during summer, may result in water circulation reversals when estuarine salinity exceeds that of the ocean. These low-inflow reversing estuaries are common in many temperate and warm world areas, including the Red Sea, California, South Africa, Western Australia and the Mediterranean Sea (Largier et al., 1996, 1997). In addition, water renewal in the Mahon estuary is generally poor because it is sheltered from coastal currents, and tidal forcing is low (tidal range ~0.25 m).
Sampling and Data Analysis
Two along-estuary surveys were carried out in Mahon on June 27 and October 24, 2011. Surface water samples (1–2 m depth) were collected using a peristaltic pump along a transect (15 stations) extending from the innermost area to an approximate distance of 1 km outside the estuary (Figure 1). At each station, temperature and salinity profiles were obtained with a Seabird SBE-25 conductivity-temperature-depth (CTD). During the survey period, meteorological data were recorded by the local Port Authority, and water column temperature was fortnightly measured at station 10 as part of the monitoring program of the estuary. Current velocity data were obtained from two bottom-mounted acoustic Doppler current profilers (ADCPs) (1000 kHz Nortek Aquadopp profiler) deployed along the port axis, measuring at 1 m depth intervals. The original 1-min currents were rotated along the local port axis direction and daily-averaged. Unfortunately, the ADCP in the middle part of the harbor failed at the end of September.
Nutrient analysis was carried out on water samples (13 ml) collected in acid-washed polyethylene tubes. Samples were pre-filtered through GF/F fiberglass filters (Whatman Ltd.), and then frozen until analysis. Concentrations of dissolved inorganic nitrogen (DIN = NO−2 + NO−3 + NH+4), soluble reactive P and silicate (Si), and total dissolved P were measured with an Alliance Futura autoanalyzer following Grasshoff et al. (1983). In coastal waters soluble reactive elements provide a good approximation of the dissolved inorganic form for the correspondent element (Monaghan and Ruttenberg, 1999). Total dissolved P was estimated by pre-oxidizing the sample with an alkaline persulfate digestion that hydrolyzes all forms of inorganic and organic P to orthophosphate. DOP was estimated from the difference between total dissolved P and soluble reactive P. The accuracy of the analysis was established using Coastal Seawater Reference Material for Nutrients (MOOS-1, NRC-CNRC), resulting in 97, 93, 98, and 118% for PO3−4, NO−3, NO−2, and SiO2, respectively. The Limit of Detection (LOD), calculated as three times the standard deviation of subsequent blank measurements, was PO3−4: 0.05 μmol L−1, NO−3: 0.001 μmol L−1, NO−2: 0.001 μmol L−1, NH+4: 0.03 μmol L−1, and SiO2: 0.02 μmol L−1. Chlorophyll a (Chla) concentrations were measured by fluorometric analysis of extracted pigments. Water samples (120 ml) were filtered through glass fiber filters (GF/F Whatman) and stored frozen. Pigments were extracted in 90% acetone and stored in the dark at 4°C overnight. The fluorescence of the extracts was measured on a Turner Designs fluorometer.
AP activity was assessed using the single cell ELF technique (Dyhrman and Palenik, 1999; Nicholson et al., 2006). Water samples (5 l) were pre-filtered through a 100 μm pore size mesh for zooplankton elimination, and then concentrated to 50 ml by inverse filtering through a 20 μm pore size Nytex filter. The sample was then gravity filtered onto a 20 μm filter. The filter was then transferred to an Eppendorf tube containing 1.5 ml of 70% ethanol. The tube was shaken to re-suspend the cells and the filter was removed. The resulting concentrate was incubated for 30 min, centrifuged at 2000 rpm for 15 min, and dried for 5 min. Finally 100 μl of a phosphomonoester substrate (ELF-97 endogenous phosphatase detection kit, Molecular Probes) were added to the sample, which was again incubated for 30 min. The ELF-97 substrate produces a yellow-green fluorescent precipitate at the site of ester hydrolysis, and thus labels any cells that express AP activity. Total microphytoplankton (hereafter phytoplankton) and ELF-labeled cells were enumerated with a Sedgewick Rafter chamber using a Leica epifluorescence microscope. Cells were identified using phase contrast illumination, and then examined with a 100-W mercury lamp and a long pass DAPI filter set (excitation 350 nm, emission 520 nm) for ELF activity. We estimated an average coefficient of variation for triplicate counts of 10% using this method.
P Addition Bioassay
A P addition bioassay was performed in situ during the June survey to test the response of the phytoplankton cells to P fertilization. The bioassay was designed to increase Pi in 0.08, 0.50, and 2.00 μmol L−1 through the addition of NaH2PO4 H2O. Surface water from station 15 (Figure 1) was collected in 50 L acid-washed plastic carboys and pre-filtered through a 60 μm mesh to exclude large grazers. Incubations were performed in 6 L acid-washed PET bottles and consisted of triplicates for each P addition treatment and for control (no addition), resulting in a total of 12 incubations. The bottles were submerged at a depth of 1 m and incubated for 3 days. At the end of the incubation period, a sample was taken for each treatment to quantify phytoplankton abundance and taxonomy, and AP activity using the methods described previously. The experiment was carried out under clear skies with seawater temperatures oscillating between 24.5°C at night and 26.5°C at noon.
Results
Environmental Conditions
Figure 2 shows the evolution of atmospheric and oceanographic conditions in the Mahon estuary during the study period. Atmospheric temperatures were in the range of 23–25°C in June, and declined to approximately 20°C by October (Figure 2A). Precipitation was typically low, with sporadic precipitation events. The evolution of seawater temperature revealed the development of a seasonal thermocline in late May to early June (Figure 2B). Surface seawater temperature progressively equilibrated with the atmosphere, while the thermocline deepened and intensified. In early October, the water column rapidly cooled down and became thermally homogeneous during the days previous to the October survey. Currents displayed a clear vertical pattern with two layers at the inner current profiler (ADCP1), whereas a more complex pattern occurred at ADCP2. For most of the study period, currents were predominantly directed seaward on the surface, and landward near the bottom, at ADCP1. However, this pattern reversed when the water column became thermally homogeneous in mid-October (Figure 2C). Three layers were observed at ADCP2 with landward bottom currents, seaward flow at mid depths (12–20 m) and variable on the surface, at least until the end of September when the ADCP2 failed (Figure 2D).
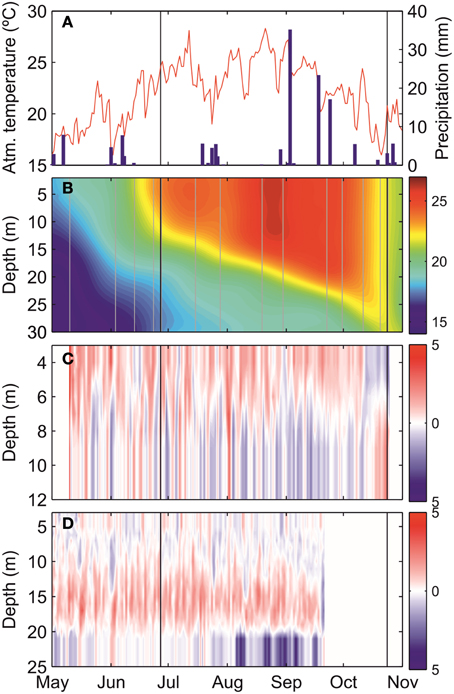
Figure 2. Time-series of (A) atmospheric temperature (°C, red line) and daily accumulated precipitation (mm, blue bars), (B) seawater temperature (°C) at station 10, (C) alongshore current (cm s−1) at the inner ADCP, and (D) alongshore current (cm s−1) at the middle ADCP. Vertical black lines indicate the survey dates (June and October) and both black and gray lines in (B) are the measured temperature profiles in the monitoring program. Blue and red color in (C,D) represent inshore and offshore direction, respectively.
In accordance with this general flow pattern, the water column exhibited strong thermal stratification in the June survey. The thermocline was located at depths ranging from 14 to 18 m and presented a marked temperature gradient of ~2°C m−1 (Figure 3A). Slightly warmer and fresher waters in the inner estuary determined a net seaward flow of 1–2 cm s−1 above the thermocline (Figure 3C). The scarce precipitation, together with evaporation during summer, caused reversal of the longitudinal density gradient in the October survey, with cooler and saltier waters in the inner estuary (Figures 3B,D). In addition, an intense haline front in the estuary mouth separated inshore from offshore waters. Consistent with the reversal of the longitudinal density gradient, the only ADCP available in the October survey showed an inverse circulation with respect to the June survey.
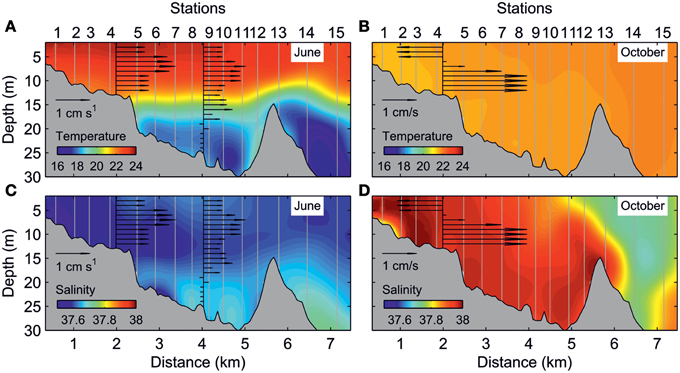
Figure 3. Along-estuary transect of: temperature (°C) for (A) June and (B) October surveys, and salinity for (C) June and (D) October surveys. The black arrows indicate the daily averaged axial currents (cm s−1) at different depths.
Figure 4 illustrates the variation of the measured nutrients along the estuary axis in both surveys. With some spatial differences, inorganic nutrients (DIN and Pi) exhibited enhanced concentrations in the inner estuary (stations 1–4), most likely because of the drains of Mahon town and its harbor. Pi was also enhanced at the proximity of the urban area of Es Castell, suggesting an additional urban source of nutrients in this area (stations 7–10; Figure 4C). Mean concentrations of DIN were slightly higher in June than in October (1.5 ± 1.53 and 1.0 ± 1.7 μmol L−1). This was caused by the higher ammonium concentrations during the first survey (0.8 ± 0.44 and 0.2 ± 0.14, respectively). Pi was also slightly enhanced in June (0.09 ± 0.02 and 0.06 ±0.02 μmol L−1, respectively). In contrast, DOP concentrations were significantly higher in the October survey (0.14 ± 0.06 and 0.36 ± 0.06 μmol L−1, respectively) and presented low spatial variations (Figure 4D). The SiO2 showed a similar trend to that of DIN (Figure 4E), with higher values in June than in October (1.7 ± 0.4 and 0.4 ± 0.1 μmol L−1, respectively). N:P molar ratios suggested potential P-limitation inside the estuary in both surveys (values above 16), although they covered most of the estuary (stations 1–7) in the June survey, and were restricted to the inner basin (stations 1–4) in the October survey (Figure 4F). Despite nutrient concentrations being higher, phytoplankton biomass, expressed as Chla concentration, was generally lower in June (mean 1.75 ± 0.77 and 2.33 ± 1.5 μg L−1, respectively). Particularly enhanced Chla values (up to 5.1 μg L−1) were detected in the inner estuary during the October survey.
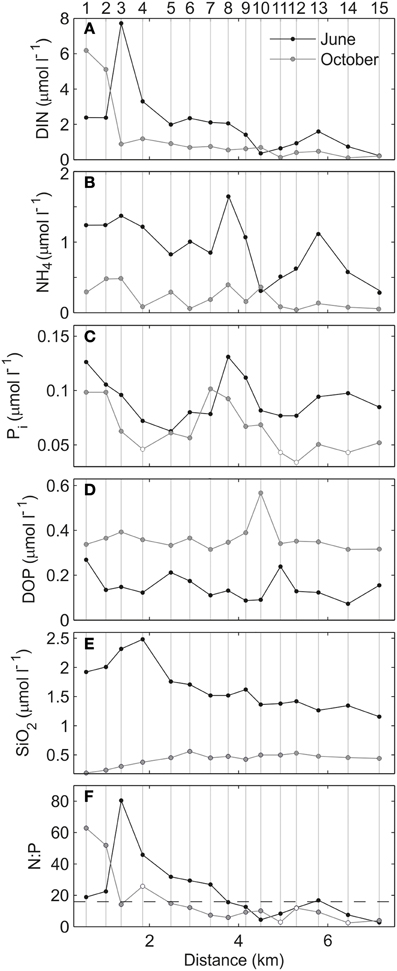
Figure 4. Surface (A) DIN, (B) NH4, (C) Pi, (D) DOP, (E) SiO2, and (F) N:P ratio for June (black) and October (gray) surveys. The dashed back line in (F) indicates the Redfield ratio (16:1). White dots indicate values affected by the limit of detection (LOD).
Phytoplankton and ELF
The relative abundance of the main microphytoplankton species and their cell specific expression of AP as detected by ELF are shown in Table 1. During the June survey, the phytoplankton assembly was dominated by dinoflagellates accounting for 89% of the total abundance. Prorocentrum spp. (44%), Scrippsiella spp. (13%), and small unidentified dinoflagellates (16%) were the most abundant taxa. Conversely, the presence of diatoms characterized the phytoplankton community in the October survey, comprising 77% of the total cell abundance with Chaetoceros spp. (51%), Cyclotella spp. (14%), and Asterionellopsis glacialis (12%) being the most abundant taxa. Significant differences were also observed in ELF between both surveys. While 65% of total phytoplankton cell expressed AP in the June survey, this value decreased to 12% in October. However, AP was expressed almost exclusively by dinoflagellates in both surveys (99 and 98% of the total labeled phytoplankton abundance in June and October). Prorocentrum spp. (56%) was the most abundant taxa expressing AP in the June survey and small unidentified dinoflagellates (76%) in the October one.
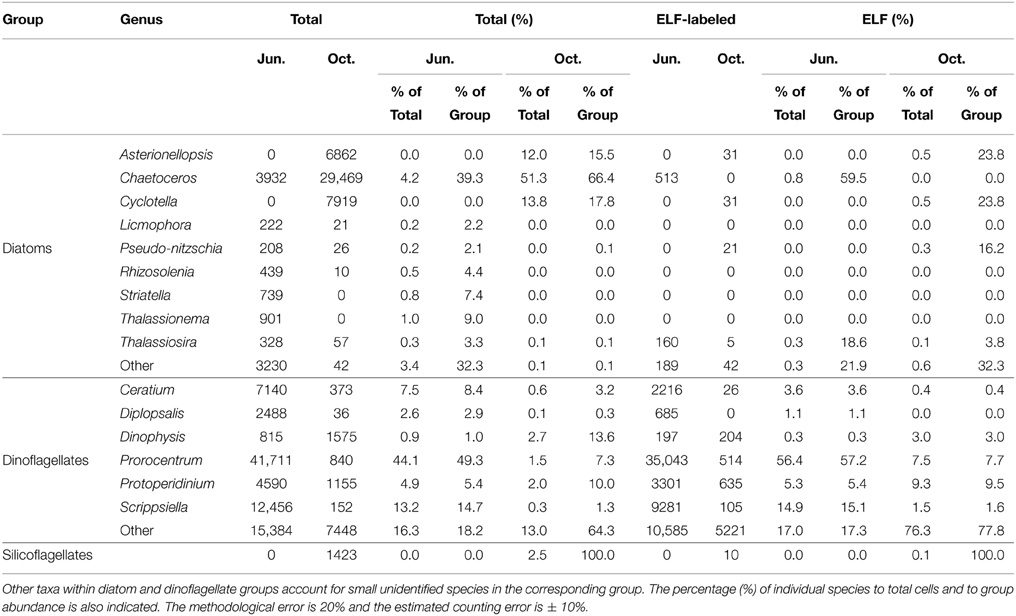
Table 1. Total cell abundance and cells expressing ELF (cells l−1) for main phytoplankton taxa over the 15 stations during June and October surveys.
The analysis of the spatial variations of phytoplankton community, Figure 5, shows the total cell abundances of the main phytoplankton taxa. In the June survey, both diatom and dinoflagellate taxa presented a marked along-estuary gradient although local enhancements were also observed for some taxa. Conversely, larger variations occurred in the October survey when diatoms dominated the phytoplankton community. The most abundant diatoms (Chaetoceros spp., Cyclotella spp., and Asterionellopsis glacialis) displayed maximum values in the middle of the estuary (stations 7–11). In contrast, other diatoms, most dinoflagellates and silicoflagellates, were distributed following the along-estuary gradient similar to the June survey.
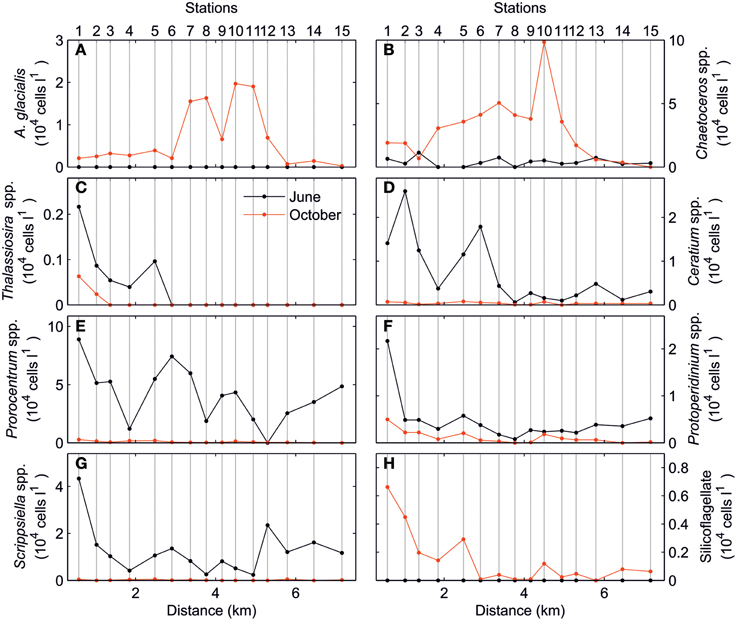
Figure 5. Total cell abundance (104 cells l−1) of (A) Asterionellopsis glacialis, (B) Chaetoceros spp., (C) Thalassiosira spp., (D) Ceratium spp., (E) Prorocentrum spp., (F) Protoperidinium spp., (G) Scrippsiella spp., and (H) Silicoflagellate for June (black) and October (red) surveys.
The along-estuary variations of the ELF-labeled cell percentages for main phytoplankton taxa are shown in Figure 6. As mentioned above, AP was mainly expressed by dinoflagellate taxa. Diatoms only expressed AP in relatively high proportion in the inner estuary during the June survey. This ELF signal was associated with species such as Chaetoceros spp. and Thalassiosira spp. As for the dinoflagellates, ELF for Ceratium spp., Prorocentrum spp., Protoperidinium spp., and Scrippsiella spp. followed the same along-estuary gradient as total cells in the June survey. In the October survey, the along-estuary gradient was less clear for Ceratium spp., Prorocentrum spp., and Scrippsiella spp.
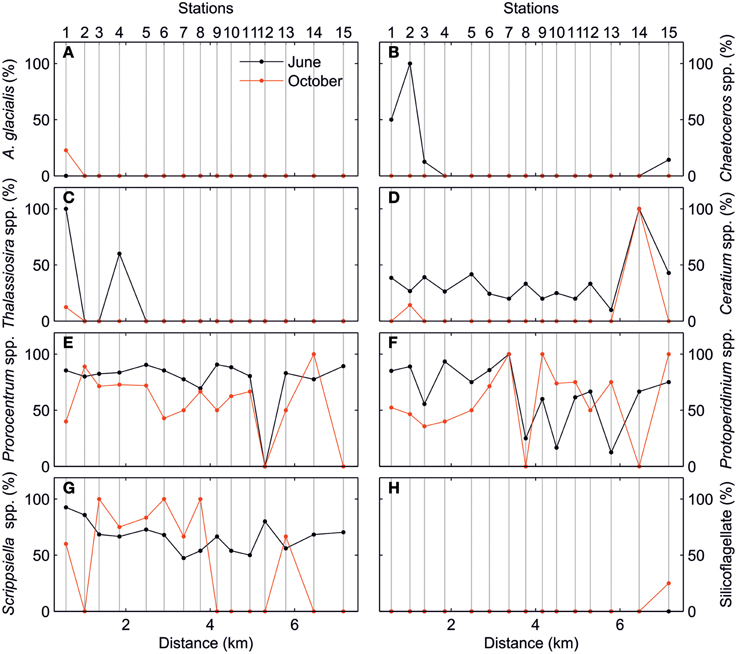
Figure 6. Percentage of ELF-labeled cells (%) of (A) Asterionellopsis glacialis, (B) Chaetoceros spp., (C) Thalassiosira spp., (D) Ceratium spp., (E) Prorocentrum spp., (F) Protoperidinium spp., (G) Scrippsiella spp., and (H) Silicoflagellate for June (black) and October (red) surveys.
P Addition Bioassay
The nutrient concentrations in the initial conditions for this bioassay were DIN 1.47 μmol L−1, Pi 0.09 μmol L−1, DOP 0.17 μmol L−1. The phytoplankton community was dominated mainly by dinoflagellates (Figure 7), small unidentified dinoflagellates (42%), Prorocentrum spp. (19%), and Dinophysis spp. (13%). Diatoms, mainly small unidentified diatoms (8%) and Pseudo-nitzschia (4%), accounted for less than 16% of the phytoplankton community. Only 4 dinoflagellate taxa (Prorocentrum spp., Protoperidinium spp., Scrippsiella spp., and small unidentified dinoflagellates) expressed ELF. Figure 7 shows the total and ELF-labeled cell abundance for Prorocentrum spp., Protoperidinium spp. and Scrippsiella spp., and for Dinophysis spp. as example of species that did not express AP in the bioassay. Total cell abundance followed a similar trend decreasing with the addition of 0.08 μmol L−1, and increasing with the additions of 0.5 and 2.0 μmol L−1. The ELF-labeled cells in the control treatment always exceeded the 20% of the total for each taxon. This percentage rapidly responded to P additions decreasing to values < 10%, even at the lowest P addition (+0.08 μmol L−1). Also, ~5% of the total cells expressed AP even at highest P addition, suggesting that either some of the cells use other P sources even in the presence of high Pi concentrations and/or that the change in the metabolism of some dinoflagellate species is a slow process; Protoperidinium spp. was an exception to the general response to increased P addition. At the same time, the AP was expressed in almost 100% of the Protoperidinium spp. cells present.
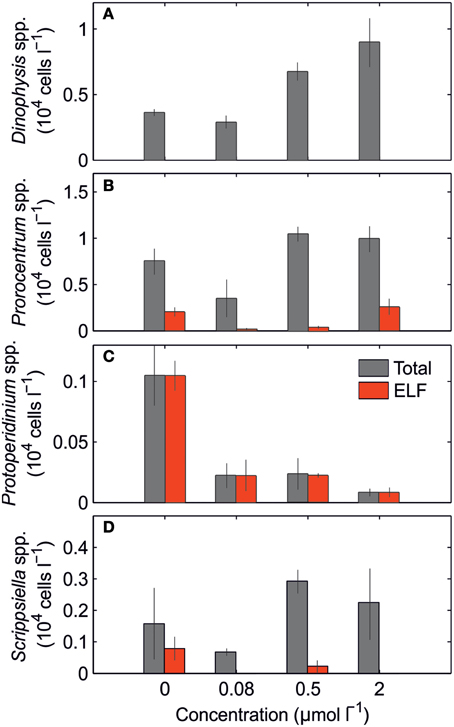
Figure 7. Mean (± S.D.) total and ELF-labeled cells abundance (104 cells l−1) of (A) Dinophysis spp., (B) Prorocentrum spp., (C) Protoperidinium spp., and (D) Scrippsiella spp. after 3 days of incubation for the control and Pi enriched treatments.
Discussion
Environmental Status
Our results reveal two contrasting hydrographic scenarios in the Mahon estuary. In the June survey, the water column was highly stratified, favored by the high heat flux during summer and the reduced tidal stirring. Moreover, the deeper water mass became isolated from the atmosphere, and also from the offshore waters due to the presence of a sill in the mouth of the estuary. The seaward flow of the surface layer resulted in a net, although weak, offshore transport. Water residence time was roughly estimated at some 18 ± 7 days, based on the assessment of freshwater replacement time. The physical setting in the October survey reveals a well-defined pattern characterized by weak vertical stratification and reversed estuarine circulation. In this scenario, longitudinal exchange due to buoyancy effects is expected to be weak, and the inverse structure could be considered as a result of long residence times (Largier et al., 1997; Nidzieko and Monismith, 2013). Based on the salinity gradient, the residence time was estimated to be 38 ± 14 days, suggesting strong decoupling between estuarine and offshore waters.
In spite of the different hydrodynamic situations, the inorganic nutrient concentrations displayed a relatively similar pattern in both surveys. The enhanced Pi concentrations in the inner estuary, and in the vicinity of Es Castell, suggest nutrient enrichment from terrestrial and/or anthropogenic sources (i.e., city mains, port activities). The June survey showed an overall higher DIN and Pi concentrations than that of October. Differences in DIN could be related to an increased ammonium level, which may be either indicative of intense zooplankton activity, or of reductive conditions in the deepest parts of the estuary (Figure 4B). Recovery of Pi levels may also be occurring via DOP remineralization. Strong top-down control by zooplankton explains the lower phytoplankton standing stock in this season. Contrastingly, a very different situation occurs in October, when biomass is enhanced (Chla 2.33 ± 1.5 μg L−1) but nutrient levels decreased. Differences in nutrients could be partially explained through sequestration in the phytoplankton standing stock. For example, assuming a Pi:Chla ratio of 1 g g−1, differences of up to 0.04 μmol L−1 could be justified by the differences in biomass between surveys. This would indicate an excess of inorganic nutrients and, possibly, a bloom prior to the October survey. Since rainfall was anomalously low in the weeks preceding the October survey, we attribute this higher nutrient availability to water column mixing, and to a sudden release of nutrients from the deeper layer caused by mixing. This process could bring nutrients, as well as organic compounds, from the isolated deep water mass to the surface, fuelling the phytoplankton growth.
Species-specific P Nutrition Sources
ELF characteristically forms precipitates at the site of AP activity, indicating which cells are responding to P limitation through the production of AP (Gonzalez-Gil et al., 1998). Accordingly, our results reveal that at least part of the microphytoplankton community at Mahon presented some degree of P-starvation in both surveys. This is consistent with the elevated N:P ratios (above Redfield values) which also suggest P limitation. However, laboratory and field studies also reveal AP activity regulation by ambient phosphate concentrations (i.e., Cembella et al., 1984). While our bioassay generally confirms cessation of AP activity in most of the species in response to increased Pi, interpretation of ELF in natural conditions can be more challenging. For example, Mahaffey et al. (2014) suggest that while the phosphate concentration may have a first order control on the AP activity rates, other factors such as co-limitation by trace metals, influence the AP differences observed among oceanic regions. Differences in micro-nutrient requirements could also influence the species-specific response to ambient Pi concentrations.
In our case, we observed that Pi concentrations were slightly, though significantly, enhanced when AP activity was higher (0.09 ± 0.02 and 0.06 ±0.02 μmol L−1 in June and October, p < 0.05). Several causes could explain this apparently contradictory fact (higher Pi and higher AP activity). P stress is defined as a physiological response to a low level of Pi, and the concentrations we measured are in the lower range of the values for marine systems (i.e., Benitez-Nelson, 2000; Conkright et al., 2000); particularly if we consider that the standing stock in Mahon is relatively high as compared with open Mediterranean waters. Therefore, the conditions both in June and in October could be similarly stressful. ELF labeling at these low P concentrations does not necessarily have to increase linearly with increasing Pi concentrations. In fact, competition with more efficient organisms, such as smaller phytoplankton cells (i.e., Synechococcus) and heterotrophic bacteria, which are abundant during this season (e.g., Agawin et al., 1998), may only leave a small proportion of ambient Pi available to larger microphytoplankton cells and thus forcing them to use organic P sources, which otherwise seem a rather available P-source. This also supports the idea that intracellular pools rather than ambient concentrations could be determining AP activity (i.e., Myklestad and Sakshaug, 1983; Gage and Gorham, 1985). Finally, increased Pi in June could be in response to intense extracellular DOP hydrolysis driven by AP and other enzymes (nucleotidases, kinases, or lyases) that release of orthophosphate ions to the environment (Ammerman and Azam, 1991).
It is found that AP activity was mainly expressed by dinoflagellates in both surveys. It is expected that different taxa would present diverse strategies for coping with P limitation, but even among the dinoflagellates, it is likely that there will be species with different physiological P status, despite being exposed to identical ambient concentrations of Pi and DOP (Mackey et al., 2007, 2012; Peacock and Kudela, 2013). Indeed, our bioassay reveals that even at the highest Pi concentrations some dinoflagellate species presented ELF. Plausible explanations are that either the dinoflagellates were P limited under those conditions, or that they had a slow regulatory response to Pi availability (e.g., Litchman and Nguyen, 2008). However, the generalized use of AP suggests a survival strategy in dinoflagellates to compensate for their less efficient competition for resources (Dyhrman and Palenik, 1999; Dyhrman and Ruttenberg, 2006). Other studies have also measured significant AP activity in high Pi systems (e.g., Nicholson et al., 2006), which questions the use of bulk AP activity as an indicator of Pi limitation.
In our bioassay, the addition of Pi resulted in a decrease of ELF in dinoflagellates such as Prorocentrum spp. and Scrippsiella spp., indicating a preferential use of Pi. Cessation in AP production has been explained in terms of energy cost of these enzymes (Chröst and Overbeck, 1987). Conversely, the production of AP in Protoperidinium spp. was a constant feature in the bioassay. The genus Protoperidinium is composed of some heterotrophic species known to perform extracellular digestion (Gaines and Elbrächter, 1987). The production of AP by heterotrophic dinoflagellate species is related to digestion and related metabolic processes (Skelton et al., 2006). Therefore, the expression of AP in many of Protoperidinium spp. cells observed in the bioassay could be indicative of cell catabolism rather than of DOP uptake.
The reasons behind the comparatively lower ELF in October could be attributed to different factors. There is a straightforward interpretation in relation to the change in species composition. Diatoms dominated the microphytoplankton assemblage during this survey and P status of diatoms is known to be more tightly controlled by Pi availability than it is for dinoflagellates (Dyhrman and Palenik, 1999; Dyhrman and Ruttenberg, 2006; Nicholson et al., 2006). However, this does not by itself explain the lowered AP activity because flagellates also presented reduced AP. As discussed in the precedent section we suggest that the higher phytoplankton biomass in October was caused by an increase in the nutrient availability and growth during the days prior to the survey. In other Mediterranean estuaries, Pi buildup has been observed during hypersaline conditions associated with heterotrophic decomposition of particulate organic matter (Christie, 1981; Largier et al., 1997). Phytoplankton may display luxurious feeding when nutrients are readily available and contain sufficient internal stores of P to avoid synthesizing AP (John and Flynn, 2000). Under these conditions diatoms could be competitively favored because of their faster growth and nutrient uptake rates. In fact, diatoms present in the October survey were amongst the lowest cells expressing AP. Without excluding seasonal variations in plankton composition and metabolism such substitution of Synechococcus by the less P-efficient Prochlorococcus cells at the end of summer, or decrease in heterotrophic bacteria activity at lower temperature, could also favor the availability of a larger Pi pool to microphytoplankton in this survey.
Conclusion
Our results show that the interaction between hydrography and nutrient sources played a prominent role in the regulation of plankton communities in the Mahon estuary, which may ultimately alter the entire plankton trophodynamics. Also, while preference for Pi in most species is acknowledged, both organic and inorganic P-pools sources are exploited by the different groups of microphytoplankton possibly due to internal and external factors. This yields a wide variety of species-specific strategies to satisfy the nutritional requirements. Indeed, our results show that ELF did not indicate generalized P-deficiency in the phytoplankton community of Mahon. Various factors may regulate AP activity, such as internal P storage, or the composition of the phytoplankton community, as well as the specific physiological requirements. This should be taken into account when interpreting AP as P-deficiency indicator, particularly in the case of some dinoflagellate species which use DOP even when Pi is relatively high. In addition, nutritional modes of particular species such as heterotrophy also need to be considered. Therefore, it is important to assess the whole phytoplankton community, at genus/species level, in studies of either organic or inorganic P uptake capabilities.
Conflict of Interest Statement
The authors declare that the research was conducted in the absence of any commercial or financial relationships that could be construed as a potential conflict of interest.
Acknowledgments
This work was financed by the Ministerio de Economía y Competitividad (MINECO) grants EHRE (CTM2009-08270) and GRADIENTS (CTM2012-39476-C02-01). MM work was funded by a JAE-doc contract from the Spanish Ministry of Economy and Competitiveness. SA was supported by a Marie Curie International Outgoing Fellowship within the 7th European Community Framework Programme (GA-302562), and AJ by a Ramón y Cajal contract from the Spanish Ministry of Economy and Competitiveness. We are indebted to Puertos del Estado and Autoritat Portuaria de Balears for support during sampling and providing meteorological data. Also, thanks Ana Massanet, Itziar Alvarez, and David Sanchez for their collaboration in the development of the experimental and labs part of this research.
References
Agawin, N. S. R. A., Duarte, C. M., and Agustí, S. (1998). Growth and abundance of Synechococcus sp. in a Mediterranean Bay: seasonality and relationship with temperature. Mar. Ecol. Prog. Ser. 170, 45–53. doi: 10.3354/meps170045
Ammerman, J., Hood, R., Case, D., and Cotner, J. (2003). Phosphorus deficiency in the Atlantic: an emerging paradigm in oceanography. EOS Trans. Am. Geophys. Union 84, 165–170. doi: 10.1029/2003EO180001
Ammerman, J. W., and Azam, F. (1991). Bacterial 5′-nucleotidase activity in estuarine and coastal marine waters: role in phosphorus regeneration. Limnol. Oceanogr. 36, 1437–1447. doi: 10.4319/lo.1991.36.7.1437
Basterretxea, G., Garcés, E., Jordi, A., Anglès, S., and Masó, M. (2007). Modulation of nearshore harmful algal blooms by in situ growth rate and water renewal. Mar. Ecol. Prog. Ser. 352, 53–65. doi: 10.3354/meps07168
Basterretxea, G., Tovar-Sanchez, A., Beck, A. J., Masqué, P., Bokuniewicz, H. J., Coffey, R., et al. (2010). Submarine groundwater discharge to the coastal environment of a Mediterranean island (Majorca, Spain): ecosystem and biogeochemical significance. Ecosystems 13, 629–643. doi: 10.1007/s10021-010-9334-5
Benitez-Nelson, C. (2000). The biogeochemical cycling of phosphorus in marine systems. Earth Sci. Rev. 51, 109–135. doi: 10.1016/S0012-8252(00)00018-0
Carstensen, J., Sánchez-Camacho, M., Duarte, C. M., Krause-Jensen, D., and Marbà, N. (2011). Connecting the dots: responses of coastal ecosystems to changing nutrient concentrations. Environ. Sci. Technol. 45, 9122–9132. doi: 10.1021/es202351y
Cembella, A. D., Antia, N. J., and Harrison, P. J. (1984). The utilization of inorganic and organic phosphorus compounds as nutrients by eukaryotic microalgae: a multidisciplinary perspective: Part 1. Crit. Rev. Microbiol. 10, 317–391. doi: 10.3109/10408418209113567
Christie, N. D. (1981). “Primary production in Langebaan Lagoon” in Estuarine Ecology, ed J. H. Day (Rotterdam: Balkema), 101–115.
Chröst, R. J., and Overbeck, J. (1987). Kinetics of alkaline phosphatase activity and phosphorus availability for phytoplankton and bacterioplankton in lake Plubsee (North German eutrophic lake). Microb. Ecol. 13, 229–248. doi: 10.1007/BF02025000
Cloern, J. E. (2001). Our evolving conceptual model of the coastal eutrophication problem. Mar. Ecol. Prog. Ser. 210, 223–253. doi: 10.3354/meps210223
Conkright, M. E., Gregg, W. W., and Levitus, S. (2000). Seasonal cycle of phosphate in the open ocean. Deep Sea Res. 47, 159–175. doi: 10.1016/S0967-0637(99)00042-4
Conley, D. J., Paerl, H. W., Howarth, R. W., Boesch, D. F., Seitzinger, S. P., Havens, K. E., et al. (2009). Controlling eutrophication: nitrogen and phosphorus. Science 323, 1014–1015. doi: 10.1126/science.1167755
Cotner, J. B., Sada, R. H., Bootsma, H., Johengen, T., Cavaletto, J. F., and Gardner, W. S. (2000). Nutrient limitation of heterotrophic bacteria in Florida Bay. Estuaries. 23, 611–620. doi: 10.2307/1352888
Cotner, J. J. B., and Wetzel, R. G. (1992). Uptake of dissolved inorganic and organic phosphorus compounds by phytoplankton and bacterioplankton. Limnol. Oceanogr. 37, 232–243. doi: 10.4319/lo.1992.37.2.0232
Currie, D. J., and Kalff, J. (1984). The relative importance of bacterioplankton and phytoplankton in phosphorus uptake in freshwater. Limnol. Oceanogr. 29, 311–321. doi: 10.4319/lo.1984.29.2.0311
Dyhrman, S. T., and Palenik, B. (1999). Phosphate stress in cultures and field populations of the dinoflagellate Prorocentrum mínimum detected by a single-cell alkaline phosphatase assay. Appl. Environ. Microbiol. 65, 3205–3212.
Dyhrman, S. T., and Ruttenberg, K. C. (2006). Presence and regulation of alkaline phosphatase activity in eukaryotic phytoplankton from the coastal ocean: implications dissolved organic phosphorus remineralization. Limnol. Oceanogr. 51, 1381–1390. doi: 10.4319/lo.2006.51.3.1381
Gage, M. A., and Gorham, E. (1985). Alkaline phosphatase activity and cellular phosphorus as an index of the phosphorus status of phytoplankton in Minnesota lakes. Freshw. Biol. 15, 227–233. doi: 10.1111/j.1365-2427.1985.tb00195.x
Gaines, G., and Elbrächter, M. (1987). “Heterotrophic nutrition,” in The Biology of Dinoflagellates, ed F. J. R. Taylor (Oxford: Blackwell Scientific Publications).
Gonzalez-Gil, S., Keafer, B., Jovine, R., and Anderson, D. M. (1998). Detection and quantification of alkaline phosphatase in single cells of phosphorus-limited marine phytoplankton. Mar. Ecol. Prog. Ser. 164, 21–35. doi: 10.3354/meps164021
Grasshoff, K., Ehrhardt, M., and Kremling, K. (1983). Methods of Seawater Analysis. Weinheim: Verlag-Chemie.
Hernández, I., Niell, F. X., and Whitton, B. A. (2002). Phosphatase activity of benthic marine algae. An overview. J. Appl. Phycol. 14, 475–487. doi: 10.1023/A:1022370526665
Huang, B., Ou, L., Hong, H., Luo, H., and Wang, D. (2005). Bioavailability of dissolved organic phosphorus compounds to typical harmful dinoflagellate Prorocentrum donghaiense Lu. Mar. Pollut. Bull. 51, 838–844. doi: 10.1016/j.marpolbul.2005.02.035
Ivancic, I., Fuks, D., Radic, T., Lyons, D. M., Silovic, T., Kraus, R., et al. (2010). Phytoplankton and bacterial alkaline phosphatase activity in the northern Adriatic Sea. Mar. Environ. Res. 69, 85–94. doi: 10.1016/j.marenvres.2009.08.004
Jansson, M., Olsson, H., and Pettersson, K. (1988). Phosphatases: origin, characteristics and function in lakes. Hydrobiologia 170, 157–175. doi: 10.1007/BF00024903
John, E. H., and Flynn, K. J. (2000). Modelling phosphate transport and assimilation in microalgae; how much complexity is warranted?. Ecol. Model. 125, 145–157. doi: 10.1016/S0304-3800(99)00178-7
Krom, M. D., Kress, N., Brenner, S., and Gordon, L. I. (1991). Phosphorus limitation of primary productivity in the eastern Mediterranean Sea. Limnol. Oceanogr. 36, 424–432. doi: 10.4319/lo.1991.36.3.0424
Largier, J. E., Hearn, C. J., and Chadwick, D. B. (1996). “Density structures in low inflow estuaries,” in Buoyancy Effects in Coastal and Estuarine Dynamics, ed D. G. Aubrey and C. T. Friedrichs (Washington, DC: Coastal Estuarine Stud.), 227–241.
Largier, J. L., Smith, S. V., and Hollibaugh, J. T. (1997). Seasonally hypersaline estuaries in mediterranean-climate regions. Estuar. Coast. Shelf Sci. 45, 789–797. doi: 10.1006/ecss.1997.0279
Li, H., Veldhuis, M., and Post, A. (1998). Alkaline phosphatase activities among planktonic communities in the northern Red Sea. Mar. Ecol. Prog. Ser. 173, 107–115. doi: 10.3354/meps173107
Litchman, E., and Nguyen, B. L. V. (2008). Alkaline phosphatase activity as a function of internal phosphorus concentration in freshwater phytoplankton. J. Phycol. 44, 1379–1383. doi: 10.1111/j.1529-8817.2008.00598.x
Mackey, K. R. M., Labiosa, R. G., Calhoun, M., Street, J. H., and Paytan, A. (2007). Phosphorus availability, phytoplankton community dynamics, and taxon-specific phosphorus status in the Gulf of Aqaba, Red Sea. Limnol. Oceanogr. 52, 875–885. doi: 10.4319/lo.2007.52.2.0873
Mackey, K. R. M., Mioni, C. E., Ryan, J. P., and Paytan, A. (2012). Phosphorus cycling in the red tide incubator region of Monterey Bay in response to upwelling. Front. Microbiol. 3:33. doi: 10.3389/fmicb.2012.00033
Mahaffey, C., Reynolds, S., Davis, C. E., and Lohan, M. C. (2014). Alkaline phosphatase activity in the subtropical ocean: insights from nutrient, dust and trace metal addition experiments. Front. Mar. Sci. 1:73. doi: 10.3389/fmars.2014.00073
Monaghan, E. J., and Ruttenberg, K. C. (1999). Dissolved organic phosphorus in the coastal ocean: reassess ment of available methods and seasonal phosphorus profiles from the Eel River Shelf. Limnol. Oceanogr. 44, 1702–1714. doi: 10.4319/lo.1999.44.7.1702
Myklestad, S., and Sakshaug, E. (1983). Alkaline phosphatase activity of Skeletonema costatum populations in the Trondheimsfjord. J. Plankton Res. 5, 557–564.
Nicholson, D., Dyhrman, S., Chavez, F., and Paytan, A. (2006). Phosphorus status of marine phytoplankton communities in Monterey Bay and San Francisco Bay. Limnol. Oceanogr. 51, 874–883. doi: 10.4319/lo.2006.51.2.0874
Nidzieko, N. J., and Monismith, S. G. (2013). Contrasting seasonal and fortnightly variations in the circulation of a seasonally inverse estuary, Elkhorn Slough, California. Estuaries Coasts 36, 1–17. doi: 10.1007/s12237-012-9548-1
Nixon, S. W. (1995). Coastal marine eutrophication: a definition, social causes, and future concerns. Ophelia 41, 199–219. doi: 10.1080/00785236.1995.10422044
Peacock, M. B., and Kudela, R. M. (2013). Alkaline phosphatase activity detected in distinct phytoplankton communities in the northern Gulf of Alaska. Mar. Ecol. Prog. Ser. 473, 79–90. doi: 10.3354/meps10069
Skelton, H. M., Parrow, M. W., and Burkholder, J. M. (2006). Phosphatase activity in theheterotrophic dinoflagellate Pfiesteria shumwayae. Harmful Algae 5, 395–406. doi: 10.1016/j.hal.2006.04.010
Thingstad, T. F., Zweifel, U. L., and Rassoulzadegan, F. (1998). P limitation of heterotrophic bacteria and phytoplankton in the northwest Mediterranean. Limnol. Oceanogr. 43, 88–94. doi: 10.4319/lo.1998.43.1.0088
Tovar-Sánchez, A., Basterretxea, G., Rodellas, V., Sánchez-Quiles, D., García-Orellana, J., Masqué, P., et al. (2014). Contribution of groundwater discharge to the coastal dissolved nutrients and trace metal concentrations in Majorca Island: karstic vs detrital systems. Environ. Sci. Technol. 48, 11819–11827. doi: 10.1021/es502958t
Keywords: enzyme-labeled fluorescence, alkaline phosphatase activity, phosphorus limitation, nutrient ratios, phytoplankton
Citation: Martínez-Soto MC, Basterretxea G, Garcés E, Anglès S, Jordi A and Tovar-Sánchez A (2015) Species-specific variation in the phosphorus nutritional sources by microphytoplankton in a Mediterranean estuary. Front. Mar. Sci. 2:54. doi: 10.3389/fmars.2015.00054
Received: 13 March 2015; Accepted: 20 July 2015;
Published: 07 August 2015.
Edited by:
Claire Mahaffey, University of Liverpool, UKReviewed by:
Gordon T. Taylor, Stony Brook University, USAKarin M. Björkman, University of Hawaii, USA
Sarah Elizabeth Reynolds, University of Portsmouth, UK
Copyright © 2015 Martínez-Soto, Basterretxea, Garcés, Anglès, Jordi and Tovar-Sánchez. This is an open-access article distributed under the terms of the Creative Commons Attribution License (CC BY). The use, distribution or reproduction in other forums is permitted, provided the original author(s) or licensor are credited and that the original publication in this journal is cited, in accordance with accepted academic practice. No use, distribution or reproduction is permitted which does not comply with these terms.
*Correspondence: Marly C. Martínez-Soto, Department of Ecology and Marine Resources, Mediterranean Institute for Advanced Studies, Universidad de las Islas Baleares - Consejo Superior de Investigaciones Científicas, IMEDEA, Carrer Miquel Marquez, 21, Esporles, Islas Baleares 07190, Spain, marly@imedea.uib-csic.es