Public preferences for endangered species recovery: an examination of geospatial scale and non-market values
 Kristy Wallmo
 Daniel K. Lew
- 1Office of Science and Technology, Economics and Social Analysis Division, National Marine Fisheries Service, Silver Spring, MD, USA
- 2Resource Ecology and Fisheries Management Division, Alaska Fisheries Science Center, National Marine Fisheries Service, Seattle, WA, USA
- 3Department of Environmental Science and Policy, University of California, Davis, CA, USA
Non-market valuation allows society to express their preferences for goods and services whose economic value is not reflected in traditional markets. One issue that arises in applying non-market values in policy settings is defining the extent of the economic jurisdiction—the area that includes all people who hold values—for a good or service. In this paper, we estimate non-market values for recovering eight threatened and endangered marine species in the US for two geographically embedded samples: households on the west coast of the US and households throughout the nation. We statistically compare species values between the two samples to help determine the extent of and variation in the economic jurisdiction for endangered species recovery. Our findings offer support to the tenet that the summation of non-market values across the country is appropriate when evaluating alternative policies for endangered species recovery.
Introduction
In April of 2013 there were 1438 plants and animals listed as endangered or threatened in the U.S. under the U.S. Endangered Species Act (ESA) (US Fish and Wildlife Service Species Reports, 2013a). Since the inception of the ESA in 1973, the U.S. Fish and Wildlife Service has declared < 2% of species listed under the Act as “recovered” (US Fish and Wildlife Service Species Reports, 2013b). Although a handful of species have made progress towards recovery, limited public funding combined with species habitat degradation and threats from invasive species render a “recovered” designation for many ESA-listed species increasingly unrealistic (Scott et al., 2005). Concepts such as a recovery continuum (Scott et al., 2005) or the use of protected areas (Blossey, 2012) may be more feasible or effective than the current process, though, as Scott et al. (2005) note, “societal values determine how much effort or how many resources should be allocated to preventing extinctions and maintaining populations of rare or threatened species.”
One method that allows society to express its value for species conservation is non-market valuation. Though putting a dollar value on nature is often debated (Ehrenfeld, 1988; Blossey, 2012; Marvier, 2012), the method can provide a systematic assessment of society's preferences for recovering species and offers a common numeraire, a dollar value, for policy analysts to evaluate tradeoffs. One issue that arises in applying non-market values in policy settings is defining the extent of the economic jurisdiction—the area that includes all people who hold values. This involves understanding whether values for a non-market good (a public good, like protecting species) extend only to those living in close proximity to the good or to a larger geographic scale. From a policy perspective, this is critical as it determines the population upon which to sum individual or household values (Bateman et al., 2006). Compounding this is the heterogeneity that may exist for a non-market good across different spatial scales. Previous research has demonstrated a distance-decay function for non-market values where the value of a good decreases as the distance from the good increases. For example Georgiou et al. (2000) found that willingness-to-pay (WTP), an economic measure of value, for a large improvement in river water quality declined to zero at a distance of about 36 miles from the river site. The distance-decay effect has been observed for use values (e.g., values for non-market goods that people use, such as parks or recreation sites) and non-use values (e.g., values for goods that people may never see or use but are nonetheless willing to pay to preserve, Bateman et al., 2002; Hanley et al., 2003).
In contrast to the above, Giraud and Valcic (2004) found that non-use values for Steller sea lion preservation were larger as the geographic extent of the market increased. The Steller sea lion is found primarily in waters of the North Pacific Ocean, Gulf of Alaska, and Bering Sea. In examining willingness-to-pay for the species protection across geographically embedded samples they found that values were highest for the U.S. sample, followed by values for the state of Alaska, and then the Alaskan Boroughs containing Steller sea lion critical habitat. This finding may be due to the fact that local populations may bear a disproportionate share of the cost of protection (in terms of resource use restrictions), uncertainty about protection measures being successful, knowledge levels in different regions (Giraud and Valcic, 2004), or other latent rationale.
Though the Giraud and Valcic (2004) results are dissimilar to the general findings on distance-decay, the increased fishing restrictions associated with protecting the species in their study—the Steller sea lion—have potentially negative impacts on employment in local communities, and this may have caused the lower WTP values at closer proximities to the resource. In this study, we use a similar approach to Giraud and Valcic (2004) by estimating values for eight different species for two geographically embedded samples (of different spatial scale): (a) the west coast region of California, Oregon, and Washington and (b) the entire U.S. For each, we estimate values for recovering taxonomically dissimilar species including the hawksbill sea turtle Eretmochelys imbricata, southern resident killer whale Orcinus orca, humpback whale Megaptera novaeangliae, Southern California steelhead Oncorhynchus mykiss, Central California coast Coho salmon Oncorhynchus kisutch, black abalone Haliotis cracherodii, Elkhorn coral Acropora palmata, and Johnson's seagrass Halophila johnsonii. The species' distributions are also disparate, ranging from localized state or regional populations to worldwide. Following Giraud and Valcic (2004) we test whether the values for species recovery are statistically different for the geographically embedded samples. In addition to adding eight species values to the non-market valuation literature, most of which have not been previously valued, our findings have important policy implications as they inform on the extent of and variation in the economic jurisdiction for endangered species recovery.
Materials and Methods
Survey Design and Implementation
Economic preferences for the eight species listed above were collected in a survey containing several stated preference choice experiment (SPCE) questions. The species, their ESA status, and geographic range are shown in Table 1. The SPCE approach is grounded in Lancastrian consumer theory (Lancaster, 1966), which specifies that an individual's utility for a good is a function of its attributes. In a SPCE, respondents are asked to choose between two or more alternatives that differ in several attributes. These attributes have a range of levels, and experimental design plans are used to generate different combinations of attributes and levels seen by respondents in each of several survey questions and survey versions. By including price as an attribute in an SPCE, the economic value of changes in attribute levels can be estimated. For a detailed explanation of the SPCE approach, see Adamowicz et al. (1998).
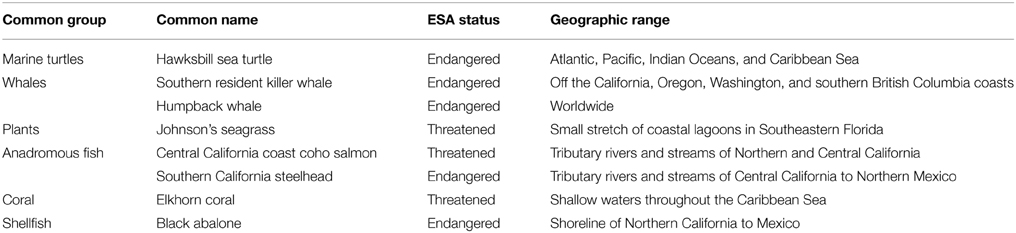
Table 1. Species in the stated preference choice experiment survey.
The stated preference choice experiment survey was developed over a 3-year qualitative research period that included a series of focus groups, one-on-one cognitive interviews, and pretesting activities. Although the overall survey framework included eight species, qualitative research indicated that including more than three species in any one survey version was too much information for respondents to evaluate. Therefore, each survey version included information about a subset of three of the eight species. An experimental design plan was used to select the three species appearing in each survey and the improvements (if any) in each alternative in terms of the ESA-status (endangered, threatened, or recovered) for each species achieved 50 years from now. All future ESA-status levels were described as a result of additional protection measures undertaken for one or more of the species.
In the survey instrument, respondents were provided with basic information about each of the three species and additional protection measures (above and beyond current protection actions) that could be undertaken to improve the species' future ESA-status level. Respondents were then shown three separate SPCE questions (Figure 1), with each question containing a status-quo (a no-cost alternative that had no improvements to the ESA-status levels of any species) and two additional alternatives that improved the future ESA-status level for one or more species, at an increased cost to the household. The cost to the household is described in terms of a combination of increased taxes and costs of goods and services affected by the additional protection actions. Respondents were asked to indicate their most preferred and least preferred option, allowing for a full rank ordering of preferences.
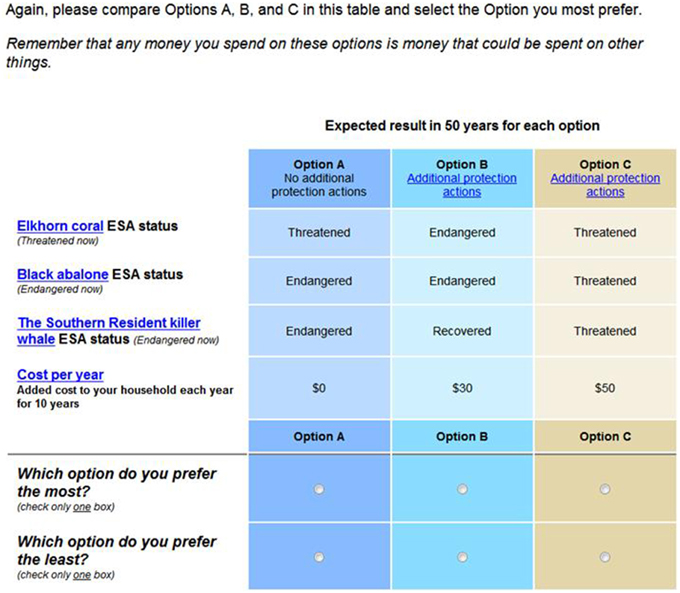
Figure 1. Example of stated preference choice experiment question.
The survey was implemented in October and November of 2010 by Knowledge Networks (KN) utilizing a random sample of the KN web-enabled panel of U.S. households (for information on Knowledge Networks web-enabled panel and panel recruitment methods see www.knowledgenetworks.com). A modified Dillman et al. (2009) approach was used to field 16,359 surveys to randomly selected panel respondents across the U.S. A total of 10,637 surveys were completed, resulting in a completion rate of 65%. Of the 16,359 surveys fielded at the national level, 2684 were fielded to households in California, Oregon, and Washington and 1742 of these were completed, resulting in the same completion rates for the geographically embedded west coast region and national samples.
Data Analysis
SPCE data are analyzed using models grounded in random utility theory, which specifies that utility for a good consists of a systematic, known component and a random component (an error term). Individuals are assumed to choose a good (from a set of goods) that maximizes their utility, with utility being a function of the good's attributes. In this case, the good is the alternative protection program and the good's attributes are the species ESA-status levels. The set of goods are the two increased-cost alternatives and a no-cost alternative, described above. Due to the significant literature on stated preference choice experiment theory and models (see Louviere et al., 2000) we omit a detailed accounting here, noting that the model specification for this application is a panel rank-ordered random parameters logit (see Lew et al., 2010 for further details on this model specification)1.
WTP for species recovery was calculated over the distribution of species parameters using a simulation-based estimation procedure, following standard formulas for the measurement of economic values2 derived from discrete choice models (Small and Rosen, 1981). Ninety-five percent confidence intervals were calculated following Krinsky and Robb (1986). WTP estimates and 95% confidence intervals were calculated for the national sample and embedded west coast region sample. To formally test whether the WTP estimates differed between samples we used a method of convolutions approach described by Poe et al. (2005) and employed by Giraud and Valcic (2004). Kolmogorov–Smirnov tests and t-tests were used to determine significant differences between the samples for non-choice task survey questions where responses are assumed to be categorical or linear, respectively. Statistical significance is reported at p < 0.05.
Results and Discussion
There were no significant differences between mean ages (national = 49.2, regional = 48.8), mean household size (national and regional = 2.7) and gender (national = 49.2% female, regional = 46.8%) for the national and regional samples. Median income range ($50,000–74,999) and median education level (some college) were the same for the national and regional samples, though the distributions for both demographic variables differed significantly between the groups (Table 2).
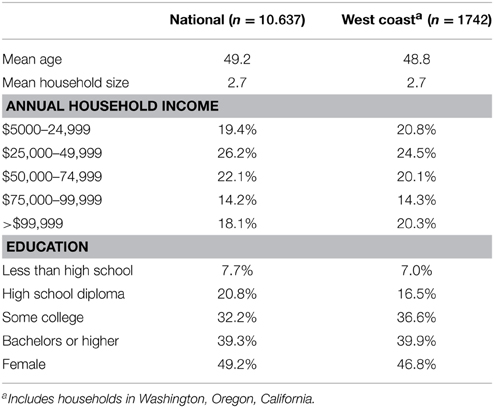
Table 2. Respondent demographics.
Significant differences exist between the samples in their familiarity with each species and their observation of each species in the wild (Table 3). Respondents were asked to indicate their familiarity with each species using a four-point likert scale ranging from “very familiar” to “not familiar at all” and whether they had personally observed the species in the wild, outside of zoos and aquariums. Response distributions between the national and regional samples differed significantly in their familiarity with the southern resident killer whale, Central California coast Coho salmon, Southern California steelhead, and black abalone. Respondents on the west coast were more familiar with these species than were respondents from the national sample. This is not surprising given the geographic proximity of these species to respondents on the west coast, which likely results in increased media exposure and opportunities to see the species in the wild as compared to respondents throughout the U.S. Similarly, more respondents from the west coast sample had observed these four species, as well as the humpback whale, in the wild.
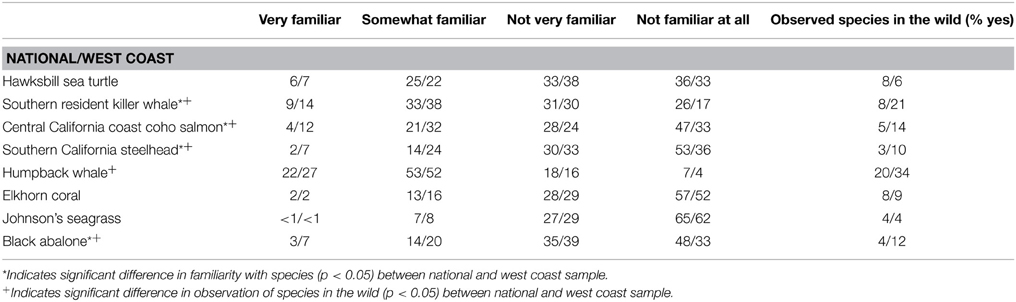
Table 3. Percent of respondents familiar with species.
Significant differences also exist between the national and west coast samples in the extent to which respondents felt their households would be affected by additional protection measures for the Central California coast Coho salmon and the Southern California steelhead, with respondents from the west coast sample stating they would be more affected than respondents from the national sample (Table 4). As Giraud and Valcic (2004) posit, those closest to the resource may bear a disproportionate share of the costs of species protection measures, though in our case the measurement scale does not differentiate between positive and negative effects on the household. Interestingly, for one protection measure for the southern resident killer whale involving increased efforts to prevent oil spills, significantly more respondents from the national sample stated they would be affected than did respondents from the west coast (For a full list of all protection measures and responses please see Supplementary Table 1).
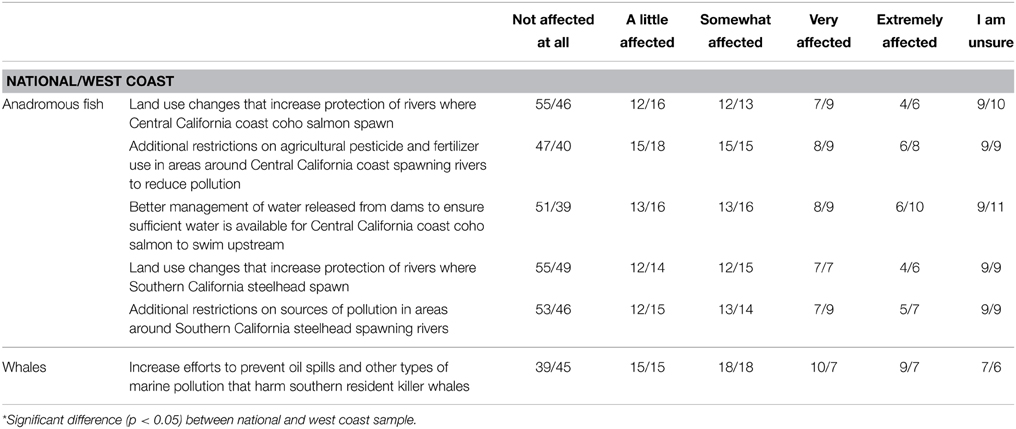
Table 4. Species protection measures that differ* between national and west coast respondents.
The estimated parameters for the national and west coast choice models are presented in Table 5. The results meet our a priori expectations that improving any of the eight species to a recovered status is utility increasing (i.e., a positive sign on the species parameter) for respondents in both the national and west coast samples. All parameter estimates for recovering a species are significant for both samples. Cost parameters are negative and significant for both samples, as expected.
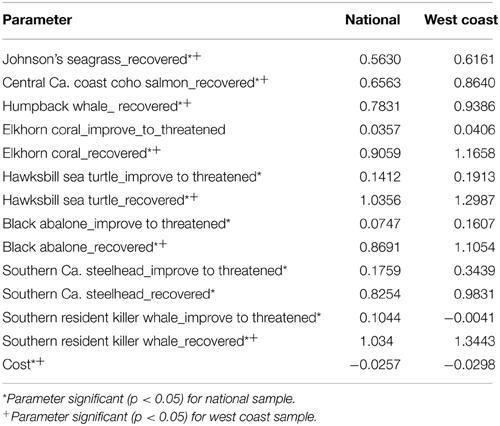
Table 5. Parameter estimates from choice models.
WTP for each species' recovery and associated 95% confidence intervals were calculated as described above and reported in Table 6 for both the national and west coast regional samples. No significant differences were found in recovery values for any of the species between the national and regional samples. For both samples, recovering the hawksbill sea turtle yielded the highest values, followed by southern resident killer whale and Elkhorn coral. Though we have not determined whether one species value is statistically higher (or lower) than another using the method of convolutions, any two species values with non-overlapping confidence intervals can be considered statistically different. It is also worth noting that the species that yielded the lowest recovery values—Johnson's seagrass, Central California coast Coho salmon, and humpback whale—all have an ESA-status of threatened, whereas the other five species are endangered. This may suggest that respondents are sensitive to the scope of the improvement, though statistical tests of scope sensitivity are beyond the focus of this paper (see Lew and Wallmo, 2011 for tests of scope sensitivity).
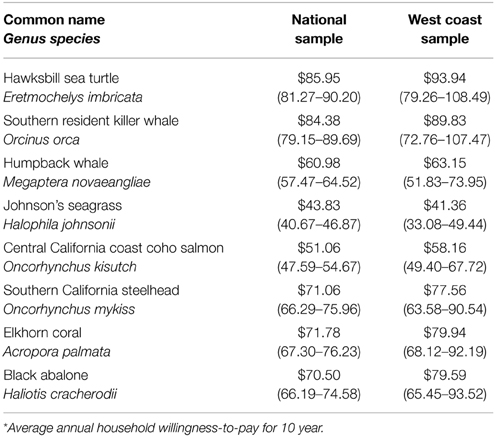
Table 6. WTP* (95% CI) for species recovery for national and west coast samples.
Conclusions
Our results demonstrate that recovering threatened and endangered marine species is economically valuable to the U.S. public. This should be of management and policy interest for several reasons. First, species value estimates can facilitate scenario analyses needed for coastal and marine spatial planning—an approach that is increasingly called for in U.S. ocean policy. For example, the Final Recommendations of the U.S. Ocean Policy Task Force (2009)3. require managers to consider the full suite of impacts—human and non-human—when designing policies that impact the ocean. Our value estimates provide economic benefit measures associated with actions that help recover or improve the status of a threatened or endangered species, thereby providing a more comprehensive account of the suite of benefits associated with particular policies. The estimates can also be useful inputs in standard benefit-cost models and ecological-economic models that inform ecosystem-based management (Sanchirico et al., 2013). In addition, value estimates for threatened and endangered species can be used in natural resource damage assessment cases and in recovery planning and critical habitat designation efforts.
In our examination of geographically embedded values for recovering threatened and endangered species, our results were unlike those of Giraud and Valcic (2004), as we found no differences between a national and west coast regional sample. It is not possible to determine whether our findings demonstrate distance decay, as we did not estimate a spatially explicit model. However, our results do show that on average recovery values for three localized U.S. west coast species and one species found from Northern California to Mexico were no different for national and west coast respondents. Likewise, recovery values from the west coast sample were no different than values from the national sample for Elkhorn coral and Johnson's seagrass, species found on the east coast and Caribbean Sea. These results may provide insight for the field of benefit transfer—the process of transferring a value from a study site to a policy site (Johnston and Rosenberger, 2010). In times of limited funding and financial constraints, the notion that values from small, localized samples are statistically similar to values from large scale national samples may help agencies in allocating their funds.
Our results do not support the concept that familiarity with a resource may induce higher values for the resource, nor do our results support the notion that those affected by measures undertaken to protect species may hold different values than those who are affected to a lesser extent or not at all. As Bateman et al. (2006) point out, spatial patterns observed in non-market values such as distance decay may depend on the type of good being valued. Perhaps in this case people believe that national wildlife should be managed as a public trust, intended not only for those in close geographic proximity to the resource but as a benefit for the entire country.
Although our research found no significant differences in WTP between geographically embedded samples, we did not test explicitly for different sources and types of preference heterogeneity (Boxall and Adamowicz, 2002; Wallmo and Edwards, 2008). Further research examining the effects of socio-economic variables (e.g., age, gender, income, and education) or other individual-specific characteristics on WTP could help identify opportunities to target specific policies and enhance the non-market valuation literature. In addition, while our research compares a national sample to only one region, our results support the concept that the economic jurisdiction for endangered species recovery includes the entire U.S. Future research comparing a larger array of geographically embedded samples, as well as explicitly testing for distance decay effects in species recovery values, would further inform this concept. This type of research is important for policy makers as it elucidates the extent of the summation of individual values when developing economically efficient policies for endangered species recovery.
Conflict of Interest Statement
The authors declare that the research was conducted in the absence of any commercial or financial relationships that could be construed as a potential conflict of interest.
Acknowledgments
We would like to acknowledge R. Felthoven and R. Curtis for their insightful comments on the manuscript. We also acknowledge D. Colpo for his invaluable assistance with the grant under which this work was conducted, NA10NMF4340183, awarded to the Pacific States Marine Fisheries Commission. The views and opinions expressed in this article are our own and do not necessarily represent the views of the National Marine Fisheries Service.
Supplementary Material
The Supplementary Material for this article can be found online at: https://www.frontiersin.org/article/10.3389/fmars.2015.00055
Footnotes
1. ^Since the focus of this article is on comparing general estimates of sample mean WTP for geographically-embedded samples, we do not attempt to explain how preferences and WTP vary across individuals in this work, beyond allowing the variation in preference parameters inherent in the random parameters logit modeling approach. However, we note that this is an important line of research, and extensions of the model specification used here (e.g., adding variables that interact individual demographics with attribute levels), as well as other modeling frameworks (e.g., latent class discrete choice models), can be employed to help explain variation in preferences and WTP across individuals.
2. ^Survey respondents were asked questions to elicit their willingness-to-pay (WTP) for the recovery or down-listing of one or more threatened and endangered marine species, which represents an improvement from the status quo. As such, the SP questions measure compensating variation (CV), an economic measure of welfare change. Alternatively, equivalent variation (EV), another measure of welfare change, could have been obtained by asking for respondent's willingness-to-accept (WTA) compensation to forgo the improvement. However, we follow the majority of the literature in framing the SP questions to elicit WTP, and note that WTA estimates may not be equal to the WTP estimates reported here (Perman et al., 1996). For a more thorough discussion on the discrepancies between WTA and WTP, see Horowitz and McConnell (2002).
3. ^Interagency Ocean Policy Task Force. (2009). Final Recommendations of the Interagency Ocean Policy Task Force. Available online at: http://www.whitehouse.gov/files/documents/OPTF_FinalRecs.pdf.
References
Adamowicz, W., Louviere, J., and Swait, J. (1998). Introduction to Attribute-based Stated Choice Methods. Report to the Damage Assessment Center, National Oceanic and Atmospheric Administration, Department of Commerce, Silver Spring, MD.
Bateman, I. J., Carson, R., Day, B., Hanemann, M., Hanley, N., Hett, T., et al. (2002). Economic Valuation with Stated Preference Techniques: A Manual. Cheltenham: Edward Elgar Ltd.
Bateman, I. J., Day, B. H., and Lake, I. (2006). The aggregation of environmental benefit values: welfare measures, distance decay and total WTP. Ecol. Econ. 60, 450–460. doi: 10.1016/j.ecolecon.2006.04.003
Blossey, B. (2012). The value of nature. Front. Ecol. Environ. 10:171. doi: 10.1890/154-9295-10.4.171
Boxall, P., and Adamowicz, W. (2002). Understanding heterogeneous preferences in random utility models: a latent class approach. Environ. Resour. Econ. 23, 421–446. doi: 10.1023/A:1021351721619
Dillman, D. A., Smyth, J. D., and Christian, L. M. (2009). Internet, Mail, and Mixed-mode Surveys: The Tailored Design Method, 3rd Edn. Hoboken, NJ: John Wiley and Sons.
Ehrenfeld, D. (1988). “Why put a value on biodiversity?,” in Biodiversity, ed E. O. Wilson (Washington, DC: National Academy Press), 212–216.
Georgiou, S., Bateman, I., Cole, M., and Hadley, D. (2000). Contingent Ranking and Valuation of River Quality Improvements: Tests for Scope Sensitivity, Ordering and Distance Decay Effects. Report GEC 2000-18, Center for Social and Economic Research on the Global Environment, University of East Anglia and University College London, Norwich.
Giraud, K., and Valcic, B. (2004). Willingness-to-pay estimates and geographic embedded samples: case study of Alaskan Steller sea lion. J. Int. Wildl. Law Policy 7, 57–72. doi: 10.1080/13880290490480167
Hanley, N., Schläpfer, F., and Spurgeon, J. (2003). Aggregating the benefits of environmental improvements: distance-decay functions for use and non-use values. J. Environ. Manag. 68, 297–304. doi: 10.1016/S0301-4797(03)00084-7
Horowitz, J. K., and McConnell, K. E. (2002). A review of WTA/WTP Studies. J. Environ. Econ. Manag. 44, 426–447. doi: 10.1006/jeem.2001.1215
Johnston, R. J., and Rosenberger, R. S. (2010). Methods, trends, and controversies in contemporary benefit transfer. J. Econ. Surv. 24, 479–510. doi: 10.1111/j.1467-6419.2009.00592.x
Krinsky, I., and Robb, A. L. (1986). On approximating the statistical properties of elasticities. Rev. Econ. Stat. 68, 715–719.
Lew, D., Layton, D., and Rowe, R. (2010). Valuing enhancements to endangered species protection under alternative baseline futures: the case of the Steller sea lion. Mar. Resour. Econ. 25, 133–154. doi: 10.5950/0738-1360-25.2.133
Lew, D., and Wallmo, K. (2011). External tests of scope and embedding in stated preference choice experiments: an application to endangered species valuation. Environ. Resour. Econ. 48, 1–23. doi: 10.1007/s10640-010-9394-1
Louviere, J., Hensher, D., and Swait, J. (2000). Stated Choice Methods: Analysis and Application. Cambridge: Cambridge University Press.
Marvier, M. (2012). The value of nature revisited. Front. Ecol. Environ. 10:227. doi: 10.1890/i1540-9295-10-5-227
Perman, R., Ma, Y., and McGilvray, J. (1996). Natural Resource and Environmental Economics. New York, NY: Longman Publishing.
Poe, G., Giraud, K., and Loomis, J. (2005). Computational methods for measuring the difference of empirical distributions. Am. J. Agr. Econ. 87, 353–365. doi: 10.1111/j.1467-8276.2005.00727.x
Sanchirico, J., Lew, D., Haynie, A., Kling, D., and Layton, D. (2013). Conservation Values in Marine Ecosystem-Based Management. Mar. Pol. 38, 523–530. doi: 10.1016/j.marpol.2012.08.008
Scott, J. M., Goble, D. D., Wiens, J. A., Wilcove, D. S., Bean, M., and Male, T. (2005). Recovery of imperiled species under the Endangered Species Act: the need for a new approach. Front. Ecol. Environ. 3, 383–389. doi: 10.1890/1540-9295(2005)003[0383:ROISUT]2.0.CO;2
Small, K. A., and Rosen, H. S. (1981). Applied welfare economics with discrete choice models. Econometrica 49, 105–130.
US Fish Wildlife Service Species Reports. (2013a). Available online at: http://ecos.fws.gov/tess_public/pub/boxScore.jsp (Viewed April 5, 2013).
US Fish Wildlife Service Species Reports. (2013b). Available online at: http://ecos.fws.gov/tess_public/DelistingReport.do (Viewed April 5, 2013).
Wallmo, K., and Edwards, S. (2008). Valuation of marine protected areas in the Northeast EEZ: A latent class model to capture heterogeneous preferences. Mar. Resour. Econ. 23, 301–323. Available online at: http://www.jstor.org/stable/42629620
Keywords: non-market valuation, endangered species, economic jurisdiction, stated preference, choice experiment
Citation: Wallmo K and Lew DK (2015) Public preferences for endangered species recovery: an examination of geospatial scale and non-market values. Front. Mar. Sci. 2:55. doi: 10.3389/fmars.2015.00055
Received: 28 May 2015; Accepted: 21 July 2015;
Published: 05 August 2015.
Edited by:
Sebastian Villasante, University Santiago de Compostela, SpainReviewed by:
Christian T. K.-H. Stadtlander, Self-Employed, USAManel Antelo, University of Santiago de Compostela, Spain
Copyright © 2015 Wallmo and Lew. This is an open-access article distributed under the terms of the Creative Commons Attribution License (CC BY). The use, distribution or reproduction in other forums is permitted, provided the original author(s) or licensor are credited and that the original publication in this journal is cited, in accordance with accepted academic practice. No use, distribution or reproduction is permitted which does not comply with these terms.
*Correspondence: Kristy Wallmo, Office of Science and Technology, Economics and Social Analysis Division, National Marine Fisheries Service, SSMC III, F/ST5, 1315 East West Highway, Silver Spring, MD 20910, USA, kristy.wallmo@noaa.gov