Dissolved Zn and its speciation in the northeastern Indian Ocean and the Andaman Sea
 Taejin Kim
 Hajime Obata
 Toshitaka Gamo
- Department of Chemical Oceanography, Atmosphere and Ocean Research Institute, The University of Tokyo, Kashiwa, Japan
Total dissolved Zn and Zn speciation were investigated by cathodic stripping voltammetry (CSV) in the northeastern Indian Ocean and the Andaman Sea. Vertical distributions of total dissolved Zn concentration (CZn) in the northeastern Indian Ocean and the Andaman Sea reflect that the deep water from the Andaman Sea was rapidly replaced by incoming waters from the northeastern Indian Ocean across the sills and was homogenized by vertical mixing. In the Andaman Sea, CZn at the near surface, < 50 m in depth, ranged from 0.33 to 1.14 nM at the southernmost station, which is an order of magnitude higher than those at the northernmost station, 0.03–0.22 nM, where is in close proximity to the estuaries of the Irrawaddy and Salween rivers. However, the Si concentration in the near surface water, 16.3 μM, was highest at the northernmost station of the Andaman Sea. In the northeastern Indian Ocean, only one sample was applied to estimate total ligand concentrations (CL) and conditional stability constants (K′ZnL, Zn2+) for organic complexation of Zn. The CL and K′ZnL, Zn2+ in the northeastern Indian Ocean were 0.5 nM and 10.0, whereas those of the Andaman Sea were 0.4–0.9 nM and 9.6–11.4, respectively. We observed no clear relationship between chlorophyll a (Chl a) and CL in the Andaman Sea. Various sources of Zn complexing ligands might be derived in the Andaman Sea, not only from bacteria and phytoplankton, but also from the Irrawaddy–Salween rivers.
Introduction
Zn is used in numerous enzyme systems involved with a variety of metabolic processes (Vallee and Auld, 1990). In the ocean, total dissolved Zn concentration (CZn) has a nutrient-like vertical profile with a particularly strong correlation with silicate (Bruland, 1980). However, a previous study showed that biogenic opal has low Zn content, which suggests that Zn is not directly involved with Si uptake and that the amount of Zn incorporated into opal represents only 1–3% of the total amount taken up by diatoms (Ellwood and Hunter, 2000). Thamatrakoln and Hildebrand (2008) also suggested that Zn is not involved in silicon uptake or in silicon transporter proteins. A recent study has shown that scavenging of dissolved Zn onto sinking particles could be a reason of deeper Zn regeneration, generating depth profiles similar to that of silicate (John and Conway, 2014). Low Zn concentrations could limit CO2 uptake and, ultimately, the growth rate in some cells through reduced production of the enzyme carbonic anhydrase (CA; Price and Morel, 1990; Morel et al., 1994; Lane and Morel, 2000). Low rates of phosphate uptake from dissolved organic P in oligotrophic waters have been linked to the limitation of available Zn in seawater via its central role in the enzyme alkaline phosphatase (Shaked et al., 2006). At high concentrations, Zn could be toxic to phytoplankton and bacteria (Sunda and Huntsman, 1996, 1998; Chen et al., 2008). Moreover, low Zn concentrations in surface seawater could limit growth of some kinds of phytoplankton (Brand et al., 1983; Sunda and Huntsman, 1998, 2000), although Zn limitation has not been observed in field studies (Coale et al., 2003; Crawford et al., 2003; Lohan et al., 2005; Jakuba et al., 2012).
In most surface waters, natural organic ligands strongly bind Zn and dominate the speciation of the total Zn pool. Organic complexation reduces the fractions of free-metal ions (Zn2+) to levels as low as 1 pM (Bruland et al., 1991; Ellwood and van den Berg, 2000). Culture experiments have shown that Zn2+ concentration of < 1 pM limits the growth of some phytoplankton species (Brand et al., 1983; Sunda and Huntsman, 1992, 1995). Therefore, the study of Zn speciation is important for understanding the oceanic biogeochemical cycling of Zn. In the open oceans, studies of Zn complexation in surface water of the North Pacific and North Atlantic reveal that >95% of Zn is complexed to organic ligands (Bruland, 1989; Donat and Bruland, 1990; Ellwood and van den Berg, 2000; Jakuba et al., 2012), whereas Zn predominated as inorganic Zn in both surface and deep waters of the Southern Ocean (Baars and Croot, 2011). In marginal seas, few studies indicated relatively high total ligand concentrations (CL) and relatively low conditional stability constants (K′ZnL, Zn2+) in the surface waters of the Black Sea (Muller et al., 2001), Bering Sea (Jakuba et al., 2012), Sea of Okhotsk, and Sea of Japan (East Sea) (Kim et al., 2015b) compared with those in open oceans. The main sources of Zn complexing ligands could be humic substances (Campbell et al., 2002), phytoplankton and bacteria-excreted organic substances (Bruland, 1989), and pore waters from estuarine marine sediments (Skrabal et al., 2006). However, more Zn speciation studies are needed to determine distributions and sources of Zn ligands.
The northeastern Indian Ocean, including the Bay of Bengal and the Andaman Sea (Figure 1), is characterized by surface current systems with strong monsoon seasonality (Shankar et al., 2002), and the biogeochemical cycles in the basins are significantly influenced by fluvial dissolved substances and suspended sediment loads (Milliman and Meade, 1983; Robinson et al., 2007). The Ganges and Brahmaputra rivers carry a large amount of terrestrial debris, ~2 × 10¹² kg/yr, into the northern part of the Bay of Bengal, which corresponds to ~10% of the world's fluvial discharge (Milliman and Meade, 1983). In the Bay of Bengal, this high accumulation of sediment has created a broad submarine alluvial Bengal Fan and has affected the topography of the entire sea bottom.
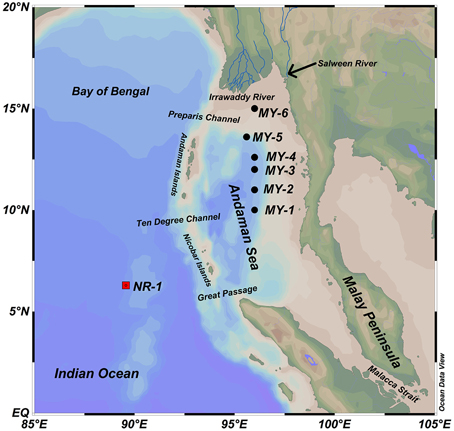
Figure 1. Location of sampling stations in the northeastern Indian Ocean (NR-1, filled square) and the Andaman Sea (MY-1–MY-6, filled circles).
This study presents the distributions of CZn and Zn speciation in the northeastern Indian Ocean and the Andaman Sea by using competitive ligand equilibration–adsorptive cathodic stripping voltammetry (CSV) to characterize organic Zn complexing ligands and their influence on the chemical speciation of Zn.
Materials and Methods
Sample Collection and Storage
Seawater samples were collected in the northeastern Indian Ocean (NR-1) and the Andaman Sea (MY-1–MY-6) during R/V Hakuho-maru research cruise KH-13-4 in July and August, 2013. Locations of the sampling stations are indicated in Figure 1.
The Andaman Sea is a marginal sea of the Indian Ocean that extends between the Malay Peninsula on the east and the Andaman and Nicobar islands on the west. The Andaman Sea forms the far eastern part of the northern Indian Ocean and is separated from the western Bay of Bengal by the Andaman–Nicobar island chain. In the northern region, a the submarine delta created by outflow of the Irrawaddy and Salween rivers is connected to the eastern shallow shelves along the Malay Peninsula and the Malacca Strait (Robinson et al., 2007). From the shelves, the sea bottom drops off sharply into a large central basin and two smaller basins deeper than 2000 m extending along the north–south island arc. The maximum depth is 4180 m at the south end of the central basin. The sill depths of the channels across the Andaman–Nicobar Ridge are shallower than 1800 m. Therefore, the deep water below this depth of the Andaman Sea Basin is isolated from the Bay of Bengal, and its maximum water temperature remains approximately 2°C down to the bottom (Sarma and Narvekar, 2001). Previous studies reported the vertical profiles of dissolved rare earth elements (Nozaki and Alibo, 2003), 230Th (Okubo et al., 2004) and Al, in addition to In and Ce (Obata et al., 2004). CZn and its speciation in the Andaman Sea, however, have not been reported thus far.
The sampling methods have been detailed in previous research (Kim et al., 2015a). Briefly, seawater samples were collected by using acid-cleaned Teflon-coated X-type Niskin samplers. The O-rings inside the Niskin samplers and the spigots were replaced with Viton and Teflon parts, respectively. X-type Niskin bottles were cleaned by using a 1% alkaline surfactant (Extran MA01), 0.1 M HCl (Special Grade, Wako Pure Chemical Industries) and Millipore Milli-Q water. The acid-cleaned Teflon-coated X-type Niskin bottles were then deployed on a conductivity–temperature–depth carousel multi-sampling system (SBE-911plus and SBE-32 water sampler, Sea Bird Electronics, Inc.), on which a Zn sacrificial anode was replaced with an Al anode to avoid the possibility of Zn contamination from the frame. For sub-sampling, the Niskin-X bottles were detached from the carousel frame and were carefully moved into a clean space filled with HEPA-filtered air in the onboard laboratory of the research vessel. Seawater samples were filtered by using an acid-cleaned 0.2-μm, Acropak capsule filter (PALL Co.) directly connected to the Niskin-X Teflon spigot. The filtered samples were stored in acid-cleaned 500-mL low-density polyethylene bottles (Nalgene Co., Ltd) after being rinsed at least four times with filtered seawater. The samples were then acidified to achieve a pH < 1.8 by using ultrapure HCl (Tamapure AA-100, Tama chemicals) and were placed in storage for later measurement of CZn. The filtered samples for Zn speciation analysis were frozen immediately after collection until just before analysis.
Total Dissolved Zn Analysis
CSV was used to determine the CZn in the seawater (van den Berg, 1985; Donat and Bruland, 1990; Ellwood and van den Berg, 2000; Lohan et al., 2002; Kim et al., 2015a). In this study, the 757 VA Computrace (Metrohm) voltammetric system was used. The reference electrode was Ag/saturated AgCl, 3 M KCl. The counter electrode was composed of glassy carbon, and the working electrode was a hanging mercury drop electrode. To decompose interfering dissolved organic matter and metal complexing organic ligands, which occur naturally in seawater (van den Berg, 1985), an ultraviolet (UV) irradiation system was used (Kim et al., 2015a). In this study, seawater samples were UV-irradiated over 40 min to ensure the full breakdown of naturally occurring dissolved organic matter by using a high-pressure mercury vapor UV lamp (450 Watts, UM-453B-A, USHIO). The sample solution was kept cold with ice to prevent water evaporation during the UV-irradiation.
Following UV-irradiation, 10 mL of the seawater sample was added to a Teflon cell with 100 μM ammonium 1-pyrrolidinedithiocarbamate (APDC) and 2 mM buffer solution piperazine-1,4-bis (2-ethanesulfonic acid) (PIPES). The pH values of the samples were adjusted to 7.0 by adding ultrapure aqueous ammonia (Tamapure AA-100, Tama chemicals). In the Teflon cell, Zn was complexed with APDC (Zn-PDC) and absorbed onto the hanging mercury drop electrode. The reduction current peak of Zn2+ in the adsorbed Zn-PDC complexes was found to be approximately −1.1 V. Voltammetric conditions included differential pulse mode, 4 min 99.9995% N2 gas purge, 60–300 s deposition time at −0.3 V, 8 s equilibration time, and a negative scan from −0.75 to −1.2 V with a 0.05 V pulse amplitude, 0.02 s pulse time, 0.0047 V voltage step, 0.2 s step time, and 0.024 V/s sweep rate. The potential of the electrode was scanned in the negative direction. The concentrations of Zn in the seawater were calibrated by using a standard addition method (Lohan et al., 2002). The procedural blank value was obtained from Zn-removed seawater, which was passed through a chelating resin column (NOBIAS CHELATE-PA1, Hitachi High-Tec) (Kim et al., 2015a). This Zn-removed seawater was UV-digested. The deposition time for the Zn-removed seawater was 360 s. The resulting procedural blank value was calculated to be 71 ± 8 pM (n = 7). This blank value was used to calculate the CZn, which were subtracted from the measured values. The detection limit, calculated as three times the standard deviation of measurements of the blank values for purified seawater, was 26 pM. To assess the accuracy of the entire analytical procedure, Zn concentrations in SAFe samples S (SAFe Intercalibration North Pacific 2004, surface seawater) and D2 (SAFe Intercalibration North Pacific 2004; 1000 m) (Johnson et al., 2007) were determined and compared. The results of this intercalibration were 0.063 ± 0.002 nmol/kg for S and 7.37 ± 0.13 nmol/kg for D2, which are in good agreement with the reported consensus values of S = 0.069 ± 0.010 nmol/kg and D2 = 7.43 ± 0.25 nmol/kg (http://www.geotraces.org/science/intercalibration/322-standards-and-reference-materials).
Zn Speciation
Theory
Zn speciation was determined through titration by using competitive ligand equilibrium/adsorptive CSV (van den Berg, 1985; Donat and Bruland, 1990), which uses a competitive equilibrium between Zn-complexing ligands naturally present in the sample and a competing ligand (APDC). A titration curve is produced by adding increasing concentrations of Zn. Once the natural ligands are saturated with Zn, the reduction peak current will be increased proportionally to the added Zn concentration (Figure 2). The CZn of a sample can be defined as
where [Zn′] is the concentration of inorganic Zn, [ZnPDC] is the concentration of Zn complexed with APDC, and [ZnL] is the concentration of Zn complexed by natural ligands. By using a simple one-ligand model, the complexation of Zn in seawater by natural ligands can be defined as
where K′ZnL, Zn2+ is the conditional stability constant of the Zn complex with respect to Zn2+ in seawater, and [L′] is the concentration of the free ligand.
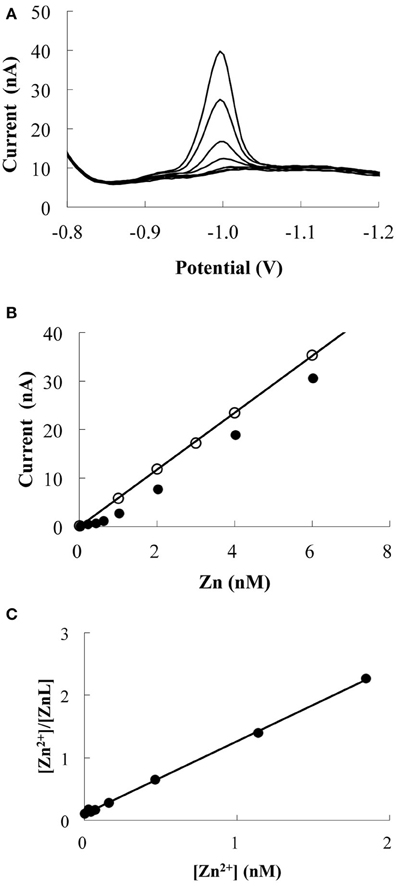
Figure 2. Example of Zn titration data (MY-6, 15 m). (A) Voltammetric scans for Zn additions. (B) The response of Zn peak current with increasing Zn additions. The line and blank circles indicate the response of UV-irradiated sample. (C) Linear relationship obtained by transforming the titration data. The calculated CL and log K′ZnL, Zn2+ were 0.9 nM and 10.1, respectively.
The CL of a sample can be defined as
Substitution for [L′] in Equation (2) using Equation (3) and rearranging terms gives the van den Berg/Ružić linearization (Ružić, 1982; van den Berg, 1982). The equation for the resulting line is
When values of [Zn2+]/[ZnL] are plotted against corresponding values of [Zn2+], a linear relationship is obtained with a slope equal to 1/CL and with the intercept yielding 1/(K′ZnL, Zn2+ × CL).
The observed reduction peak current (ip) is related to the concentration of Zn2+ by the equation
where S is the sensitivity, which is calibrated by standard additions to UV-irradiated seawater (UVSW), and α′ is the overall side reaction coefficient for Zn:
where αZn is the inorganic side reaction coefficient for Zn. A value of 2.2 (Turner et al., 1981; Donat and Bruland, 1990; Jakuba et al., 2008, 2012) was used in this study. αZnPDC, the side reaction coefficient for Zn with PDC, is fixed by the concentration of PDC added to the sample. αZnPDC can be calculated as
where K′ZnPDC is a conditional stability constant, and [APDC′] is the concentration of APDC not complexed by Zn2+. Because this [APDC′] is much greater than that of Zn, the total APDC concentration ([APDC′]T) can be selected for calculations. A K′ZnL, Zn2+ value of 104.4 was used for seawaters of pH 8.2 with borate buffer (Ellwood and van den Berg, 2000). [ZnL] can be calculated as
where (ip∕S) is equal to labile Zn (Znlabile) concentration (= [Zn′] + [ZnPDC]). Combining Equations (5) and (8), [Zn2+]/[ZnL] can be calculated as
Finally, once CL and K′ZnL, Zn2+ have been determined, the concentration of Zn2+ can be calculated by the following quadratic equation (Ellwood and van den Berg, 2000):
Experimental
Acid-cleaned Teflon vials were used for Zn titration. To minimize the effects of adsorption onto the vial walls, the Teflon vials were rinsed twice with 10 mL of the sample. After rinsing, 10 mL of the seawater sample and 4 mM of borate buffer were added to each Teflon vial; the borate buffer was added to achieve a pH of 8.2. Each vial was then spiked with Zn concentrations of 0.2–6.0 nM and was allowed to equilibrate. After 2 h, 25 μM of APDC was added to each vial. The APDC was allowed to equilibrate for 12 h (Ellwood and van den Berg, 2000; Lohan et al., 2005). At this APDC concentration, the detection window of the method is approximately from K′ZnL, Zn2+ = 107 to 1012 for a CL of 1 nM. The first two vials were not spiked with Zn and were used as replicates for the starting point of the titration. The voltammetric conditions were differential pulse mode, 4 min N2 gas purge, 180 s deposition time at −0.6 V, 8 s equilibration time, and a negative scan from −0.75 to −1.2 V with a 0.05 V pulse amplitude, 0.02 s pulse time, 0.0047 V voltage step, 0.2 s step time, and 0.024 V/s sweep rate. One example of the titration is shown in Figure 2.
Zn speciation data obtained by using linear fit were compared with those obtained by non-linear fitting (Gerringa et al., 1995). When non-linear fitting was applied to the Zn titration data from this study, there was generally good agreement with the CL and log K′ZnL, Zn2+ calculated by the linear method, with differences of ~0.2 nM and ~0.2, respectively. Thus, both linear and non-linear models generally produced consistent results for Zn speciation with the competitive ligand equilibrium/adsorptive CSV method.
Chl a, Silicate, and Salinity Determination
Chlorophyll a (Chl a) was measures by using the following fluorometric method. For the analysis of Chl a, 290 mL seawater samples were immediately filtered through 25 mm Whatman GF/F glass fiber filters maintaining vacuum levels of 0.02 MPa or less. The filters were placed in polypropylene vials and were extracted in 6.0 mL N, N-dimethylformamide. The samples were allowed to be extracted for 1–2 days in a freezer at −20°C. After removal from the cold environment, the extracted samples were placed in a 13 mm glass cuvette and measured on a Turner Designs 10-AU field fluorometer with a chlorophyll optical kit for the non-acidification method (Welschmeyer, 1994). The concentrations of Chl a in the sample (μg/L) were calculated from the reading by using calibration and scaling factors.
Silicate concentrations were determined by using an auto analyzer SWAAT (BLTEC Japan). β-molybdosilicic acid is formed by the reaction of silicate with molybdate at pH levels of 1–1.8. The β-molybdosilicic acid is reduced by Sn(II) to form molybdenum blue with an absorbance maximum at 630 nm. Data were corrected by using seawater reference nutrient material (KANSO).
Practical salinity was measured by using an Autosal laboratory salinometer (Model 8400B, Guildline Instruments Ltd., Canada). The sampling bottles for practical salinity tests were prepared according to Joint Global Ocean Flux Study protocol. The Autosal was standardized by using International Association for the Physical Sciences of the Oceans standard seawater.
Results
Hydrography
Table 1 shows the data obtained in this study. The surface salinities at < 50 m in the Andaman Sea (MY-1–MY-6), 28.624–33.864, were relatively lower than those of in the northeastern Indian Ocean (NR-1, 34.226–34.228). Additionally, the surface salinities in the Andaman Sea were gradually increased from north to south (Table 1). Figure 3 shows the vertical profiles of salinity, potential temperature, and dissolved O2 in both the northeastern Indian Ocean (NR-1) and the Andaman Sea (MY-1 and MY-3). The deep water of the northeastern Indian Ocean is most simply characterized as a tongue of circumpolar water extending north from the south (Wyrtki, 1971). In the Southern Ocean, the original circumpolar deep water has relatively high salinity and O2 due to the presence of North Atlantic Deep Water. Although dissolved O2 is consumed by respiration during the northward transport of the deep water, the salinity in circumpolar deep water of the northeastern Indian Ocean (NR-1) and the Andaman Sea (MY-1 and MY-3), remains high as indicated by the maximum salinity of >35.000 at 275–596 m (Figure 3A).
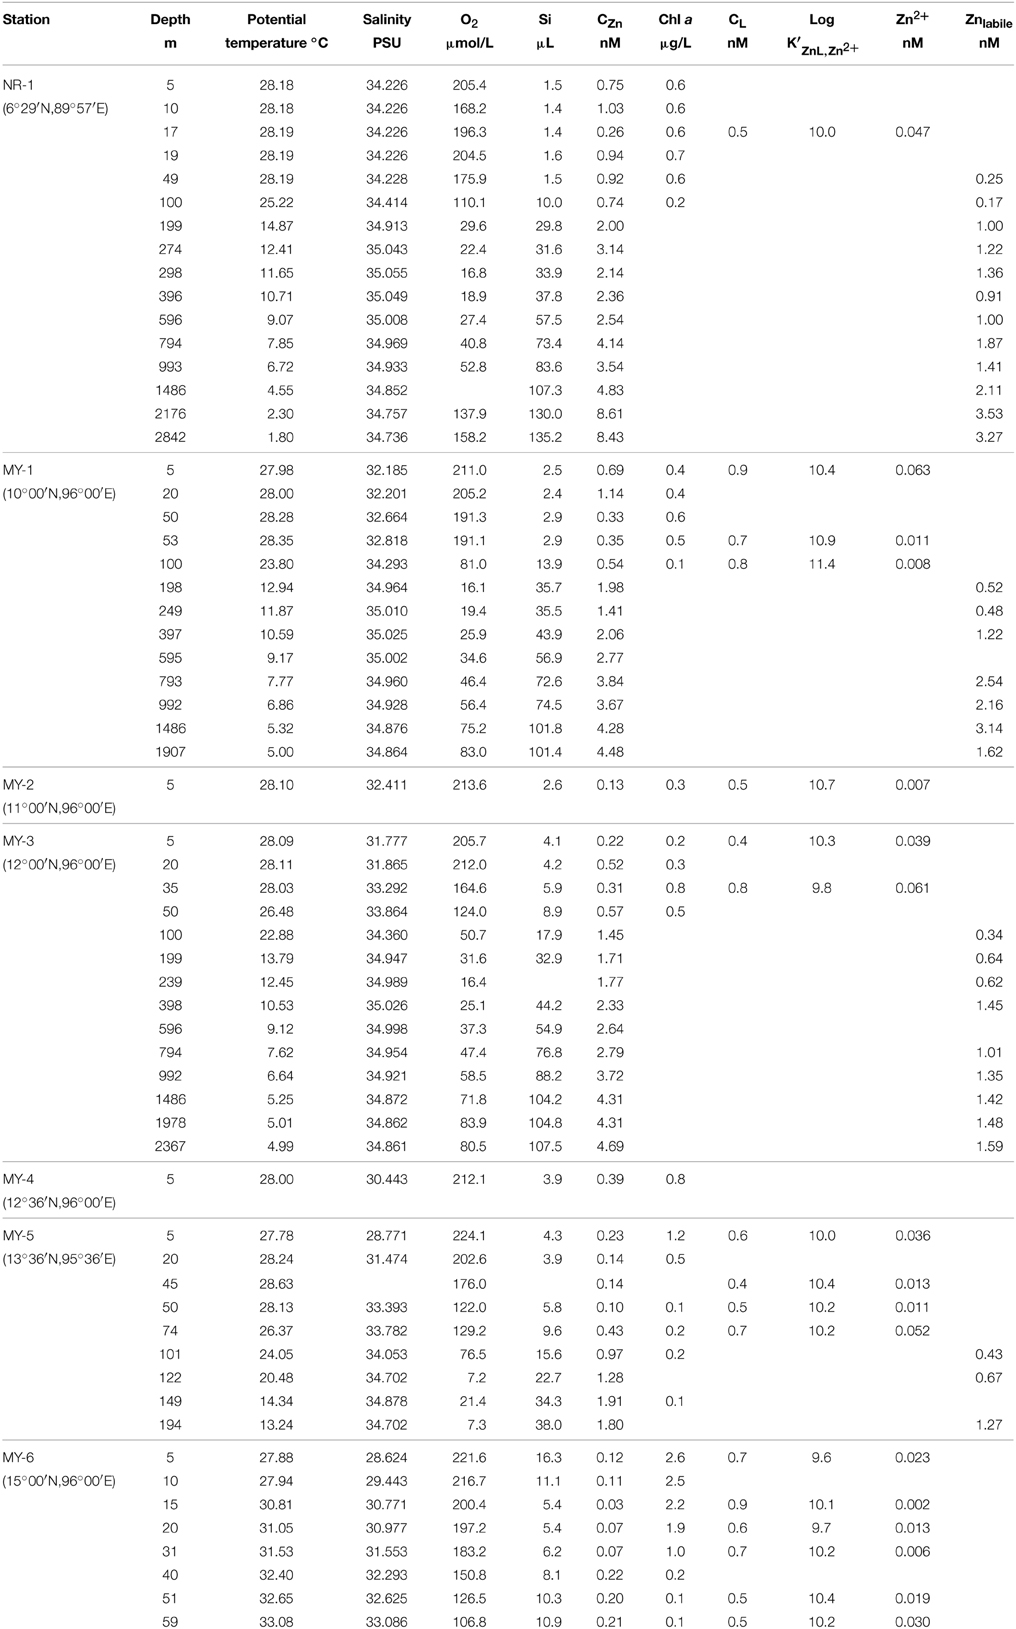
Table 1. Seawater analysis results and associated hydrographic data obtained in this study.
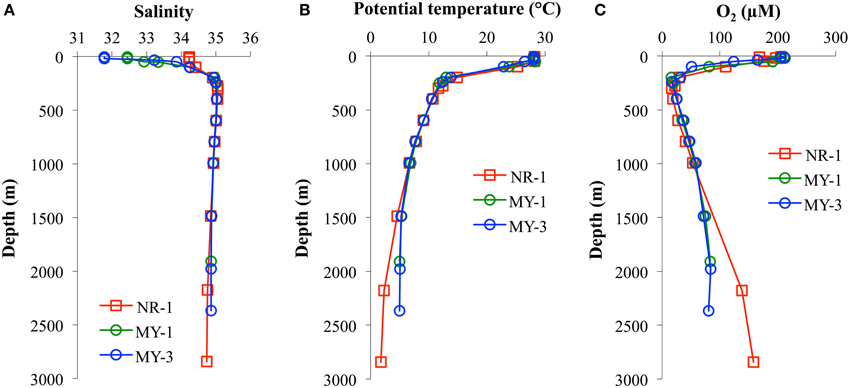
Figure 3. The vertical profiles of (A) salinity, (B) potential temperature, and (C) dissolved O2 in the northeastern Indian Ocean (NR-1) and the Andaman Sea (MY-1 and MY-3).
The potential temperature in both the northeastern Indian Ocean and the Andaman Sea are comparable to a depth of 1000 m (Figure 3B), although the deep waters below 1500 m of the Andaman Sea are consistently warmer than those of the northeastern Indian Ocean. Below 1500 m, the potential temperatures in the Andaman Sea are relatively uniform (4.99–5.32°C), where as those of northeastern Indian Ocean were decreased from 4.55 to 1.80°C (Figure 3B).
Dissolved O2 decreases sharply from the surface to a minimum of < 20 μmol/L at 298–396 m for NR-1, 198–249 m for MY-1, and 239 m for MY-3. In deep layers, dissolved O2 concentrations increase toward the bottom. The high dissolved O2 concentration near the bottom at station NR-1 suggests that the bottom and the deep waters are fed from the south. The sharp decrease in dissolved O2 from the surface with increasing depth is attributed to high productivity, and the shallow depths of the O2 minimum and the salinity maximum are indicative of the upwelling regime of the northeastern Indian Ocean, which is consistent with the general circulation pattern (Schmitz, 1995). The profiles of dissolved O2 in the northeastern Indian Ocean and the Andaman Sea are separated below 1000 m, which is consistent with those of potential temperature. The deep water of the Andaman Sea has uniform concentrations for dissolved O2, whereas it increases with depth in the northeastern Indian Ocean (Figure 3C). The O2 profile indicates that the deep water of the Andaman Sea is highly similar to that of the inflowing water from northeastern Indian Ocean in the Bay of Bengal, suggesting that the deep Andaman Sea water is replaced rapidly before detectable dissolved O2 consumption occurs in its deep water (Okubo et al., 2004).
Total Dissolved Zn and Silicate Concentrations
In this study, the vertical distributions of CZn were nutrient type (Figure 4A), which is similar to previous studies in the North Pacific (Bruland et al., 1978, 1979, 1994; Bruland, 1980; Lohan et al., 2002; Cutter and Bruland, 2012; Kim et al., 2015a), South Atlantic (Wyatt et al., 2014), southern Indian Ocean (Gosnell et al., 2012), and Southern Ocean (Croot et al., 2011). The Si concentrations were strongly correlated with CZn (Figure 4B). Vertical profiles in the northeastern Indian Ocean (NR-1) and the Andaman Sea (MY-1 and MY-3) also showed similar features such that both CZn and Si were separated below 1500 m.
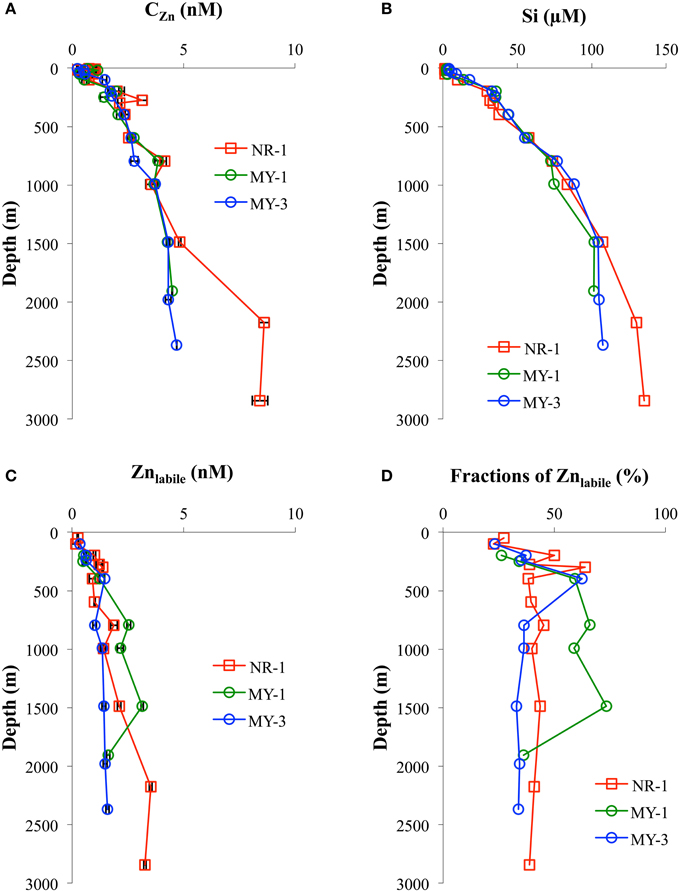
Figure 4. The vertical profiles of (A) CZn, (B) Si, (C) Znlabile, and (D) fractions of Znlabile in the northeastern Indian Ocean (NR-1) and the Andaman Sea (MY-1 and MY-3).
In the Andaman Sea, CZn in near the surface water (< 50 m) ranged from 0.33 nM to 1.14 nM at the southernmost station (MY-1), which was an order of magnitude higher than those of the northernmost station (MY-6, 0.03 – 0.22 nM) (Table 1). On the contrary, the highest Si concentration in the near surface water, 16.3 μM, was at the northernmost station of the Andaman Sea (MY-6), which is close to the estuaries of the Irrawaddy–Salween rivers.
Labile Zn Concentrations
The Zn titrations of most samples in the northeastern Indian Ocean (NR-1, n = 12) and the Andaman Sea (MY-1, n = 7 and MY-3, n = 9) showed a linear increase with added Zn2+, indicating that all of the natural ligands in the sample were already saturated with Zn. To understand Zn speciation in the saturated samples, we show the vertical profiles of Znlabile (Table 1, Figure 4C). By using CSV under the same conditions as those of titration (pH 8.2, addition of 25 μM APDC, 12 h equilibration time), Znlabile was determined in natural samples without adding Zn and with no UV-irradiation. In this study, Znlabile would include not only Zn2+ and inorganic Zn, but also the part of Zn weakly complexed with organic ligands. The Znlabile concentrations in NR-1 ranged from 0.17 to 3.53 nM (49–2842 m), whereas those in the Andaman Sea ranged from 0.48 to 3.14 nM (MY-1, 198–1907 m) and 0.34 to 1.59 nM (MY-3, 100–2367 m; Table 1, Figure 4C).
Total Ligand Concentrations and Conditional Stability Constants
In this study, CL and log K′ZnL, Zn2+ were obtained from only one sample at 17 m in the northeastern Indian Ocean and 16 samples between 5 and 74 m in the Andaman Sea (Table 1). In the northeastern Indian Ocean (NR-1), the Zn titration for most of the samples showed a linear increase with added Zn2+, indicating that the natural ligands in the sample were already almost saturated with Zn. Thus, only one estimate of log K′ZnL, Zn2+ could be obtained from the titration data for NR-1.
The CL and log K′ZnL, Zn2+ in the northeastern Indian Ocean (NR-1, 17 m) were 0.5 nM and 10.0, whereas those of the Andaman Sea (MY-1–MY-6) were 0.4–0.9 nM and 9.6–11.4 (Table 1), respectively. In the Andaman Sea, the highest CL, 0.9 nM, was observed at both MY-1 and MY-6 (Table 1). The resultant free Zn2+ concentrations in the northeastern Indian Ocean and the Andaman Sea were 0.047 nM and 0.002–0.066 nM, respectively (Table 1).
Discussion
Total Dissolved Zn
In the northeastern Indian Ocean (NR-1), the average of the CZn within the upper 200 m was 0.94 ± 0.53 nM (n = 7), which is in good agreement with 0.96 ± 0.59 nM (n = 29) reported in a recent study in the northern Indian Ocean (Vu and Sohrin, 2013), but lower than 2.25 ± 1.18 nM (n = 26) reported for the northwestern Indian Ocean (Saager et al., 1992). From the surface to 1500 m in depth, the vertical distributions of CZn in the northeastern Indian Ocean (NR-1) and the Andaman Sea (MY-1 and MY-3) showed almost identical concentrations. Below 1500 m, the CZn in the northeastern Indian Ocean increased almost twice, from 4.83 to 8.61 nM, whereas the concentrations remained nearly constant with depth in the Andaman Sea, from 4.28 to 4.69 nM (Figure 4A). The deep water of the Andaman Sea is separated from that of the Bay of Bengal by the Andaman–Nicobar Ridge. Because the Preparis Channel is shallower than 250 m, deep water can be exchanged mainly through the 10 Degree Channel, with a maximum sill depth of approximately 800 m, and the Great Passage, with a maximum depth of approximately 1800 m (Nozaki and Alibo, 2003). Okubo et al. (2004) used the scavenging–mixing model with vertical distribution of 230Th to estimate that the residence time in deep water (< 1250 m) is 6 years, suggesting that the deep water appears to be rapidly replaced by the incoming waters from the northeastern Indian Ocean across the sills and is then homogenized by vertical mixing.
At the surface distributions, very low CZn, < 0.3 nM, was observed at < 50 m depth at northern stations (MY-5 and MY-6), where the salinities were also low (28.624–33.393) (Table 1). This indicates that the river water from the Irrawaddy–Salween rivers affects CZn in the northern area of the Andaman Sea.
Figure 5 shows the CZn and Si concentrations as function of salinity. CZn showed a trend of very low concentrations in the low salinity zone, < 34, in the northern Andaman Sea. During the sampling period, the southwest monsoon from June to November caused the outflows of freshwater from Irrawaddy–Salween rivers to increase more than one order of magnitude compared with results of the northeastern monsoon in winter (Robinson et al., 2007). This freshwater outflow is the third-largest contributor of sediment load after the Amazon and Ganges–Brahmaputra rivers (Robinson et al., 2007). The high level of sediment load from the Irrawaddy–Salween rivers may be related to the lower CZn.
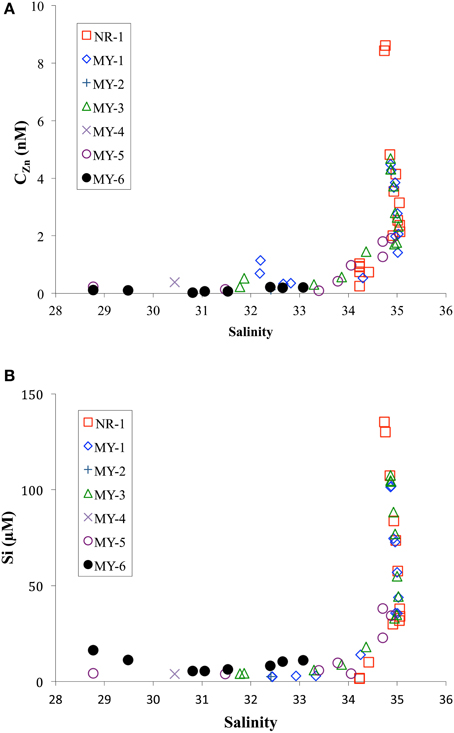
Figure 5. Comparison of practical salinity with (A) CZn and (B) Si in the northeastern Indian Ocean (NR-1) and the Andaman Sea (MY-1–MY-6).
Flocculation of humic acids may lead to removal of trace metals; however, the CZn will be less affected because Zn appears to exist predominantly in inorganic forms in river water, primarily with chloride (Hart and Davies, 1981; Kuwabara et al., 1989). Sediment resuspension also could affect the removal of trace metals. For example, pore water infusion is a major source of Fe to the water column in high turbidity zones. Once released into the water column, dissolved Fe is rapidly oxidized and precipitated (Zwolsman, 1994). The in situ formation of Fe (oxy) hydroxides, which are effective scavengers of dissolved Zn (Johnson, 1986), will lead to the removal of dissolved Zn in a low salinity, high turbidity area.
This study determined that the low concentrations of CZn in northern stations (MY-5 and MY-6) are also correlated with high Chl a contents. In MY-6, the northernmost station, the highest Chl a content was obtained (2.6 μg/L, 5 m). This value is significantly higher than those in the northeastern Indian Ocean as well as those at southern station of the Andaman Sea (Table 1). This result may indicate removal of CZn in the northern Andaman Sea by biological uptake. The involvement of trace metals in biological cycles is a well-known process in the open ocean (Bruland et al., 1991); similar processes have also been reported in estuaries (Kuwabara et al., 1989; Shiller and Boyle, 1991; Zwolsman et al., 1997).
At the southern stations (MY-1, MY-2, and MY-3) of the Andaman Sea, the CZn at < 50 m showed a similar range, 0.13–1.14 nM, compared with those of the northeastern Indian Ocean (NR-1), 0.26–1.03 nM. During the summer, the Summer Monsoon Current flows eastward as a continuous current from the western Arabian Sea to the northeastern Indian Ocean (Shankar et al., 2002). Therefore, the Summer Monsoon Current, by intruding into the Andaman Sea, may influence the surface Zn concentrations in both the northeastern Indian Ocean and the Andaman Sea.
Relationship between Total Dissolved Zn and Silicate
In this study, the CZn profiles were similar to those of silicates (Figures 4A,B). Similar to that with the CZn, the Si concentrations were different below 1500 m between the northeastern Indian Ocean (NR-1) and the Andaman Sea (MY-1 and MY-3) (Figure 4B).
In contrast to the CZn, the Si concentrations in shallow water of the Andaman Sea < 50 m at MY-5 (4.3–5.8 μM) and MY-6 (5.4–16.3 μM) were relatively higher at than those in the northeastern Indian Ocean (NR-1, 1.4–1.6 μM), and at southern stations (MY-1, 2.4–2.9 μM) (Table 1). This result indicates that the Si concentrations in MY-5 and MY-6 are influenced by the Irrawaddy–Salween rivers. Figure 6 shows the relationship between CZn and Si concentrations obtained in this study. In the Andaman Sea, the slope value was relatively lower (0.043 ± 0.001) than that of northeastern Indian Ocean (0.052 ± 0.004) (Figure 6).
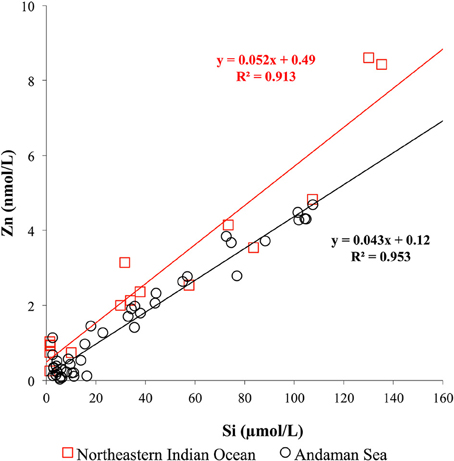
Figure 6. Relationship between CZn and Si in seawater obtained in the northeastern Indian Ocean and the Andaman Sea.
In the northeastern Indian Ocean (NR-1), the CZn strongly correlated with Si (R2 = 0.913; Figure 6). The obtained slope value in the northeastern Indian Ocean, 0.052 ± 0.004, was in a good agreement with that reported in a previous study of the southwestern Indian Ocean (0.049) (Morley et al., 1993). However, it is slightly lower than the values of 0.062 reported in previous studies in the northwestern Indian Ocean (Saager et al., 1992), 0.059 in the southern Indian Ocean (Gosnell et al., 2012) and 0.064 in the northern and southern Indian Ocean (Vu and Sohrin, 2013). The results of this study indicate that Zn is relatively depleted than Si in the northeastern Indian Ocean.
The lower slope value of the Andaman Sea, 0.043 ± 0.001, is attributed to the relatively high Si concentrations and lower CZn in its surface layers (Figure 6). As previously mentioned, high levels of sediment load from the Irrawaddy–Salween rivers could affect removal of dissolved Zn by precipitation in a low salinity, high turbidity area. Moreover, high Chl a contents were obtained at this area, suggesting that phytoplankton uptake also could be a reason for the low CZn.
If we subtract the Zn:Si data of deep water >1500 m in the northeastern Indian Ocean (NR-1), the slope value is calculated as 0.038 ± 0.004, which is almost identical to that of the Andaman Sea (0.043 ± 0.001). This similarity of slope values also supports that both northeastern Indian Ocean and Andaman Sea could communicate at depths above 1500 m.
Zn Complexation in the Andaman Sea
The CL in the Andaman Sea ranged from 0.4 to 0.9 nM, which is lower than those in the other marginal seas (Table 2). Previous studies showed higher CL in the Black Sea (7.8–16.6 nM) (Muller et al., 2001); the Bering Sea (3.6 nM) (Jakuba et al., 2012); the Sea of Okhotsk (2.6 nM); and the Sea of Japan (East Sea) (1.3 nM) (Kim et al., 2015b). Only one CL value in the northeastern Indian Ocean (NR-1) was calculated as 0.5 nM and is relatively lower than those of the Andaman Sea, which might suggest some specific ligand sources in the Andaman Sea. The CL generally showed positive correlation with the CZn in this study (Figure 7). In contrast, the CL was poorly correlated to the CZn in MY-6, the northernmost station in the Andaman Sea.
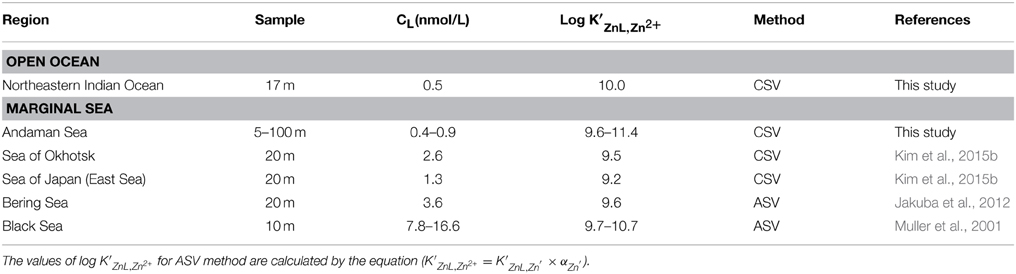
Table 2. Zn complexation data from other relevant seawater studies.
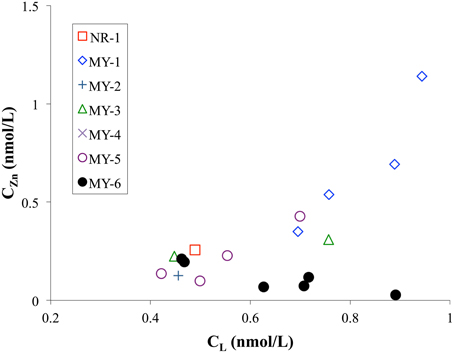
Figure 7. Comparison of CL and CZn in the northeastern Indian Ocean (NR-1) and the Andaman Sea (MY-1–MY-6).
The log K′ZnL, Zn2+ of natural organic ligands in the Andaman Sea ranged from 9.6 to 11.5, which is higher than that reported in previous studies of the marginal seas (Table 2). The log K′ZnL, Zn2+ value in the northeastern Indian Ocean was 10.0, which is comparable to that in previous studies in which the Zn ligand was determined by using CSV in the open oceans such as the western subtropical North Pacific (9.5–10.8); the western subarctic North Pacific (9.7–10.2) (Kim et al., 2015b); the eastern subarctic North Pacific (10.5) (Lohan et al., 2005); the South Pacific (10.6) (Ellwood, 2004); and the North Atlantic (10.0–10.5) (Ellwood and van den Berg, 2000).
In the northeastern Indian Ocean (NR-1), as previously mentioned, the Zn titration for most samples showed linear increase with added Zn2+. Therefore, only one estimate of CL (0.5 nM) and log K′ZnL, Zn2+(10.0) could be obtained from the titration data for NR-1. The detection window in this study is from K′ZnL, Zn2+ 107 to 1012 for a CL of 1 nM. Although the detection window covers the range of K′ZnL, Zn2+ values reported in previous studies (107.5–1011.3) (van den Berg, 1985; Donat and Bruland, 1990; Ellwood and van den Berg, 2000; Ellwood, 2004; Lohan et al., 2005; Jakuba et al., 2008), strong Zn complexing ligands with K′ZnL, Zn2+ values >1012 might not be detected if any.
To determine the Zn speciation in Zn-saturated waters, we also examined the vertical profiles of Znlabile (Figure 4C). At NR-1, the fractions of Znlabile to the CZn ranged from 39 to 45% at >500 m, whereas those of MY-1 and MY-3 at >500 m ranged from 36 to 73% and 33 to 36%, respectively (Figure 4D). Because we determined the Znlabile in the samples without acidification, some of the Zn in the seawater may have been adsorbed onto the walls of the storage bottles and the voltammetric cells. Recent research has shown that the fraction of UV-irradiated seawater without acidification (CUVSW) to CZn ranged from 85 to 94% and has indicated that the differences between CZn and CUVSW were caused partially by adsorption to the walls of bottles and cells (Kim et al., 2015b). Even if the adsorption is considered, non-labile fractions of Zn still exist through the water columns of the northeastern Indian Ocean and the Andaman Sea. The non-labile fractions of Zn likely include inert Zn-organic complexes at specific conditions, as suggested in a previous study (Baars and Croot, 2011). At >500 m, the fractions of Znlabile between NR-1 (39–45%) and MY-3 (33–36%), showed similar trends as that of CZn, which differed below 1500 m (Figures 4C,D). On the contrary, relatively high fractions of Znlabile, 59–73%, existed between 794 and 1486 m at MY-1 (Figures 4C,D), although the bottom sample showed a similar fraction range (36%) with that of NR-1 and MY-3. Such high fractions of Znlabile at MY-1, 793–1486 m, were likely affected by the continental slope, where is in very close to MY-1 (Figure 1). There might be some specific removal mechanisms for the Zn complexing ligand at those depths.
Possible Sources of Zn Complexing Ligands
The origin of Zn complexing ligands is still under debate, in which humic substances (Campbell et al., 2002), substances from pore waters via estuarine marine sediments (Skrabal et al., 2006), phytoplankton, and bacteria-excreted organic substances (Bruland, 1989) are thought to act as the ligands. In the open ocean, earlier study by Bruland (1989) mentioned that Zn complexing ligands were possibly derived from bacteria and phytoplankton in the central subtropical North Pacific. In high productivity regions, Zn complexing ligands might also be derived from phytoplankton and bacteria. If organic substances excreted by phytoplankton and bacteria are the main source of Zn complexing ligands, a relationship between Zn ligands and Chl a is expected.
The relationship between Chl a and the CL obtained in this study was compared with those of previous studies (Figure 8). In the Andaman Sea (from MY-1 to MY-6), the relationship between Chl a and CL differed from that of other marginal seas, in which low Chl a and high CL can be observed. Previous studies in the marginal seas mentioned that Zn complexing ligands could be derived from the bacterial breakdown of particulate organic matter in the Black Sea (Muller et al., 2001) and phytoplankton in the Bering Sea (Jakuba et al., 2012). However, we could not observe a clear relationship between Chl a and CL in the Andaman Sea, even though the CL was slightly increased with an increase in Chl a contents at the northernmost station (MY-6; Figure 8). This result suggests that different sources of Zn complexing ligands might be dominant in the Andaman Sea. A previous study in the Sea of Okhotsk indicated that humic substances from fresh water might be a source of Zn complexed ligands in the Sea of Okhotsk, where the low salinities in shallower waters are influenced by the fluvial discharge from the Amur River (Kim et al., 2015b). The surface waters of the Andaman Sea are also influenced by the Irrawaddy–Salween rivers, which suggests that humic substances could be a source of Zn complexing ligands. However, relatively high log K′ZnL, Zn2+ values, 9.6–11.4, have been obtained in the Andaman Sea compared with those of the Sea of Okhotsk (9.5) (Table 2), indicating that Zn is strongly complexed with organic ligands in the Andaman Sea. A previous study showed that terrestrial humic substances are not strong chelators for Zn, whereas strong ligands for Cu exist in estuarine environments, which suggests that the largest fraction of complexing ligands found in estuarine water columns is derived from sedimentary diagenetic processes (Skrabal et al., 2006). Because the Irrawaddy–Salween rivers are the third-largest contributor of sediment load influenced (Robinson et al., 2007), this high level of sediment load might be related with Zn complexing ligands, which are likely to be complex and heterogeneous. Based on the first CZn and its speciation data obtained in the northeastern Indian Ocean and the Andaman Sea, further research is needed to clarify the sources of Zn complexing ligands in these regions.
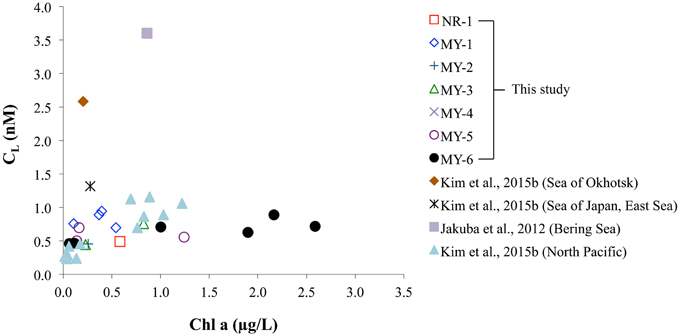
Figure 8. Comparison of Chl a and CL obtained in this study and data from previous studies in the Sea of Okhotsk, Sea of Japan (East Sea), North Pacific (Kim et al., 2015b), and Bering Sea (Jakuba et al., 2012), respectively.
Conclusions
Our results show that a strong influence of fluvial discharge from the Irrawaddy–Salween rivers might affect the surface distribution of CZn and its speciation. In the northern Andaman Sea, where high levels of sediment particles are transported and Chl a contents are high, relatively lower CZn than those of the southern Andaman Sea might suggest the removal of CZn by inorganic coprecipitation and biological uptake in this area. The vertical distributions of CZn in the northeastern Indian Ocean (NR-1) and the Andaman Sea (MY-1 and MY-3) were almost similar from the surface to a depth a 1500 m. Below that depth, the CZn differed, indicating that the deep water in the Andaman Sea was rapidly replaced by the incoming water from the northeastern Indian Ocean across the sills and was then homogenized by vertical mixing.
In the northeastern Indian Ocean, although only one estimate of CL and K′ZnL, Zn2+ could be obtained, probable CL are lower than those of the Andaman Sea. In the Andaman Sea, we could not observe a clear relationship between Chl a and CL, although latter CL increased slightly with an increase in Chl a content at the northernmost station (MY-6). This result may suggest that sources of Zn complexing ligands other than bacteria and phytoplankton might be dominant in the Andaman Sea, which is largely influenced by the Irrawaddy–Salween rivers.
Conflict of Interest Statement
The authors declare that the research was conducted in the absence of any commercial or financial relationships that could be construed as a potential conflict of interest.
Acknowledgments
This study was supported by Grants-in-Aid for Scientific Research (A) (Nos. 19253006 and 23253001) and Grants-in-Aid for Scientific Research (B) (No. 24310006) from Monkasho (the Ministry of Education, Culture, Sports, Science and Technology: MEXT). We are grateful to Rie Sato for the nutrient analysis. We would also like to thank all the crews and participants of cruises on the R/V Hakuho-maru and Dr. Hodaka Kawahata (The University of Tokyo) and Dr. Mayuri Inoue (Okayama University) for their assistance on the research cruise. We thank to the two reviewers for their useful comments that helped to improve the manuscript.
References
Baars, O., and Croot, P. L. (2011). The speciation of dissolved zinc in the Atlantic sector of the Southern Ocean. Deep Sea Res. II 58, 2720–2732. doi: 10.1016/j.dsr2.2011.02.003
Brand, L. E., Sunda, W. G., and Guillard, R. R. (1983). Limitation of marine phytoplankton reproductive rates by zinc, manganese, and iron. Limnol. Oceanogr. 28, 1182–1198. doi: 10.4319/lo.1983.28.6.1182
Bruland, K. W. (1980). Oceanographic distributions of cadmium, zinc, nickel, and copper in the North Pacific. Earth Planet. Sci. Lett. 47, 176–198. doi: 10.1016/0012-821X(80)90035-7
Bruland, K. W. (1989). Complexation of zinc by natural organic ligands in the central North Pacific. Limnol. Oceanogr. 34, 269–285. doi: 10.4319/lo.1989.34.2.0269
Bruland, K. W., Donat, J. R., and Hutchins, D. A. (1991). Interactive influences of bioactive trace metals on biological production in oceanic waters. Limnol. Oceanogr. 36, 1555–1577. doi: 10.4319/lo.1991.36.8.1555
Bruland, K. W., Franks, R. P., Knauer, G. A., and Martin, J. H. (1979). Sampling and analytical methods for the determination of copper, cadmium, zinc, and nickel at the nanogram per liter level in sea water. Anal. Chim. Acta 105, 233–245. doi: 10.1016/S0003-2670(01)83754-5
Bruland, K. W., Knauer, G. A., and Martin, J. H. (1978). Zinc in north-east Pacific water. Nature 271, 741–743. doi: 10.1038/271741a0
Bruland, K. W., Orians, K. J., and Cowen, J. P. (1994). Reactive trace metals in the stratified central North Pacific. Geochim. Cosmochim. Acta 58, 3171–3182. doi: 10.1016/0016-7037(94)90044-2
Campbell, P. G. C., Errécalde, O., Fortin, C., Hiriart-Baer, V. P., and Vigneault, B. (2002). Metal bioavailability to phytoplankton—applicability of the biotic ligand model. Comp. Biochem. Physiol. C Toxicol. Pharmacol. 133, 189–206. doi: 10.1016/s1532-0456(02)00104-7
Chen, D., Qian, P.-Y., and Wang, W.-X. (2008). Biokinetics of cadmium and zinc in a marine bacterium: influences of metal interaction and pre-exposure. Environ. Toxicol. Chem. 27, 1794–1801. doi: 10.1897/07-565.1
Coale, K. H., Wang, X., Tanner, S. J., and Johnson, K. S. (2003). Phytoplankton growth and biological response to iron and zinc addition in the Ross Sea and Antarctic Circumpolar Current along 170°W. Deep Sea Res. II 50, 635–653. doi: 10.1016/S0967-0645(02)00588-X
Crawford, D. W., Lipsen, M. S., Purdie, D. A., Lohan, M. C., Statham, P. J., Whitney, F. A., et al. (2003). Influence of zinc and iron enrichments on phytoplankton growth in the northeastern subarctic Pacific. Limnol. Oceanogr. 48, 1583–1600. doi: 10.4319/lo.2003.48.4.1583
Croot, P. L., Baars, O., and Streu, P. (2011). The distribution of dissolved zinc in the Atlantic sector of the Southern Ocean. Deep Sea Res. II 58, 2707–2719. doi: 10.1016/j.dsr2.2010.10.041
Cutter, G. A., and Bruland, K. W. (2012). Rapid and noncontaminating sampling system for trace elements in global ocean surveys. Limnol. Oceanogr. Methods 10, 425–436. doi: 10.4319/lom.2012.10.425
Donat, J. R., and Bruland, K. W. (1990). A comparison of two voltammetric techniques for determining zinc speciation in Northeast Pacific Ocean waters. Mar. Chem. 28, 301–323. doi: 10.1016/0304-4203(90)90050-M
Ellwood, M. J. (2004). Zinc and cadmium speciation in subantarctic waters east of New Zealand. Mar. Chem. 87, 37–58. doi: 10.1016/j.marchem.2004.01.005
Ellwood, M. J., and Hunter, K. A. (2000). The incorporation of zinc and iron into the frustule of the marine diatom Thalassiosira pseudonana. Limnol. Oceanogr. 45, 1517–1524. doi: 10.4319/lo.2000.45.7.1517
Ellwood, M. J., and van den Berg, C. M. G. (2000). Zinc speciation in the Northeastern Atlantic Ocean. Mar. Chem. 68, 295–306. doi: 10.1016/S0304-4203(99)00085-7
Gerringa, L. J. A., Herman, P. M. J., and Poortvliet, T. C. W. (1995). Comparison of the linear Van den Berg/Ružić transformation and a non-linear fit of the Langmuir isotherm applied to Cu speciation data in the estuarine environment. Mar. Chem. 48, 131–142. doi: 10.1016/0304-4203(94)00041-B
Gosnell, K. J., Landing, W. M., and Milne, A. (2012). Fluorometric detection of total dissolved zinc in the southern Indian Ocean. Mar. Chem. 132–133, 68–76. doi: 10.1016/j.marchem.2012.01.004
Hart, B. T., and Davies, S. H. R. (1981). Trace metal speciation in the freshwater and estuarine regions of the Yarra River, Victoria. Estuar. Coast. Shelf Sci. 12, 353–374. doi: 10.1016/S0302-3524(81)80001-1
Jakuba, R. W., Moffett, J. W., and Saito, M. A. (2008). Use of a modified, high-sensitivity, anodic stripping voltammetry method for determination of zinc speciation in the North Atlantic Ocean. Anal. Chim. Acta 614, 143–152. doi: 10.1016/j.aca.2008.03.006
Jakuba, R. W., Saito, M. A., Moffett, J. W., and Xu, Y. (2012). Dissolved zinc in the subarctic North Pacific and Bering Sea: its distribution, speciation, and importance to primary producers. Global Biogeochem. Cycles 26, GB2015. doi: 10.1029/2010GB004004
John, S. G., and Conway, T. M. (2014). A role for scavenging in the marine biogeochemical cycling of zinc and zinc isotopes. Earth Planet. Sci. Lett. 394, 159–167. doi: 10.1016/j.epsl.2014.02.053
Johnson, C. A. (1986). The regulation of trace element concentrations in river and estuarine waters contaminated with acid mine drainage: the adsorption of Cu and Zn on amorphous Fe oxyhydroxides. Geochim. Cosmochim. Acta 50, 2433–2438. doi: 10.1016/0016-7037(86)90026-8
Johnson, K. S., Boyle, E., Bruland, K. W., Coale, K., Measures, C., Moffett, J., et al. (2007). Developing standards for dissolved iron in Seawater. Eos Trans. AGU 88, 131–132. doi: 10.1029/2007EO110003
Kim, T., Obata, H., Gamo, T., and Nishioka, J. (2015a). Sampling and onboard analytical methods for determining subnanomolar concentrations of zinc in seawater. Limnol. Oceanogr. Methods 13, 30–39. doi: 10.1002/lom3.10004
Kim, T., Obata, H., Kondo, Y., Ogawa, H., and Gamo, T. (2015b). Distribution and speciation of dissolved zinc in the western North Pacific and its adjacent seas. Mar. Chem. 173, 330–341. doi: 10.1016/j.marchem.2014.10.016
Kuwabara, J. S., Chang, C. C. Y., Cloern, J. E., Fries, T. L., Davis, J. A., and Luoma, S. N. (1989). Trace metal associations in the water column of South San Francisco Bay, California. Estuar. Coast. Shelf Sci. 28, 307–325. doi: 10.1016/0272-7714(89)90020-6
Lane, T. W., and Morel, F. M. (2000). Regulation of carbonic anhydrase expression by zinc, cobalt, and carbon dioxide in the marine diatom Thalassiosira weissflogii. Plant Physiol. 123, 345–352. doi: 10.1104/pp.123.1.345
Lohan, M. C., Crawford, D. W., and Purdie, D. A. (2005). Iron and zinc enrichments in the northeastern subarctic Pacific: ligand production and zinc availability in response to phytoplankton growth. Limnol. Oceanogr. 50, 1427–1437. doi: 10.4319/lo.2005.50.5.1427
Lohan, M. C., Statham, P. J., and Crawford, D. W. (2002). Total dissolved zinc in the upper water column of the subarctic North East Pacific. Deep Sea Res. II 49, 5793–5808. doi: 10.1016/S0967-0645(02)00215-1
Milliman, J. D., and Meade, R. H. (1983). World-wide delivery of river sediment to the oceans. J. Geol. 91, 1–21. doi: 10.1086/628741
Morel, F. M. M., Reinfelder, J. R., Roberts, S. B., Chamberlain, C. P., Lee, J. G., and Yee, D. (1994). Zinc and carbon co-limitation of marine phytoplankton. Nature 369, 740–742. doi: 10.1038/369740a0
Morley, N. H., Statham, P. J., and Burton, J. D. (1993). Dissolved trace metals in the southwestern Indian Ocean. Deep Sea Res. I 40, 1043–1062. doi: 10.1016/0967-0637(93)90089-L
Muller, F. L. L., Gulin, S. B., and Kalvøy, Å. (2001). Chemical speciation of copper and zinc in surface waters of the western Black Sea. Mar. Chem. 76, 233–251. doi: 10.1016/S0304-4203(01)00060-3
Nozaki, Y., and Alibo, D. S. (2003). Importance of vertical geochemical processes in controlling the oceanic profiles of dissolved rare earth elements in the northeastern Indian Ocean. Earth Planet. Sci. Lett. 205, 155–172. doi: 10.1016/S0012-821X(02)01027-0
Obata, H., Nozaki, Y., Alibo, D. S., and Yamamoto, Y. (2004). Dissolved Al, In, and Ce in the eastern Indian Ocean and the Southeast Asian Seas in comparison with the radionuclides 210Pb and 210Po. Geochim. Cosmochim. Acta 68, 1035–1048. doi: 10.1016/j.gca.2003.07.021
Okubo, A., Obata, H., Nozaki, Y., Yamamoto, Y., and Minami, H. (2004). 230Th in the Andaman Sea: rapid deep-sea renewal. Geophys. Res. Lett. 31, L22306. doi: 10.1029/2004GL020226
Price, N. M., and Morel, F. M. M. (1990). Cadmium and cobalt substitution for zinc in a marine diatom. Nature 344, 658–660. doi: 10.1038/344658a0
Robinson, R. A. J., Bird, M. I., Oo, N. W., Hoey, T. B., Aye, M. M., Higgitt, D. L., et al. (2007). The Irrawaddy River Sediment Flux to the Indian Ocean: the original nineteenth-century data revisited. J. Geol. 115, 629–640. doi: 10.1086/521607
Ružić, I. (1982). Theoretical aspects of the direct titration of natural waters and its information yield for trace metal speciation. Anal. Chim. Acta 140, 99–113. doi: 10.1016/S0003-2670(01)95456-X
Saager, P. M., de Baar, H. J. W., and Howland, R. J. (1992). Cd, Zn, Ni and Cu in the Indian Ocean. Deep Sea Res. A 39, 9–35. doi: 10.1016/0198-0149(92)90017-N
Sarma, V. V. S. S., and Narvekar, P. V. (2001). A study on inorganic carbon components in the Andaman Sea during the post monsoon season. Oceanol. Acta 24, 125–134. doi: 10.1016/S0399-1784(00)01133-6
Schmitz, W. J. (1995). On the interbasin-scale thermohaline circulation. Rev. Geophy. 33, 151–173. doi: 10.1029/95RG00879
Shaked, Y., Xu, Y., Leblanc, K., and Morel, F. M. M. (2006). Zinc availability and alkaline phosphatase activity in Emiliania huxleyi: implications for Zn-P co-limitation in the ocean. Limnol. Oceanogr. 51, 299–309. doi: 10.4319/lo.2006.51.1.0299
Shankar, D., Vinayachandran, P. N., and Unnikrishnan, A. S. (2002). The monsoon currents in the north Indian Ocean. Prog. Oceanogr. 52, 63–120. doi: 10.1016/S0079-6611(02)00024-1
Shiller, A. M., and Boyle, E. (1991). Trace elements in the Mississippi River Delta outflow region: behavior at high discharge. Geochim. Cosmochim. Acta 55, 3241–3251. doi: 10.1016/0016-7037(91)90486-O
Skrabal, S. A., Lieseke, K. L., and Kieber, R. J. (2006). Dissolved zinc and zinc-complexing ligands in an organic-rich estuary: benthic fluxes and comparison with copper speciation. Mar. Chem. 100, 108–123. doi: 10.1016/j.marchem.2005.12.004
Sunda, W. G., and Huntsman, S. A. (1992). Feedback interactions between zinc and phytoplankton in seawater. Limnol. Oceanogr. 37, 25–40. doi: 10.4319/lo.1992.37.1.0025
Sunda, W. G., and Huntsman, S. A. (1995). Cobalt and zinc interreplacement in marine phytoplankton: biological and geochemical implications. Limnol. Oceanogr. 40, 1404–1417. doi: 10.4319/lo.1995.40.8.1404
Sunda, W. G., and Huntsman, S. A. (1996). Antagonisms between cadmium and zinc toxicity and manganese limitation in a coastal diatom. Limnol. Oceanogr. 41, 373–387. doi: 10.4319/lo.1996.41.3.0373
Sunda, W. G., and Huntsman, S. A. (1998). Interactions among Cu2+, Zn2+, and Mn2+ in controlling cellular Mn, Zn, and growth rate in the coastal alga Chlamydomonas. Limnol. Oceanogr. 43, 1055–1064. doi: 10.4319/lo.1998.43.6.1055
Sunda, W. G., and Huntsman, S. A. (2000). Effect of Zn, Mn, and Fe on Cd accumulation in phytoplankton: implications for oceanic Cd cycling. Limnol. Oceanogr. 45, 1501–1516. doi: 10.4319/lo.2000.45.7.1501
Thamatrakoln, K., and Hildebrand, M. (2008). Silicon uptake in diatoms revisited: a model for saturable and nonsaturable uptake kinetics and the role of silicon transporters. Plant Physiol. 146, 1397–1407. doi: 10.1104/pp.107.107094
Turner, D. R., Whitfield, M., and Dickson, A. G. (1981). The equilibrium speciation of dissolved components in freshwater and sea water at 25°C and 1 atm pressure. Geochim. Cosmochim. Acta 45, 855–881. doi: 10.1016/0016-7037(81)90115-0
Vallee, B. L., and Auld, D. S. (1990). Zinc coordination, function, and structure of zinc enzymes and other proteins. Biochemistry 29, 5647–5659. doi: 10.1021/bi00476a001
van den Berg, C. M. G. (1982). Determination of copper complexation with natural organic ligands in seawater by equilibration with MnO2 I. Theory. Mar. Chem. 11, 307–322. doi: 10.1016/0304-4203(82)90028-7
van den Berg, C. M. G. (1985). Determination of the zinc complexing capacity in seawater by cathodic stripping voltammetry of zinc—APDC complex ions. Mar. Chem. 16, 121–130. doi: 10.1016/0304-4203(85)90017-9
Vu, H. T. D., and Sohrin, Y. (2013). Diverse stoichiometry of dissolved trace metals in the Indian Ocean. Sci. Rep. 3:1745. doi: 10.1038/srep01745
Welschmeyer, N. A. (1994). Fluorometric analysis of chlorophyll a in the presence of chlorophyll b and pheopigments. Limnol. Oceanogr. 39, 1985–1992. doi: 10.4319/lo.1994.39.8.1985
Wyatt, N. J., Milne, A., Woodward, E. M. S., Rees, A. P., Browning, T. J., Bouman, H. A., et al. (2014). Biogeochemical cycling of dissolved zinc along the GEOTRACES South Atlantic transect GA10 at 40°S. Global Biogeochem. Cycles 28, 44–56. doi: 10.1002/2013GB004637
Wyrtki, K. (1971). Oceanographic Atlas of the International Indian Ocean Expedition. Washington, DC: National Science Foundation.
Zwolsman, J. J. G. (1994). Seasonal variability and biogeochemistry of phosphorus in the scheldt estuary, South-west Netherlands. Estuar. Coast. Shelf Sci. 39, 227–248. doi: 10.1006/ecss.1994.1061
Keywords: trace metal, zinc, speciation, ligand, Indian Ocean, Andaman Sea
Citation: Kim T, Obata H and Gamo T (2015) Dissolved Zn and its speciation in the northeastern Indian Ocean and the Andaman Sea. Front. Mar. Sci. 2:60. doi: 10.3389/fmars.2015.00060
Received: 05 June 2015; Accepted: 07 August 2015;
Published: 25 August 2015.
Edited by:
Maeve Carroll Lohan, University of Plymouth, UKReviewed by:
Antonio Cobelo-Garcia, Instituto de Investigaciones Marinas - Consejo Superior de Investigaciones Cientificas, SpainMarta Plavsic, Ruđer Bošković Institute, Croatia
Copyright © 2015 Kim, Obata and Gamo. This is an open-access article distributed under the terms of the Creative Commons Attribution License (CC BY). The use, distribution or reproduction in other forums is permitted, provided the original author(s) or licensor are credited and that the original publication in this journal is cited, in accordance with accepted academic practice. No use, distribution or reproduction is permitted which does not comply with these terms.
*Correspondence: Taejin Kim, Department of Chemical Oceanography, Atmosphere and Ocean Research Institute, The University of Tokyo, 5-1-5 Kashiwanoha, Kashiwa, Chiba 277-8564, Japan, tjkim@aori.u-tokyo.ac.jp