Overcoming restoration paradigms: value of the historical record and metapopulation dynamics in native oyster restoration
 Romuald N. Lipcius1*
  Russell P. Burke2
  Danielle N. McCulloch1
  Sebastian J. Schreiber3
  David M. Schulte1
  Rochelle D. Seitz1
  Jian Shen1
- 1Virginia Institute of Marine Science, College of William & Mary, Gloucester Point, VA, USA
- 2Department of Organismal and Environmental Biology, Christopher Newport University, Newport News, VA, USA
- 3Department of Evolution and Ecology and Center for Population Biology, University of California, Davis, Davis, CA, USA
Restoration strategies for native oyster populations rely on multiple sources of information, which often conflict due to time- and space-varying patterns in abundance and distribution. For instance, strategies based on population connectivity and disease resistance can differ, and extant and historical records of abundance and distribution are often at odds, such that the optimal strategy is unclear and valuable restoration sites may be excluded from consideration. This was the case for the Lynnhaven River subestuary of lower Chesapeake Bay, which was deemed unsuitable for Eastern Oyster (Crassostrea virginica) restoration based on physical conditions, disease challenge, and extant oyster abundance. Consequently, we (i) evaluated previously unknown historical data from the 1800s, (ii) quantified extant oyster recruitment and abundance, physical conditions, and disease presence on constructed restoration reefs and alternative substrates, and (iii) assessed simulations from biophysical models to identify potential restoration sites in the metapopulation. The collective data distinguished numerous restoration sites (i) in the polyhaline zone (salinity 18.4–22.2) where disease resistance is evolving, (ii) where oysters were abundant in the late 1800s-early 1900s, (iii) of recent high recruitment, abundance and survival, despite consistent and elevated disease challenge, and (iv) interconnected as a metapopulation via larval dispersal. Moreover, a network of constructed restoration reefs met size structure, abundance and biomass standards of restoration success. These findings demonstrate that assumptions about the suitability of sites for oyster restoration based on individual processes can be severely flawed, and that in-depth examination of multiple processes and sources of information are required for oyster reef restoration plans to maximize success. We use these findings and previous information to recommend a strategy for successful restoration of subtidal oyster reefs throughout the range of the Eastern Oyster.
Introduction
“Failure of existing rules is the prelude to a search for new ones.”
Kuhn, 1962, The Structure of Scientific Revolutions
Native oyster species of the family Ostreidae were once dominant ecosystem engineers worldwide, including the Olympia oyster Ostrea lurida along the northeast Pacific coast (Ruesink et al., 2005), the European flat oyster Ostrea edulis of the northeastern Atlantic (Airoldi and Beck, 2007), the Sydney rock oyster Saccostrea glomerata of the Pacific coasts of Australia and New Zealand (Ogburn et al., 2007), and the eastern oyster Crassostrea virginica of the western Atlantic and Gulf of Mexico (Winslow, 1881; Baylor, 1895). Unfortunately, native oyster species have been decimated worldwide due to overfishing, eutrophication, and oyster reef degradation (Winslow, 1881; Rothschild et al., 1994; Jackson et al., 2001; Kirby, 2004; Lotze et al., 2006; Airoldi and Beck, 2007; Beck et al., 2009; Zu Ermgassen et al., 2012), resulting in severe losses of ecosystem services stemming from oyster reefs, such as nutrient cycling, water filtration and habitat structure (Peterson et al., 2003; Coen et al., 2007; Grabowski and Peterson, 2007). In Chesapeake Bay, fishery landings and abundance of the native eastern oyster C. virginica have declined to less than 1% of historical levels (Rothschild et al., 1994; Wilberg et al., 2011), leading to considerable, expensive attempts to restore native oyster populations (Kennedy et al., 2011).
After decades of failed restoration efforts, it was concluded that restoration of the native oyster is improbable (Mann et al., 1991; Mann and Powell, 2007), which produced a scientific crisis (sensu Kuhn, 1962) leading to consideration of unorthodox and novel alternatives (see Thomas Kuhn's quote above). One alternative was introduction of a non-native species, such as the Pacific Oyster, C. gigas (Mann et al., 1991) or the Asian Oyster, C. ariakensis (National Research Council, 2004; United States Army Corps of Engineers, 2009). Fortunately, novel restoration approaches led to persisting populations of native C. virginica on constructed natural and alternative oyster reefs protected from exploitation in Delaware Bay (Taylor and Bushek, 2008), North Carolina sounds (Powers et al., 2009), and Chesapeake Bay (Lipcius and Burke, 2006; Schulte et al., 2009), indicating that restoration of C. virginica was indeed feasible and that introduction of a non-native species was not necessary. Despite these apparent successes, the scientific community has not reached consensus either on the major barriers for restoration efforts or on the most effective approaches to achieve success (Kennedy et al., 2011).
Restoration strategies have emphasized (i) disease resistance (Encomio et al., 2005; Carnegie and Burreson, 2011), assuming that restoration failures are due to the inability of C. virginica to tolerate challenges by two disease agents, Haplosploridium nelsoni (the agent of MSX disease) and Perkinsus marinus, which causes dermo, (ii) addition of substrate and three-dimensional reef structure (Lenihan, 1999; Brumbaugh et al., 2006; Lipcius and Burke, 2006; Brumbaugh and Coen, 2009; Powers et al., 2009; Schulte et al., 2009; Burke, 2010), assuming that reef structure has been severely degraded, (iii) extant oyster abundance (Brumbaugh et al., 2000; Berman et al., 2002), assuming that restoration can only succeed where oysters currently reside, (iv) broodstock enhancement and elimination of fishing pressure (Rothschild et al., 1994; Schulte et al., 2009; Wilberg et al., 2011), assuming that the spawning stock is depleted, (v) metapopulation connectivity (Lipcius et al., 2008; North et al., 2008; Lipcius and Ralph, 2011; Munroe et al., 2013), assuming that metapopulation connectivity has been disrupted, and (vi) habitat suitability (Cake, 1983; Soniat and Brody, 1988; Barnes et al., 2007; Starke et al., 2011; Beseres Pollack et al., 2012), assuming that environmental conditions in and around potential oyster reef habitats have deteriorated.
Of these factors, there is strong empirical evidence in support of the evolution of disease resistance in unfished populations of Chesapeake Bay (Encomio et al., 2005; Carnegie and Burreson, 2011) and Delaware Bay (Powell et al., 2011), of the efficacy of substrate addition and three-dimensional reef structure (Lenihan and Peterson, 1998; Lenihan, 1999; Lenihan et al., 1999; Lipcius and Burke, 2006; Powers et al., 2009; Schulte et al., 2009; Burke, 2010; Jordan-Cooley et al., 2011), of the need for the elimination of fishing pressure (Lenihan and Peterson, 1998; Lipcius and Burke, 2006; Powers et al., 2009; Schulte et al., 2009; Wilberg et al., 2013), and of the requirement for favorable habitat suitability (Soniat and Brody, 1988; Barnes et al., 2007; Starke et al., 2011; Beseres Pollack et al., 2012). In contrast, the suppositions that restoration efforts need to be limited to areas of extant oyster abundance (Brumbaugh et al., 2000; Berman et al., 2002) and need not address metapopulation dynamics (Mann and Powell, 2007) have not been rigorously examined.
In this study we describe a field experiment in which restoration oyster reefs were constructed and succeeded at sites selected using historical data and information on metapopulation connectivity, rather than relying solely on extant oyster abundance and disease challenge, in the Lynnhaven River system of Chesapeake Bay for which it was previously concluded that restoration was unfeasible due to disease, sedimentation, low substrate availability, and unsuitable hydrodynamics (Berman et al., 2002; Mann and Powell, 2007). We then integrate our results with prior findings to alter the existing paradigm on key factors necessary to achieve successful native oyster restoration, and to devise a restoration strategy that integrates multiple, interacting processes.
Methods
The Lynnhaven River System
The Lynnhaven River is the southernmost tributary of Chesapeake Bay (Figure 1), and is subdivided into two major segments. One segment is Broad Bay, connected via Long Creek and a constructed channel to Lynnhaven Bay, which exchanges water with Chesapeake Bay via a narrow inlet. The other segment is Lynnhaven Bay, which is the confluence of the two branches (eastern and western) of the Lynnhaven River. The narrow inlet limits water exchange with the bay proper, resulting in the Lynnhaven River subestuary being classified as a trap estuary (Sisson et al., 2010), which promotes larval retention. The system is well-mixed due to its shallow nature, and hydrodynamics are driven by tidal exchange and wind patterns. Much of the system is comprised of fine sediments, except for the nearshore areas, which are of firm sand and shell.
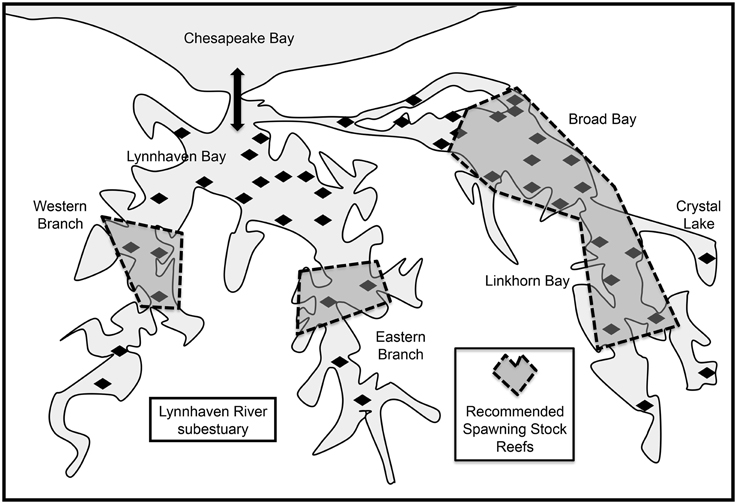
Figure 1. Location of the Lynnhaven River subestuary, potential oyster reef restoration sites (diamonds) determined from historical information (Baylor, 1893, 1894, 1895; Chipman, 1948), and sites in the subestuary for restoration of spawning stock (dashed polygons) recommended by Lipcius et al. (2008) as putative sources. Thick arrow indicates tidal exchange through Lynnhaven Inlet between Lynnhaven Bay and Chesapeake Bay. Coordinates of Lynnhaven Inlet: 36° 54′ 27.02″ N, 76° 05′ 31.07″ W.
Restoration Reef Selection
We used the results of a calibrated high-resolution biophysical model of Crassostrea virginica larval dispersal (Shen et al., 2006; Lipcius et al., 2008; Sisson et al., 2010) to determine optimal restoration sites in terms of metapopulation connectivity (Figure 1). The biophysical model included (i) a planktonic larval phase of 14 d when larvae were transported from the natal reef and not competent to settle, and an additional 7-d period when the virtual larvae were competent to settle as they encountered reefs in the subestuary (Kennedy, 1996); (ii) a larval mortality rate of 21% d−1 (Cowen et al., 2000); (iii) advection and diffusion by currents (vertical migration behavior could have been included, but was not because the shallow nature and mixing of the water column in the subestuary precluded a strong effect of vertical migration on transport), and (iv) selection of potential reef sites based on previous historical locations of oyster production (Baylor, 1895; Chipman, 1948).
Habitat suitability criteria used in potential site selection are listed in Table 1, and included optimal salinity (Galtsoff, 1964; Kennedy, 1996), evidence of recent recruitment (Brumbaugh et al., 2000; Burke, 2010), and stable bottom (Lenihan and Peterson, 1998; McCormick-Ray, 2005; Woods et al., 2005). To assess the salinity zones of the reefs accurately, we examined long-term water quality data gathered from 1976 to 2003 by the Virginia Department of Environmental Quality at 14 stations throughout the subestuary (Sisson et al., 2010). All of the restoration reefs were in areas where long-term average salinity ranged from 18.4 to 22.2 (Supplementary Figure 1), and were thus fully in the polyhaline zone. Moreover, salinity variation in these regions typically ranges between polyhaline and upper mesohaline salinities (i.e., 14–24) and rarely below 5 (Chipman, 1948; Sisson et al., 2010), which is the upper limit of the oligohaline zone.
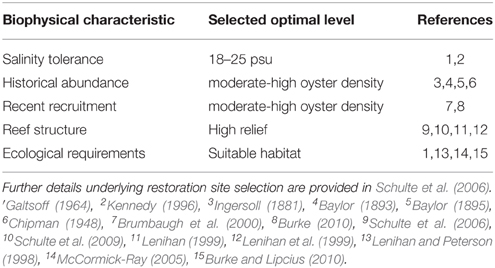
Table 1. Biological characteristics and physical requirements used in the determination of reef restoration sites.
Historical Oyster Abundance in the Lynnhaven River system
To determine past oyster abundance at the potential restoration reefs prior to the major population collapse in the mid-twentieth century, we examined historical records from the late nineteenth century. The records were both qualitative (Ingersoll, 1881) and quantitative (Baylor, 1895) surveys of natural oyster reefs, bars, and shoals in the subestuary. Baylor (1893, 1894, 1895) surveyed five public oyster grounds of the Lynnhaven River subestuary in 1893—Broad Bay, Linkhorn Bay, Rainey's Pond (i.e., Crystal Lake), Lynnhaven River proper (i.e., Lynnhaven Bay), and the mouth of Long Creek (Table 2). Baylor was apparently prohibited by the oyster inspectors from surveying much of the Eastern and Western Branches of the Lynnhaven River due to the desire of Virginia Fish Commission inspectors to keep such areas out of the public oyster fishery (Baylor, 1895). The maps of oyster ground boundaries (Baylor, 1893) from the Baylor survey were derived from boundary points measured by theodolite and certified as follows (Baylor, 1894):
“Report of the survey of the natural oyster rocks, beds and shoals of Princess Anne County, giving courses and distances from landmarks, and marked shore stations to be used in conjunction with the maps and charts of the oyster grounds of Virginia. Jan. 1st 1894. Dr. John T. Wilkins, Jr., Fish Commissioner of Virginia.”
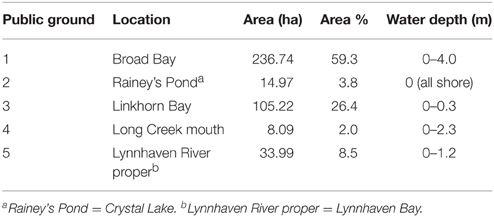
Table 2. Public oyster grounds in the Lynnhaven River subestuary defined by (Baylor, 1893, 1894, 1895) as those areas where natural oyster reefs, beds, or shoals occurred during his surveys.
The actual data collection methodology was described as follows (Baylor, 1894):
“The Method of Defining the Location and Extent of the Natural Oyster Beds, Rocks and Shoals, was as follows: A theodolite was mounted at each of two accurately determined triangulation points on the shore, with an observer at each instrument, the (three Princess Anne county) commissioners (T.P. Bell, A.G. Mitchell, W.E. Biddle) being at the same time in a steam launch or boat (with sounding pole, oyster tongs, &c.,) passing over the beds. As each turn or corner of the rocks was found, the boat was held stationary for a certain length of time, and a white and red flag was displayed as a signal to the observers on shore, who, as soon as the flag was elevated, simultaneously measured the angle between the initial triangulation point and the flag-pole, held over the corner of the rock, the angle and the time of measuring it being recorded at once by each observer in his own book, while the depth of water as taken by one of the commissioners was placed in the two record books when the party came together. J.B. Baylor, U.S. Coast and Geodetic Survey.”
Restoration Reef construction
Based on our recommendations, the U.S. Army Corps of Engineers (Norfolk District) constructed 12 reefs (20.57 ha) in the Lynnhaven River, Broad Bay, and Linkhorn Bay (Figure 2). The reefs ranged in area from 1.62 to 5.67 ha (Table 3), and were constructed of fossil oyster shell placed on the bottom at heights of 0.1–0.5 m (Schulte et al., 2006). Reefs at Broad Bay 1, Linkhorn Bay 1 and 2, and Lynnhaven River 1–4 were built in late summer and early fall of 2007, whereas reefs at Broad Bay 2 and 3, and Linkhorn Bay 3–5 were built in late summer and early fall of 2008.
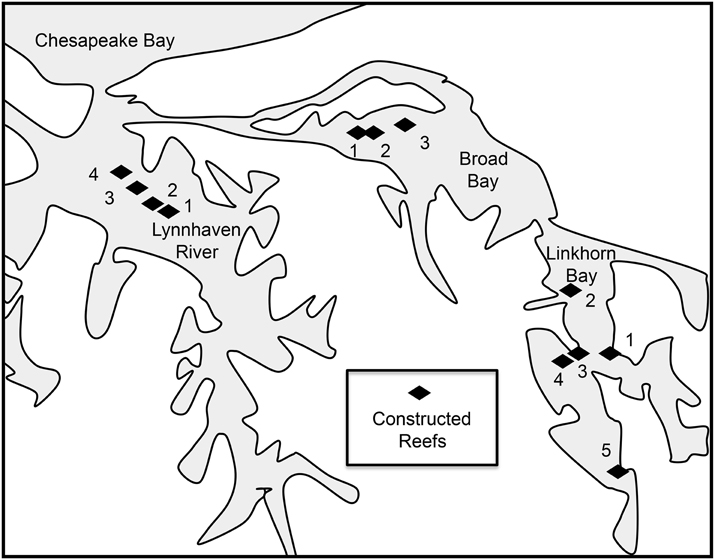
Figure 2. Sites of sanctuary oyster reefs constructed in the Eastern Branch of the Lynnhaven River (LR1-4), Broad Bay (BB1-3), and Linkhorn Bay (LB1-5).
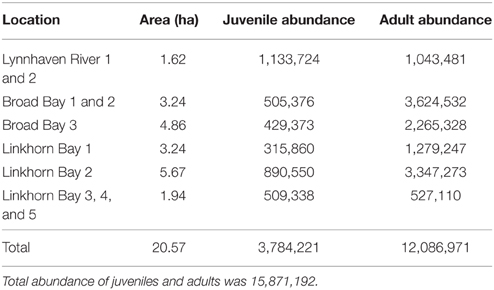
Table 3. Estimated juvenile and adult abundance on the constructed reefs.
Oyster Abundance on Restoration Reefs
To assess the capacity for oysters to recruit and survive at high abundance in our putative source sites, we validated the abundance information from the historical record with field surveys and with other recent abundance estimates (Brumbaugh et al., 2000; Burke, 2010). In our field surveys, we used standard procedures under Stratified Random Sampling (Cochran, 1977; Thompson, 2002) to survey the reefs. Reef extent and quality (high-relief reef, low-relief reef, unrestored bottom) were mapped by the U.S. Army Corps of Engineers with side-scan sonar. Reefs were then apportioned into strata by location (Figure 2, Table 3). The stratum area estimates were used to generate random, stratum-specific nominal sampling sites and backup sites within a grid surrounding each of the reefs, using stratified random sampling with sample allocation proportional to stratum area and variance (Cochran, 1977; Thompson, 2002).
All reefs were sampled in July 2011. To increase sample size, additional samples were taken at Lynnhaven River reefs 1 and 2 and Linkhorn Bay reef 2 in January 2012. Due to the shallow nature of Lynnhaven River reefs 3 and 4, we were unable to take enough samples to provide accurate estimates of oyster density and biomass on those two reefs.
Sampling sites were located by GPS coordinates and sampled in the order in which they were generated to assure random sampling within each stratum. Next, a patent tong (1-m wide) was deployed from an anchored vessel, the sample was retrieved on a processing table aboard the vessel, and a photo was taken of the sample with its ID visible on a whiteboard. A complete 0.5-m2 section was rinsed and retained for lab processing. Samples were not processed in the field due to the high probability that individual oysters would not be easily seen in the field, resulting in biased data. The volume of all live oysters and attached shells was measured in a graduated cylinder to estimate accreted reef volume.
A random subset of sites was selected to estimate oyster density as a function of reef height. Efficiency of the patent tong sampling gear was estimated as 82% (Schulte et al., unpublished data). Parameter estimates for density and abundance were obtained using the R statistics package (www.r-project.org) following equations in Cochran (1977) and Thompson (2002). The R script for stratified random sampling is provided as Appendix 1 in Supplementary Material.
Condition Index, Biomass and Disease Status of Oysters on Restoration Reefs
Condition index (CI) was calculated for random subsets of oysters from the Lynnhaven River, Broad Bay, and Linkhorn Bay reefs, following procedures outlined in Burke (2010). Each sample of oysters, which comprised individuals throughout the range of shell heights (= shell lengths), was cleaned of fouling organisms and rinsed. Oysters were blotted dry, then measured (shell height, shell depth, shell width), shucked, and weighed (wet flesh mass, wet shell mass). Shells and tissue were then dried at 60°C for at least 48 h and weighed (dry tissue mass = dry weight, dry shell mass), followed by 6 h at 550°C in a muffle furnace to produce ash-free dry mass (AFDM) estimates. Condition index was calculated as (Lucas and Beninger, 1985; Rainer and Mann, 1992):
where AFDM is ash-free dry mass in g and SM is dry shell mass. This CI is an accurate indicator of condition (Hickman and Illingworth, 1980; Davenport and Chen, 1987). We also calculated CI as (Abbe and Sanders, 1988; Abbe and Albright, 2003):
where SV is shell volume. Shell volume was calculated both as the product of shell height, shell depth, and shell width, and as half of the volume of an ellipsoid with major axis = shell height, minor axis = shell width, and vertical axis = shell depth. This CI was positively and significantly correlated with the first CI, and is thus not presented.
To generate the relationship between oyster size and biomass, we used a subset of oysters across the full size range from reefs in the Lynnhaven River, Broad Bay, and Linkhorn Bay. The equations derived from these functions were used to calculate biomass of the sampled oysters. We multiplied the values of ash-free dry mass (AFDM) by 1.22 to convert them to dry weight (DW), based on a simple linear regression of AFDM as a function of DW (r2 = 0.99, n = 301, p < < 0.001).
To determine disease levels in Lynnhaven oysters, we conducted P. marinus and H. nelsoni diagnoses in 110 oysters previously assessed by Burke (2010). Oysters were collected in September 2007, around the time when P. marinus levels peak annually (Carnegie and Burreson, 2009). Oysters ranging in shell height (SH) from 46.3 to 121.4 mm were collected from oyster shell and alternative substrate reefs in Long Creek and Broad Bay (see Burke, 2010, for details), and brought on ice to the VIMS Shellfish Pathology Laboratory for analyses. Ray's fluid thioglycollate medium assays (Ray, 1954) were performed on gill/mantle and rectal tissues for P. marinus detection, and remaining viscera were fixed in Davidson's fixative (Shaw and Battle, 1957) and processed using standard histological methods for detection of H. nelsoni in paraffin sections. Infections with P. marinus were rated rare to very heavy following Ray (1954, with conversions to numerical scores summarized in Supplementary Table 1), and infections for H. nelsoni were categorized as rare, light, moderate, or heavy following Carnegie and Burreson (2011). Given that these oysters were not the same ones collected in the field survey, we assessed whether or not their condition index was similar to those from our field collections. Condition index of a complementary group of oysters collected at 18 sites by Burke (2010) was also calculated and compared to the CI values of oysters collected in our field survey.
Results
Historical Oyster Abundance
Historical records of oyster abundance in the Lynnhaven River subestuary consistently provide evidence of the high abundance and quality of oyster reefs in the system (Ingersoll, 1881; Baylor, 1895). Specifically, the largest oyster beds and highest abundances occurred in Broad Bay and Linkhorn Bay, where most of our restoration reefs were located (Figures 3, 4). For example, Ingersoll (1881) stated the following regarding oyster populations in the Lynnhaven River system:
“The southernmost, and at the same time one of the most famous localities for oyster-planting in Virginia, is at Lynnhaven, just inside of Cape Henry. The wide reputation and acknowledged superiority of the oysters raised in this river and bay led Col. M. McDonald to examine particularly into the methods pursued there; and he has kindly placed at my disposal the succeeding memoranda:
Lynnhaven river is simply a branching arm of Chesapeake bay, and has been made by the tidal ebb and flow. …Oysters for planting are obtained from Back bay and Linkhorn bay, tributaries of the Lynnhaven river, in which there are natural beds. They are also obtained from spawning-coves in the river itself. Oysters from James River and other localities have been tried, but have not done well.
…They remain in the beds 6 years or more, …They are disposed of almost wholly at retail, in the shell, over the tables of saloons and hotels as “fancy” stock.
The amount now planted in this river is almost 200,000 bushels.”
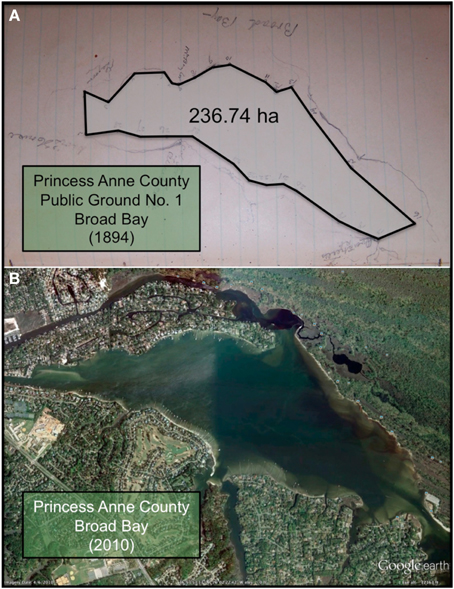
Figure 3. (A) Photograph of the sketch by Baylor (1893) for Public Ground No. 1 (Broad Bay) in Princess Anne County, with a polygon connecting the points of the oyster ground superimposed on the photograph. The shoreline of Broad Bay is faintly visible bordering the polygon. (B) Recent satellite image of Broad Bay, at approximately the same scale as the sketch, adapted from Google Earth.
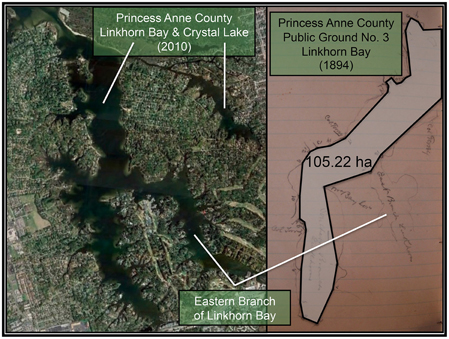
Figure 4. (Right) Photograph of the sketch by Baylor (1893) for Public Ground No. 3 (Linkhorn Bay) in Princess Anne County, with a polygon connecting the points of the oyster ground superimposed on the photograph. The shoreline of Linkhorn Bay is faintly visible bordering the polygon. (Left) Recent satellite image of Linkhorn Bay and Crystal Lake, at approximately the same scale as the sketch, adapted from Google Earth.
Similarly, the Baylor survey indicated that nearly the whole of Broad Bay and Linkhorn Bay was “natural oyster rock” (Baylor, 1893), as indicated in the sketches of Broad Bay (Figure 3A) and Linkhorn Bay (Figure 4) from Baylor's notebooks. The natural rock in Broad Bay (Figure 3A), listed by Baylor as Princess Anne County, Public Ground No. 1 (Table 2), was estimated at 236.74 ha, covered most of Broad Bay (Figure 3B), and constituted 59.3% of the Lynnhaven public grounds (Table 2). Linkhorn Bay was Public Ground No. 3 and was estimated at 105.22 ha, which extended through most of the bay (Figure 4) and composed 26.4% of the Lynnhaven oyster grounds (Table 2). In total, the public grounds in Broad Bay and Linkhorn Bay comprised 85.7% of all public grounds in the Lynnhaven River subestuary (Table 2).
Oyster Size, Biomass and Abundance on Subtidal Reef Sites
The relationship between oyster size and biomass was exponential in all three areas: Lynnhaven River (Figure 5A), Broad Bay (Figure 5B), and Linkhorn Bay (Figure 5C), as expected from previous studies.
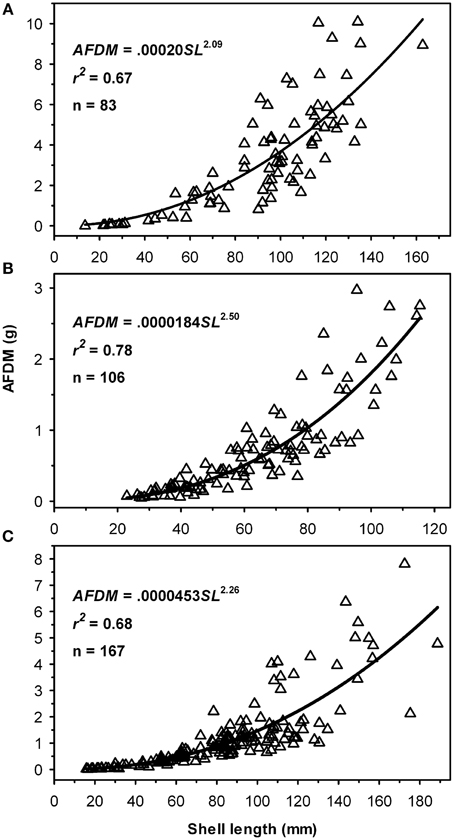
Figure 5. Ash-Free Dry Mass (AFDM) as a function of oyster size for reefs in (A) Lynnhaven River, (B) Broad Bay, and (C) Linkhorn Bay.
Live oysters on the reefs were a mix of 2–4 year classes, depending on the dates of construction and sampling (Figure 6). Due to the timing of reef construction (Fall 2008) and sampling (July 2011) at Broad Bay reefs 1–3 (Figures 6A,C,E) and Linkhorn Bay reefs 3–5 (Figures 6F,H), we expected and observed a mix of 2009 [0+ age class, mean ~35 mm shell length (SL)] and 2010 (1+ age class, mean ~70 mm SL) oysters. There were also a few 2+ oysters larger than 100 mm SL at Broad Bay reef 1 (Figure 6A) because part of the reef was built in Fall 2007. The reefs built in Fall 2007 (Lynnhaven River 1 and 2, Linkhorn Bay 1 and 2) generally had a mix of oysters from the 2008 to 2010 year classes (Figures 6B,D,G), while Linkhorn Bay 2 and Lynnhaven River 1 and 2 also had new 2011 recruits < 20 mm SL because some of the samples from these reefs were from January 2012 (Figures 6D,G). Note that Linkhorn Bay reef 2 also had larger individuals than other reefs because it was enhanced with oysters after construction, and these supplemented oysters survived in large numbers (Figure 6D).
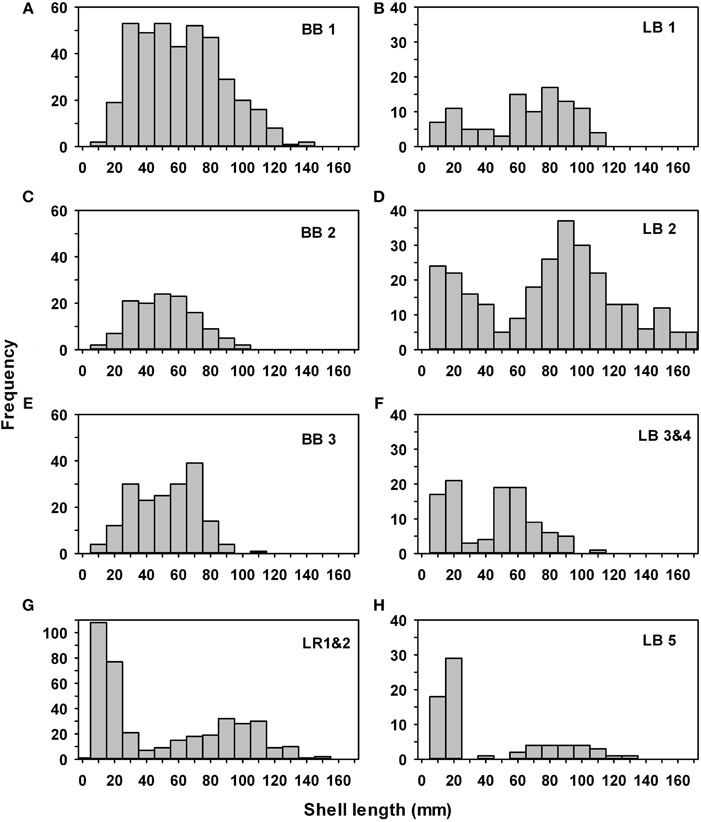
Figure 6. Size-frequency histograms for all oysters collected on constructed oyster reefs in Broad Bay reefs 1 (A), 2 (C), and 3 (E), Linkhorn Bay reefs 1 (B), 2 (D), 3 and 4 (F), and 5 (H), and the Eastern Branch of the Lynnhaven River reefs 1 and 2 (G). BB, Broad Bay, LB, Linkhorn Bay, LR, Lynnhaven River.
Oyster density and biomass on constructed oyster reefs in the Lynnhaven River, Broad Bay, and Linkhorn Bay were compared with the threshold (15 oysters m−2 and 15 g dry weight m−2 of oysters of at least 2 year classes) and target (50 oysters m−2 and 50 g dry weight m−2 of oysters of at least 2 year classes) for successful performance of constructed oyster reefs, as established by the Chesapeake Bay Program's Sustainable Fisheries Goal Implementation Team (http://www.chesapeakebay.net/channel_files/17932/oyster_restoration_success_metrics_final.pdf). Oyster density on all but one (Linkhorn Bay 1) of the constructed reefs in the Lynnhaven River (Eastern Branch), Broad Bay, and Linkhorn Bay (Figures 7A, 8A) surpassed the density threshold and target (Table 4). Linkhorn Bay 1 exceeded the threshold and was just below the target at 49.3 oysters m−2 (Table 4). Oyster biomass on all constructed reefs was driven by adult biomass (Figures 7B, 8B) and surpassed the threshold (Table 4). In addition, three of the reefs (Lynnhaven River, Broad Bay 1, and Linkhorn Bay 2) exceeded the target, while the remaining three reefs (Broad Bay 2, Linkhorn Bay 1, and Linkhorn Bay 3, 4, and 5) were between the threshold and target (Table 4). Consequently, all reefs met the threshold for successful performance of constructed oyster reefs, while three of the six reef systems exceeded the target; the remaining three were between the threshold and target.
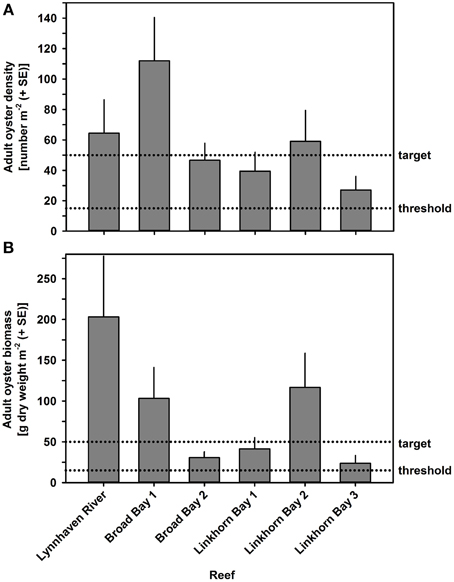
Figure 7. Adult oyster density (A) and biomass (B) on constructed oyster reefs in the Lynnhaven River, Broad Bay, and Linkhorn Bay. Dotted lines represent the thresholds (15 oysters m−2 or 15 g dry weight m−2 of oysters) and targets (50 oysters m−2 and 50 g dry weight m−2 of oysters) for successful performance of constructed oyster reefs, as established by the Chesapeake Bay Program's Sustainable Fisheries Goal Implementation Team (http://www.chesapeakebay.net/channel_files/17932/oyster_restoration_success_metrics_final.pdf). Note that the thresholds and targets refer to oysters of all ages (juveniles + adults). Bars represent 1 standard error of the mean.
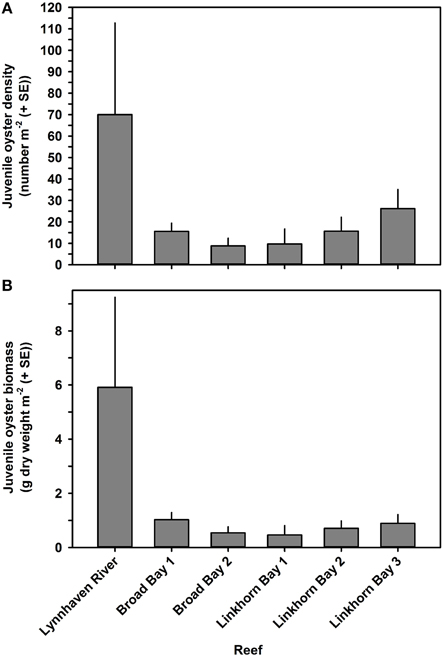
Figure 8. Juvenile oyster density (A) and biomass (B) on constructed oyster reefs in the Lynnhaven River (Eastern Branch), Broad Bay, and Linkhorn Bay. Bars represent 1 standard error of the mean.
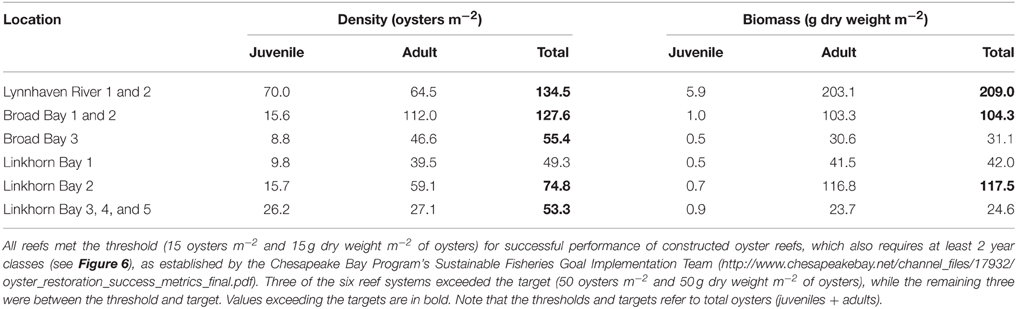
Table 4. Oyster density and biomass on constructed oyster reefs in the Lynnhaven River, Broad Bay, and Linkhorn Bay.
Juvenile recruitment was also significantly and positively correlated with adult density in a sigmoidal fashion, such that juvenile recruitment was relatively low at adult densities below 50 m−2 and high at densities above 75 m−2 (Figure 9).
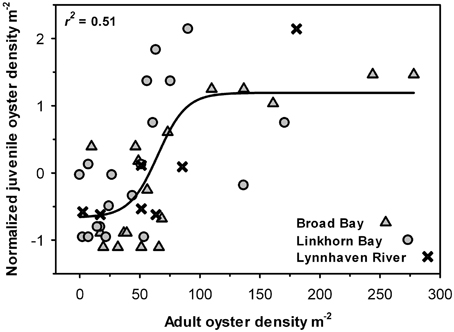
Figure 9. Juvenile oyster density as a function of adult oyster density in each sample. Data from the three areas (Broad Bay, Linkhorn Bay, Lynnhaven River) were normalized to account for differences in recruitment by area. The curve is a non-linear regression fit of the data (p < 0.01).
Total abundance on the network of reefs was 15,871,192 oysters, with adults (>30 mm SL) comprising 76% of the population (Table 3). Broad Bay contained 43% of all oysters, Linkhorn Bay also contained 43%, while Lynnhaven Bay had 14% (Table 3).
We also assessed the effect of water depth on oyster density (Supplementary Figure 2), which was non-significant (linear and non-linear regression, r2 = 0.04, p >> 0.05), probably due to the generally shallow nature of the Lynnhaven River system.
Reef Height Effect on Recruitment and Adult Abundance
To determine whether or not the height of constructed reefs affected oyster density, we analyzed a subset of the data for which relief (high or low) could be reliably estimated from the side-scan data. Oyster density was higher on high-relief reef than on low-relief reef in all three locations (Figure 10), and significantly so for Broad Bay and for Linkhorn Bay reef 2 (ANOVA, p < 0.05).
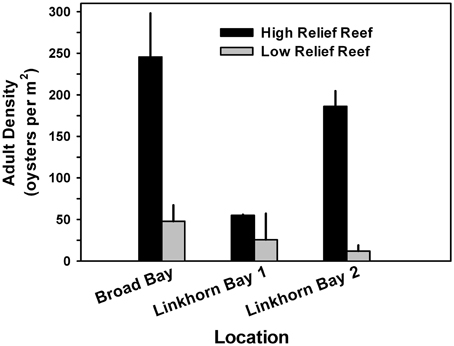
Figure 10. Adult oyster density as a function of reef height for a subset of the data for which the measure of reef relief was reliable. Oyster density was higher on high-relief reef than on low-relief reef in all locations, and significantly so for all Broad Bay reefs and for Linkhorn Bay reef 2 (ANOVA, p < 0.05).
Condition Index and Disease Status of Oysters on Restoration Reefs
Only one oyster had Haplosploridium cells (Burke, 2010), so MSX analyses were not conducted. In contrast, 102 of the 110 tested oysters (92.7%) were positive for P. marinus cells, with the average infection reaching light to moderate intensity (Supplementary Figure 3). Infection intensity was a slightly positive but non-significant function of oyster size (r2 = 0.04, p = 0.1, Supplementary Figure 3). Clearly, most oysters were readily challenged by P. marinus in the Lynnhaven, yet a relatively small percentage of infections reached heavy intensities (Supplementary Figure 3). Condition index of oysters was high and indicative of healthy oysters (Table 5, mean = 2.76, SE = 0.15, n = 18).
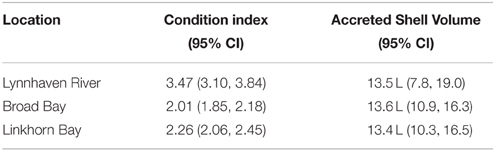
Table 5. Condition index and accreted shell volume per m2 on the constructed reefs.
Discussion
Metapopulation Dynamics and Biophysical Modeling of Restoration Sites
We evaluated metapopulation connectivity of historical oyster reefs in the Lynnhaven River subestuary of lower Chesapeake Bay due to the recognized importance of metapopulation connectivity in determining the effectiveness of networks of marine protected areas, both theoretically (Crowder et al., 2000; Lipcius et al., 2005; Figueira and Crowder, 2006; Hastings and Botsford, 2006; Treml et al., 2008; Botsford et al., 2009; White et al., 2010; Kininmonth et al., 2011) and empirically in diverse species including coral reef fish (Roberts, 1997, 1998; Bode et al., 2006; Almany et al., 2009; Cowen and Sponaugle, 2009), mussels (Becker et al., 2007; Carson et al., 2011), crabs and lobsters (Lipcius et al., 2001, 2005; Fogarty and Botsford, 2006; Incze et al., 2010), abalone (Miyake et al., 2009), sea urchins (Wing et al., 2003), and marine species in general (Pulliam, 1988; Lipcius and Ralph, 2011). The existence of metapopulation dynamics is primarily due to the life history of many marine species whereby an actively dispersing larval phase connects juveniles and adults of spatially disparate populations, thereby requiring incorporation of metapopulation dynamics into conservation and restoration planning.
We selected a biophysical model that integrated larval duration, mortality, and settlement behavior (Shen et al., 2006; Lipcius et al., 2008; Sisson et al., 2010). We examined larval exchange among potential oyster reef sites in the subestuary to determine optimal sites for reef restoration alone and those where joint broodstock and reef restoration would be most beneficial (e.g., putative sources). The model suggested that larvae from these sites were advected throughout the subestuary, including Linkhorn Bay, Broad Bay, Long Creek, Lynnhaven Bay, and the downriver portions of the Eastern and Western Branches of the Lynnhaven River. These putative source reefs were probably interconnected with much of the subestuary via larval exchange, which suggests that these reefs are optimal for restoration and broodstock enhancement. Putative sink reefs are unsuitable for broodstock enhancement because their larvae appear to be flushed from the system, but they are suitable for habitat restoration to improve water quality, refuge for small fish and invertebrates, and feeding grounds for predators such as the blue crab. It has been suggested that restoration reefs be placed in sink habitats (Brumbaugh et al., 2006). However, broodstock on these reefs near the mouth of the subestuary likely produce larvae that are advected out of the subestuary and lost from the metapopulation, such that source reefs must also be available to subsidize sink reefs with larvae. There needs to be a combination of different habitat types and locations for restoration reefs in source and sink habitats, such that both broodstock enhancement and ecosystem services are restored.
Historical and Recent Oyster Abundance
When assessing optimal sites to serve as source reefs, from which larvae will disperse back to the natal reef as well as to other reefs in the metapopulation (Lipcius et al., 2005, 2008; Lipcius and Ralph, 2011), the key issue is whether or not the reef sites are capable of supporting oyster populations. In fact, it is expected that sites selected for restoration will typically have relatively few oysters; if oysters were already in abundance at these sites, there would usually be no need for restoration, unless there were a need to amplify the resident population for some other goal such as habitat improvement.
To assess the capacity for oysters to recruit and survive at high abundance in our putative source sites, we examined the historical record (Baylor, 1893, 1894, 1895; Chipman, 1948; Schulte et al., 2006) and recent abundance estimates (Brumbaugh et al., 2000; Luckenbach and Ross, 2009; Burke, 2010). In contrast to the earlier information on low oyster abundance in the Lynnhaven River system (Berman et al., 2002), the historical record demonstrated conclusively that the Lynnhaven River subestuary consistently harbored abundant oyster populations of high quality (i.e., “fancy stock”) and production, reaching 200,000 bushels annually (Ingersoll, 1881; Baylor, 1895; Chipman, 1948). Most of the putative source reefs were in the areas of the subestuary where spat settlement, seed production, and oyster abundance were highest, specifically in Linkhorn Bay and Broad Bay, which were public oyster grounds and seed-producing areas historically (Ingersoll, 1881; Baylor, 1895; Chipman, 1948).
The oyster reefs in these areas were eventually laid barren through overfishing, destructive fishing practices, and pollution (Chipman, 1948). Moreover, the public grounds in the Lynnhaven River subestuary were not maintained, in contrast to other public grounds in Virginia waters, and most of these were relinquished to private interests prior to the repletion program, which began in 1928 (Commission of Fisheries of Virginia, 1931). Thus, we used recent surveys (Brumbaugh et al., 2000; Burke, 2010) to assure that there was still a capacity for oysters to survive and grow in abundance at the restoration sites. The surveys confirmed that oysters were abundant in Linkhorn Bay and Broad Bay, as well as other parts of the Lynnhaven River, where densities on natural and alternative reefs reached over 1000 m−2 (Supplementary Figure 4, Burke, 2010). Finally, in terms of water quality, much of Broad Bay, Linkhorn Bay, and the Lynnhaven River have been reopened to shellfish harvest in recent years, which eliminates concerns over the effects of Escherichia coli contamination on oyster restoration at these sites. Consequently, the restoration reef sites harbored high oyster densities both historically and in recent times, and are suitable for restoration.
The utility of historical ecology in conservation and restoration has become much more prominent in recent years (Jackson et al., 2001; Lotze and Worm, 2009), and can be applied to species with written records, as we have done, or with archaeological or paleontological information, as done for the blue crab (Rick et al., 2015).
Oyster Size, Biomass, and Abundance on Subtidal Reef Sites
Live oysters on the constructed reefs in the Lynnhaven River system were a mix of 2–4 year classes. Age 0 oysters were generally less than 30 mm shell length, while adults ranged from 30 to over 200 mm shell length. Oyster density and biomass on all reefs in the Lynnhaven River system surpassed the threshold for successful performance of constructed oyster reefs set by the Chesapeake Bay Program's Sustainable Fisheries Goal Implementation Team. In addition, three of the reefs exceeded the targets for oyster density and biomass, while the remaining three reefs were between the threshold and target. Consequently, the network of constructed oyster reefs in the Lynnhaven River system presently represents a successful restoration effort that should be monitored to assess its long-term performance.
As expected from previous findings for constructed oyster reefs in the Great Wicomico River (Schulte et al., 2009), oyster density was higher on high-relief reef than on low-relief reef and juvenile recruitment was a positive, sigmoid function of adult density. These features provide a feedback mechanism for the long-term persistence of unexploited restoration reefs in the face of environmental stresses such as siltation and burial (Colden and Lipcius, 2015).
Disease and Condition of Oysters
All of the restoration reefs were fully in the mesohaline and polyhaline zones, as evidenced by long-term average salinity from 1976 to 2003 at these sites (Sisson et al., 2010). Moreover, salinity variation in the Lynnhaven River subestuary also typically ranges between polyhaline and upper mesohaline salinities (Chipman, 1948), where disease challenge is greatest (Carnegie and Burreson, 2011).
While most oysters were infected with P. marinus (92.7%), very intense infections were relatively uncommon. Intensity of P. marinus was not significantly related to oyster size and remained at moderate intensity through the full size range of oysters. Despite the potent disease challenge, survival of oysters on the reefs was over 80% per year (Burke, 2010), the condition of surviving oysters was high, and a large proportion of the oysters (>50%) thus survived to reproduce. These collective results confirm earlier findings (Carnegie and Burreson, 2011) that the oyster populations in the high-salinity waters of Lynnhaven have evolved resistance to disease despite strong disease challenge. The most likely processes mediating survival of the oysters were availability of reefs of high quality, whether shell or alternative substrates (Burke, 2010), and development of disease resistance in the high-salinity waters (Carnegie and Burreson, 2011).
Previously, it was proposed that larger, older oysters should be harvested and removed from the system (Andrews and Ray, 1988; Krantz and Jordan, 1996) under the assumptions that disease would have the highest intensity and kill older oysters in high-salinity areas, and therefore that the propagation of the disease would be reduced by removal of infected oysters. In this study, the largest oysters of 100–120 mm shell height had similar P. marinus intensities as those in the smaller size classes of 60–100 mm shell height. Although some of the larger oysters would have succumbed to disease and were therefore not sampled, there should still have been a strong positive relationship between disease intensity and size, which was not the case. Hence, oysters in high-salinity waters where disease challenge is strong can survive, reproduce, and persist. Along with recent findings of the development of disease resistance in oyster populations (Carnegie and Burreson, 2011), these results indicate that restoration efforts with native oyster populations can be undertaken in high-salinity, disease-challenged areas.
What about Climate Change?
Thus, far we have emphasized past and present conditions to be considered in oyster restoration. But how do we deal with the uncertain future associated with climate change? Lowered pH due to ocean acidification may reduce reproductive output by weakening the shells of oyster larvae, diminishing their growth rates, and depressing their survival (Kurihara et al., 2007; Miller et al., 2009; Watson et al., 2009). It may also decrease calcification rates and amplify shell dissolution rates of juveniles and adults (Beniash et al., 2010; Waldbusser et al., 2011a,b; Dickinson et al., 2012), and it may alter interspecific interactions such as predator-prey dynamics (Gazeau et al., 2013), which can lead to phase shifts in bivalve prey species (Seitz et al., 2001). Adding the potential future impacts of warming temperatures and sea-level rise on oyster populations, such as the proliferation of marine infectious diseases (Burge et al., 2014), further complicates our ability to develop optimal restoration strategies under the influence of climate change.
A potential solution to the problem of devising optimal oyster restoration strategies given the unpredictable future effects of climate change on oyster populations may be the same as that devised for networks of marine reserves that are susceptible to catastrophic disturbances such as oil spills (Allison et al., 2003; McGilliard et al., 2011). Specifically, spatially concentrated populations are more susceptible to a local catastrophe than populations spread over a large range, and a concentrated population is more susceptible to global catastrophes than a diffuse population of equal abundance (McGilliard et al., 2011). Hence, oyster reefs should be constructed in multiple locations over a large geographic area, while also taking into consideration the likely metapopulation connectivity and source-sink dynamics. In addition, restoration reefs should be constructed where populations will likely be resistant or resilient to climate change, such as populations that have withstood environmental stress and variability, or where climate change is unlikely to have a strong effect on future environmental conditions (Green et al., 2014). This “bet-hedging” strategy may not maximize short-term metapopulation growth, but it will reduce the risk of metapopulation collapse when future environmental conditions are unpredictable (Simons, 2011).
Conclusions and Recommendations for Oyster Restoration
The restoration sites for oyster reefs were based on a biologically realistic hydrodynamic model, at locations in the salinity zone (i.e., polyhaline) where disease resistance is most likely to evolve, and in areas where oyster populations have recruited and survived at high density both historically and in recent times. The integration of information from the historical record, metapopulation connectivity, physical conditions, and disease resistance do not contravene but are in fact synergistic and essential in native oyster restoration. Using our results and the literature on oyster restoration, we recommend inclusion of the following elements in oyster restoration efforts. Note that we did not add citations for each specific element because the origins of many of these elements are unknown and they are frequently repeated in the literature.
1. Search and utilize historical information, some of which may be hidden in archival documents. For instance, we were only able to find the Baylor (1893, 1894) files after an extensive search, eventually culminating at the Library of Virginia. These documents were instrumental in defining a much broader area of potentially restorable bottom for oyster reefs.
2. Conduct a pre-construction population survey to assess the status of the population in the restoration area, which is essential for monitoring and evaluating future performance of restoration reefs.
3. Conduct a pre-construction high-resolution bottom survey to map suitable bottom characteristics for restoration sites.
4. Assess habitat quality and environmental conditions (e.g., salinity, temperature, dissolved oxygen, water-column sediment concentration) to determine if they are satisfactory for oyster survival, reproduction and growth. This information could be integrated into a Habitat Suitability Index (Cake, 1983; Soniat and Brody, 1988; Barnes et al., 2007; Starke et al., 2011; Beseres Pollack et al., 2012) for the full area to select optimal sites for restoration. Note that the Habitat Suitability Index must be calibrated and validated for the specific area under consideration. The use of a general, uncalibrated, and unvalidated Habitat Suitability Index is highly inadvisable, as it can easily lead to costly failures.
5. To minimize the deleterious future effects of climate change, use a “bet-hedging” strategy by constructing reefs in multiple locations over a large geographic area, where populations will likely be resistant or resilient to climate change, or where climate change is unlikely to have a strong effect on future environmental conditions.
6. Assess metapopulation connectivity with calibrated, high-resolution hydrodynamic models, which can be used to define optimal sites for metapopulation growth and persistence.
7. Utilize realistic demographic models to assess the role of non-linear processes (e.g., reef height and adult density effects on juvenile recruitment) and potential for alternative stable states (Jordan-Cooley et al., 2011).
8. Define optimal reef design and scale for the specific system. For example, in areas of moderate to high siltation or periodic hypoxia, high-relief reefs may ameliorate physical stress whereas low-relief reefs would likely degrade.
9. Define protective measures, enforcement protocols and their efficacy. Without these, poaching will almost certainly lead to failed restoration efforts.
10. Monitor the performance of restoration reefs over a prolonged time period, which should be no less than 10 years for oyster reefs, to ensure accountability.
11. Manage adaptively, as our ability to predict ecological outcomes is limited and alterations to restoration plans will almost assuredly be necessary.
Conflict of Interest Statement
The authors declare that the research was conducted in the absence of any commercial or financial relationships that could be construed as a potential conflict of interest.
Acknowledgments
This project was funded by grants to RL from the U.S. Army Corps of Engineers, Norfolk District and the National Oceanic and Atmospheric Administration grant NA13NMF4570205. We thank R. Carnegie for providing information on oyster disease in the Lynnhaven. We are extremely grateful to E. North and J. A. Drew for numerous suggested revisions to the manuscript, which improved the manuscript significantly. This is contribution # 3485 from the Virginia Institute of Marine Science. SJS was supported in part by U.S. National Science Foundation Grant DMS-1313418, and RL by DMS-1313093. The City of Virginia beach provided funding for broodstock enhancement.
Supplementary Material
The Supplementary Material for this article can be found online at: https://www.frontiersin.org/article/10.3389/fmars.2015.00065
References
Abbe, G. R., and Albright, B. W. (2003). An improvement to the determination of meat condition index for the Eastern oyster Crassostrea virginica (Gmelin 1791). J. Shellfish Res. 22, 3747–3752.
Abbe, G. R., and Sanders, J. G. (1988). Rapid decline in oyster condition in the Patuxent River, Maryland. J. Shellfish Res. 7, 57–59.
Airoldi, L., and Beck, M. W. (2007). Loss, status and trends for coastal marine habitats of Europe. Oceanogr. Mar. Biol. Ann. Rev. 45, 345–405. doi: 10.1201/9781420050943.ch7
Allison, G. W., Gaines, S. D., Lubchenco, J., and Possingham, H. P. (2003). Ensuring persistence of marine reserves: catastrophes require adopting an insurance factor. Ecol. Appl. 13(Suppl.), S8–S24. doi: 10.1890/1051-0761(2003)013[0008:EPOMRC]2.0.CO;2
Almany, G. R., Connolly, S. R., Heath, D. D., Hogan, J. D., Jones, G. P., McCook, L. J., et al. (2009). Connectivity, biodiversity conservation and the design of marine reserve networks for coral reefs. Coral Reefs 28, 339–351. doi: 10.1007/s00338-009-0484-x
Andrews, J. D., and Ray, S. M. (1988). Epizootiology of the disease caused by the oyster pathogen Perkinsus marinus and its effects on the oyster industry. Amer. Fish Soc. Spec. Publ. 18, 47–63.
Barnes, T. K., Volety, A. K., Chartier, K., Mazzotti, F. J., and Pearlstine, L. (2007). A habitat suitability index model for the Eastern oyster (Crassostrea virginica), a tool for restoration of the Caloosahatchee Estuary, Florida. J. Shellfish Res. 26, 949–959. doi: 10.2983/0730-8000(2007)26[949:AHSIMF]2.0.CO;2
Baylor, J. B. (1893). Rough Sketch of Oyster Rocks, Princess Anne Co., Broad Bay, Rainey's Pond, Linkhorn Bay, Long Creek, Lynnhaven River. Richmond, VA: Library of Virginia.
Baylor, J. B. (1894). “Princess Anne County. Oyster Records,” in Distances and Bearings of Numbered Corners of Public Grounds from Shore Stations, Depth of Water, Descriptions of Shore Stations, &c. (Richmond, VA: Library of Virginia).
Baylor, J. B. (1895). Survey of Oyster Grounds in Virginia: Report of J.B. Baylor to the Governor of Virginia. Baptist and Saunders, Richmond, VA.
Beck, M. B., Brumbaugh, R. D., Airoldi, L., Carranza, A., Coen, L. D., Crawford, C., et al. (2009). Shellfish Reefs at Risk: A Global Analysis of Problems and Solutions. Arlington, VA: Nature Conservancy.
Becker, B., Levin, L., Fodrie, F., and McMillan, P. (2007). Complex larval connectivity patterns among marine invertebrate populations. Proc. Natl. Acad. Sci. U.S.A. 104, 3267–3272. doi: 10.1073/pnas.0611651104
Beniash, E., Ivanina, A., Lieb, N. S., Kurochkin, I., and Sokolova, I. M. (2010). Elevated level of carbon dioxide affects metabolism and shell formation in oysters Crassostrea virginica. Mar. Ecol. Prog. Ser. 419, 95–108. doi: 10.3354/meps08841
Berman, M., Killeen, S., Mann, R., and Wesson, J. (2002). Virginia Oyster Reef Restoration Map Atlas. Center for Coastal Resources Management, Virginia Institute of Marine Science, The College of William and Mary, Gloucester Point, VA.
Beseres Pollack, J., Cleveland, A., Palmer, T. A., Reisinger, A. S., and Montagna, P. A. (2012). A restoration suitability index model for the eastern oyster (Crassostrea virginica) in the Mission-Aransas Estuary, TX, USA. PLoS ONE 7:e40839. doi: 10.1371/journal.pone.0040839
Bode, M., Bode, L., and Armsworth, P. (2006). Larval dispersal reveals regional sources and sinks in the Great Barrier Reef. Mar. Ecol. Prog. Ser. 308, 17–25. doi: 10.3354/meps308017
Botsford, L. W., White, J. W., Coffroth, M. A., Paris, C. B., Planes, S., Shearer, T. L., et al. (2009). Connectivity and resilience of coral reef metapopulations in marine protected areas: matching empirical efforts to predictive needs. Coral Reefs 28, 327–337. doi: 10.1007/s00338-009-0466-z
Brumbaugh, R. D., Beck, M. W., Coen, L. D., Craig, L., and Hicks, P. (2006). A Practitioners' Guide to the Design and Monitoring of Shellfish Restoration Projects: an Ecosystem Services Approach. Arlington, VA: The Nature Conservancy.
Brumbaugh, R. D., and Coen, L. D. (2009). Contemporary approaches for small-scale oyster reef restoration to address substrate versus recruitment limitation: a review and comments relevant for the Olympia oyster, Ostrea lurida Carpenter 1864. J. Shellfish Res. 28, 147–161. doi: 10.2983/035.028.0105
Brumbaugh, R. D., Sorabella, L. A., Garcia, C. O., Goldsborough, W. J., and Wesson, J. A. (2000). Making a case for community-based oyster restoration: an example from Hampton Roads, Virginia, U.S.A. J. Shellfish Res. 19, 467–472.
Burge, C. A., Eakin, C. M., Friedman, C. S., Froelich, B., Hershberger, P. K., Hofmann, E. E., et al. (2014). Climate change influences on marine infectious diseases: implications for management and society. Ann. Rev. Mar. Sci. 6, 249–277. doi: 10.1146/annurev-marine-010213-135029
Burke, R. P. (2010). Alternative Substrates as a Native Oyster (Crassostrea virginica) Reef Restoration Strategy in Chesapeake Bay. PhD dissertation, The College of William & Mary, Gloucester Point, VA.
Burke, R. P., and Lipcius, R. N. (2010). Analysis of Annual Oyster Spatfall in the Tributaries of Chesapeake Bay, Virginia. Norfolk District, VA: VIMS Final Report to US Army Corps of Engineers.
Cake, E. W. (1983). Habitat Suitability Index Models: Gulf of Mexico American Oyster. Washington, DC: US Dept Int Fish Wildl Serv FWS/OBS-82/10.57.
Carnegie, R. B., and Burreson, E. M. (2009). Status of the Major Oyster Diseases in Virginia 2006-2008, a Summary of the Annual Oyster Disease Monitoring Program. Rept. Oyster Dis. Monitor. Prog., Virginia Institute of Marine Science, The College of William and Mary, Gloucester Point, VA.
Carnegie, R. B., and Burreson, E. M. (2011). Declining impact of an introduced pathogen: Haplosporidium nelsoni in the oyster Crassostrea virginica in Chesapeake Bay. Mar. Ecol. Prog. Ser. 432, 1–15. doi: 10.3354/meps09221
Carson, H. S., Cook, G. S., López-Duarte, P. C., and Levin, L. A. (2011). Evaluating the importance of demographic connectivity in a marine metapopulation. Ecology 92, 1972–1984. doi: 10.1890/11-0488.1
Chipman, W. A. Jr. (1948). Conditions Affecting Shellfish Production in Lynnhaven Bay, Virginia, and the Possibilities of Improving them by Increasing Tidal Flow. US Fish and Wildlife Service, Special Scientific Report No. 61.
Coen, L. D., Brumbaugh, R. D., Bushek, D., Grizzle, R., Luckenbach, M. W., Posey, M. H., et al. (2007). AS WE SEE IT: ecosystem services related to oyster restoration. Mar. Ecol. Prog. Ser. 341, 304–307. doi: 10.3354/meps341303
Colden, A. M., and Lipcius, R. N. (2015). Lethal and sublethal effects of sediment burial on the eastern oyster, Crassostrea virginica. Mar. Ecol. Prog. Ser. 527, 105–117. doi: 10.3354/meps11244
Commission of Fisheries of Virginia. (1931). Thirty-third Annual Report of the Commission of Fisheries of Virginia for the Fiscal Year Ending June 30, 1931. Richmond, VA.
Cowen, R., Lwiza, K., Sponaugle, S., Paris, C., and Olson, D. (2000). Connectivity of marine populations: open or closed? Science 287, 857–859. doi: 10.1126/science.287.5454.857
Cowen, R., and Sponaugle, S. (2009). Larval dispersal and marine population connectivity. Ann. Rev. Mar. Sci. 1, 443–466. doi: 10.1146/annurev.marine.010908.163757
Crowder, L., Lyman, S., Figueira, W., and Priddy, J. (2000). Source-sink population dynamics and the problem of siting marine reserves. Bull. Mar. Sci. 66, 799–820.
Davenport, J., and Chen, X. (1987). A comparison of methods for the assessment of condition in the mussel (Mytilus edilus L.). J. Moll. Stud. 53, 293–297. doi: 10.1093/mollus/53.3.293
Dickinson, G. H., Ivanina, A. V., Matoo, O. B., Pörtner, H. O., Lannig, G., Bock, C., et al. (2012). Interactive effects of salinity and elevated CO2 levels on juvenile Eastern oysters, Crassostrea virginica. J. Exp. Biol. 215, 29–43. doi: 10.1242/jeb.061481
Encomio, V. G., Stickler, S. M., Allen, S. K. Jr., and Chu, F.-L. (2005). Performance of “natural Dermo-resistant” oyster stocks—survival, disease, growth, condition and energy reserves. J. Shellfish Res. 24, 143–155.
Figueira, W., and Crowder, L. (2006). Defining patch contribution in source-sink metapopulations: the importance of including dispersal and its relevance to marine systems. Pop Ecol. 48, 215–224. doi: 10.1007/s10144-006-0265-0
Fogarty, M., and Botsford, L. (2006). “Metapopulation dynamics of coastal decapods,” in Marine Metapopulations, eds J. P. Kritzer and P. F. Sale (Amsterdam: Elsevier-Academic Press), 271–320
Galtsoff, P. S. (1964). The American Oyster. Washington, DC: U.S. Fish and Wildlife Service Fishery Bulletin 64.
Gazeau, F., Parker, L. M., Comeau, S., Gattuso, J.-P., O'Connor, W. A., Martin, S., et al. (2013). Impacts of ocean acidification on marine shelled molluscs. Mar. Biol. 160, 2207–2245. doi: 10.1007/s00227-013-2219-3
Grabowski, J. H., and Peterson, C. H. (2007). “Restoring oyster reefs to recover ecosystem services,” in Ecosystem Engineers: Concepts, Theory and Applications, eds K. Cuddington, J. E. Byers, W. G.Wilson, and A. Hastings (Amsterdam: Elsevier-Academic Press), 281–298.
Green, A. L., Fernandes, L., Almany, G., Abesamis, R., McLeod, E., Aliñio, P. M., et al. (2014). Designing marine reserves for fisheries management, biodiversity conservation, and climate change adaptation. Coast. Manage. 42, 143–159. doi: 10.1080/08920753.2014.877763
Hastings, A., and Botsford, L. W. (2006). Persistence of spatial populations depends on returning home. Proc. Natl. Acad. Sci. U.S.A. 103, 6067–6072. doi: 10.1073/pnas.0506651103
Hickman, R. W., and Illingworth, J. (1980). Condition cycle of the green-lipped mussel Perna canaliculus in New Zealand. Mar. Biol. 60, 27–38. doi: 10.1007/BF00395603
Incze, L., Xue, H., Wolff, N., Xu, D., Wilson, C., Steneck, R., et al. (2010). Connectivity of lobster (Homarus americanus) populations in the coastal Gulf of Maine: Part II Coupled biophysical dynamics. Fisheries Oceanogr. 19, 1–20 doi: 10.1111/j.1365-2419.2009.00522.x
Ingersoll, E. (1881). “The oyster-industry,” in The History and Present Condition of the Fishery Industries (Washington, DC: US Comm Fish Fisheries, Government Printing Office), 254.
Jackson, J. B. C., Kirby, M. X., Berger, W. H., Bjorndal, K. A., Botsford, L. W., Bourque, B. J., et al. (2001). Historical overfishing and the recent collapse of coastal ecosystems. Science 293, 629–637. doi: 10.1126/science.1059199
Jordan-Cooley, W. C., Lipcius, R. N., Shaw, L. B., Shen, J., and Shi, J. (2011). Bistability in a differential equation model of oyster population and sediment volume. J. Theor. Biol. 289, 1–11. doi: 10.1016/j.jtbi.2011.08.013
Kennedy, V. S. (1996). “Biology of larvae and spat,” in The Eastern Oyster, Crassostrea virginica, eds V. S. Kennedy, R. I. E. Newell, and A. F. Eble (College Park, MD: Maryland Sea Grant), 371–421.
Kennedy, V. S., Breitburg, D. L., Christman, M. C., Luckenbach, M. W., Paynter, K., Kramer, J., et al. (2011). Lessons learned from efforts to restore oyster populations in Maryland and Virginia, 1990 to 2007. J. Shellfish Res. 30, 719–731. doi: 10.2983/035.030.0312
Kininmonth, S., Begerb, M., Bode, M., Peterson, E., Adams, V. M., Dorfman, D., et al. (2011). Dispersal connectivity and reserve selection for marine conservation. Ecol. Model 222, 1272–1282 doi: 10.1016/j.ecolmodel.2011.01.012
Kirby, M. X. (2004). Fishing down the coast: historical expansion and collapse of oyster fisheries along continental margins. Proc Natl. Acad. Sci. U.S.A. 101, 13096–13099 doi: 10.1073/pnas.0405150101
Krantz, G. E., and Jordan, S. J. (1996). Management alternatives for protecting Crassostrea virginica fisheries in Perkinsus marinus enzootic and epizootic areas. J. Shellfish Res. 15, 167–176.
Kurihara, H., Kato, S., and Ishimatsu, A. (2007). Effects of increased seawater pCO2 on early development of the oyster Crassostrea gigas. Aquat. Biol. 1, 91–98 doi: 10.3354/ab00009
Lenihan, H. S. (1999). Physical–biological coupling on oyster reefs: how habitat structure influences individual performance. Ecol. Monogr. 69, 251–275.
Lenihan, H. S., Micheli, F., Shelton, S. W., and Peterson, C. H. (1999). The influence of multiple environmental stressors on susceptibility to parasites: an experimental determination with oysters. Limnol. Oceanogr. 44, 910–924 doi: 10.4319/lo.1999.44.3_part_2.0910
Lenihan, H. S., and Peterson, C. H. (1998). How habitat degradation through fishery disturbance enhances impacts of hypoxia on oyster reefs. Ecol. Appl. 11, 128–140. doi: 10.1890/1051-0761(1998)008[0128:HHDTFD]2.0.CO;2
Lipcius, R. N., and Burke, R. P. (2006). Abundance, Biomass and Size Structure of Eastern Oyster and Hooked Mussel on a Modular Artificial Reef in the Rappahannock River, Chesapeake Bay. Spec. Rept. Appl. Mar. Sci. Ocean Eng. No. 390, Virginia Institute of Marine Science, The College of William and Mary, Gloucester Point, VA.
Lipcius, R. N., Crowder, L. B., and Morgan, L. (2005). “Metapopulation structure and marine reserves,” in Marine Conservation Biology, eds E. Norse and L. B. Crowder (Washington, DC: Island Press), 328–345.
Lipcius, R. N., Eggleston, D. B., Schreiber, S. J., Seitz, R. D., Shen, J., Sisson, M., et al. (2008). Importance of metapopulation connectivity to restocking and restoration of marine species. Rev. Fish Sci. 16, 101–110. doi: 10.1080/10641260701812574
Lipcius, R. N., and Ralph, G. M. (2011). “Evidence of source-sink dynamics in marine and estuarine species,” in Sources, Sinks, and Sustainability, eds J. Liu, V. Hull, A. T. Morzillo, and J. A. Wiens (New York, NY: Cambridge University Press), 361–381.
Lipcius, R. N., Stockhausen, W., and Eggleston, D. B. (2001). Marine reserves for Caribbean spiny lobster: empirical evaluation and theoretical metapopulation dynamics. Mar. Freshwater Res. 52, 1589–1598. doi: 10.1071/MF01193
Lotze, H. K., Lenihan, H. S., Bourque, B. J., Bradbury, R. H., Cooke, R. G., Kay, M. C., et al. (2006). Depletion, degradation, and recovery potential of estuaries and coastal seas. Science 312, 1806–1809. doi: 10.1126/science.1128035
Lotze, H. K., and Worm, B. (2009). Historical baselines for large marine animals. Trends Ecol. Evol. 24, 254–262. doi: 10.1016/j.tree.2008.12.004
Lucas, A., and Beninger, P. G. (1985). The use of physiological condition index in marine bivalve aquaculture. Aquaculture 44, 187–200. doi: 10.1016/0044-8486(85)90243-1
Luckenbach, M. W, Ross, P. G. (2009). Recruitment, Substrate Quality and Standing Stock Monitoring in Support of NOAA-ACOE Oyster Restoration Projects in the Great Wicomico, Rappahannock, Piankatank and Lynnhaven River Basins 2004-2006. Gloucester Point, VA: VIMS ESL GIS-based Summary of Native Oyster Monitoring, Grant #NA06NMF4570303
Mann, R., Burreson, E. M., and Baker, P. K. (1991). The decline of the Virginia oyster fishery in Chesapeake Bay: considerations for introduction of a non-endemic species, Crassostrea gigas (Thunberg, 1793). J. Shellfish Res. 10, 379–388.
Mann, R., and Powell, E. N. (2007). Why oyster restoration goals in the Chesapeake Bay are not and probably cannot be achieved. J. Shellfish Res. 26, 1–13. doi: 10.2983/0730-8000(2007)26[905:WORGIT]2.0.CO;2
McCormick-Ray, J. (2005). Historical oyster reef connections to Chesapeake Bay—a framework for consideration. Est. Coast Shelf Sci. 64, 119–134. doi: 10.1016/j.ecss.2005.02.011
McGilliard, C. R., Punt, A. E., and Hilborn, R. (2011). Spatial structure induced by marine reserves shapes population responses to catastrophes in mathematical models. Ecol. Appl. 21, 1399–1409. doi: 10.1890/10-0001.1
Miller, A. W., Reynolds, A. C., Sobrino, C., and Riedel, G. F. (2009). Shellfish face uncertain future in high CO2 world: influence of acidification on oyster larvae calcification and growth in estuaries. PLoS ONE 4:e5661. doi: 10.1371/journal.pone.0005661
Miyake, Y., Kimura, S., Kawamura, T., Horii, T., Kurogi, H., and Kitagawaet, T. (2009). Simulating larval dispersal processes for abalone using a coupled particle-tracking and hydrodynamic model: implications for refugium design. Mar. Ecol. Prog. Ser. 207, 89–96. doi: 10.3354/meps08086
Munroe, D. M., Hofmann, E. E., Powell, E. N., and Klinck, J. M. (2013). How do shellfisheries influence genetic connectivity in metapopulations? A modeling study examining the role of lower size limits in oyster fisheries. Can. J. Fish. Aquat. Sci. 70, 1813–1828. doi: 10.1139/cjfas-2013-0089
National Research Council. (2004). Non-native Oysters in the Chesapeake Bay. Washington, DC: National Academies Press.
North, E. W., Schlag, Z., Hood, R. R., Li, M., Zhong, L., Gross, T., et al. (2008). Vertical swimming behavior influences the dispersal of simulated oyster larvae in a coupled particle-tracking and hydrodynamic model of Chesapeake Bay. Mar. Ecol. Prog. Ser. 359, 99–115. doi: 10.3354/meps07317
Ogburn, D. M., White, I., and McPhee, D. P. (2007). The disappearance of oyster reefs from Eastern Australian estuaries—impact of colonial settlement or mudworm invasion? Coast. Mgt. 35, 271–287. doi: 10.1080/08920750601169618
Peterson, C. H., Grabowski, J. H., and Powers, S. P. (2003). Estimated enhancement of fish production resulting from restoring oyster reef habitat: quantitative valuation. Mar. Ecol. Prog. Ser. 264, 251–266. doi: 10.3354/meps264249
Powell, E. N., Klinck, J. M., Guo, X., Ford, S. E., and Bushek, D. (2011). The potential for oysters, Crassostrea virginica, to develop resistance to dermo disease in the field: evaluation using a gene-based population dynamics model. J. Shellfish Res. 30, 685–712. doi: 10.2983/035.030.0310
Powers, S. P., Peterson, C. H., Grabowski, J. H., and Lenihan, H. S. (2009). Success of constructed oyster reefs in no-harvest sanctuaries: implications for restoration. Mar. Ecol. Prog. Ser. 389, 159–170. doi: 10.3354/meps08164
Pulliam, H. (1988). Sources, sinks, and population regulation. Am. Nat. 132, 652–661. doi: 10.1086/284880
Rainer, J. S., and Mann, R. (1992). A comparison of methods for calculating condition index in Eastern oysters, Crassostrea virginica (Gmelin, 1791). J. Shellfish Res. 11, 53–56.
Ray, S. M. (1954). Studies on the occurrence of Dermocystidium marinum in young oysters. College Station, TX: Texas A&M Research Foundation.
Rick, T. C., Ogburn, M. B., Kramer, M. A., McCanty, S. T., Reeder-Myers, L. A., Miller, H. M., et al. (2015). Archaeology, taphonomy, and historical ecology of Chesapeake Bay blue crabs (Callinectes sapidus). J. Archaeol. Sci. 55, 42–54. doi: 10.1016/j.jas.2014.12.016
Roberts, C. (1997). Connectivity and management of Caribbean coral reefs. Science 278, 1454–1457. doi: 10.1126/science.278.5342.1454
Rothschild, B. J., Ault, J. S., Goulletquer, P., and Heral, M. (1994). Decline of the Chesapeake Bay oyster population: a century of habitat destruction and overfishing. Mar. Ecol. Prog. Ser. 111, 29–39. doi: 10.3354/meps111029
Ruesink, J. L., Lenihan, H. S., Trimble, A. C., Heiman, K. W., Micheli, F., Byers, J. E., et al. (2005). Introduction of non-native oysters: ecosystem effects and restoration implications. Ann. Rev. Ecol. Evol. Syst. 36, 643–689. doi: 10.1146/annurev.ecolsys.36.102003.152638
Schulte, D. M., Burke, R. P., and Lipcius, R. N. (2009). Unprecedented restoration of a native oyster metapopulation. Science 325, 1124–1128. doi: 10.1126/science.1176516
Schulte, D. M., Cleland, M., and Groth, K. (2006). Final Decision Document Amendment, Section 704B as Amended, Chesapeake Bay Oyster Recovery Phase IV. Norfolk, VA: District, United States Army Corps of Engineers.
Seitz, R. D., Lipcius, R. N., Hines, A. H., and Eggleston, D. B. (2001). Density-dependent predation, habitat variation, and the persistence of marine bivalve prey. Ecology 82, 2435–2451. doi: 10.1890/0012-9658(2001)082[2435:DDPHVA]2.0.CO;2
Shaw, B. L., and Battle, H. I. (1957). The gross and microscopic anatomy of the digestive tract of the oyster Crassostrea virginica (Gmelin). Can. J. Zool. 35, 325–347. doi: 10.1139/z57-026
Shen, J., Wang, H., Sisson, M., and Gong, W. (2006). Storm tide simulation in the Chesapeake Bay using an unstructured grid model. Est. Coast Shelf Sci. 68, 1–16. doi: 10.1016/j.ecss.2005.12.018
Simons, A. M. (2011). Modes of response to environmental change and the elusive empirical evidence for bet hedging. Proc. R. Soc. Lond. B 278, 1601–1609. doi: 10.1098/rspb.2011.0176
Sisson, M., Wang, H., Li, Y., Shen, J., Kuo, A., Gong, W., et al. (2010). Development of Hydrodynamic and Water Quality Models for the Lynnhaven River System. Spec. Rept. Appl. Mar. Sci. Ocean Eng. No. 408, Virginia Institute of Marine Science, The College of William and Mary, Gloucester Point, VA.
Soniat, T. M., and Brody, M. S. (1988). Field validation of a habitat suitability index model for the American oyster. Estuaries 11, 87–95. doi: 10.2307/1351995
Starke, A., Levinton, J. S., and Doall, M. (2011). Restoration of Crassostrea virginica (Gmelin) to the Hudson River, USA: a spatiotemporal modeling approach. J. Shellfish Res. 30, 671–684. doi: 10.2983/035.030.0309
Taylor, J., and Bushek, D. (2008). Intertidal oyster reefs can persist and function in a temperate North American Atlantic estuary. Mar. Ecol. Prog. Ser. 361, 301–306. doi: 10.3354/meps07429
Treml, E. A., Halpin, P. N., Urban, D. L., and Pratson, L. (2008). Modeling population connectivity by ocean currents, a graph-theoretic approach for marine conservation. Landscape Ecol. 23, 19–36. doi: 10.1007/s10980-007-9138-y
United States Army Corps of Engineers. (2009). Final Programmatic Environmental Impact Statement for Oyster Restoration in Chesapeake Bay Including the Use of a Native and/or Nonnative Oyster. Norfolk, VA: The Corps of Engineers.
Waldbusser, G. G., Steenson, R. A., and Green, M. A. (2011a). Oyster shell dissolution rates in estuarine waters: effects of pH and shell legacy. J. Shellfish Res. 30, 659–669. doi: 10.2983/035.030.0308
Waldbusser, G. G., Voigt, E. P., Bergschneider, H., Green, M. A., and Newell, R. I. E. (2011b). Biocalcification in the Eastern oyster (Crassostrea virginica) in relation to long-term trends in Chesapeake Bay pH. Estuaries Coast 34, 221–231. doi: 10.1007/s12237-010-9307-0
Watson, S., Southgate, P. C., Tyler, P. A., and Peck, L. S. (2009). Early larval development of the Sydney rock oyster Saccostrea glomerata under near-future predictions of CO2-driven ocean acidification. J. Shellfish Res. 28, 431–437. doi: 10.2983/035.028.0302
White, J. W., Botsford, L. W., Hastings, A., and Largier, J. L. (2010). population persistence in marine reserve networks: incorporating spatial heterogeneities in larval dispersal. Mar. Ecol. Prog. Ser. 398, 49–67. doi: 10.3354/meps08327
Wilberg, M. J., Livings, M. E., Barkman, J. S., Morris, B. T., and Robinson, J. M. (2011). Overfishing, disease, habitat loss, and potential extirpation of oysters in upper Chesapeake Bay. Mar. Ecol. Prog. Ser. 436, 131–144. doi: 10.3354/meps09161
Wilberg, M. J., Wiedenmann, J. R., and Robinson, J. M. (2013). Sustainable exploitation and management of autogenic ecosystem engineers: application to oysters in Chesapeake Bay. Ecol. Appl. 23, 766–776. doi: 10.1890/12-0563.1
Wing, S., Gibbs, M., and Lamare, M. (2003). Reproductive sources and sinks within a sea urchin, Evechinus chloroticus, population of a New Zealand fjord. Mar. Ecol. Prog. Ser. 248, 109–123. doi: 10.3354/meps248109
Woods, H., Hargis, W. J. Jr., Hershner, C. H., and Mason, P. (2005). Disappearance of the natural emergent 3-dimensional oyster reef system of the James River, Virginia, 1871–1948. J. Shellfish Res. 24, 139–142. doi: 10.2983/0730-8000(2005)24[139:DOTNED]2.0.CO;2
Keywords: oyster reef restoration, eastern oyster, Crassostrea virginica, metapopulation dynamics, disease resistance, population connectivity
Citation: Lipcius RN, Burke RP, McCulloch DN, Schreiber SJ, Schulte DM, Seitz RD and Shen J (2015) Overcoming restoration paradigms: value of the historical record and metapopulation dynamics in native oyster restoration. Front. Mar. Sci. 2:65. doi: 10.3389/fmars.2015.00065
Received: 02 May 2015; Accepted: 24 August 2015;
Published: 08 September 2015.
Edited by:
Trevor John Willis, University of Portsmouth, UKReviewed by:
Joshua Adam Drew, Columbia University, USAElizabeth North, University of Maryland Center for Environmental Science, USA
Copyright © 2015 Lipcius, Burke, McCulloch, Schreiber, Schulte, Seitz and Shen. This is an open-access article distributed under the terms of the Creative Commons Attribution License (CC BY). The use, distribution or reproduction in other forums is permitted, provided the original author(s) or licensor are credited and that the original publication in this journal is cited, in accordance with accepted academic practice. No use, distribution or reproduction is permitted which does not comply with these terms.
*Correspondence: Romuald N. Lipcius, Virginia Institute of Marine Science, College of William & Mary, PO Box 1346, Gloucester Point, VA 23062, USA, rom@vims.edu