Microbially-Mediated Fluorescent Organic Matter Transformations in the Deep Ocean. Do the Chemical Precursors Matter?
 Fran L. Aparicio1*
  Mar Nieto-Cid2
  Encarna Borrull1 Estela Romero1,3
  Colin A. Stedmon4
  Maria M. Sala1
  Josep M. Gasol1 Aida F. Ríos2 Cèlia Marrasé1
- 1Institut de Ciències del Mar-CSIC, Barcelona, Spain
- 2Instituto de Investigaciones Marinas-CSIC, Vigo, Spain
- 3Metis UMR 7619, Université Pierre et Marie Curie, Paris, France
- 4Section for Marine Ecology and Oceanography, National Institute for Aquatic Resources, Technical University of Denmark, Charlottenlund, Denmark
The refractory nature of marine dissolved organic matter (DOM) increases while it travels from surface waters to the deep ocean. This resistant fraction is in part composed of fluorescent humic-like material, which is relatively difficult to metabolize by deep water prokaryotes, and it can also be generated by microbial activity. It has been recently argued that microbial production of new fluorescent DOM (FDOM) requires the presence of humic precursors in the surrounding environment. In order to experimentally test how the chemical quality of the available organic compounds influences the production of new FDOM, three experiments were performed with bathypelagic Atlantic waters. Microbial communities were incubated in three treatments which differed in the quality of the organic compounds added: (i) glucose and acetate; (ii) glucose, acetate, essential amino acids, and humic acids; and (iii) humic acids alone. The response of the prokaryotes and the production of FDOM were simultaneously monitored. Prokaryotic abundance was highest in treatments where labile compounds were added. The rate of humic-like fluorescence production, scaled to prokaryotic abundance, varied depending on the quality of the additions. The precursor compounds affected the generation of new humic-like FDOM, and the cell-specific production of this material was higher in the incubations amended with humic precursors. Furthermore, we observed that the protein-like fluorescence decreased only when fresh amino acids were added. These findings contribute to the understanding of FDOM variability in deep waters and provide valuable information for studies where fluorescent compounds are used in order to track water masses and/or microbial processes.
Introduction
An important issue to be considered when exploring the role of the ocean in carbon sequestration is the biogeochemical fate of the organic matter. Conventionally, it is known that the biological and solubility pumps combined are important for the transfer of carbon (C) from the atmosphere to the ocean interior, resulting in the temporary or permanent storage of carbon (Volk and Hoffert, 1985; Honjo et al., 2014; Legendre et al., 2015). The recently introduced concept of the microbial carbon pump (MCP) postulates mechanisms by which dissolved refractory organic matter is produced and accumulated in the ocean through microbial activity, underlying the role that this refractory pool plays in carbon sequestration in marine systems (Jiao et al., 2010).
The mechanisms that produce dissolved organic matter (DOM) are, among others: phytoplankton exudation (Hopkinson et al., 2002; Romera-Castillo et al., 2011; Sarmento et al., 2013), release by viral lysis (Brussaard, 2004; Motegi et al., 2009), sloppy feeding and the solubilisation of particulate organic matter (POM) by bacterial and archaeal hydrolases (Nagata et al., 2000; Sala and Güde, 2004). These various mechanisms condition not only DOM production but also its quality, and consequently its ultimate fate.
The study of DOM in the ocean interior has been in the spotlight for several years. A fraction of this pool, called chromophoric dissolved organic matter (CDOM; Coble, 1996), absorbs light at both ultraviolet (UV) and visible wavelengths. A sub-fraction of this CDOM, the fluorescent DOM (FDOM; Coble, 1996, 2007), fluoresces when irradiated with UV light. In 1961, Weber described a technique to elucidate the main fluorescing groups of compounds, i.e., fluorophores, by varying the excitation and emission wavelengths and constructing a matrix of the resulting intensities (Weber, 1961). This technique generates the so-called fluorescence excitation-emission matrix (EEM) which was first applied by Coble et al. (1990) to characterize marine FDOM. This technique, however, does not permit the quantification of specific molecules. A better understanding of specific molecules has become possible with the recently developed Fourier transform ion cyclotron resonance mass spectrometry (FT-ICR-MS), a methodology that offers novel insights for molecular-level characterization of the complex composition and structure of DOM (Kim et al., 2003; Koch et al., 2005; Koprivnjak et al., 2009; Stubbins et al., 2014; Repeta, 2015). Nevertheless, the most exhaustive analysis that has been performed to date (Hertkorn et al., 2006) could only identify 8% of the molecules composing the DOM pool. These authors combined multidimensional nuclear magnetic resonance (NMR) with FT-ICR-MS on solid phase extracted dissolved organic matter (SPE-DOM), and their results indicate that carboxylic-rich alicyclic molecules (CRAM) are the major component of DOM. Great efforts are being performed in recent years to relate molecular formulas to the optical measurements of DOM in order to associate fluorescent signatures to single molecules (Stubbins et al., 2014; Reader et al., 2015). Nevertheless, the challenge of identifying and revealing the composition of DOM remains still incomplete. With that said, fluorescence spectroscopy methods, being rapid and inexpensive, are convenient for certain studies focused on humic- and protein like compounds that require large coverage, spatial or temporal.
Marine DOM is composed of a large variety of substances owning different turnover rates and residence times. The turnover times of some FDOM components have been estimated to be, on average, higher than the deep ocean water renewal, and thus the fluorescence measurements have been proposed as a proxy to study the cycling of DOM that is resistant at centennial time scales (Catalá et al., 2015). In water masses exhausted in labile or semi-labile fractions of DOM, bacteria could “prime” the recalcitrant compounds decomposition if labile compounds are added to the media (Carlson et al., 2002; Bianchi, 2012). The “priming effect” (PE), bacterial remineralization of unreactive organic carbon substrates when labile sources are available, was described for the first time in soil sciences in 1926 by Löhnis (Löhnis, 1926). The PE has been experimentally observed in a variety of environments and with additions of different carbon compounds: in soils (Kuzyakov, 2002; Fontaine et al., 2004); fresh water ecosystems (De Haan, 1977; Shimp and Pfaender, 1985; Bianchi et al., 2015; Catalán et al., 2015); and also in marine ecosystems, mainly using mesocosm experiments (Carlson et al., 2002; Fonte et al., 2013; Guenet et al., 2014). However, as it was mentioned before, the mechanisms that hinder the complete remineralization of DOM, causing the relative permanence of part of this pool, from months to millennia, are not really well understood.
Despite the several studies conducted during the last years to assess the spatial and temporal variability of DOM quality (Yamashita et al., 2011; Koehler et al., 2012; Gontikaki et al., 2013; Kothawala et al., 2014), little is known about how the reactivity of DOM varies across landscapes (rivers, lakes, estuaries, coastal ocean, deep ocean). Most of these studies have recognized that DOM reactivity is not only inherently linked to its chemical composition, but also depends on ecosystem properties (Dittmar, 2015). A better understanding of microbial FDOM transformations in the deep ocean is required before FDOM can be consistently applied as a water mass tracer or as a proxy for a fraction of the DOM.
Recent studies have found a high correlation between apparent oxygen utilization (AOU) and the generation of humic-like compounds, indicating that humic-DOM in the dark ocean could originate from in situ microbial respiration (Yamashita and Tanoue, 2008; De La Fuente et al., 2014; Jørgensen et al., 2014b), which agrees with the MCP concept proposed by Jiao et al. (2010). Furthermore, Andrew et al. (2013) suggested that the production of humic-like fluorescence signal is favored when terrestrial chemical precursors are present. In order to gain insight into the microbially-mediated FDOM variability, the present study examines how the quality and quantity of the organic substrates influence simultaneously the generation of humic fluorescence signal and the microbial activity. This was carried out by performing incubation experiments using water samples from the deep Atlantic Ocean. These calculations are key to understand the particularities of deep waters C storage and the functioning of the MCP.
Materials and Methods
Sample Collection and Experimental Strategy
We conducted three experiments (DEEP I, DEEP II, and DEEP III) with natural prokaryotic communities from deep waters of the South Atlantic Ocean. Seawater was taken during the FICARAM-15 cruise, carried out from the 20th of March to the 22nd of May 2013, following a track from Punta Arenas (Chile) to Cartagena (Spain). Experiment DEEP I was performed with water taken from station 5 (48° 18′ 18.6″ S; 54° 54′ 35.4″ W) at 4500 m while in experiments DEEP II and DEEP III we used 3000 m water from stations 18 (40° 30′ 0″ S; 48°, 5′ 28″ W) and 53 (17° 50′ 1.21″ S; 31° 38′ 2.4″ W), respectively (Figure 1).
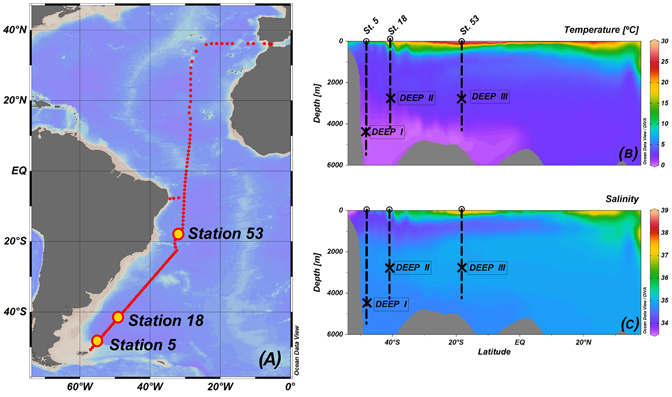
Figure 1. Graphic summary of the XIVth FICARAM cruise: cruise track followed on board the Spanish R/V Hespérides (A), contour plot of temperature expressed in °C (B), and contour plot of salinity (C). Panels include information about the sampling station and depths for each experiment. Ocean data View is used for mapping (Schlitzer, 2015).
In each experiment, sample filtration through 0.6 μm pore-size polycarbonate filters started within 20 min after collection. Then, the water was distributed into four 20 L fluorinated polyethylene carboys. The first container was kept as a control (K). Acetate and glucose (both had been found to be very labile compounds with turnover times of hours to days in marine waters (Azam and Hodson, 1981; Ho et al., 2002), were added to the second container (CL). A combination of carbon-based substances was added to the third container (CM). In this case, not only glucose and acetate were added, but also a mixture of compounds of different lability, including terrestrial humic acids and amino acids, which are known to be essential for prokaryotic metabolism, (see Table 1). In the last carboy (CR), Suwannee River humic acids (Ref. 2R101N) provided by the International Humic Substances Society (IHSS) was added. All the organic carbon (OC) substrates were dissolved in 50 mL of Milli-Q water prior to the addition into the carboys. In the case of Suwannee River humic acids, a pH of 12 was needed to favor the dilution, thus we previously added the material in a solution of NaOH and later we compensate the pH adding . All carbon amendments were calculated to result in an approximately 30 μmol C increase in dissolved organic carbon (DOC) concentration. After the additions, the containers were manually shaken and kept 1 h at 4°C before sampling the initial point (t0) in order to assure homogenization. At t0, water from each of the experimental conditions was distributed among 72 acid clean 250 mL glass bottles (18 bottles per treatment). Three glass bottles per experimental condition were harvested at every sampling date, and the three bottles were considered experimental replicates. The experiments were conducted on board in a dark temperature-controlled chamber at 4°C and monitored for a total of 35 days. Intensive samplings were scheduled for days: 0, 5, 10, 15, 25, and 35, where the variables measured were: prokaryotic abundance, FDOM, and CDOM. Furthermore, after day 3 (t3), one bottle of each condition was sampled daily to monitor prokaryote abundances. This subsampled bottle was then considered replicate number 1 in the following intensive sampling.
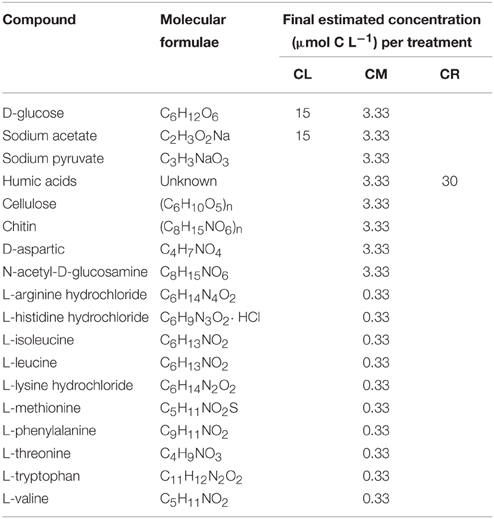
Table 1. A list of the compounds added to each experimental treatment (Sigma-Aldrich Co. LLC.).
Measurements
The ship's rosette was equipped with a SBE11plus (Sea-Bird Electronics) CTD probe, recording, at each station, profiles of temperature, conductivity, and oxygen. Analyses of dissolved inorganic nutrient concentrations, nitrate (NO3), phosphate (PO4), and silicate (SiO2), were done on board by standard segmented flow analyses with colorimetric detection (Hansen and Grasshoff, 1983) using a Skalar Autoanalyser. Precisions were ±0.01 μmol kg−1 NO3, ±0.02 μmol kg−1 PO4, and ±0.01 μmol kg−1 SiO2. DOC samples were collected in 10 mL precombusted (450°C, 24 h) glass ampoules. After acidification with 50 μL of 25% H3PO4 to pH < 2, the ampoules were heat-sealed and stored in the dark at 4°C until examination. Analyses were carried out in a Shimadzu TOC-CSV organic carbon analyser. Three to five injections of 150 μL were performed per replicate. DOC concentration in each replicate was calculated by first subtracting a Milli-Q blank and then dividing by the slope of a daily standard curve made from potassium hydrogen phthalate. The precision of measurements was ±0.7 μmol L−1. All samples were checked against deep Sargasso Sea reference water (2600 m) provided by D. Hansell (U. of Miami).
FDOM was measured using a Perkin Elmer LS55 luminescence spectrometer equipped with a xenon discharge lamp (20 kW/8 μs). A red sensitive R928 photodiode multiplier worked as a reference detector. The running parameters for the instrument were set as follows: scan speed at 250 nm min−1 and slit widths (for excitation and emission wavelengths) at 10 nm, at a constant room temperature of 20°C in a 1 cm quartz fluorescence cell. Excitation-emission matrices were performed by concatenating 21 excitation/emission spectra of the sample, obtained at a constant offset of 10 nm between the excitation and emission wavelengths. The spectra were collected starting from the highest excitation wavelength, to minimize the exposure of the sample to low-wavelength radiation and thereby minimize photodegradation. Following Lawaetz and Stedmon (2009), fluorescence measurements were expressed in Raman Units (R.U.) by normalization to the integrated water Raman scattering band of Milli-Q water freshly generated on board every day. Our results can be compared with quinine sulfate units (QSU) having in account that 1 QSU is equivalent to 86 ± 1 R.U.
To better characterize the dynamics of the FDOM, PARAFAC modeling of the EEM datasets was conducted using the drEEM toolbox (Murphy et al., 2013) in the Matlab® software package. The dataset for PARAFAC modeling was composed of 289 samples collected during the cruise to increase the consistency of the model, 64 of them belonging to the DEEP water experiments. In order to organize the data for the modeling process, regions of no fluorescence or scatter were removed. By doing so, our EEMs ranged from 250 to 450 nm along the excitation axis, and from 350 to 550 nm along the emission axis. The model was run with non-negativity constraints. A series of PARAFAC models were tested with 3–7 components fitted to the data. Split-half validation was used to divide the data into six random halves of equal size and the model run independently on the halves. A four-component PARAFAC model was validated. According to the residual analyses, we could confirm that less than 10% of the fluorescence was left unexplained (subtraction of the modeled from the measured spectra yielded a residual fluorescence an order of magnitude lower than the measured EEMs). The characteristics of the four components of the PARAFAC model are shown in Figure 2. Their excitation and emission maxima are specified in Table 2 and they are associated to components already detected in previous studies. Three out of the four components identified (FIC1, FIC2, and FIC4) are placed in humic-like fluorescence regions and one of them (FIC3) in the protein-like area.
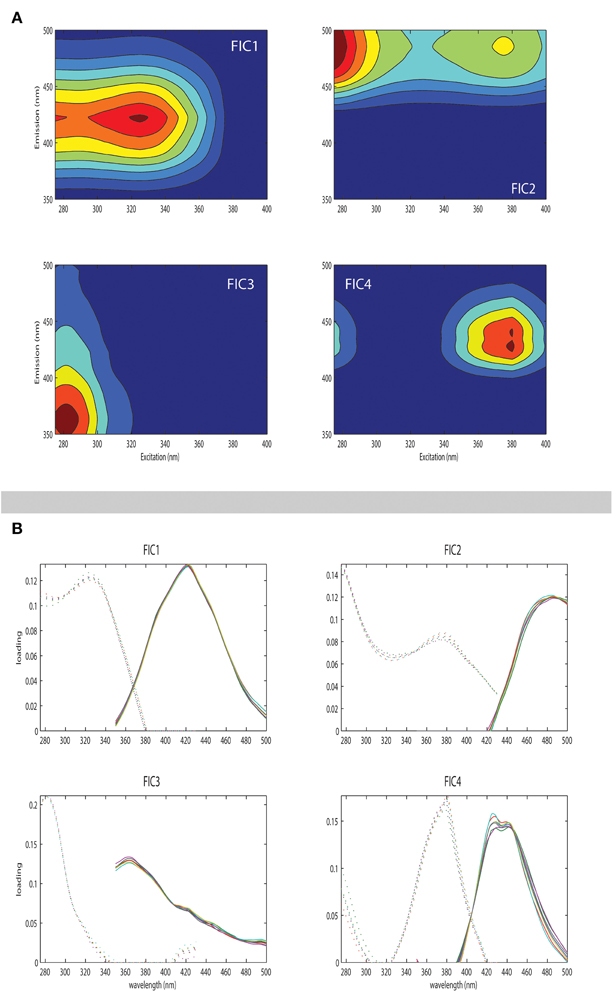
Figure 2. Fluorescence signatures of the four PARAFAC components (FIC1 to FIC4) identified during the experiments are shown in panel (A). Values expressed in R.U. (B) Line plots showing split-half validations in which each component's excitation (left) and emission (right) spectra are estimated from independent halves of the dataset.
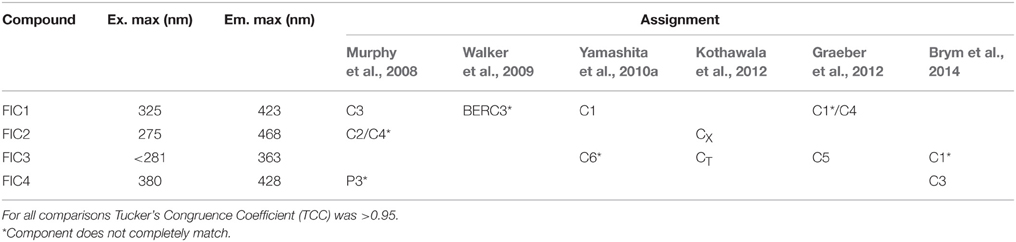
Table 2. Optical characteristics of five components derived from the PARAFAC and their comparison with the results from previous studies available in the OpenFluor database (Murphy et al., 2014).
Heterotrophic prokaryotes were enumerated with a FACSCalibur (Becton Dickinson) flow cytometer equipped with a 15 mW argon-ion laser (488 nm emission) as described by (Gasol and Del Giorgio, 2000). Samples (1.8 mL) were immediately fixed with 1% paraformaldehyde plus 0.05% glutaraldehyde (final concentrations), incubated for 10 min at room temperature, frozen in liquid nitrogen and stored at −80°C. Before analysis, samples were unfrozen, stained with SYBRGreen I (Molecular Probes) at a final concentration of 10 μM and left in the dark for about 15 min. Each sample was then run at low speed (~12 μL min−1) for 2 min with Milli-Q water as a sheath fluid. We added 10 μL per sample of a solution of yellow-green 0.92 μm Polysciences latex beads (106 beads mL−1) as an internal standard. Bacteria were detected by their signature in a plot of side scatter vs. FL1 (green fluorescence). Data analysis was performed with the Paint-A-Gate software (Becton Dickinson).
Statistical Analyses
The software SigmaPlot v11.0 (Systat Software Inc.) was used to perform the statistical analyses applied in this work. Two-way ANOVA was carried out to test if differences between conditions and experiments were significant and t-tests to discriminate if the temporal evolution of the different variables measured in an experiment could be considered significant. For both types of tests, significance was set to p < 0.05.
Results
Initial Conditions
The physical and chemical signatures of the water masses used in each experiment, Antarctic Bottom Water (AABW) in experiment DEEP I, Circumpolar Deep Water (CDW) in experiment DEEP II and North Atlantic Deep Water (NADW) in experiment DEEP III, are listed in Table 3. AABW presented the lowest temperature and highest concentration of nutrients. As shown in Figure 1, the temperature and salinity of the deep Atlantic Ocean increased as latitude decreased, whereas DOC decrease values ranging from 40 to 45 μmol L−1, in agreement with previous observations of deep ocean DOC (Hansell et al., 2009).
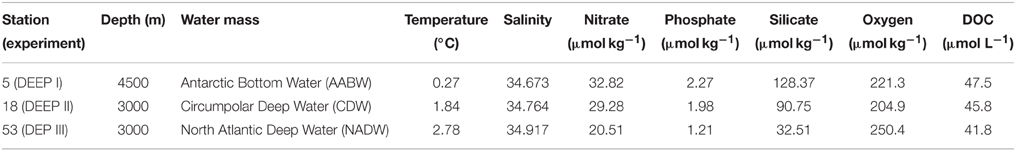
Table 3. Physical and chemical signatures of the water masses used in each of the three DEEP experiments.
A compilation of excitation-emission matrices acquired at the beginning of each experiment (t0) is presented in Figure 3. Clearly different patterns, depending on the treatment, are apparent. When comparing the EEMs for the control (K, no carbon addition, Figures 3A–C) among experiments, the starting points for the different water samples are similar, reflecting the limited range in DOC values between sites. High fluorescence values (>0.01 R.U.) were located around the FIC2 maxima at Ex/Em wavelengths (275 nm/468 nm) while the other humic-like fluorophores (325 nm/423 nm and 380 nm/428 nm) had lower intensities (0.006 − 0.008 R.U.). Signals for protein-like material (281 nm/363 nm) were even lower (~0.004 R.U.). Likewise, the fluorescence intensities for the labile carbon treatments (CL) at t0 (Figures 3D–F) did not reach values higher than 0.01 R.U., indicating that the added compounds did not influence the initial fluorescence signal. As expected, in the mixed substrate treatment (CM, Figures 3G–I), the addition of amino acids and humic acids increased remarkably the initial fluorescence values. The addition of pure amino acids was the main reason behind the high values observed within the protein-like region (~0.03 R.U.), while the addition of Suwannee River natural organic matter caused higher values within the humic-like regions of the EEM, e.g., up to ~0.021 R.U. at the FIC2 maximum area and around 0.018 R.U. for the rest of the humic-like fluorophores. Finally, the initial EEMs of the CR treatments (refractory carbon, Figures 3J–L) also showed a similar trend for the three experiments. The Suwannee River humics additions altered only the visible wavelength emission enhancing humic-like intensities (up to ~0.06 R.U.), a reflection of the terrestrial nature of the added compounds.
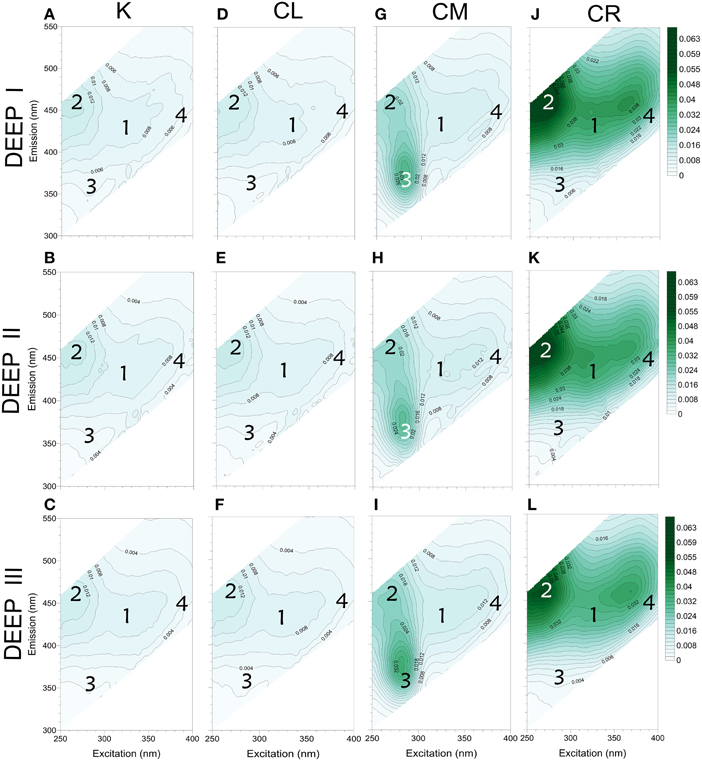
Figure 3. FDOM characterization (EEMs) of all the initial (t0) water samples. From left to right: K conditions for DEEP I (A), DEEP II (B) and DEEP III (C); CL conditions for DEEP I (D), DEEP II (E) and DEEP III (F); CM conditions for DEEP I (G), DEEP II (H) and DEEP III (I); and lastly, CR conditions for DEEP I (J), DEEP II (K) and DEEP III (L). Location of the excitation and emission maxima of the four PARAFAC components identified is indicated by the numbers attributed (1, FIC1 Ex/Em: 325 nm/423 nm; 2, FIC2 Ex/Em: 275 nm/468 nm; 3, FIC3 Ex/Em: 281 nm/363 nm; 4, FIC4 Ex/Em: 380 nm/428 nm). Values expressed in R.U.
Responses to Treatments
Dynamics of the Prokaryotic Community
Prokaryotic abundance increased throughout the first 5 days of the incubation following the same trend in the three experiments (Figure 4). Prokaryotic abundance at t0 was about 8.0·103, 2.3·104, and 1.1·104 cells mL−1 for experiments DEEP I, DEEP II, and DEEP III, respectively. The stationary phase was reached after 10 days of incubation in all experiments. Prokaryote concentration at the end of the exponential growth phase ranged from 6.9·104 to 8.0·104 cells mL−1 in the K treatments, from 7.8·105 to 9.2·105 cells mL−1 in the CL conditions, from 5.8·105 to 6.1·105 cells mL−1 in the CM incubations and from 6.5·104 to 1.3·105 cells mL−1 in the CR conditions. During the first days of experiment the slopes of the curves indicated faster growth rates for the CM treatments than for the rest of them, although the number of cells in the CL treatment reached the highest values at the end of the exponential-growth phase. After t10, the prokaryotic communities in all the experiments entered stationary phase. This lasted until the end of the experimental period.
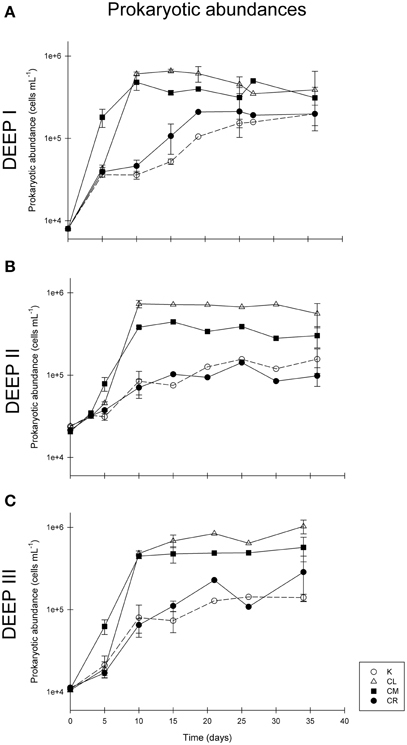
Figure 4. Prokaryotic abundance (in cells mL−1) during experiments DEEP I (A), DEEP II (B), and DEEP III (C). Vertical lines show standard deviations of 3 replicates.
Fluorescence Characterization
To easily visualize the net change in the humic-like and the protein-like fractions of the FDOM during the exponential-growth and stationary phases of the experiments, we subtracted the fluorescence intensities at t0 from those measured at t10 and also the values at t10 from those measured at tfinal. We also divided the resultant values by the number of days each phase lasted. The bar charts in Figure 5 show fluorescence intensity increases/decreases for each humic-like component in each experiment. The resultant fluorescence intensities during the exponential-growth phase and the stationary phase were similar for experiments DEEP II and DEEP III, but DEEP I presented divergent patterns. In DEEP I, FIC1, FIC2, and FIC4 intensities decreased for all treatments during the exponential-growth phase (Figures 5A,D,G). The largest decreases during this phase were observed in the CR conditions followed by the decreases in the CM conditions. On the contrary, we found increases during the same time period in DEEP II and DEEP III, the highest being again detected in the CR and CM conditions, with the exception of the FIC4 signal in the CM and CL conditions in DEEP III, which decreased (Figures 5B,C,E,F,H,I). During the stationary phase of the three experiments the fluorescence signals tended to increase in all treatments. The values of this increase were always the highest for the CR conditions, regardless of the experiment, except in one case, for the FIC4 component.
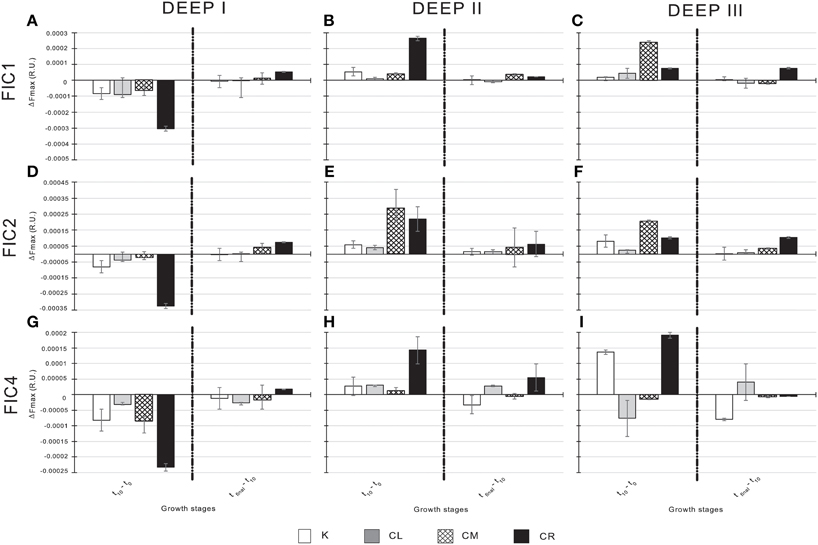
Figure 5. Variations of each humic-like component in the four experimental conditions of the three experiments. From top to bottom: variations of FIC1 for DEEP I (A), DEEP II (B) and DEEP III (C); variations of FIC2 for DEEP I (D), DEEP II (E) and DEEP III (F); and variations of FIC4 for DEEP I (G), DEEP II (H) and DEEP III (I). Exponential-growth and stationary phases are separated in the graphs. Values expressed in R.U.
A different temporal dynamic was observed for protein-like substances, FIC3 (Figure 6). All the experiments showed similar trends in K, CL, and CR treatments. The FIC3 component signal was very low at the beginning of the experiments for the K, CL, and CR treatments, while in the CM condition the added amino acids induced elevated values of protein-like fluorescence (Figure 6). FIC3 intensity coupled to prokaryotic abundance in all treatments except in that amended with protein-like precursors (CM). The decay of FIC3 signal in DEEP II and DEEP III experiments was higher than the decrease detected for this component in DEEP I. We hypothesized that the FIC3 increase in K, CL, and CR is due to bacterial growth while in the CM treatment, the consumption of the added fluorescent protein-like substances overcame FIC3 production. To examine the relative importance of FIC3 consumption with respect to FIC3 generation in CM, we estimated the production in this treatment using an empirical model based on the relationship between FIC3 fluorescence and prokaryotic abundance (Figure 7). The model was constructed with the data pooled from the treatments with no amino acid amendments (K, CL, and CR) and where FIC3 fluorescence increased with time, as prokaryotes grew (Figure 6). Using the equation described by this empirical model (Figure 7; R2 ~ 0.75, N = 41), we have estimated the protein-like fluorescence (eFIC3) due to prokaryotic growth for each sampling day of the CM condition. Comparing these values with the observed FIC3 intensity, we could estimate the fraction of the signal due to the original amino acids amended to this condition (aaFIC3), which decreased with time (Figure 8).
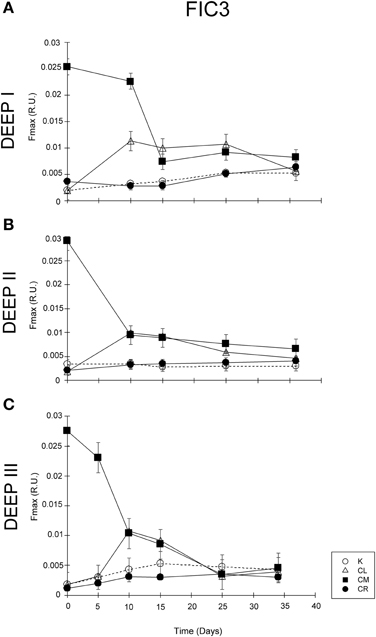
Figure 6. Temporal evolution of FIC3 component in (A) DEEP I, (B) DEEP II, and (C) DEEP III for the four experimental conditions. Values expressed in R.U.
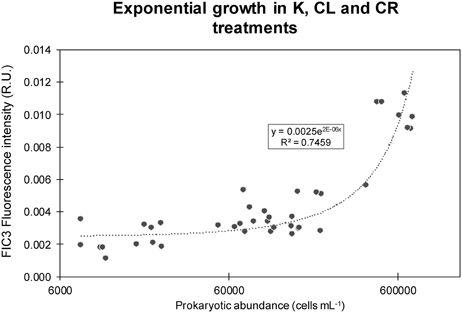
Figure 7. Exponential growth model of FIC3 intensity vs. bacterial abundances for all the K, CL, and CR treatments together. Prokaryotic abundances are expressed in cells mL−1 and fluorescence intensities in R.U.
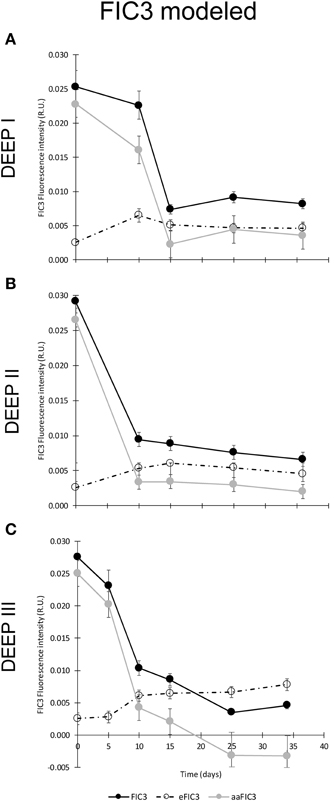
Figure 8. Temporal evolution of: i) observed FIC3 fluorescence intensity (black dots), ii) protein-like fluorescence due to prokaryotic growth estimated following the model described in Figure 7 (eFIC3) (dashed line and empty dots), and iii) fraction of the FIC3 signal due to the amended amino acids (aaFIC3) in CM treatment (gray dots) for experiments DEEP I (A), DEEP II (B), and DEEP III (C). Values expressed in R.U.
Discussion
PARAFAC Component Source Identification
The OpenFluor spectral database (Murphy et al., 2014), was used to identify the different PARAFAC components present in our incubations. Two out of four components (FIC1 and FIC2) were clearly placed in areas traditionally related to humic-like fluorescence (Coble, 1996). FIC1 has recently been reported as a constituent of terrestrial and aquatic fulvic acids. Different studies devoted to track the origin of the organic compounds using their optical properties have found it in coastal areas around the globe, from Florida (Yamashita et al., 2010b; Brym et al., 2014) to Australia (Cawley et al., 2012), including Arctic rivers estuaries (Walker et al., 2013), the Bay of Liverpool (Yamashita et al., 2011), and even the ballast water of different commercial ships (Murphy et al., 2006). The fluorescent intensity of FIC2 is very similar to the traditional peak-A (Coble, 1996) a humic-like material found in rivers and sensitive to photodegradation (Søndergaard et al., 2003; Stedmon et al., 2007; Walker et al., 2009; Lapierre and del Giorgio, 2014). The FIC3 component showed characteristics of tryptophan-like fluorescence and was similar to other previously reported PARAFAC components, which have been associated to tryptophan-like, protein-bound and free amino acids (Yamashita and Tanoue, 2003; Stedmon and Markager, 2005b; Murphy et al., 2008; Kothawala et al., 2012; Kowalczuk et al., 2013). The spectral characteristics of FIC4 have not been traditionally defined (Coble, 1996) but it occupies a region very close to those of the humic-like substances. Other studies that have found this component, mainly in the watershed of tropical rivers (Yamashita et al., 2010a) and its estuaries (Brym et al., 2014), have assigned it to a microbial reduced quinone-like substance (Ariese et al., 2004; Cory and McKnight, 2005).
Dynamics of Humic-Like Fluorescence in Response to Different Types of Organic Matter Additions
Since the incubations were performed in the dark, thus preventing photo bleaching, the changes in concentration and quality of FDOM humic-like compounds should exclusively be induced by prokaryotic metabolism, abiotic condensation or viral life cycles. With the exception of the exponential-growth phase in DEEP I, we observed an accumulation of the humic-like fraction across all treatments in the three experiments (Figure 5). In general, the increase in humic-like substances was higher in the conditions where humic precursors were added. These results would be in accordance with the hypothesis postulated by Andrew et al. (2013) about the requirement of polyphenolic terrestrial precursor material to generate additional humic fluorescence signal. The overall picture fits with the expectations that the quality of the precursor material is a significant factor determining the characteristics of the generated DOM. It is remarkable that, in CM and CR conditions, a production of humic-like substances in the stationary phase was recorded in the three experiments. These results agree with the trends observed in earlier studies that reported the accumulation of humic-like fluorescence during the development of incubation experiments. Most of these experiments were performed with the addition of different C sources to the media as phytoplankton exudates added to sea water tanks (Rochelle-Newall and Fisher, 2002; Stedmon and Markager, 2005a; Romera-Castillo et al., 2011). Our results also agree with other studies that found a positive correlation between in-situ microbial respiration and humic-like FDOM generation in the deep (De La Fuente et al., 2014; Guerrero-Feijóo et al., 2014; Jørgensen et al., 2014b; Lønborg and Álvarez-Salgado, 2014) as the three humic-like components showed an increase of intensity during the stationary phase.
In two out of the three experiments (DEEP II and III), the main trend of the humic-like compounds showed the same pattern for the total extent (tfinal–t0). Yet, when we related these FDOM increases to prokaryotic abundance, the cell-specific production of FDOM components (Table 4) differed depending on the available source of organic matter. This result indicates that the quality of the precursor material is a significant factor determining the characteristics of the generated DOM and also modifies the organisms' activity. In fact, in the CR condition, where lower prokaryotic abundances were observed, the humic FDOM production per cell turned out to be significantly higher than in the other treatments.
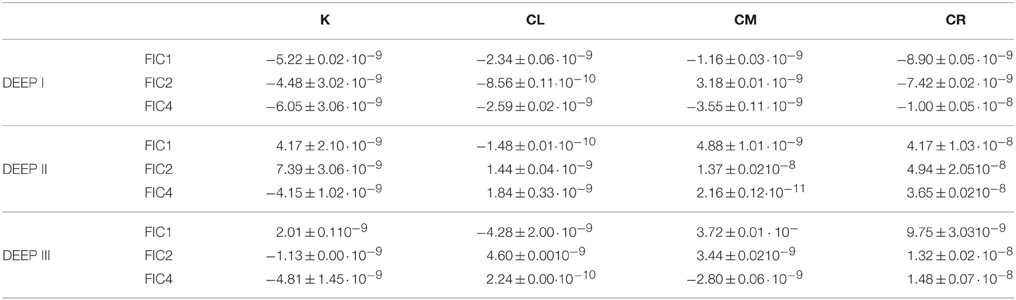
Table 4. Overall production/consumption of humic-like fluorescence per cell [(FDOM at tfinal–FDOM at t0)·(prokaryotes at tfinal–prokaryotes at t0)−1] for all the different treatments during the experiments (in R.U.·cells−1 d−1).
Our results (Figure 5 and Table 4) allow us: (i) to reinforce Andrew et al. (2013) theory (previously stated), and (ii) to demonstrate the (Jørgensen et al., 2014b) hypothesis, who highlighted the idea that the less labile the precursor material is, the more humic fluorescence is generated. In addition, these results emphasize the appropriateness of distinguishing between different growth stages to better understand the dynamics of produced/consumed DOM.
Concerning humic FDOM dynamics, some discrepancies were observed between the DEEP I and the other two experiments, i.e., an assimilation of the humic-like components in DEEP I vs. an accumulation in DEEP II and III. We are aware that the characteristics of the water masses differed, and that this is perhaps the main reason behind the different responses. Seawater temperature for experiment DEEP I was 0.27°C while the temperatures for the DEEP II and DEEP III experiments were 1.84 and 2.78°C, respectively. Although all three temperatures were low, the DEEP I samples suffered the most substantial change when located at the temperature control chamber, set to 4°C. This fact could explain the steepest slope detected in the prokaryotes' growth curves for all conditions in the DEEP I experiment during the first 10 days of incubation (Figure 4). The prokaryotic growth rate turned out to be approximately two times higher during the first days in DEEP I compared to DEEP II and III. The relevance of temperature in controlling the degradation of organic matter by microbes has been highlighted many times before (Leahy and Colwell, 1990; Delille, 2004; Vázquez-Domínguez et al., 2007). It is known that the metabolism of cold tolerant prokaryotes is adapted to regulate cellular activities at low temperatures (Feller et al., 1996), however a sudden relatively relevant increase of temperature combined with the availability of DOM sources in excess, and the nature of the DOM already present in the media may cause differences in the behavior of cells while incorporating nutrients (Pomeroy and Wiebe, 2001). In DEEP I experiment, this change in the metabolism could have promoted a fast growth of the bacteria, supporting the use of the humic-like substances instead of its production. We are also aware that the prokaryotic diversity found in AABW differed from those present in NADW and CDW (M. Sebastián, personal communication). For that reason, we cannot reject the hypothesis that the different groups of microorganisms present in the water could have experienced a faster growth in DEEP I, and thus changing the consumption/production ratio of the humic-like substances.
Dynamics of Protein-Like Fluorescence in Response to Different Types of Organic Matter Additions
The large initial drop detected in FIC3 fluorescence in the CM treatments is likely due to the utilization of the added amino acids by prokaryotes, while the signal increase in the K, CL, and CR conditions could be attributed: (i) to an increase in prokaryotic biomass, as microbial cells have protein-like fluorescence themselves (Determann et al., 1998) or (ii) to prokaryotic by-products that fluoresce in the protein-like region (Yamashita and Tanoue, 2003). The differences between the CM and the other conditions were caused by the different origin of the carbon sources available for prokaryotic consumption. In previous experiments where the only source of carbon was glucose, a selective release of amino acids (D-alanine) and an increase of other components (glucosamine and muramic acid) was observed, associated to prokaryotic growth (Kawasaki and Benner, 2006; Azúa et al., 2014; Jørgensen et al., 2014a). These findings concur with the increase of protein-like fluorescence observed in the K, CL, and CR treatments in our experiments.
On the other hand, using data from Bermuda (BATS) and Hawaii (HOT) time series, Kaiser and Benner (2009) found that carbohydrates and amino acids were preferentially used during microbial decomposition of marine organic matter.
We suggest that, in our CM conditions, prokaryotes may have been using the available amino acids for growth. Thus, the drop in the fluorescence signal would correspond to the balance between production and assimilation microbial processes. In order to evaluate the relative importance of these two processes, we estimated the FIC3 signal produced by prokaryotes in the CM condition by applying an exponential model (Figure 7).
According to the model calculations, approximately 90% of the fluorescence detected at t0 was due to the added amino acids in the CM treatment, while this percentage decreased down to about 2% of the total fluorescence detected at t10 or t15 (Figure 8), implying that bacteria used the amino acids added to supply their metabolic requirements until they reached the end of the exponential growth phase. This is in accordance with prior results obtained in degradation experiments (Nieto-Cid et al., 2006) where they observed a rapid consumption of recently produced dissolved protein-like material which was accumulated in the water column only when gross primary production exceeded a threshold value. Nevertheless, during the stationary phase, values of eFIC3 remained practically unaltered, suggesting that the prokaryotic community would have entered in a low-anabolic activity stage. In this regard, our results indicate that prokaryotic heterotrophic activity participates in both consumption and production of protein-like fluorescent substances, although production tends to surpass consumption during the exponential phase when labile/refractory substances are present.
Conclusions
Recently, Arrieta et al. (2015) found that deep sea prokaryotic growth was stimulated when organisms were exposed to increasing concentrations of autochthonous DOM. Our results demonstrated that the quality also influences prokaryotic activity.
In addition, we found that both the quality of organic matter added, and the initial biotic and abiotic conditions can modify the microbial net production and consumption of FDOM. A clear FDOM net consumption was only observed in the experiment with Antarctic Bottom Water (AABW). To better understand the final fate of organic matter, further experiments should include analyses of organic matter at molecular levels (e.g., with spectrometry methods) and microbial gene diversity.
Based on our findings we conclude that, although mechanisms that hinder DOC total remineralization in deep waters are still poorly understood, the sequestration of OC in the deep ocean can significantly be reduced when labile substrates become available.
Author Contributions
FA—Participated in the development of the experimental design, the sampling strategy, the acquisition of data, the treatment of data, and the writing procedure of the manuscript. MN—Participated in the acquisition of data, the interpretation of data, and the final approval of the manuscript version to be submitted. EB—Participated in the development of the experimental design, the sampling strategy, and the acquisition of data. ER—Participated in the the sampling strategy, the acquisition of data, and the writing procedure of the manuscript. CS—Participated in the interpretation of data, and the final approval of the manuscript version to be submitted. MS—Participated in the final approval of the manuscript version to be submitted. JG—Participated in the interpretation of data and the final approval of the manuscript version to be submitted. AR—Participated in the interpretation of data and the final approval of the manuscript version to be submitted. CM—Participated in the development of the experimental design, the sampling strategy, the acquisition of data, the treatment of data, and the writing procedure of the manuscript.
Conflict of Interest Statement
The authors declare that the research was conducted in the absence of any commercial or financial relationships that could be construed as a potential conflict of interest.
Acknowledgments
The authors would like to acknowledge the captain, crew, technicians of the R/V Hespérides and the team mates of the FICARAM cruise for their valuable help (C. R. Giner, V. Balagué, C. Cardelús, C. Antequera, and F. Alonso). The experiments have been possible thanks to the funding of projects STORM (Structure of Organic Matter: Biogeochemical and Ecological Implications, CTM2009-09352) and DOREMI (Dissolved Organic Matter Remineralization in the Ocean: Microbial and Biogeochemical Constraints, CTM2012-342949) from the Spanish Ministerio de Economía y Competitividad. FA, benefited of a JAE-pre pre-doctoral fellowship from the Consejo Superior de Investigaciones Científicas (CSIC). MN-C was funded by the CSIC Program “Junta para la Ampliación de Estudios” co-financed by the ESF. CS acknowledges funding from the Danish Research Council for Independent Research (DFF 1323-00336).
References
Andrew, A. A., Del Vecchio, R., Subramaniam, A., and Blough, N. V. (2013). Chromophoric dissolved organic matter (CDOM) in the Equatorial Atlantic Ocean: optical properties and their relation to CDOM structure and source. Mar. Chem. 148, 33–43. doi: 10.1016/j.marchem.2012.11.001
Ariese, F., Van Assema, S., Gooijer, C., Bruccoleri, A. G., and Langford, C. H. (2004). Comparison of Laurentian Fulvic Acid luminescence with that of the hydroquinone/quinone model system: evidence from low temperature fluorescence studies and EPR spectroscopy. Aquat. Sci. 66, 86–94. doi: 10.1007/s00027-003-0647-8
Arrieta, J. M., Mayol, E., Hansman, R. L., Herndl, G. J., Dittmar, T., and Duarte, C. M. (2015). Dilution limits dissolved organic carbon utilization in the deep ocean. Science 348, 331–333. doi: 10.1126/science.1258955
Azam, F., and Hodson, R. E. (1981). Multiphasic kinetics for D-glucose uptake by assemblages of natural marine bacteria. Mar. Ecol. Prog. Ser. 6, 213–222. doi: 10.3354/meps006213
Azúa, I., Goiriena, I., Baña, Z., Iriberri, J., and Unanue, M. (2014). Release and consumption of D-amino acids during growth of marine prokaryotes. Microbiol. Ecol. 67, 1–12. doi: 10.1007/s00248-013-0294-0
Bianchi, T. S. (2012). Correction. The role of terrestrially derived organic carbon in the coastal ocean: a changing paradigm and the priming effect. Proc. Natl. Acad. Sci. U.S.A. 109, 5134–5134. doi: 10.1073/pnas.1202757109
Bianchi, T. S., Thornton, D. C. O., Yvon-Lewis, S. A., King, G. M., Eglinton, T. I., Shields, M. R., et al. (2015). Positive priming of terrestrially derived dissolved organic matter in a freshwater microcosm system. Geophys. Res. Lett. 42, 5460–5467. doi: 10.1002/2015GL064765
Brussaard, C. P. D. (2004). Viral control of phytoplankton - a review. J. Eukaryot. Microbiol. 51, 125–138. doi: 10.1111/j.1550-7408.2004.tb00537.x
Brym, A., Paerl, H. W., Montgomery, M. T., Handsel, L. T., Ziervogel, K., and Osburn, C. L. (2014). Optical and chemical characterization of base-extracted particulate organic matter in coastal marine environments. Mar. Chem. 162, 96–113. doi: 10.1016/j.marchem.2014.03.006
Carlson, C. A., Giovannoni, S. J., Hansell, D. A., Goldberg, S. J., Parsons, R., Otero, M. P., et al. (2002). The effect of nutrient amendments on bacterioplankton growth, DOC utilization, and community structure in the northwestern Sargasso Sea. Aquat. Microb. Ecol. 30, 19–36. doi: 10.3354/ame030019
Catalá, T. S., Reche, I., Fuentes-Lema, A., Romera-Castillo, C., Nieto-Cid, M., Ortega-Retuerta, E., et al. (2015). Turnover time of fluorescent dissolved organic matter in the dark global ocean. Nat. Commun. 6, 1–8. doi: 10.1038/ncomms6986
Catalán, N., Kellerman, A. M., Peter, H., Carmona, F., and Tranvik, L. J. (2015). Absence of a priming effect on dissolved organic carbon degradation in lake water. Limnol. Oceanogr. 60, 159–168. doi: 10.1002/lno.10016
Cawley, K. M., Ding, Y., Fourqurean, J., and Jaffé, R. (2012). Characterising the sources and fate of dissolved organic matter in Shark Bay, Australia: a preliminary study using optical properties and stable carbon isotopes. Mar. Freshw. Res. 63, 1098–1107. doi: 10.1071/MF12028
Coble, P. G. (1996). Characterization of marine and terrestrial DOM in seawater using excitation-emission matrix spectroscopy. Mar. Chem. 51, 325–346. doi: 10.1016/0304-4203(95)00062-3
Coble, P. G. (2007). Marine optical biogeochemistry: the chemistry of ocean color. Chem. Rev. 107, 402–418. doi: 10.1021/cr050350+
Coble, P. G., Green, S. A., Blough, N. V., and Gagosian, R. B. (1990). Characterization of dissolved organic matter in the Black Sea by fluorescence spectroscopy. Nature 348, 432–435. doi: 10.1038/348432a0
Cory, R. M., and McKnight, D. M. (2005). Fluorescence spectroscopy reveals ubiquitous presence of oxidized and reduced quinones in dissolved organic matter. Environ. Sci. Technol. 39, 8142–8149. doi: 10.1021/es0506962
De Haan, H. (1977). Effect of benzoate on microbial decomposition of fulvic acids in Tjeukemeer (the Netherlands). Limnol. Oceanogr. 22, 38–44. doi: 10.4319/lo.1977.22.1.0038
De La Fuente, P., Marrasé, C., Canepa, A., and Álvarez-Salgado, X. A. (2014). Does a general relationship exist between fluorescent dissolved organic matter and microbial respiration? — The case of the dark equatorial Atlantic Ocean. Deep Sea Res. Part I Oceanogr. Res. Pap. 89, 44–55. doi: 10.1016/j.dsr.2014.03.007
Delille, D. (2004). Abundance and function of bacteria in the Southern Ocean. Cell. Mol. Biol. 50, 543–551.
Determann, S., Lobbes, J. M., Reuter, R., and Rullkötter, J. (1998). Ultraviolet fluorescence excitation and emission spectroscopy of marine algae and bacteria. Mar. Chem. 62, 137–156. doi: 10.1016/S0304-4203(98)00026-7
Dittmar, T. (2015). “Reasons behind the long-term stability of dissolved organic matter,” in Biogeochemistry of Marine Dissolved Organic Matter, eds D. A. Hansell and C. A. Carlson (San Diego, CA: Elsevier Inc.), 369–388. doi: 10.1016/B978-0-12-405940-5.00007-8
Feller, G., Narinx, E., Arpigny, J. L., Aittaleb, M., Baise, E., Genicot, S., et al. (1996). Enzymes from psychrophilic organisms. FEMS Microbiol. Rev. 18, 189–202. doi: 10.1111/j.1574-6976.1996.tb00236.x
Fontaine, S., Bardoux, G., Abbadie, L., and Mariotti, A. (2004). Carbon input to soil may decrease soil carbon content. Ecol. Lett. 7, 314–320. doi: 10.1111/j.1461-0248.2004.00579.x
Fonte, E. S., Amado, A. M., Meirelles-Pereira, F., Esteves, F. A., Rosado, A. S., and Farjalla, V. F. (2013). The combination of different carbon sources enhances bacterial growth efficiency in aquatic ecosystems. Microb. Ecol. 66, 871–878. doi: 10.1007/s00248-013-0277-1
Gasol, J. M., and Del Giorgio, P. A. (2000). Using flow cytometry for counting natural planktonic bacteria and understanding the structure of planktonic bacterial communities. Sci. Mar. 64, 197–224. doi: 10.3989/scimar.2000.64n2197
Gontikaki, E., Thornton, B., Huvenne, V. A. I., and Witte, U. (2013). Negative priming effect on organic matter mineralisation in NE Atlantic slope sediments. PLoS ONE 8:e67722. doi: 10.1371/journal.pone.0067722
Graeber, D., Gelbrecht, J., Pusch, M. T., Anlanger, C., and von Schiller, D. (2012). Agriculture has changed the amount and composition of dissolved organic matter in Central European headwater streams. Sci. Total Environ. 438, 435–446. doi: 10.1016/j.scitotenv.2012.08.087
Guenet, B., Danger, M., Harrault, L., Allard, B., Jauset-Alcala, M., Bardoux, G., et al. (2014). Fast mineralization of land-born C in inland waters: first experimental evidences of aquatic priming effect. Hydrobiologia 721, 35–44. doi: 10.1007/s10750-013-1635-1
Guerrero-Feijóo, E., Nieto-Cid, M., Álvarez, M., and Álvarez-Salgado, X. A. (2014). Dissolved organic matter cycling in the confluence of the Atlantic and Indian oceans south of Africa. Deep Sea Res. Part I Oceanogr. Res. Pap. 83, 12–23. doi: 10.1016/j.dsr.2013.08.008
Hansell, D. A., Carlson, C. A., Repeta, D. J., and Schlitzer, R. (2009). Dissolved organic matter in the ocean. A controversy stimulates new insights. Oceanography 22, 202–211. doi: 10.5670/oceanog.2009.109
Hansen, H. P., and Grasshoff, K. (1983). “Automatic chemical analysis,” in Methods of Seawater Analysis, eds K. Grasshoff, M. Ehrhardt, and K. Kremling (Weinheim: Verlag Chemie), 368–376.
Hertkorn, N., Benner, R., Frommberger, M., Schmitt-Kopplin, P., Witt, M., Kaiser, K., et al. (2006). Characterization of a major refractory component of marine dissolved organic matter. Geochim. Cosmochim. Acta 70, 2990–3010. doi: 10.1016/j.gca.2006.03.021
Ho, T.-Y., Scranton, M. I., Taylor, G. T., Varela, R., Thunell, R. C., and Muller-Karger, F. (2002). Acetate cycling in the water column of the Cariaco Basin: seasonal and vertical variability and implication for carbon cycling. Limnol. Oceanogr. 47, 1119–1128. doi: 10.4319/lo.2002.47.4.1119
Honjo, S., Eglinton, T. I., Taylor, C. D., Ulmer, K. M., Sievert, S. M., Bracher, A., et al. (2014). Understanding the role of the biological pump in the global carbon cycle. An imperative for ocean science. Oceanography 27, 10–16. doi: 10.5670/oceanog.2014.78
Hopkinson, C. S., Vallino, J. J., and Nolin, A. (2002). Decomposition of dissolved organic matter from the continental margin. Deep. Res. II 49, 4461–4478. doi: 10.1016/S0967-0645(02)00125-X
Jiao, N., Herndl, G. J., Hansell, D. A., Benner, R., Kattner, G., Wilhelm, S. W., et al. (2010). Microbial production of recalcitrant dissolved organic matter: long-term carbon storage in the global ocean. Nat. Rev. Microbiol. 8, 593–599. doi: 10.1038/nrmicro2386
Jørgensen, L., Lechtenfeld, O. J., Benner, R., Middelboe, M., and Stedmon, C. A. (2014a). Bacterial production and transformation of dissolved neutral sugars and amino acids in seawater. Biogeosciences Discuss 11, 6151–6184. doi: 10.5194/bgd-11-6151-2014
Jørgensen, L., Stedmon, C. A., Granskog, M. A., and Middelboe, M. (2014b). Tracing the long-term microbial production of recalcitrant fluorescent dissolved organic matter in seawater. Geophys. Res. Lett. 41, 2481–2488. doi: 10.1002/2014GL059428
Kaiser, K., and Benner, R. (2009). Biochemical composition and size distribution of organic matter at the Pacific and Atlantic time-series stations. Mar. Chem. 113, 63–77. doi: 10.1016/j.marchem.2008.12.004
Kawasaki, N., and Benner, R. (2006). Bacterial release of dissolved organic matter during cell growth and decline: origin and composition. Limnol. Oceanogr. 51, 2170–2180. doi: 10.4319/lo.2006.51.5.2170
Kim, S., Kramer, R. W., and Hatcher, P. G. (2003). Graphical method for analysis of ultrahigh-resolution braodband mass spectra of natural organic matter, the van Krevelen diagram. Anal. Chem. 75, 5336–5344. doi: 10.1021/ac034415p
Koch, B. P., Witt, M., Engbrodt, R., Dittmar, T., and Kattner, G. (2005). Molecular formulae of marine and terrigenous dissolved organic matter detected by electrospray ionization Fourier transform ion cyclotron resonance mass spectrometry. Geochim. Cosmochim. Acta 69, 3299–3308. doi: 10.1016/j.gca.2005.02.027
Koehler, B., von Wachenfeldt, E., Kothawala, D. N., and Tranvik, L. J. (2012). Reactivity continuum of dissolved organic carbon decomposition in lake water. J. Geophys. Res. Biogeosciences 117, 1–14. doi: 10.1029/2011JG001793
Koprivnjak, J. F., Pfromm, P. H., Ingall, E., Vetter, T. A., Schmitt-Kopplin, P., Hertkorn, N., et al. (2009). Chemical and spectroscopic characterization of marine dissolved organic matter isolated using coupled reverse osmosis–electrodialysis. Geochim. Cosmochim. Acta 73, 4215–4231. doi: 10.1016/j.gca.2009.04.010
Kothawala, D. N., Stedmon, C. A., Müller, R. A., Weyhenmeyer, G. A., Köhler, S. J., and Tranvik, L. J. (2014). Controls of dissolved organic matter quality: evidence from a large-scale boreal lake survey. Glob. Chang. Biol. 20, 1101–1114. doi: 10.1111/gcb.12488
Kothawala, D. N., von Wachenfeldt, E., Koehler, B., and Tranvik, L. J. (2012). Selective loss and preservation of lake water dissolved organic matter fluorescence during long-term dark incubations. Sci. Total Environ. 433, 238–246. doi: 10.1016/j.scitotenv.2012.06.029
Kowalczuk, P., Tilstone, G. H., Zabłocka, M., Röttgers, R., and Thomas, R. (2013). Composition of dissolved organic matter along an Atlantic Meridional Transect from fluorescence spectroscopy and Parallel Factor Analysis. Mar. Chem. 157, 170–184. doi: 10.1016/j.marchem.2013.10.004
Kuzyakov, Y. (2002). Separating microbial respiration of exudates from root respiration in non-sterile soils: a comparison of four methods. Soil Biol. Biochem. 34, 1621–1631. doi: 10.1016/S0038-0717(02)00146-3
Lapierre, J.-F., and del Giorgio, P. A. (2014). Partial coupling and differential regulation of biologically and photo-chemically labile dissolved organic carbon across boreal aquatic networks. Biogeosciences 11, 5969–5985. doi: 10.5194/bg-11-5969-2014
Lawaetz, A. J., and Stedmon, C. A. (2009). Fluorescence intensity calibration using the raman scatter peak of water fluorescence intensity calibration using the raman scatter peak of water. Appl. Spectrosc. 63, 936–940. doi: 10.1366/000370209788964548
Leahy, J. G., and Colwell, R. R. (1990). Microbial degradation of hydrocarbons in the environment. Microbiol. Rev. 54, 305–315.
Legendre, L., Rivkin, R. B., Weinbauer, M., Guidi, L., and Uitz, J. (2015). The microbial carbon pump concept: potential biogeochemical significance in the globally changing ocean. Prog. Oceanogr. Press 134, 432–450. doi: 10.1016/j.pocean.2015.01.008
Löhnis, F. (1926). Nitrogen availability of green manures. Soil Sci. 22, 253–290. doi: 10.1097/00010694-192610000-00001
Lønborg, C., and Álvarez-Salgado, X. A. (2014). Tracing dissolved organic matter cycling in the eastern boundary of the temperate North Atlantic using absorption and fluorescence spectroscopy. Deep Sea Res. Part I Oceanogr. Res. Pap. 85, 35–46. doi: 10.1016/j.dsr.2013.11.002
Motegi, C., Nagata, T., Miki, T., Weinbauer, M. G., Legendre, L., and Rassoulzadegan, F. (2009). Viral control of bacterial growth efficiency in marine pelagic environments. Limnol. Oceanogr. 54, 1901–1910. doi: 10.4319/lo.2009.54.6.1901
Murphy, K. R., Ruiz, G. M., Dunsmuir, W. T. M., and Waite, T. D. (2006). Optimized parameters for fluorescence-based verification of ballast water exchange by ships. Environ. Sci. Technol. 40, 2357–62. doi: 10.1021/es0519381
Murphy, K. R., Stedmon, C. A., Graeber, D., and Bro, R. (2013). Fluorescence spectroscopy and multi-way techniques. PARAFAC. Anal. Methods 5, 6557–6566. doi: 10.1039/c3ay41160e
Murphy, K. R., Stedmon, C. A., Waite, T. D., and Ruiz, G. M. (2008). Distinguishing between terrestrial and autochthonous organic matter sources in marine environments using fluorescence spectroscopy. Mar. Chem. 108, 40–58. doi: 10.1016/j.marchem.2007.10.003
Murphy, K. R., Stedmon, C. A., Wenig, P., and Bro, R. (2014). OpenFluor– an online spectral library of auto-fluorescence by organic compounds in the environment. Anal. Methods 6, 658–661. doi: 10.1039/C3AY41935E
Nagata, T., Fukuda, H., Fukuda, R., and Koike, I. (2000). Bacterioplankton distribution and production in deep Pacific waters: Large-scale geographic variations and possible coupling with sinking particle fluxes. Limnol. Oceanogr. 45, 426–435. doi: 10.4319/lo.2000.45.2.0426
Nieto-Cid, M., Álvarez-Salgado, X. A., and Pérez, F. F. (2006). Microbial and photochemical reactivity of fluorescent dissolved organic matter in a coastal upwelling system. Limnol. Oceanogr. 51, 1391–1400. doi: 10.4319/lo.2006.51.3.1391
Pomeroy, L. R., and Wiebe, W. J. (2001). Temperature and substrates as interactive limiting factors for marine heterotrophic bacteria. Aquat. Microb. Ecol. 23, 187–204. doi: 10.3354/ame023187
Reader, H. E., Stedmon, C. A., Nielsen, N. J., and Kritzberg, E. S. (2015). Mass and UV-visible spectral fingerprints of dissolved organic matter: sources and reactivity. Front. Mar. Sci. 2, 1–10. doi: 10.3389/fmars.2015.00088
Repeta, D. J. (2015). “Chemical characterization and cycling of dissolved organic matter,” in Biogeochemistry of Marine Dissolved Organic Matter, eds D. A. Hansell and C. A. Carlson (San Diego, CA: Elsevier Inc.), 21–63. doi: 10.1016/B978-0-12-405940-5.00002-9
Rochelle-Newall, E. J., and Fisher, T. R. (2002). Production of chromophoric dissolved organic matter fluorescence in marine and estuarine environments: an investigation into the role of phytoplankton. Mar. Chem. 77, 7–21. doi: 10.1016/S0304-4203(01)00072-X
Romera-Castillo, C., Sarmento, H., Álvarez-Salgado, X. A., Gasol, J. M., and Marrasé, C. (2011). Net production and consumption of fluorescent colored dissolved organic matter by natural bacterial assemblages growing on marine phytoplankton exudates. Appl. Environ. Microbiol. 77, 7490–7498. doi: 10.1128/AEM.00200-11
Sala, M. M., and Güde, H. (2004). Ectoenzymatic activities and heterotrophic bacteria decomposing detritus. Arch. Hydrobiol. 160, 289–303. doi: 10.1127/0003-9136/2004/0160-0289
Sarmento, H., Romera-Castillo, C., Lindh, M., Pinhassi, J., Sala, M. M., Gasol, J. M., et al. (2013). Phytoplankton species-specific release of dissolved free amino acids and their selective consumption by bacteria. Limnol. Oceanogr. 58, 1123–1135. doi: 10.4319/lo.2013.58.3.1123
Schlitzer, R. (2015). Ocean Data View. Available online at: http://odv.awi.de
Shimp, R. J., and Pfaender, F. K. (1985). Influence of easily degradable naturally occurring carbon substrates on biodegradation of monosubstituted phenols by aquatic bacteria. Appl. Environ. Microbiol. 49, 394–401.
Søndergaard, M., Stedmon, C. A., and Borch, N. H. (2003). Fate of terrigenous dissolved organic matter (DOM) in estuaries: aggregation and bioavailability. Ophelia 57, 161–176. doi: 10.1080/00785236.2003.10409512
Stedmon, C. A., and Markager, S. (2005a). Resolving the variability in dissolved organic matter fluorescence in a temperate estuary and its catchment using PARAFAC analysis. Limnol. Oceanogr. 50, 686–697. doi: 10.4319/lo.2005.50.2.0686
Stedmon, C. A., and Markager, S. (2005b). Tracing the production and degradation of autochthonous fractions of dissolved organic matter using fluorescence analysis. Limnol. Oceanogr. 50, 1415–1426. doi: 10.4319/lo.2005.50.5.1415
Stedmon, C. A., Thomas, D. N., Granskog, M. A., Kaartokallio, H., Papadimitriou, S., and Kuosa, H. (2007). Characteristics of dissolved organic matter in baltic Coastal Sea ice: allochthonous or autochthonous origins? Environ. Sci. Technol. 41, 7273–7279. doi: 10.1021/es071210f
Stubbins, A., Lapierre, J. F., Berggren, M., Prairie, Y. T., Dittmar, T., and Del Giorgio, P. A. (2014). What's in an EEM? Molecular signatures associated with dissolved organic fluorescence in boreal Canada. Environ. Sci. Technol. 48, 10598–10606. doi: 10.1021/es502086e
Vázquez-Domínguez, E., Vaqué, D., and Gasol, J. M. (2007). Ocean warming enhances respiration and carbon demand of coastal microbial plankton. Glob. Chang. Biol. 13, 1327–1334. doi: 10.1111/j.1365-2486.2007.01377.x
Volk, T., and Hoffert, M. I. (1985). “Ocean Carbon pumps: analysis of relative strengths and efficiencies in ocean-driven atmospheric CO2 changes,” in The Carbon Cycle and Atmospheric CO2: Natural Variations Archean to Present, eds E. T. Sundquist and W. S. Broecker (Washington, DC: AGU Monograph 32; American Geophysical Union), 99–110.
Walker, S. A., Amon, R. M. W., and Stedmon, C. A. (2013). Variations in high-latitude riverine fluorescent dissolved organic matter: a comparison of large Arctic rivers. J. Geophys. Res. Biogeosciences 118, 1689–1702. doi: 10.1002/2013JG002320
Walker, S. A., Amon, R. M. W., Stedmon, C. A., Duan, S., and Louchouarn, P. (2009). The use of PARAFAC modeling to trace terrestrial dissolved organic matter and fingerprint water masses in coastal Canadian Arctic surface waters. J. Geophys. Res. 114, G00F06. doi: 10.1029/2009jg000990
Weber, G. (1961). Enumeration of components in complex systems by fluorescence spectrophotometry. Nature 90, 27–29. doi: 10.1038/190027a0
Yamashita, Y., Maie, N., Briceño, H., and Jaffé, R. (2010a). Optical characterization of dissolved organic matter in tropical rivers of the Guayana Shield, Venezuela. J. Geophys. Res. 115, 1–15. doi: 10.1029/2009JG000987
Yamashita, Y., Panton, A., Mahaffey, C., and Jaffé, R. (2011). Assessing the spatial and temporal variability of dissolved organic matter in Liverpool Bay using excitation-emission matrix fluorescence and parallel factor analysis. Ocean Dyn. 61, 569–579. doi: 10.1007/s10236-010-0365-4
Yamashita, Y., Scinto, L. J., Maie, N., and Jaffé, R. (2010b). Dissolved organic matter characteristics across a subtropical wetland's landscape: application of optical properties in the assessment of environmental dynamics. Ecosystems 13, 1006–1019. doi: 10.1007/s10021-010-9370-1
Yamashita, Y., and Tanoue, E. (2003). Chemical characterization of protein-like fluorophores in DOM in relation to aromatic amino acids. Mar. Chem. 82, 255–271. doi: 10.1016/S0304-4203(03)00073-2
Keywords: Atlantic Ocean, deep sea, DOC, FDOM, PARAFAC, EEMs, precursors, organic matter
Citation: Aparicio FL, Nieto-Cid M, Borrull E, Romero E, Stedmon CA, Sala MM, Gasol JM, Ríos AF and Marrasé C (2015) Microbially-Mediated Fluorescent Organic Matter Transformations in the Deep Ocean. Do the Chemical Precursors Matter? Front. Mar. Sci. 2:106. doi: 10.3389/fmars.2015.00106
Received: 29 September 2015; Accepted: 18 November 2015;
Published: 08 December 2015.
Edited by:
Thomas S. Bianchi, University of Florida, USAReviewed by:
Karin M. Björkman, University of Hawaii, USANicholas David Ward, University of Florida, USA
Copyright © 2015 Aparicio, Nieto-Cid, Borrull, Romero, Stedmon, Sala, Gasol, Ríos and Marrasé. This is an open-access article distributed under the terms of the Creative Commons Attribution License (CC BY). The use, distribution or reproduction in other forums is permitted, provided the original author(s) or licensor are credited and that the original publication in this journal is cited, in accordance with accepted academic practice. No use, distribution or reproduction is permitted which does not comply with these terms.
*Correspondence: Fran L. Aparicio, franciscoluis.aparicio@icm.csic.es