Valuing Multiple Eelgrass Ecosystem Services in Sweden: Fish Production and Uptake of Carbon and Nitrogen
 Scott G. Cole
 Per-Olav Moksnes
- 1EnviroEconomics Sweden Consultancy, Frösön, Sweden
- 2Department of Marine Sciences, University of Gothenburg, Göteborg, Sweden
Valuing nature's benefits in monetary terms is necessary for policy-makers facing trade-offs in how to spend limited financial resources on environmental protection. We provide information to assess trade-offs associated with the management of seagrass beds, which provide a number of ecosystem services, but are presently impacted by many stressors. We develop an interdisciplinary framework for valuing multiple ecosystem services and apply it to the case of eelgrass (Zostera marina), a dominant seagrass species in the northern hemisphere. We identify and quantify links between three eelgrass functions (habitat for fish, carbon, and nitrogen uptake) and economic goods in Sweden, quantify these using ecological endpoints, estimate the marginal average value of the impact of losing one hectare of eelgrass along the Swedish northwest coast on welfare in monetary terms, and aggregate these values while considering double-counting. Over a 20–50 year period we find that compared to unvegetated habitats, a hectare of eelgrass, including the organic material accumulated in the sediment, produces an additional 626 kg cod fishes and 7535 wrasse individuals and sequesters 98.6 ton carbon and 466 kg nitrogen. We value the flow of future benefits associated with commercial fishing, avoided climate change damages, and reduced eutrophication at 170,000 SEK in 2014 (20,700 US$) or 11,000 SEK (1300 US$) annualized at 4%. Fish production, which is the most commonly valued ecosystem service in the seagrass literature, only represented 25% of the total value whereas a conservative estimate of nitrogen regulation constituted 46%, suggesting that most seagrass beds are undervalued. Comparing these values with historic losses of eelgrass we show that the Swedish northwest coast has suffered a substantial reduction in fish production and mineral regulation. Future work should improve the understanding of the geographic scale of eelgrass functions, how local variables affect the value of these functions, and how to defensibly aggregate a multitude of economic values.
Introduction
Valuing nature's benefits—either explicitly in monetary or non-monetary forms, or implicitly through laws and cultural norms—is necessary for policy-makers facing trade-offs in how to spend limited resources on environmental protection. Because many of the economic benefits of human development are measured in monetary terms, the estimation of non-market environmental costs, and benefits is becoming increasingly relevant, particularly for the marine environment. The net benefits of coastal development require more information about the economic values associated with marginal changes in the benefits provided by the sea, i.e., the types of gradual but persistent—rather than massive and non-marginal—changes we are seeing today in ecosystem function (Arkema et al., 2015). These types of marginal economic values can help society allocate scarce resources for e.g., the establishment of marine protection areas, the development of equitable compensation payments for ecosystem injuries (Cole, 2011), or stimulating environmental markets (Palmer and Filoso, 2009).
Although economists recognize the existence of many types of value [SAB, (Science Advisory Board), 2009; Mace and Bateman, 2011], we focus on human-centric economic values for nature that measure the contribution of certain objects (e.g., ecosystem functions and services) to human well-being. These so-called instrumental values are sometimes contrasted with intrinsic values, which suggest that nature may have value “for its own sake” independent of its contribution to human welfare (Davidson, 2013). Instrumental values are based on what individuals are willing to give up to obtain something else of value, and may be measured in monetary or non-monetary terms. Economic values for nature may capture use values directly (e.g., being able to fish) or indirectly (carbon sequestration leads to mitigation of damages from climate change) or even non-use values, which is the value an individual may assign to economic goods even if they never have, or never will, use it (non-use values are sometimes further divided into option, bequest, and existence values). This framework is often referred to as Total Economic Value (TEV) (Freeman et al., 2014).
The Millenium Ecosystem Assessment (Alcamo and Bennett, 2003) recognized and categorized several types of benefits provided by ecosystems (Ecosystem Services, or ES), which has been followed-up by additional work by economists to assign value to these services (Kumar, 2010). The ES concept provides a strong theoretical basis for valuing nature's contribution to our well-being and has received increased attention in Europe and Sweden (TEEB, 2010; European Parliament, 2012; Regeringskansliet, 2013; Delgado and Marín, 2015). For example, the European Marine Strategy Framework Directive requires information about the benefits provided by the sea and has led to increased use of monetary estimates for these values (Beaudoin and Pendelton, 2012). A number of frameworks designed to value nature's benefits suggest a focus on three critical links between (1) underlying ecological functions, (2) resulting (or intermediate) benefits to society provided by ecosystem services, and, finally, (3) the final economic goods that provide well-being and that can, moreover, be valued in monetary terms (see Figure 1; Mace and Bateman, 2011; Keeler et al., 2012).
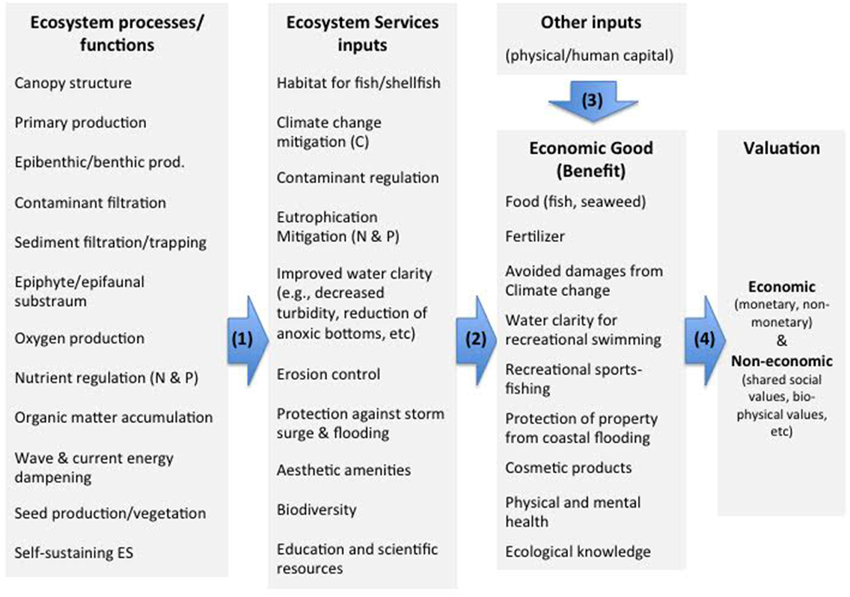
Figure 1. Conceptual approach to identifying and valuing seagrass benefits to society. We follow a four step process: Step #1 maps relevant ecosystem functions and links them to economic goods [arrows (1) and (2)]. Step #2 identifies biophysical changes in ecosystem functions [first column] that are to be valued and Step #3 identifies how these changes affect the flow of multiple ecosystem services and economic goods [arrows (1) and (2)]. Finally, step #4 estimates the value of these multiple changes in economic goods [arrow (4)], which may also be affected by other non-ecosystem inputs [arrow (3)].
However, the challenges in this area, including the obstacles in mapping and classifying sometimes remote services, has resulted in a limited valuation literature (Maes et al., 2012). Delgado and Marín (2015) note that despite the massive increase in ES literature since 1991, the majority focuses on terrestrial landscapes, with only 13% covering the marine environment. (Liquete et al., 2013) recommends several indicators for assessing “the capacity, flow or benefit derived” from marine and coastal ecosystem services, while Börger et al. (2014) emphasize the importance of interdisciplinary coordination between marine ecologists, economists, and planers. Delgado and Marín (2015) note that the ES concept is most useful to decision-makers when studies assess and value specific ecosystems or geographic areas rather than generic and large-scale ecosystem service assessments. The authors found a shortage of such site-specific studies for the marine environment and also note ineffective information systems for disseminating research results (e.g., literature databases).
Seagrass beds provide several benefits to society, but are impacted by multiple stressors including nutrient pollution, sediment runoff, dredging, and coastal development (docks, marinas, etc.). The global loss of seagrass ecosystems has led to a decline in key ecological functions such as habitat provision for fish and other organisms, uptake of carbon and nutrients, sediment stabilization, storm protection, etc. (Orth et al., 2006; Waycott et al., 2009). As seagrass functions decline, so too do valuable ES and the resulting economic goods that depend on them such as food (e.g., fish and other seafood); protection of real estate from coastal erosion; recreation (e.g., sports fishing and improved amenity values for swimming including clearer water and stable sandy beaches; Short et al., 2000; Rönnbäck et al., 2007; Barbier et al., 2010; Tanner et al., 2014).
A number of valuation studies have examined the multiple economic goods provided by seagrass and their impact on welfare (see e.g., Cullen-Unsworth et al., 2014), but most limit their focus to a subset of goods, such as enhanced commercial fishing using market-based approaches (Watson et al., 1993; McArthur and Boland, 2006; Stål et al., 2008; Bertelli and Unsworth, 2014; Blandon and Zu Ermgassen, 2014; Tuya et al., 2014; Jackson et al., 2015); improved recreational fishing (e.g., increased catch rate for species that depend on seagrass; Johnston, 2002; Francis, 2012), or avoided economic damages from climate change due to seagrass's ability to sequester carbon (Mangi et al., 2011; Pendleton et al., 2012; Luisetti et al., 2013). A number of studies have used cost as a proxy for value when estimating the benefits of seagrass habitat. An oft-cited study estimates the global value of nutrient cycling benefits per hectare provided by seagrass/algae beds, based on the cost of providing equivalent nitrogen-reducing measures such as wastewater treatment (Costanza et al., 1997, see also Costanza et al., 2014). Tanner et al. (2014) valued beach amenity values provided by seagrass based on the potential cost savings to a sand management program, while Thorhaug (1990) highlight the cost of seagrass restoration projects as a proxy for value. Some seagrass studies consider non-economic values by relying on biological proxies (areal coverage, biomass of bird and mammal groups that eelgrass supports) or the energy resources invested by nature to satisfy human needs (Plummer et al., 2012; Vassallo et al., 2013). Some studies use the quality or extent of seagrass as a variable when valuing ecosystem services in general from coastal ecosystems (Kragt and Bennett, 2009; Brenner et al., 2010). While we are not aware of studies examining non-use values associated with seagrass, several Swedish studies have estimated positive non-use values for an increased cod population, a species that depends on seagrass (Eggert and Olsson, 2009; Eggert, 2015).
While the economic valuation literature cited above is important, its usefulness for policy assessment is limited (Naber, 2008; Barbier et al., 2010; Bertelli and Unsworth, 2014) in part because they tend to focus primarily on single economic goods. Those that attempt to capture multiple goods provide little guidance on how to aggregate values, a key concern identified in Keeler et al. (2012). Further, landmark studies like Costanza et al. (1997) and Costanza et al. (2014) play a key roll in raising awareness of society's dependence on ES in general, but they do not support improved decision-making, which requires information on the economic value associated with relatively small marginal changes in ecosystems. Moreover, most valuation estimates do not account for the fact that the ecological functions underlying these goods and services vary spatially and temporally, which greatly affects the benefits they provide (Barbier, 2008).
This paper improves upon the “single economic good” approach found in the existing literature for valuing ecosystem services. Our contribution is first to identify links between seagrass ecological functions, ecosystem services, and the multiple economic goods in Sweden to which they contribute; second, to quantify these links using ecological endpoints where possible and an assumed marginal environmental change; and third, to provide an estimate of the monetary values at stake. Including the contribution of ecosystem services to our well-being, even if they are captured with imperfect monetary estimates, will improve the existing decision-making processes, which typically assumes these values are zero. Our approach aggregates multiple values while avoiding double-counting of ecosystem benefits. The double-counting trap occurs when valuing functions instead of final goods or, when summing the value of economic goods that benefit from the same function, and is the result of our weak understanding of the complex interactions of ecosystems (Turner et al., 2010).
We focus on the case of eelgrass (Zostera marina L.) on Sweden's northwest coast and estimate an average marginal value per hectare that captures the benefits associated with avoiding economic damages from climate change, increasing economic value to commercial fishing, and reducing nitrogen levels. Finally, we discuss the effect of spatial variables in identifying beds that provide relatively greater or lesser value, thus helping decision-makers better assess trade-offs associated with the management of eelgrass beds.
Materials and Methods
Study System
Eelgrass is the most abundant seagrass species in the northern hemisphere and plays a critical structural and functional role in many coastal ecosystems. It is an important ecosystem engineer that provides substrate, shelter, feeding, and nursery environments for a large variety of species, some of which are commercially important (e.g., Short et al., 2000; Lilley and Unsworth, 2014). It protects against coastal erosion and increases water clarity through the reduction of wave energy, trapping of particles, and stabilizing of sediments (Orth et al., 2012). It is also important for nutrient trapping and cycling (McGlathery et al., 2012) and contributes to reduced climate impact through sequestration of carbon from the atmosphere (Duarte et al., 2005; Fourqurean et al., 2012).
Eelgrass is the dominant seagrass on the Swedish west coast where it forms dense meadows from 1 to 5 m depth (Boström et al., 2014) that support diverse communities in which 41 fish species (Pihl et al., 2006), 72 algal epiphytes, and 125 species of epifauna have been identified (Fredriksen et al., 2005). The focus area of this study, the Swedish northwest coast, stretches from Gothenburg to the Norwegian border (~170 km) and includes a complex coastline with fjords and archipelagos where eelgrass is present more or less continuously in smaller meadows in sheltered, soft sediment habitats. Since the 1980s, approximately 60% of the eelgrass has been lost from the Swedish northwest coast (Baden et al., 2003; Nyqvist et al., 2009) due to eutrophication and overfishing (Moksnes et al., 2008; Baden et al., 2012), leading to a decline in valuable ES. In recent decades, water quality measures have reduced the nutrient load and improved water quality along the Swedish Skagerrak coast (SwAM, 2014), slowly improving the conditions for eelgrass growth.
Valuation Approach
We rely on the Keeler et al. (2012) framework as a structure for mapping, modeling, quantifying and monetizing nature's benefits. This framework, together with other approaches in the literature [see e.g., SAB, 2009; Mace and Bateman, 2011; Guerry et al., 2015; Olander et al., 2015], underscores the importance of a stepwise approach. Our conceptual approach follows a four-step process summarized in Figure 1.
To map eelgrass ES on Sweden's west coast and link them to economic goods (Step #1) we rely on previous literature that has assessed the types of functions provided by eelgrass worldwide and adjusted them to reflect the conditions on Sweden's west coast. We summarize links between ecological function (e.g., biophysical processes) and the resulting ecosystem services (i.e., indirect benefits to society). For the purpose of valuation without double counting (see “Mapping ecosystem functions…” below), we assume ecosystem functions and process are captured in the value of the final economic good that provides benefits to society, as shown in Figure 1 (Step #4). Just as GDP measures car production, rather than (intermediate) inputs like steel and rubber, we measure the final economic goods from eelgrass meadows, which is assumed to capture the value of intermediate inputs, such as ecosystem services and other physical/human capital. We acknowledge that economics goods may also include “services” such as child care, financial services etc, just as ecosystem services may include “goods” such as fish. To avoid confusion we rely on the terminology of the UK NEA such that any output that provides benefits to society is considered an “economic good,” see Bateman et al. (2013).
Step #2 defines an anticipated marginal change to the ecosystem services provided by eelgrass for our valuation scenario. To capture how a hectare of eelgrass contributes to our welfare we make an assumption about an expected biophysical change that will occur in the future under a business as usual approach. Specifically, we assume permanent conversion (loss) of a one hectare eelgrass bed to bare sediment, where the lost bed is assumed to be mature and delivering a full suit of ecosystem services, e.g., the absorption of a significant amount of carbon and nutrients in the sediment. We assume a (marginal) loss of one hectare from a coastal region with several hectares of eelgrass meadows. The economic benefit provided by that hectare is the avoided loss of multiple economic goods. Economic theory suggests that the selection of a hypothetical valuation scenario should not affect the estimated value, i.e., the willingness to pay (WTP) for a marginal gain (eelgrass restoration) should be equivalent to the willingness to accept (WTA) for the same size loss (eelgrass damage). However, in practice economic studies have found differences when valuing the same change using WTA vs. WTP (see e.g., empirical divergence in Kim and Kling, 2015). This discrepancy is often explained empirically from an ecological or economic perspective by examining how a specific biophysical change affects the provision of an economic good(s) or how an individual may experience a given valuation scenario. Because we focus on a relatively small marginal change in eelgrass provision, we assume our estimate is equally applicable for valuing gains or losses.
Under Step #3 we link changes in ecosystem function to changes in value by relying on ecological endpoints (Boyd, 2007), which represent meeting points between ecological (biophysical changes) and economic modeling (interpreting how biophysical changes affect welfare). We estimate ecological endpoints to assess the value of marginal (i.e., relatively small) changes in economic goods rather than the total value of “having a resource versus not having a resource.” In practice this may involve losing a hectare due to coastal development or gaining a hectare from compensatory restoration. The values are less applicable for valuing large non-marginal changes (see Discussion).
To assign monetary values under Step #4 we consider a variety of economic methods for estimating values for the types of market and non-market economic goods in Figure 1 (see e.g., Freeman et al., 2014). We aim to capture the value of all economic goods arising from the ecological functions provided by eelgrass (see Table 1), but in practice we exclude some goods, and capture only a portion of others, due to a lack of ecological and/or economic data and robust valuation methods (see section “Mapping Ecosystem Functions …”). The valuation of multiple economics goods is an iterative process that requires careful consideration of the appropriateness of a given valuation method (i.e., what it aims to value, what it is unable to value, the data it requires, etc.). Further, it requires consideration of how to aggregate valuation results from a variety of different methods in a rigorous and defensible manner. Our study ultimately relies on three valuation methods that capture different aspects of monetary value associated with eelgrass ES: avoidance of economic damages, increase in value to commercial fishing, and replacement costs.
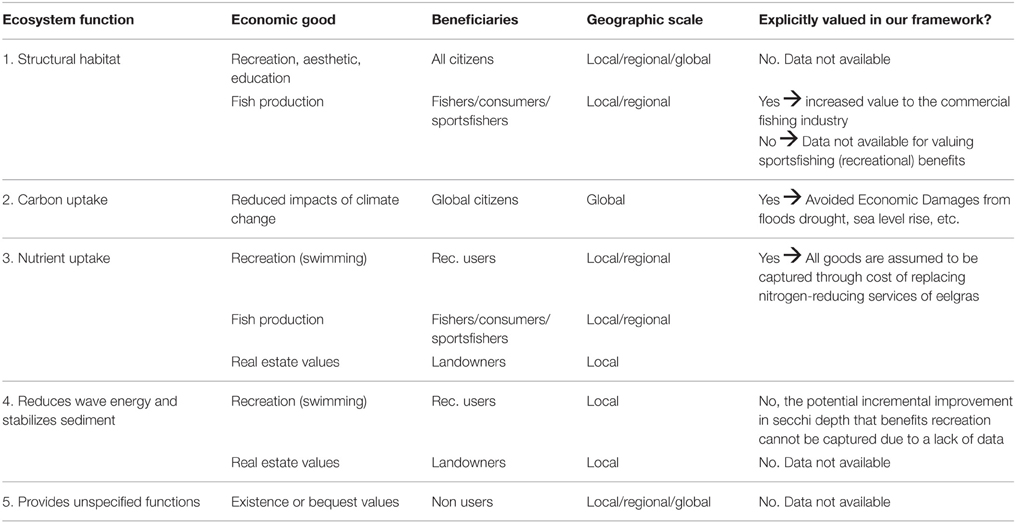
Table 1. Summary of underlying ecosystem functions provided by eelgrass on Sweden's West coast and how we value them.
The non-market values associated with carbon and nitrogen are based on a transfer of existing values in the literature, rather than primary valuation studies. Such transfers are common when (1) a policy site (e.g., Sweden's northwest coast) exhibits similar characteristics to the study site from which the value is derived and (2) when resources for carrying out a primary study are limited (see Richardson et al., 2015 guidance in the case of ecosystem service valuation). The price of carbon used in our study is based on a transfer of the global value associated with economic damages arising from carbon emissions. Our price of nitrogen is based on a cost transfer, i.e., we examine the costs of nitrogen-reducing measures near the study area (Sweden's northwest coast), and use this cost as a proxy for value.
Economic benefits that accrue far in the future are generally valued less than those that occur today. We account for this so-called positive rate of time preference based on the observation that humans are inherently impatient and prefer to have access to goods and services “today” rather than “tomorrow.” The observation is based on the fact that waiting to consume a good/service affects our welfare negatively, i.e., we may die in the future and not have a chance to consume the good or, future generations may have greater wealth at their disposal based on economic growth and therefore their welfare is relatively less important than ours, etc. (see e.g., Dasgupta, 2008). Thus, we discount the value of benefits provided by eelgrass that accrue in the future based on an assumed discount rate of 4% based on Swedish economic guidance (SEPA, Swedish Environmental Protection Agency, 2003; SIKA, (Statens institut f;r kommunikationsanalys), 2009). Discounts rates in these types of environmental analyses typically vary between 1 and 7% [see e.g., NOAA, 1999; Moilanen et al., 2009; Mangi et al., 2011]. This means that if the economic estimates for fish production, nitrogen storage or carbon storage are valued at 100 SEK in nominal terms in 20 years (or alternatively in 50 years), we value it at 46 SEK (or 15 SEK), respectively, in present value (2014) terms. Discounting is even used to adjust non-monetary ecological measures of value (see e.g., Cole, 2011 or Sperduto et al., 2003). The value estimates for nitrogen regulation in this study capture future benefits over a 20-year period rather than the 50 years for carbon uptake. Most economic analyses limit the flow of future benefits to those within 20 years because of the uncertainty associated with projecting ecological and economic assumptions too far into the future. In contrast to the local/regional benefits of nitrogen, however, the carbon valuation literature tends to focus on the long-lived nature of global carbon sequestration benefits, which explains our differing time periods.
Mapping Ecosystem Functions to Economic Goods for Swedish Eelgrass
Eelgrass meadows along the Swedish west coast provide a number of important ecosystem functions that link to one or more economic goods that can be valued monetarily. Although we aim to capture the value of all economic goods arising from eelgrass, we can only value goods from three of the ecosystem functions: structural habitat along with both carbon and nitrogen uptake and storage. Our approach is limited due to a lack of ecological and/or economic data and robust valuation methods (Table 1).
Eelgrass is an ecosystem engineer that provides structural habitat to a large number of species, which enhances local biodiversity and increases the production of fish and invertebrates. Many of these benefits identified in our conceptual model (Figure 1) related to habitat provision are excluded from Table 1 because they are inherently difficult to value due to a lack of data, e.g., production of medicine and cosmetic products (Farber et al., 2006), improvements in physical health, recreational, aesthetic, and educational benefits. Similarly, a number of unspecified functions may give rise to existence and bequest values (which may include biodiversity benefits), but we are unable to value these. We capture instead the benefits to the commercial fishing sector related to the production of gadoid fish (codfish family) and Labridae fish (wrasses). Although benefits could also accrue to recreational sports fishermen, either concurrently or in-place of the commercial sector, we focus on the latter due to lack of data for allocating enhanced fish production across the two sectors. Further, we lack data on how to assign increased fish catch per hectare of eelgrass to individual sports fisherman along the northwest coast, who would likely benefit from increased sea trout (Salmo trutta) populations. Although many economically important species rely on eelgrass beds for their life cycle, we are forced to exclude many due to lack of biological or economic data. For example, eel (Anguilla anguilla) has been an economically valuable species and highly dependent on eelgrass beds, but its stocks are dwindling and the market has closed in Sweden.
Eelgrass beds provide an important global ecosystem function related to carbon uptake and long-term storage in the sediment. Carbon accumulation leads to a reduction in climate change impacts that are captured in our analysis through the social cost of carbon (SCC).
A regional and local function of eelgrass is the uptake and storage of nutrients, which reduces the negative effects of eutrophication in Swedish coastal waters. For example, excessive nitrogen leads to increased production of phytoplankton and decreased water clarity (which affects recreation and property values), increased growth of filamentous algal mats (which may reduce fish recruitment for e.g., plaice), and increased deposits of algal mats on beaches (which affects recreation). Nutrient pollution also decreases oxygen levels in bottom waters which leads to negative impacts on the bottom fauna and commercial fish and crustaceans such as e.g., Norwegian lobster (Rosenberg, 1990; Troell et al., 2005; Stål et al., 2008). On Sweden's west coast, the only positive effects of moderate levels of nutrient pollution are for species with no commercial or recreational value such as the small fish stickle back, shore crabs, and species of ephemeral macroalgae (Pihl et al., 1995, 1999).
The ideal valuation approach for nutrient reduction services would be based on individuals' WTP for explicit and marginal improvements in an economic good such as recreation. For example, sight depth is a useful ecological endpoint that has been used in several studies that demonstrate a WTP by Swedish beachgoers for improved recreational experiences (see Sandström, 1996 and Soutukorva, 2005 for a study of travel expenditures and Söderqvist and Scharin, 2000 for a stated preference study). The recreational value stated by survey respondents in e.g., the Söderqvist and Scharin (2000) study could be linked to the site depth improvement provided by an eelgrass bed to provide a value-based monetary estimate. However, if respondents also internally considered benefits to fish populations or carbon sequestration when stating their WTP for the hypothetical water clarity improvement, then we may be double counting benefits and thus over-estimating the contribution of eelgrasses' water clarity-generating functions. Farber et al. (2006) note the difficulty of valuing multiple economic goods that depend, to some extent, on nutrient uptake, such as recreational swimming (benefits from clearer water), recreational fishing (benefits from improved catch rate/size), and food (benefits from increased commercial fish production). Because the nitrogen uptake function contributes to all of these economic goods, a valuation approach should capture as many of them as possible without over-estimating the total contribution of this underlying function. In our case, recreational improvements based on water clarity benefits primarily from the nutrient reduction function, but also from wave energy (see below). However, at present we lack valuation studies of the appropriate geographic scale and detail to be able to isolate and defensibly estimate values for individual contributions of each function to the final economic good. For example, we need data on, among other things, how to apportion Swedish WTP values for water clarity on a per hectare basis.
An alternative approach for valuing nutrient reduction, used in this study, is to value the biophysical change directly (reduction in nitrogen) rather than relying on an ecological endpoint (e.g., improvement in water clarity), which is then used to value a subsequent economic good (e.g., recreation). While values for nitrogen reduction can be found from market prices for nitrogen offset credits (see e.g., Piehler and Smyth, 2011), we believe these prices to be too volative and potenticially distorted and thus rely instead on the costs of mitigation measures aimed at reducing nitrogen. This replacement cost approach has been used frequently in the literature (Gosselink et al., 1974; Notte et al., 2012; Hasler et al., 2014) and relies on cost as a proxy for the value of the economic benefits provided by nutrient uptake, which in our case may include recreational swimming, real estate values, and fish production for some species (Table 1). It examines the costs society incurs to avoid damages or, in our case, to replace services with man-made substitutes (e.g., wetland creation that reduces nitrogen concentration). It assumes that if people incur such costs, then the ES must be worth at least what people paid to replace them (or to avoid damages from losing them). Although less rigorous from a welfare economics perspective, cost may be a relevant proxy for value if (1) the man-made alternative replaces the same quantity or quality of services provided by nature, (2) it is the least cost option, and (3) the public would have been willing to incur this cost (Shabman and Batie, 1978; for a more accessible treatment see Bockstael et al., 2000). We argue for this method for the eelgrass application based on the following context for each citeria: (1) as noted, eelgrass provides a unique and equivalent service related to the trapping and removal of nitrogen (see above); (2) the cost of providing the alternative (nitrogen mitigation measures) varies significantly by watershed, depending on what is feasible given the extent of nutrient pollution. Thus, while there is no single “least cost alternative” we believe that the average price for nitrogen used in this study (Table 5) provides a reasoanble approximation of a typical cost [We discuss adjustments to this value below, see “Spatial (local) affects on values”]. While economic benefits are also likely to vary between watersheds, we do not have data to determine whether this variation is symmetric with the observed variation in costs; (3) the implementation of a variety of nutrient abatement measures along Sweden's coast to meet Swedish and EU demands (Hasler et al., 2014) provides evidence of a willingness to invest in these types of services. In fact, eutrophication is considered a large problem in Sweden and all of the Swedish west coast is considered to be strongly affected by nutrient pollution and show less than acceptable ecological status according to monitoring data and assessment for the EU Water Framework Directive (HELCOM, 2010; SIME, 2014). To meet the requirements of national environmental goals and the EU directives to obtain good ecological status, measures to reduce nutrient supply to local watersheds are required in almost all of water bodies along the Swedish northwest coast (SIME, 2014; SwAM, 2014). We note, however, that the existence of relatively cheap man-made alternatives for reducing nitrogen may cause our approach to underestimate the true economic benefit of this service.
One locally important ecosystem function is the reduction of wave energy, which stabilizes sediment through the canopy and rhizome-root mat of the eelgrass bed. This contributes to at least two economic goods: recreational values may be enhanced due to reduced sediment resuspension and an incremental improvement in water clarity and real estate values may be enhanced by avoiding economic damage caused by coastal erosion (Table 1). Studies on coastal erosion prevention from eelgrass in Sweden is not available and thus we do not measure enhanced real estate values. However, studies on the Swedish northwest coast suggest that the loss of eelgrass beds has resulted in a local decrease of 1 m in secchi-depth (a measure of water clarity) due to increased sediment resuspension (Moksnes, unpubl. data). That is, in some local watersheds this eelgrass function may provide further improvements in secchi depth that are incremental to the water clarity improvements provided by nutrient uptake. However, at present there is a lack of valuation studies of the appropriate geographic scale and detail to identify these benefits on a local scale, and to allow a separation from the same good (recreation) being produced by nutrient uptake.
In summary, our approach values two final economic goods (fish production and reduced impacts from climate change) and one biophysical change directly (nitrogen storage, which is assumed to lead to several economic goods such as improved recreational experiences, fish production, among others). Below we describe our estimating of ecological endpoints and monetary values.
Estimating Ecological Endpoints
Fish Production
Eelgrass beds on the Swedish west coast constitute an important nursery and feeding habitat for a number of commercially and recreationally important species, including Atlantic cod (Gadus morhua), whiting (Merlangius merlangus), polloch (Pollachius virens), herring, eel, flounder, sea trout, and wrasses (Rönnbäck et al., 2007; Stål et al., 2008). In this study, only the gadoid fish and the wrasses were assessed due to limitation of data. Adult wrasses are fished commercially and sold to salmon farms in Norway where they are used to collect ectoparasites.
Due to overfishing, very few adult cod are found along the Swedish west coast today. The juveniles recruited to coastal habitat are primarly from offshore populations in Kattegat and the North Sea. These northwest coast juveniles migrate offshore as they mature and are mainly caught in the offshore fishery in Skagerrak and North Sea (Svedäng and Bardon, 2003; Cardinale and Svedäng, 2004). The total contribution of cod from eelgrass beds along the Swedish northwest coast to this offshore fishery today is estimated to be less than 3% (Stål et al., 2008). Thus, our valuation scenario (see Step #2 above) assumes only a marginal effect on the offshore fishery catch, the costs to the fishing industry, the behavior of the fishery, and the associated regulatory context.
To estimate the negative effect on the fish community from the loss of eelgrass in the study area, we used data from a study on the Swedish northwest coast that compared the community of fish in eelgrass beds with that found in soft bottom areas where an eelgrass beds had been lost in the last 20 years using semi quantitative beach seine samples taken both day and night in four areas (Pihl et al., 2006). We thus assume that the net difference in fish abundance between the two habitats represent a loss in production of gadoid fish and wrasses, and that other juvenile habitat is not available in the local area. This approach is similar to the one used in South Australia to estimate the enhancement of juvenile fish by seagrasses (Blandon and Zu Ermgassen, 2014). Comparing the differences between the habitats it was estimated that the loss of one hectare of eelgrass would results in a loss of 335 juvenile cod and 50 juveniles of other gadoid fish, and 685 adult wrasses (mainly goldsinny wrasse, Ctenolabrus rupestris) from the local area (Table 2).
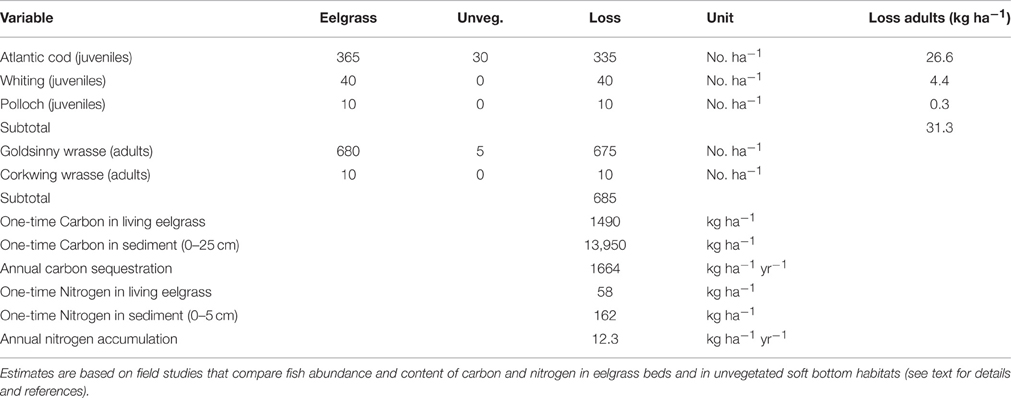
Table 2. Estimated ecological endpoints related to commercial fish, carbon and nitrogen per hectare of lost eelgrass.
To estimate how the loss of juvenile gadoids affected the production of adult fish caught in the fishery, we modeled the growth and survival of the juveniles, and the proportion caught in the fishery in each age-class, using data in the literature for average weight, natural mortality and fishing mortality for each age-class (Table 3). This provides a rough estimate of the total biomass of the gadoids caught over a 2–4 year period (until >95% of the biomass had been caught in the fishery). This approach is similar to the production by size-frequency method and modeling size-specific growth and mortality used in earlier studies to value fish production in seagrass beds (Watson et al., 1993; Blandon and Zu Ermgassen, 2014; Tuya et al., 2014). For Atlantic cod, natural mortality in juvenile cod during the first and second year (Age class 0-I) was based on mark-recapture studies along the Norwegian coast (Kristiansen, 2001). Estimates of natural and fishing mortality, and average weight per age-class were based on data from the International Bottom Trawl Survey in the North Sea Skagerrak area (ICES, 2013) using 10-years average values (2003–2012). Since all gadoid fish are caught in the same mixed fishing, the same estimate of fishing mortality was used for all tree species, but species-specific values of average weight per age-class. For whiting, estimated on natural mortality were based on studies in the Celtic Sea (Imelda, 2003), and the mortality of the 0-group was not included since the study indicate that whiting use eelgrasses mainly during their second year (Pihl et al., 2006). Due to the high juvenile natural mortality (e.g., 88% of the juvenile cod died before they were caught in the fishery), the 385 juvenile gadoid fish lost per hectare of eelgrass only resulted in a total loss of 31.3 kg of adult commercial cod, whiting and polloch (Table 2). Taken together, the loss of a hectare of eelgrass results in an annual loss of approximately 685 adults wrasses and 31.3 kg of commercial gadoid fish, equivalent to a nominal loss of 7,535 wrasses and 626 kg of gadoid fish over a 20 year period (the total loss of wrasses is adjusted for the multiple year classes of adult wrasses found in eelgrass).
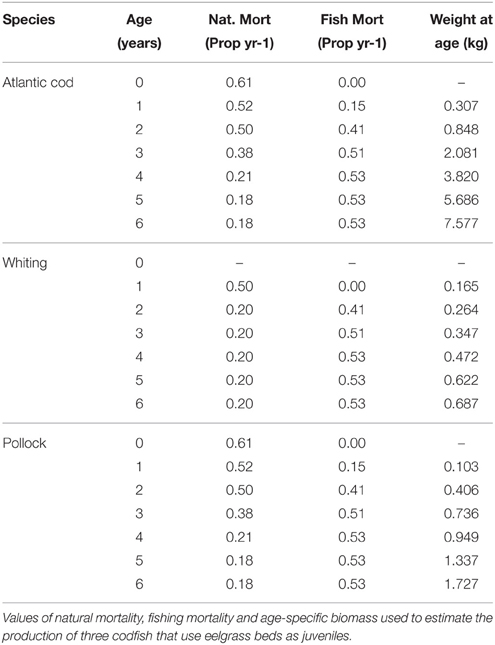
Table 3. Mortality estimates for gaidoids for estimating ecological endpoints for fish production.
Carbon Uptake and Storage
Seagrass meadows have a unique ability to produce, trap and store organic compounds, making them important sinks for carbon as well as nutrients. In good light conditions, excess photosynthetic carbon fixation is placed directly into the sediments as roots and rhizomes (Duarte and Cebrian, 1996). In addition to this direct source of carbon from seagrass tissues, organic matter from other sources accumulates in the sediments due to the ability of the seagrass canopy to trap particles from the water column (Hendriks et al., 2008). This results in exceptionally high burial rate of organic carbon, and an efficient preservation of the carbon in seagrass sediment is due to low oxygen levels and the dense canopy and rhizomes that protect the carbon deposits from erosion. The carbon buried in seagrass sediment can therefore be over a meter thick and preserved for 100s of years, making the sediment a critical component of seagrass carbon sink (Duarte et al., 2013). When a seagrass bed is lost, most of the seagrass is rapidly remineralized and the carbon returned to the ocean-atmosphere. All or part of the carbon-rich sediment is also eroded and it can be assumed that a large percentage of the carbon in the sediment is also reoxidized (Fourqurean et al., 2012), although proportion that is exchanged with the atmosphere still is unknown (Macreadie et al., 2014). Thus, the very large amount carbon found in the sediment should also be included when assessing carbon sink of seagrass beds (Pendleton et al., 2012; Duarte et al., 2013).
As there are no known studies of carbon sequestration rates, nor of the carbon content of live eelgrass or eelgrass sediment in Sweden, we rely on estimates from other areas. To approximate the carbon sequestration rate of Swedish eelgrass we used an average global rate of 1664 kg C ha−1 yr−1 (including carbon both from seagrass tissue and other sources) used for eelgrass in the north Atlantic in recent studies (Duarte et al., 2013). For estimates of the carbon content in living eelgrass (1490 kg C ha−1) we used data from a recent study in Virginia, USA (McGlathery et al., 2012). This study also assesses carbon accumulation in a 9-year old restored eelgrass meadow. Using these values, and assuming that on average 25 cm of the carbon rich sediment will be eroded and the carbon reoxidized if the eelgrass bed is lost in northwestern Sweden, approximately 13,950 kg of carbon will be lost per hectare of eelgrass (Table 2). Thus, in our valuation scenario the loss of a hectare of eelgrass will lead to an immediate nominal loss of approximately 15.4 ton carbon from live eelgrass and sediment to atmospheric CO2. Further, we assume an annual loss of carbon sequestration (1.66 ton C ha−1 yr−1) that would have occurred had the mature bed survived for an additional 50 years, equivalent to an additional nominal loss of 83 ton carbon.
Nitrogen Uptake and Storage
Similar to carbon, also nitrogen is trapped and stored in eelgrass tissue and sediment. However, much less is known about burial rate and depth, and long-term storage of nitrogen in seagrass sediment (Romero et al., 2006), and no known studies exist from Swedish eelgrass beds. To approximate uptake rates of nitrogen of Swedish eelgrass, we used data from the same study as was used for carbon (McGlathery et al., 2012), which showed an average nitrogen content in living eelgrass of 58 kg C ha−1. This study also showed that the accumulation of nitrogen in the top 5 cm of the sediment of a restored eelgrass bed after 9 years was three times higher than the nitrogen content in the sediment of an unvegetated adjacent area (162 and 51 kg nitrogen ha−1, respectively). Using this data it can be approximated that the average nitrogen accumulation was 12.3 kg N ha−1 per year. This is likely a conservative value of the annual nitrogen accumulation since the meadows in the first years had lower shoot density and lower ability to trap and store nutrients than a mature meadow. Since little is known about the available of the nitrogen content at sediment depth below 5 cm in eelgrass beds, only the nitrogen content of the top 5 cm of the sediment is used in this estimate, although nitrogen is likely accumulated to the same depth as carbon, making also this estimate very conservative. A loss of one hectare eelgrass will thus result in an immediate nominal loss of approximately 220 kg nitrogen from live eelgrass and sediment followed by an annual loss of nitrogen uptake (12.3 kg N ha−1 yr−1) that would have occurred had the mature bed survived for an additional 20 years, equivalent to an additional nominal loss of 246 kg.
Estimating Economic Values
Fish Production
The TEV of enhanced commercial fish harvest (from avoiding the loss of a hectare of eelgrass) is the sum of the producer and consumer surplus. The former can be captured through profits to the commercial fishing industry (e.g., increased catch for harvesters and increased sales for sellers, processors and distributors) and the latter can be captured as the benefit to seafood consumers of consuming additional seafood meals or the same meals at a lower price. However, we focus on the producer side as we assume a negligible affect on consumers in our valuation scenario (i.e., the avoided loss of a hectare of eelgrass is unlikely to affect price or quantity in local fish markets). We assume the fishing industry (producer) is not operating at capacity and thus costs associated with increasing production are marginal. Thus, our market-based valuation method relies on a (constant) price and proxies lost value to the commercial fishing industry based on price times quantity. This approach is commonly used in cases where a market-based good (e.g., fish) is dependent on an (eelgrass) ecosystem function such as habitat provision (McArthur and Boland, 2006; Blandon and Zu Ermgassen, 2014; Freeman et al., 2014).
To capture lost value through the supply chain for cod, whiting, and polloch, we rely on the final retail price per kilogram times the increased quantity of fish (adjusted from whole body to filet size). The value captured in the final market is assumed to capture the intermediate losses along the production chain (Just et al., 2005). To capture the lost value to wrasse fishermen, who sell their fish to the aquaculture industry in Norway, we rely on the first landing price per individual times the increased number of individual fish. Value losses to the aquaculture industry are assumed minimal as they can purchase from other suppliers on the margin.
Our valuation scenario assumes an annual nominal loss of 31.3 kg of cod, whiting, and polloch and 685 individuals of wrasse per hectare of eelgrass over the time period 2014–2034. Based on the price data we estimate the present value of future enhanced fish production from a hectare of eelgrass to be approximately 43,500 SEK (5,300 US$) or 3,200 SEK (400 US$) annualized (Table 4). Cod and Wrasse make up nearly 97% of the total value.
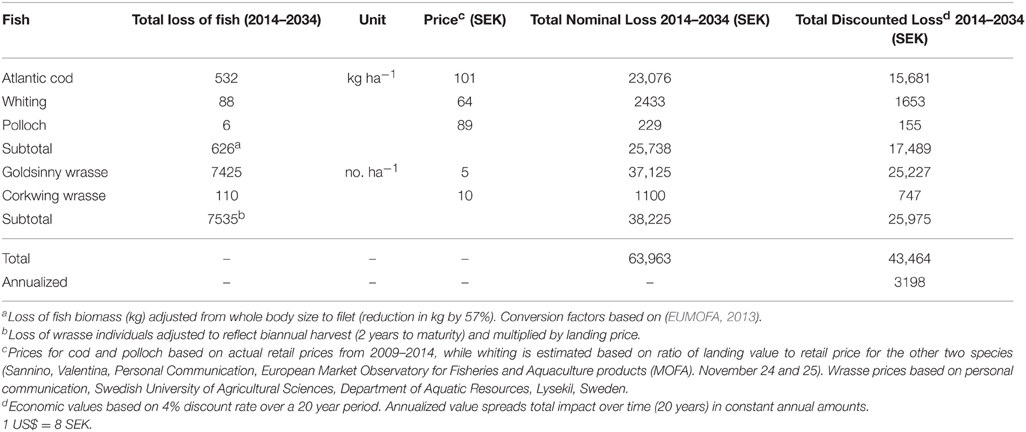
Table 4. Estimating per hectare value of eelgrass—Commercial Fish Production.
Carbon Uptake and Storage
To estimate the value eelgrass provides society in terms of absorbing greenhouse gases (including carbon), we rely on estimates for the SCC found in the valuation literature, i.e., a lost hectare of eelgrass can no longer provide carbon sequestration services and thus leads to economic damages. Economic estimates for the SCC, which are developed through Integrated Assessment Models, are based on our best understanding of how carbon emissions affect the climate (increased risk of droughts, floods, sea level rise, etc.) and how these climate changes affect society (e.g., crop damage, property damage, etc.). The SCC represents the present value of the annual future monetary damages resulting from emitting an extra ton of CO2, compared to a Business As Usual scenario (Revesz et al., 2014).
Based on a review of SCC estimates (see footnote Table 5), we apply an average value of the SCC of 948 SEK (127 US$) per ton of carbon absorbed. Given our assumed nominal loss of 98.6 t carbon storage capacity during the period 2014-2064, we estimate the present value of the future flow of carbon removal benefits derived from a hectare of eelgrass to be approximately 49,900 SEK (6,100 US$) or 2,300 SEK (280 US$) annualized (Table 5).
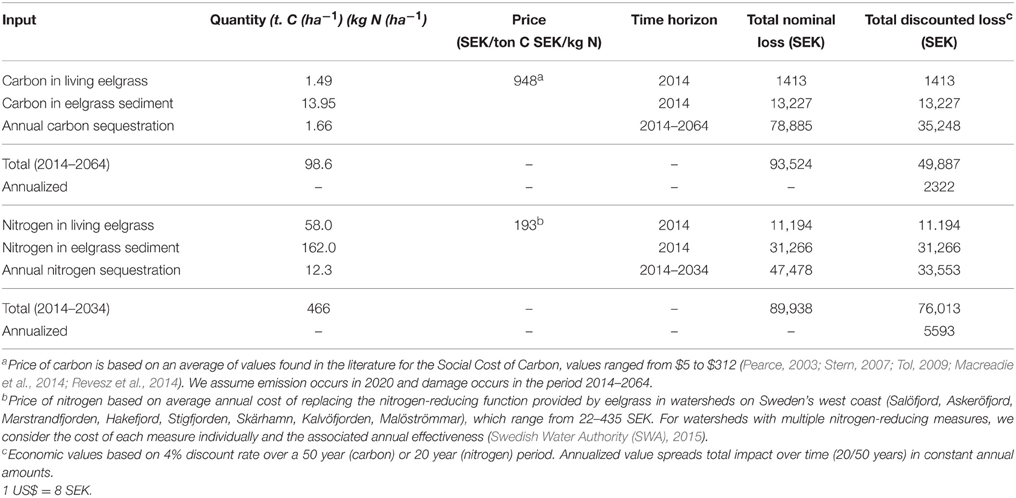
Table 5. Estimating per hectare value of eelgrass—Carbon and Nitrogen storage.
Nitrogen Uptake and Storage
To estimate the economic value associated with nitrogen uptake and storage provided by eelgrass, we rely on the actual costs of nitrogen reduction measures undertaken on Sweden's northwest coast. This replacement cost valuation method captures the difference in costs associated with reaching a nitrogen reduction target under two scenarios: (1) relying on the ecosystem function provided by eelgrass or (2) relying on a man-made alternative. Our target is kilograms of nitrogen stored in the sediment and in living eelgrass tissue and annually by a hectare of eelgrass. Since the cost of scenario (1) is zero, we estimate the difference (value) as the cost of implementing nitrogen-reducing measures in the study area, accounting for their annual effectiveness.
Using a database, we identify several nitrogen-reducing measures undertaken in coastal watersheds on the northwest coast of Sweden with documented eutrophication problems, including construction of wastewater treatment plant, wetland creation, and catch crops (Swedish Water Authority (SWA), 2015). Our dataset assumes managers select feasible measures for a given watershed and then select the least cost option, which is based on the average cost for that measure. The average annual cost effectiveness for removing nitrogen varies from 22 to 435 SEK per kilogram nitrogen per hectare per year (2010 SEK) depending on the measure, with an average cost of 193 SEK (25 US$), which was used in the calculation.
In our valuation scenario, eelgrass removes a (nominal) total of 466 kg of nitrogen over the period 2014–2034. Given that the average total cost to society of removing an annual equivalent amount of nitrogen (in present value terms) is 193 SEK, we estimate the value of nitrogen storage derived from a hectare of eelgrass to be approximately 76,000 SEK (9280 US$), or 5600 SEK (680 US$) annualized (Table 5).
Results
We present total economic benefits that arise over the time frame of our analysis (nitrogen and fish benefits over 20 years, carbon over 50 years). Because the flow of future benefits associated with carbon, fish, and nitrogen occur at different times in the future we standardize them to present value through discounting. We also provide an annualized amount, which approximates an annual value by spreading the total impact over time in constant annual amounts. Based on a 4% discount rate we estimate the average marginal per hectare value of eelgrass services over time to be approximately 170,000 SEK in 2014 (20,700 US$), or 11,000 SEK (1300 US$) annualized (Table 6). Based on the economic goods valued in this analysis, nitrogen uptake and storage represents 46% of the total value, followed by climate mitigation (30%), and fish production (25%). The commercial value of cod (~16,000 SEK) represents only 9% of the total value.
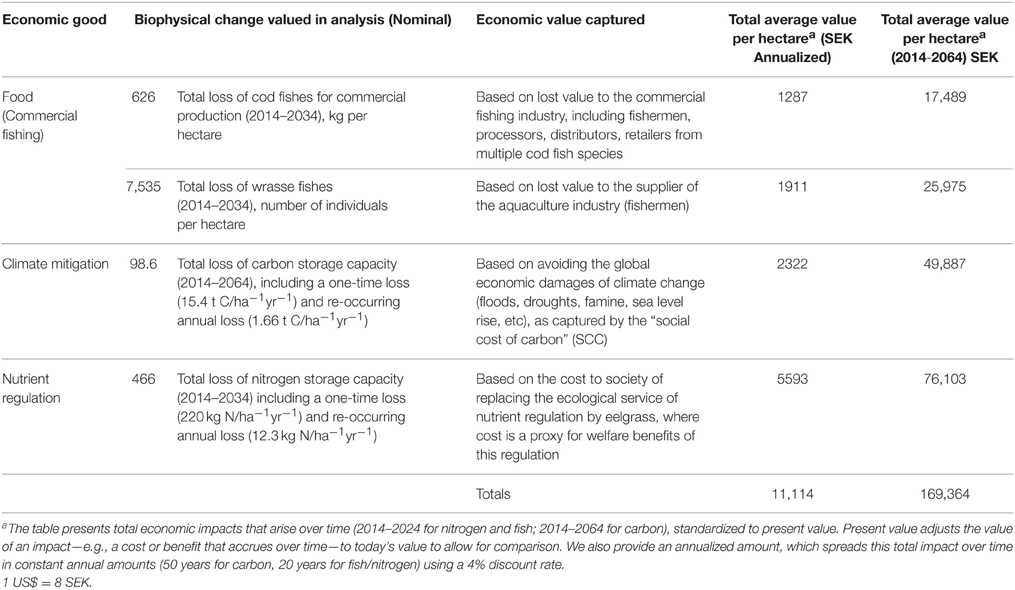
Table 6. Summary of the estimated economic value provided by a hectare of eelgrass on Sweden's West Coast.
Discussion
In this study we developed an interdisciplinary framework for valuing the contribution of eelgrass habitats to human well-being on the west coast of Sweden. Our approach considers the value of three ecosystem functions—structural habitat for fish and uptake of carbon and nitrogen—and aggregates the monetary values associated with the resulting economic goods. This approach differs from earlier valuation studies of seagrasses by capturing multiple economic values—reduced climate change impacts, increased commercial fish production, and reduced eutrophication—rather than focusing on a single economic good. Our results suggest that if a hectare of eelgrass is lost and the habitat transformed to unvegetated bottom where the top 5–25 cm of the sediment is eroded, it would result in a variety of losses including: a reduced yield of approximately 626 kg of gadoid fish and 7535 individual wrasses, a reduction of 99,000 kg (98.6 tons) of sequestered carbon and 466 kg of nitrogen over a 20–50 year period. Based on these ecological endpoints, we estimate the total present value of the flow of future benefits from the resulting economic goods to be approximately 170,000 SEK ha−1 (equivalent to ~20,700 US$ ha−1). This value is at the upper end of other monetary estimates in the literature for seagrasses, but may nonetheless be considered conservative given our cautious approach for estimating ecological endpoints and for aggregating values in our framework. As better ecological and economical data becomes available, and interdisciplinary valuation methods improve, we could expect this value to increase.
Intended Use of Economic Value Estimates
Our valuation framework is considered conservative because it acknowledges current limitations in our ability to translate all eelgrass functions into economic goods that impact our welfare. We believe that a conservative approach that strives to avoid double-counting of ecosystem benefits is preferable to inflated values that are hard to defend and are easily misinterpreted by policy makers and/or the public. A less conservative approach might try to include other values, in particular non-use or existence values associated with e.g., biodiversity and ecosystem resilience, which require stated preference valuation approaches. But combining these survey approaches with those in our framework raises challenging methodology issues because we cannot be sure whether survey respondents account for other seagrass benefits already captured in our framework, when stating their WTP for a given and defined seagrass improvement (or, theoretically, their WTA a seagrass decline). Parsing out and aggregating these types of values is the biggest challenge in a framework aiming to capture multiple economic values.
Our value estimates are useful for policy assessment by coastal managers as they help identify benefits that eelgrass provides society “on average at the margin.” They may be used, for example, to decide whether to allow partial losses (from e.g., dredging) or to assess the value generated by off-setting compensation projects (e.g., eelgrass restoration). Valuation estimates can support arguments for establishing Marine Protection Areas when the benefits of such designations outweigh the costs and, more generally, can inform the “preservation vs. development” debate in coastal areas. The value associated with damaged resources is critical for implementing the Polluter Pays Principle (PPP), which underlies several EU Directives and suggests that operators, not the government, are responsible for internalizing the cost of environmental damage (e.g., European Commission, 2011). The PPP is particularly salient when motivating and improving the use of environmental compensation measures to achieve the Not Net Loss initiative in the EU (Cole, 2011; EEB, (European Environmental Bureau), 2014). Finally, the values in this study may also support market solutions such as Payment for Ecosystem Services schemes (Palmer and Filoso, 2009). For example, the lost value from damaged eelgrass beds may be a useful input in the future development of habitat banking markets to offset coastal development impacts.
A potentially useful and local application of our estimate is to improve existing Swedish policy related to compensatory offsets for negative impacts on eelgrass beds. Currently, operators that cause residual damage are required to pay a “fisheries fee” to compensate for the loss in fish production, which is then used to restore essential fish habitat. In theory, the fee represents a financial cost to operators that ostensibly captures the external cost on the fishery, i.e., the lost value in fish production that would otherwise be provided by eelgrass. However, there is little guidance on how to estimate values or to scale fair compensation payments. As a result, current approaches are ad hoc, with some payments based on estimates of secondary production of fish food and commercial market prices, some based on replacement cost of farmed-raised juvenile fish. Historically, compensation payments have varied from 10,000 to 100,000 SEK ha−1 or 1,400–14,000 US$; pers. com. Administrative County Board Västra Götalands Län). These fees likely underestimate the total environmental costs on society. An improved approach would scale a compensation payment based on the multiple economic benefits eelgrass provides (thus offsetting the welfare loss), rather than focusing exclusively on fish, which represents only 25% of the economic benefits estimated in this analysis.
Fish Production
Previous valuation studies of seagrasses have focused almost exclusively on a single function: provision of nursery and feeding habitat for fish production. Our study estimates the commercial value of Atlantic cod, whiting and polloch. Estimates may appear low but this is due to high natural mortality of juveniles and relatively low market prices (equivalent to ~2100 US$ ha−1). We also include value for small wrasses (~3100 US$ ha−1), which obtain a high price in the aquaculture market, where they are used to remove ectoparasites from salmon. We consider the value of fish production in Swedish eelgrass beds to be conservative for several reasons. First, we only value 5 of the 41 species of fish that rely on eelgrass beds on the Swedish northwest coast during some stage of their life-cycle (Pihl et al., 2006). Economically important eel, herring, and sea trout are excluded due to lack of data. We also exclude commercial species that do not use eelgrass habitats directly, but may benefit indirectly from the production of food in eelgrass beds, which is exported from the habitat during the winter when many species migrate to deeper unvegetated areas. Second, the estimated abundance and value of cod and the other gadoid fishes are likely low from an historic perspective considering that the biomass of these species has decreased by over 90% since the 1970s along the Swedish west coast due to overfishing (Svedäng and Bardon, 2003). Thus, the economic value provided by eelgrass beds' nursery function could increase substantially if these stocks recover. Importantly, we focus our assessment on commercial value, but a recent report suggests that if the enhanced fish production along the Swedish west coast (for e.g., cod and trout) were allocated instead to recreational sports fishermen (in which over 10% of the population participates), the benefits to society may be greater (Paulrud, 2008). Finally, our approach relies on price as a mechanism (proxy) for estimating economic value, which is only able to capture the portion of underlying value realized in a market (Fischer et al., 2011) and thus excludes non-use values the public may hold for fish. The fish production value could be improved by developing a bioeconomic model (see e.g., Rabassó and Hernández, 2015 for an example that empirically links seagrass degradation to commercial aquaculture value).
Using an annual value of fish production in Swedish eelgrass to compare the results with estimates from other seagrass systems, we find that the total commercial value of the five fish species valued in our analysis (equivalent to ~400 US$ ha−1 year−1) is within the same range as the total commercial value of 25 fish species extracted from seagrass habitats at the island of Gran Canaria in Europe (866 € ha−1 year−1; equivalent to 771 US$ ha−1 year−1; Tuya et al., 2014), the commercial value of three shrimp species found in seagrasses in Queensland, Australia [183–3687 A$ ha−1 year−1 or 232–4675 US$ ha−1 year−1, inflated with the CPI; US Bureau of Labor Statistics (BLS), 2015; Watson et al., 1993], and the average value of commercial and recreational fish and invertebrates using seagrasses in South Australia (133 A$ ha−1 year−1 or 129 US$ ha−1 year−1; inflated with the CPI, McArthur and Boland, 2006). However, our values are lower than a recent estimate of the total commercial value of 13 fish species using seagrasses in South Australia (230,000 A$ ha−1 year−1 or 178,000 US$ ha−1 year−1; Blandon and Zu Ermgassen, 2014).
Carbon Sequestration and Climate Mitigation
The importance of seagrasses in the role for uptake and long-term storage of carbon has recently gained much attention, with most of the available literature focusing on sequestration rates of different species (e.g., Duarte et al., 2005; Fourqurean et al., 2012; Macreadie et al., 2014). However, relatively few studies have assessed the monetary value of carbon sequestration in seagrasses (but see Mangi et al., 2011; Pendleton et al., 2012; Luisetti et al., 2013), limiting comparison with the present. Mangi et al. (2011) assessed the value of climate mitigation by seagrasses on the Isles of Scilly, UK, based only on carbon fixation rates in seagrasses (as a proxy for sequestration), obtaining an annual monetary value of approximately 77 £ha−1 year−1 (or 130 US$ ha−1 year−1 inflated using the CPI), which is similar to the present annualized value found in this study (~280 US$ ha−1 year−1). However, in the present study we also took into account the carbon stored in the top 25 cm of the eelgrass, which constituted 82% of the annual value, and 33% of the total value over a 50 year time period (i.e., approximately 6000 US$). Thus, the carbon found in the sediment of old eelgrass beds constitute significant part of the total carbon sink (Fourqurean et al., 2012; Duarte et al., 2013) and should be included in valuation studies of climate mitigation when the sediment is expected to erode (Pendleton et al., 2012). In the present study we used a conservative estimate assuming that only 25 cm of the sediment would erode, due to lack of data for eelgrass. In comparison, Pendleton et al. (2012) assumed that 100 cm of sediment would erode in a recent attempt to estimate the global emission of carbon from degraded seagrass beds. Thus, the value of climate regulation from Swedish eelgrass beds may increase as data become available on carbon content and erosion depth of the sediment.
The SCC is a well-accepted method for estimating welfare impacts from carbon emissions. Although it is subject to a variety of uncertain ecological and economic assumptions in existing climate models, it represents the best available monetary valuation approach (Revesz et al., 2014). Our value of 127 US$ per ton of carbon lies within the interval seen in other studies, which range from 5 to 312 US$ per ton of carbon (see Table 5 footnotes).
Nitrogen Regulation
Our analysis indicates that nitrogen uptake provides the highest value of the ecosystem services assessed (equivalent to approximately 9500 US$ ha−1 or 46% of total value). However, because little is presently known about burial and long-term storage of nitrogen in eelgrass sediment (Romero et al., 2006) we used a conservative approach for estimating the ecological endpoint that underlies this value, based on nitrogen accumulation estimates from recently restored eelgrass beds (which have lower capacity for trapping organic material and nutrients than an older beds) and only includes the top 5 cm of the sediment, due to limitation of available data. If we had data to support nitrogen accumulation and erosion down to 25 cm depth (as was used for carbon sequestration) the value of nitrogen regulation would nearly triple to over 24,500 US$ ha−1. Due to discounting, a 50 year horizon for nitrogen instead of the 20 used in this study would only increase our estimate by 25%, to ~10,300 US$ ha−1. Importantly, the average cost of feasible nutrient abatement measures used in this study shows significant variation (22–435 SEK ha−1) suggesting that local values for eelgrass beds may differ by 20-fold between watersheds. Since nutrient pollution and uptake by eelgrass often occur on a local scale, and since both the capacity of eelgrass to accumulate nutrients and the cost of undertaking equivalent measures can vary strongly between watersheds, it is important to consider qualitative adjustments based on how local factors influence our average value estimates for nutrient regulation [see “Spatial (local) affects on values” below]. Further, we assume managers select the least cost option from among the feasible alternatives, but if more costly options are selected due to e.g., ancillary recreational benefits, our approach may overestimate nitrogen values. Thus, the next step in improving our valuation approach could be to use a watershed-specific model for estimating spatially explicit “least cost” estimates (e.g., Hasler et al., 2014).
Given that nutrient regulation is the most valuable ecosystem service in our study, it is somewhat surprising that it has received so little attention in the seagrass literature, which has focused primarily on fish production and, more recently, carbon sequestration. To the best of our knowledge, the only other similar value estimate in the literature is a global estimate of nutrient cycling by seagrass/algae beds of approximately 26,200 US$ ha−1 (Costanza et al., 2014), which also used a replacement cost approach. However, this may be considered a less robust estimate given the study's “local to global” extrapolation of values.
There are several implications of this study's cost-based approach for capturing nitrogen uptake. Besides being less rigorous from a welfare economics perspective, the values are somewhat challenging to interpret. Our estimates suggests that some local governments are willing to incur costs but does not say whether some individuals may, in fact, be willing to incur greater costs. If so, we are likely under-estimating nitrogen reduction values, all else equal. Alternatively, if the “political willingness to pay” costs used in this study are, in fact, higher than what individual citizens are willing to pay, we may be over-estimating nitrogen reduction values, all else equal.
Further, we cannot be sure which welfare benefits a government had in mind when deciding to undertake nitrogen-reduction measures (e.g., direct benefits from improved water clarity, and/or indirect benefits such as simultaneous reductions in other environmental contaminants). As such, cannot say for certain what type of value we have captured nor what it implies about our subsequent welfare after the measure has been undertaken. Note further that the current approach assumes that the value of nitrogen retention (1) goes up when we put more nitrogen in the system (the absolute cost of removal increases, even if marginal cost may decline) and (2) goes down when we remove nitrogen from the system or we become more technologically efficient at creating human substitutes for nitrogen-reduction (see e.g., Notte et al., 2012).
Importantly, even if we could isolate WTP for water clarity under the ideal valuation approach described in the Materials and Methods section, we cannot add this to our cost-based estimates due to double counting (nitrogen reduction measures likely capture water clarity improvement) and methodological concerns (e.g., mixing two fundamentally different valuation methods, see Freeman et al., 2014). However, if data existed it is possible to present “side-by-side” value-based and cost-based estimates as an informal validity check. That is, these valuation approaches complement each other in the sense that they both provide evidence of a WTP for economic goods that are dependent on eelgrass ecosystems.
Spatial (Local) Affects on Values
The estimated marginal values in this study are designed for use along the Swedish northwest coast to capture the value of losing/gaining one (marginal) additional hectare out of many. A truly robust marginal value, however, would require information on the current and future baseline condition of a resource, how a given action/policy may affect this over time, how individuals experience a specific valuation scenario and how spatial variables affect values (Turner et al., 2010). Therefore, our estimate is more accurately considered an “average marginal” value that attempts to “average-out” these various factors, which affect the benefits provided to society.
To improve the relevance and accuracy of our estimates for specific policy applications in specific coastal areas/harbors, we suggest consideration of some basic “rules of thumb.” For eelgrass, there are several contextual variables that could have large effects on the local per-hectare value for all ecosystem functions, with carbon sequestration being an obvious exception given that it provides global benefits. In general, an eelgrass bed will have a higher economic value if the ecosystem function is “locally limiting” for the production of the ecosystem service, and/or if the economic good is in short supply. For example, if nursery habitats for juvenile cod are in short supply in a region and limiting for the recruitment of cod, the eelgrass bed will have a higher value than in an area with a surplus of nursery habitats. Similarly, the value of nutrient accumulation of eelgrass will be higher in a watershed that requires expensive nutrient abatement measures than in an area that does not require any measures (e.g., is already in compliance with water quality standards), or where the available abatement measures are less expensive to implement. An eelgrass bed that improves the water clarity locally (e.g., by decreasing sediment resuspension) will also have a higher value in an area where the demand for clear swimming water is high and in short supply, than in an area with little demand, far away from cities and tourists. This type of qualitative adjustment will strengthen environmental decision-making by identifying beds that provide disproportionally greater or lesser value than others.
Estimating Ecological Impact and Monetary Value of Historic Losses (1995–2015)
The per hectare estimates in this study can be used for a rough assessment of the impact on ecosystem functions and potential social welfare loss associated with the documented decline in eelgrass along the Swedish northwest coast. While we recommend that the monetary estimates in this study are used primarily for policy assessment at the margin rather than large-scale changes in the resource, applying the estimates to this historic loss nonetheless underscores society's dependence on this ecosystem and highlights the instrumental values at stake. Caution is warranted, however, when interpreting and using this historic value loss for two reasons: (1) we are valuing a large 60% change (loss) in the resource using an estimate that assumes a small marginal change and (2) we are extrapolating an average value that fails to capture context-dependent variables (see Bockstael et al., 2000 critique of the Costanza et al., 1997 paper).
The document 60% loss of eelgrass from the Swedish northwest coast since the 1980s (Baden et al., 2003; Nyqvist et al., 2009) is equivalent to approximately 11,500 ha (Moksnes et al., 2016). Assuming the loss occurs instantly in 1990 (the actual loss pattern is unknown), and using our per hectare ecological endpoints from Table 2, we estimate that the eelgrass decline between 1990 and 2015 resulted in a total loss of ~9000 tons of gadoid fish catches, 197 million wrasses, and 422,000 and 6000 tons of sequestered carbon and nitrogen, respectively. To put these numbers in perspective, the total loss of cod catches resulting from the loss of eelgrass (7650 tons) is similar to the total 2013 annual catch of cod in Swedish waters (7895 tons), which includes the Baltic Sea (SwAM, 2012). The total loss of carbon and nitrogen storage is ~10 and 3 times larger than the annual river supply of organic carbon and nitrogen to the Swedish northwest coast (~44,000 and 2500 tons, respectively, Skagerrak in 2012; SIME, 2014). Thus, the loss of eelgrass has had a substantial impact on fish production and the recycling of carbon and nitrogen along Swedish northwest coast. That changes in eelgrass cover can have large effects on the recruitment of cod stocks is supported by an increasing number of studies (Warren et al., 2010; Lilley and Unsworth, 2014).
Based on our per hectare value estimates and the historic loss of eelgrass, the total nominal value associated with the lost economic goods is approximately 3.1 billion SEK (378 mil. US$). This includes a range of 0.62–8.3 SEK that accounts for varying assumptions about the price of fish, carbon, and nitrogen; and the actual size of the historic loss (Moksnes et al., 2016). However, this monetary estimate is not adjusted to reflect the fact that the impact on human well-being (i.e., value) depends, in part, on when an economic good or service is consumed or experienced. If we compensate for the time that these economic goods were not (historically) available to society by compounding the historic lost value at a 4% rate (the same rate used for discounting future values), the total net present value is approximately 5.2 billion SEK (with a range of 1.0–13.8 SEK) for the period 1990–2015.
Limitations and Future Research
In addition to the specific limitations relating to ecological endpoints and valuation of the three economic goods, there are also some general risks and uncertainties associated with our analysis. First, the use of a single monetary figure may suggest a false precision, which would under-state the uncertainty and lead decision-makers to mis-interpret the nuances and limitations of these estimates. Further, the current state of knowledge requires that we simplify complex ecological systems into single economic goods that we are able to value. By failing to capture the inherent complexity, such as tipping points and thresholds over or under which certain ES are no longer provided, our valuation estimates may represent proxies at best, or imprecise and variable estimates at worst. Finally, our valuation scenario—the conversion (loss) of one hectare of eelgrass to bare sediment—is a necessary but subjective assumption that affects our value estimate. It may overestimate losses if e.g., another vegetative habitat eventually colonizes the lost eelgrass area and can provide some non-zero level of services related to fish production or carbon/nitrogen uptake.
Continued work in this area will likely improve our ability to measure economic damages from climate change and the WTP to avoid nutrient pollution by better capturing the value of these externalities in the price of carbon and nitrogen. Future research should develop more information on (1) the geographic scale of eelgrass functions (e.g., fish habitat, nutrient uptake, sediment stabilization, etc.), (2) how these link and contribute in a meaningful way to our welfare and (3) how to defensibly aggregate the values of the multiple and subsequent economic goods.
Conflict of Interest Statement
The authors declare that the research was conducted in the absence of any commercial or financial relationships that could be construed as a potential conflict of interest.
Acknowledgments
This research was funded by grants from the Swedish Research Council FORMAS (contract no. 212-2011-758) and the Swedish Agency for Marine and Water Management (contract no. 2283-14) to PM and L. Gipperth, and is part of the interdisciplinary research program ZORRO (www.gu.se/zorro). In addition to two anonymous reviewers, we would also like to thank seminar participants at the 2013 CERF conference in San Diego. Special thanks to Tore Söderqvist (Enveco) and Robert W. Paterson (Industrial Economics, Inc) for their input on the conceptual approach.
References
Alcamo, J., and Bennett, E. M. (2003). Ecosystems and Human Well-Being: A Framework for Assessment / Millennium Ecosystem Assessment. Washington, DC: Island Press. Available online at: http://pdf.wri.org/ecosystems_human_wellbeing.pdf
Arkema, K. K., Verutesa, G. M., Wood, S. A. Clarke-Samuelsc, C., Rosadoc, S., Guerry, A. D., et al. (2015). Embedding ecosystem services in coastal planning leads to better outcomes for people and nature. Proc. Natl. Acad. Sci. U.S.A. 112, 7390–7395. doi: 10.1073/pnas.1406483112
Baden, S., Emanuelsson, A., Pihl, L., Svensson, C.-J., and Åberg, P. (2012). Shift in seagrass food web structure over decades is linked to overfishing. Mar. Ecol. Prog. Ser. 451, 61–73. doi: 10.1579/0044-7447-32.5.374
Baden, S., Gullström, M., Lundén, B., Pihl, L., and Rosenberg, R. (2003). Vanishing seagrass (Zostera marina, L.) in Swedish coastal waters. Ambio 32, 374–377. doi: 10.1579/0044-7447-32.5.374
Barbier, E. B., Hacker, S. D., Kennedy, C., Koch, E. W., Stier, A. C., and Silliman, B. R. (2010). The value of Estuarine and Coastal ecosystem services. Ecol. Monogr. 81, 169–193. doi: 10.1890/10-1510.1
Bateman, I. J., Harwood, A. R., Abson, D. J., Andrews, B., Crowe, A., Dugdale, S., et al. (2013). Economic analysis for the UK national ecosystem assessment: synthesis and scenario valuation of changes in ecosystem services. Environ. Resour. Econ. 57, 273–297. doi: 10.1007/s10640-013-9662-y
Beaudoin, Y., and Pendelton, L. (2012). Why Value the Oceans? A Discussion Paper. Available online at: http://img.teebweb.org/wp-content/uploads/2013/04/2013-TEEB-for-Oceans-Discussion-Paper.pdf
Bertelli, C. M., and Unsworth, R. K. F. (2014). Protecting the hand that feeds us: seagrass (Zostera Marina) serves as commercial juvenile fish habitat. Mar. Pollut. Bull. 83, 425–429. doi: 10.1016/j.marpolbul.2013.08.011
Blandon, A., and Zu Ermgassen, P. S. (2014). Quantitative estimate of commercial fish enhancement by seagrass habitat in southern Australia. Estuar. Coast. Shelf Sci. 141, 1–8. doi: 10.1016/j.ecss.2014.01.009
Bockstael, N. E., Freeman, A. M., Kopp, R. J., Portney, P. R., and Smith, V. K. (2000). On measuring economic values for nature†. Environ. Sci. Technol. 34, 1384–1389. doi: 10.1021/es990673l
Börger, T., Beaumont, N. J., Pendleton, L., Boyle, K. J., Cooper, P., Fletcher, S., et al. (2014). Incorporating ecosystem services in marine planning: the role of valuation. Mar. Policy 46, 161–170. doi: 10.1016/j.marpol.2014.01.019
Boström, C., Baden, S., Bockelmann, A.-C., Dromph, K., Fredriksen, S., Gustafsson, C., et al. (2014). Distribution, structure and function on Nordic eelgrass (Zostera marina) ecosystems: implications for costal management and conservation. Aquat. Conserv. Mar. Freshw. Ecosyst. 24, 410–434. doi: 10.002/aqc.2424
Boyd, J. W. (2007). The endpoint problem. Resour. J. Resour. Future 165, 26–28. Available online at: http://www.rff.org/files/sharepoint/WorkImages/Download/RFF-Resources-165_EndpointProblem.pdf
Brenner, J., Jiménez, J. A., Sardá, R., and Garola, A. (2010). An assessment of the non-market value of the ecosystem services provided by the Catalan Coastal Zone, Spain. Ocean Coast. Manag. 53, 27–38. doi: 10.1016/j.ocecoaman.2009.10.008
Cardinale, M., and Svedäng, H. (2004). Modelling recruitment and abundance of Atlantic cod, Gadus morhua, in the eastern Skagerrak–Kattegat (North Sea): evidence of severe depletion due to a prolonged period of high fishing pressure. Fish. Res. 69, 263–282. doi: 10.1016/j.fishres.2004.04.001
Cole, S. G. (2011). Wind power compensation is not for the birds: an opinion from an environmental economist. Restor. Ecol. 19, 147–153. doi: 10.1111/j.1526-100X.2010.00771.x
Costanza, R., de Groot, R., Sutton, P., van der Ploeg, S., Anderson, S. J., Kubiszewski, I., et al. (2014). Changes in the global value of ecosystem services. Glob. Environ. Change 26, 152–158. doi: 10.1016/j.gloenvcha.2014.04.002
Costanza, R., d'Arge, R., de Groot, R., Fletcher, S., Grasso, M., Hannon, B., Limburg, K., et al. (1997). The value of the world's ecosystem services and natural capital. Nature 387, 253–260.
Cullen-Unsworth, L. C., Nordlund, L. M., Paddock, J., Baker, S., McKenzie, L. J., and Unsworth, R. K. F. (2014). Seagrass meadows globally as a coupled social–ecological system: implications for human wellbeing. Mar. Pollut. Bull. 83, 387–397. doi: 10.1016/j.marpolbul.2013.06.001
Dasgupta, P. (2008). Discounting climate change. J. Risk Uncertain. 37, 141–169. doi: 10.1007/s11166-008-9049-6
Davidson, M. D. (2013). On the relation between ecosystem services, intrinsic value, existence value and economic valuation. Ecol. Econ. 95, 171–177. doi: 10.1016/j.ecolecon.2013.09.002
Delgado, L. E., and Marín, V. H. (2015). Ecosystem services: where on earth? Ecosyst. Serv. 14, 24–26. doi: 10.1016/j.ecoser.2015.03.002
Duarte, C. M., and Cebrian, J. (1996). The fate of marine autotrophic production. Limnol. Oceanogr. 41, 1758–1766.
Duarte, C. M., Middelburg, J. J., and Caraco, N. (2005). Major role of marine vegetation on the oceanic carbon cycle. Biogeosciences 2, 1–8. doi: 10.5194/bg-2-1-2005
Duarte, C. M., Sintes, T., and Marba, N. (2013). Assessing the CO2 capture potential of seagrass restoration projects. J. Appl. Ecol. 50, 1341–1349. doi: 10.1111/1365-2664.12155
EEB (European Environmental Bureau). (2014). EEB Priorities for ‘EU No Net Loss Initiative.’ Bryssels: EEB. Available online at: http://www.eeb.org/?LinkServID=AE82914E-5056-B741-DB98744CF8393912&showMeta=0&aa
Eggert, H. (2015). “Homo economicus meets homo politicus: a comparison between preferences of EPA bureaucrats, recreational anglers, and the public,” in European Association of Environmental and Resource Economists, EAERE (Helsinki), 25–28.
Eggert, H., and Olsson, B. (2009). Valuing multi-attribute marine water quality. Mar. Policy 33, 201–206. doi: 10.1016/j.marpol.2008.05.011
EUMOFA (European Market Observatory for Fisheries Aquaculture). (2013). Case Study: Price Structure in the Supply Chain for Fresh Cod in United Kingdom. EUMOFA. Available online at: https://www.eumofa.eu/eumofa-publications;jsessionid=23F573565AA053B37568ED161BC667EF?p_p_id=58&p_p_lifecycle=0&p_p_state=normal&_58_struts_action=%2Flogin%2Fforgot_password
European Commission. (2011). Our Life Insurance, Our Na Tural Capital: An EU Biodiversity Strategy to 2020. Text/html; charset=UTF-8. Available online at: http://eur-lex.europa.eu/legal-content/EN/TXT/HTML/?uri=CELEX:52011DC0244&from=EN
European Parliament. (2012). Our Life Insurance, Our Natural Capital: An EU Biodiversity Strategy to 2020. 2011/2307(INI)). Brussels.
Farber, S., Costanza, R., Childers, D. L., Erickson, J., Gross, K., Grove, M., et al. (2006). Linking ecology and economics for ecosystem management. BioScience 56, 121–133. doi: 10.1641/0006-3568(2006)056[0121:LEAEFE]2.0.CO;2
Fischer, B., Bateman, I., and Turner, R. K. (2011). “Valuing ecosystem services: benefits, values, space and time,” in Working Paper Series No. 3, Ecosystem Services Economics, (Nairobi: UN Env Prog). Available online at: http://www.bioecon-network.org/pages/UNEP_publications/03%20Valuing%20Ecosystem%20Services.pdf
Fourqurean, J.W., Duarte, C.M., Kennedy, H., Marbà, N., Holmer, M., Angel Mateo, M., et al. (2012). Seagrass ecosystems as a globally significant carbon stock. Nat. Geosci. 5, 505–509. doi: 10.1038/ngeo1477
Francis, J. M. (2012). Linking Ecological Function and Ecosystem Service Values of Estaurine Habitat Types Associated with a Barrier Island System. Thesis. Available online at: http://oaktrust.library.tamu.edu/handle/1969.1/148325
Fredriksen, S., Christie, H., and Andre Sæthre, B. (2005). Species richness in macroalgae and macrofauna assemblages on Fucus serratus L. (Phaeophyceae) and Zostera marina L. (Angiospermae) in Skagerrak, Norway. Mar. Biol. Res. 1, 2–19. doi: 10.1080/17451000510018953
Freeman, A. M., Herriges, J. A., and Kling, C. L. (2014). The Measurement of Environmental and Resource Values: Theory and Methods, 3rd Edn. New York, NY: RFF Press.
Gosselink, J. H., Odum, E. P., and Pope, R. M. (1974). The Value of the Tidal Marsh. Center for Wetland Resources, Louisiana State University.
Guerry, A. D., Polasky, S., Lubchenco, J., Chaplin-Kramer, R., Daily, G. C., Griffin, R., et al. (2015). Natural capital and ecosystem services informing decisions: From promise to practice. Proc. Natl. Acad. Sci. U.S.A. 112, 7348–7355. doi: 10.1073/pnas.1503751112
Hasler, B, Smart, J. C. R., Fonnesbech-Wulff, A., Andersen, H. E., Thodsen, H., Mathiesen, G. B., et al. (2014). Hydro-economic modelling of cost-effective transboundary water quality management in the Baltic Sea. Water Resour. Econ. 5, 1–23. doi: 10.1016/j.wre.2014.05.001
HELCOM (2010). “Ecosystem health of the Baltic Sea. HELCOM Initial Holistic Assessment 2003-2007,” in Baltic Sea Environmental Proceedings 122 (Helsinki Commission), 63.
Hendriks, I. E., Sintes, T., Bouma, T. J., and Duarte, C. M. (2008). Experimental assessment and modeling evaluation of the effects of seagrass (Posidonia oceanica) on flow and particle trapping. Mar. Ecol. Prog. Ser. 356, 163–173. doi: 10.3354/meps07316
ICES (2013). Report of the Working Group on Assessment of Demersal Stocks in the North Sea and Skagerrak (WGNSSK), 24–30 April 2013, Copenhagen.
Imelda, H. (2003). Age, Growth and Reproductive Biology of Whiting Merlangius merlangus (Linnaeus 1758) in the Celtic Sea. Master Thesis, Galway-Mayo Institute of Technology.
Jackson, E. L., Rees, S. E., Wilding, C., and Attrill, M. J. (2015). Use of a seagrass residency index to apportion commercial fishery landing values and recreation fisheries expenditure to seagrass habitat service. Conserv. Biol. J. Soc. Conserv. Biol. 29, 899–909. doi: 10.1111/cobi.12436
Johnston, R. J. (2002). Valuing estuarine resource services using economic and ecological models: the peconic estuary system study. Coast. Manag. 30, 47–65. doi: 10.1080/08920750252692616
Just, R. E., Hueth, D. L., and Schmitz, A. (eds.). (2005). The Welfare Economics of Public Policy: A Practical Approach to Project And Policy Evaluation. Cheltenham: Edward Elgar Pub.
Keeler, B. L., Polasky, S., Brauman, K. A., Johnson, K. A., Finlay, J. C., O'Neill, A., et al. (2012). Linking water quality and well-being for improved assessment and valuation of ecosystem services. Proc. Natl. Acad. Sci. U.S.A. 109, 18619–18624. doi: 10.1073/pnas.1215991109
Kim, Y., and Kling, C. L. (2015). Understanding behavioral explanations of the WTP-WTA divergence through a neoclassical lens: implications for environmental policy. Annu. Rev. Resour. Econ. 7, 169–187. doi: 10.1146/annurev-resource-100913-012501
Kragt, M., and Bennett, J. (2009). Using Choice Experiments to Value River and Estuary Health in Tasmania with Individual Preference Heterogeneity. Environmental Economics Research Hub Research Reports. Environmental Economics Research Hub, Crawford School of Public Policy, The Australian National University. Available online at: http://econpapers.repec.org/paper/eeneenhrr/0916.htm
Kristiansen, T. S. (2001). Stage- and Size-dependent Mortality of Reared and Wild Cod (Gadus morhua L.). Ph.D. thesis, University of Bergen, Norway.
Kumar, P. (2010). The Economics of Ecosystems and Biodiversity (TEEB) Ecological and Economic Foundations. TEEB. Available online at: http://www.teebweb.org/publication/the-economics-of-ecosystems-and-biodiversity-teeb-ecological-and-economic-foundations/
Lilley, R. J., and Unsworth, R. K. F. (2014). Atlantic Cod (Gadus morhua) benefits from the availability of seagrass (Zostera marina) nursery habitat. Glob. Ecol. Conserv. 2, 367–377. doi: 10.1016/j.gecco.2014.10.002
Liquete, C., Piroddi, C., Drakou, E. G., Gurney, L., Katsanevakis, S., Charef, A., et al. (2013). Current status and future prospects for the assessment of marine and coastal ecosystem services: a systematic review. PLoS ONE 8:e67737. doi: 10.1371/journal.pone.0067737
Luisetti, T., Jackson, E. L., and Turner, R. K. (2013). Valuing the European ‘coastal blue carbon’storage benefit. Mar. Pollut. Bull. 71, 101–106. doi: 10.1016/j.marpolbul.2013.03.029
Mace, G., and Bateman, I. (2011). UK National Ecosystem Assessment. Chapter 2: Conceptual Framework and Methodology. Available online at: http://uknea.unep-wcmc.org/LinkClick.aspx?fileticket=KSXkgw7AKSY%3d&tabid=82
Macreadie, P. I., Baird, M. E., Trevathan-Tackett, S. M., Larkum, A. W. D., and Ralph, P. J. (2014). Quantifying and modelling the carbon sequestration capacity of seagrass meadows – a critical assessment. Mar. Pollut. Bull. 83, 430–439. doi: 10.1016/j.marpolbul.2013.07.038
Maes, J., Egoh, B., Willemen, L., Liquete, C., Vihervaara, P., Schägner, J. P., Grizzetti, B., et al. (2012). Mapping ecosystem services for policy support and decision making in the European Union. Ecosyst. Serv. 1, 31–39. doi: 10.1016/j.ecoser.2012.06.004
Mangi, S. C., Davis, C. E., Payne, L. A., Austen, M. C., Simmonds, D., Beaumont, N. J., et al. (2011). Valuing the regulatory services provided by marine ecosystems. Environmetrics 22, 686–698. doi: 10.1002/env.1095
McArthur, L. C., and Boland, J. W. (2006). The economic contribution of seagrass to secondary production in South Australia. Ecol. Model. 196, 163–172. doi: 10.1016/j.ecolmodel.2006.02.030
McGlathery, K. J., Reynolds, L. K., Cole, L. W., Orth, R. J., Marion, S. R., and Schwarzschild, A. (2012). Recovery trajectories during state change from bare sediment to eelgrass dominance. Mar. Ecol. Prog. Ser. 448, 209–221. doi: 10.3354/meps09574
Moilanen, A., Van Teeffelen, A. J. A., Ben-Haim, Y., and Ferrier, S. (2009). How much compensation is enough? a framework for incorporating uncertainty and time discounting when calculating offset ratios for impacted habitat. Restor. Ecol. 17, 470–478. doi: 10.1111/j.1526-100X.2008.00382.x
Moksnes, P.-O., Gipperth, L., Eriander, L., Laas, K., Cole, S., and Infantes, E. (2016). Guidebook for Eelgrass Restoration Along the Swedish West Coast (in Swedish). Swedish Agency for Marine and Water Management Report.
Moksnes, P.-O., Gullström, M., Tryman, K., and Baden, S. (2008). Trophic cascades in a temperate seagrass community. Oikos 117, 763–777. doi: 10.1111/j.0030-1299.2008.16521.x
Naber, H. (2008). Valuation of Marine Ecosystem Services: A Gap Analysis. UNEP/WCMC, The World Bank, The Earth Institute, Columbia University.
NOAA (National Oceanic Atmospheric Administration). (1999). Discounting and the Treatment of Uncertainty in Natural Resource Damage Assessment. Technical Paper 99-1, Damage Assessment and Restoration Program, Silver Spring, MD.
Notte, A. L., Maes, J., Grizzetti, B., Bouraoui, F., and Zulian, G. (2012). Spatially explicit monetary valuation of water purification services in the mediterranean bio-geographical region. Int. J. Biodivers. Sci. Ecosyst. Serv. Manag. 8, 26–34. doi: 10.1080/21513732.2011.645557
Nyqvist, A., André, C., Gullström, M., Baden, S., and Åberg, P. (2009). Dynamics of seagrass meadows on the Swedish Skagerrak coast. Ambio 38, 85–88. doi: 10.1579/0044-7447-38.2.85
Olander, L., Johnston, R. J., Tallis, H., Kagan, J., Maguire, L., Polasky, S., et al. (2015). Best Practices for Integrating Ecosystem Services into Federal Decision Making. National Ecosystem Services Partnership, Duke University, Durham.
Orth, R. J., Carruthers, T. J. B., Dennison, W. C., and Duarte, C. M. (2006). A global crisis for seagrass ecosystems. Bioscience 56, 987–996. doi: 10.1641/0006-3568(2006)56[987:AG
Orth, R. J., Moore, K. A., Marion, S. R., Wilcox, D. J., and Parrish, D. B. (2012). Seed addition facilitates eelgrass recovery in a coastal bay system. Mar. Ecol. Prog. Ser. 448, 177–195. doi: 10.3354/meps09522
Palmer, M. A., and Filoso, S. (2009). Restoration of ecosystem services for environmental markets. Science 325, 575–576. doi: 10.1126/science.1172976
Paulrud, A. (2008). Fritidsfiske Och Fritidsfiskebaserad Verksamhet - Publikationer - Havs- Och Vattenmyndigheten. Text. Available online at: https://www.havochvatten.se/hav/uppdrag–kontakt/publikationer/aldre-publikationer/ovriga-publikationer-fran-fiskeriverket/2012-02-07-fritidsfiske-och-fritidsfiskebaserad-verksamhet.html
Pearce, D. (2003). The social cost of carbon and its policy implications. Oxf. Rev. Econ. Policy 19, 362–384. doi: 10.1093/oxrep/19.3.362
Pendleton, L., Donato, D. C., Murray, B. C., Crooks, S., Jenkins, W. A., Sifleet, S., et al. (2012). Estimating global “blue carbon” emissions from conversion and degradation of vegetated coastal ecosystems. PLoS ONE 7:e43542. doi: 10.1371/journal.pone.0043542
Piehler, M. F., and Smyth, A. R. (2011). Habitat-specific distinctions in estuarine denitrification affect both ecosystem function and services. Ecosphere 2:art12. doi: 10.1890/ES10-00082.1
Pihl, L., Baden, S., Kautsky, N., Rönnbäck, P., Söderqvist, T., Troell, M., et al. (2006). Shift in fish assemblage structure due to loss of seagrass Zostera marina habitats in Sweden. Estuarine, Coastal and Shelf Science 67, 123–132. doi: 10.1016/j.ecss.2005.10.016
Pihl, L., Isaksson, I., Wennhage, H., and Moksnes, P.-O. (1995). Recent increase of filamentous algae in shallow Swedish bays: effects on the community structure of epibenthic fauna and fish. Netherland J. Aquat. Ecol. 29, 349–358.
Pihl, L., Svenson, A., Moksnes, P.-O., and Wennhage, H. (1999). Distribution and production of ephemeral algae in shallow coastal areas on the Swedish west coast. J. Sea Res. 41, 281–294. doi: 10.1016/S1385-1101(99)00004-0
Plummer, M. L., Harvey, C. J., Anderson, L. E., Guerry, A. D., and Ruckelshaus, M. H. (2012). The role of eelgrass in marine community interactions and ecosystem services: results from ecosystem-scale food web models. Ecosystems 16, 237–251. doi: 10.1007/s10021-012-9609-0
Rabassó, M., and Hernández, J. M. (2015). Bioeconomic analysis of the environmental impact of a marine fish farm. J. Environ. Manage. 158:24–35. doi: 10.1016/j.jenvman.2015.04.034
Regeringskansliet. (2013). Synliggöra Värdet Av Ekosystemtjänster - Åtgärder För Välfärd Genom Biologisk Mångfald Och Ekosystemtjänster. Text. Regeringskansliet. Available online at: http://www.regeringen.se/rattsdokument/statens-offentliga-utredningar/2013/10/sou-201368/
Revesz, R. L., Howard, P. H., Arrow, K., Goulder, L. H., Kopp, R. E., Livermore, M. A., et al. (2014). Global warming: improve economic models of climate change. Nature 508, 173–175. doi: 10.1038/508173a
Richardson, L., Loomis, J., Kroeger, T., and Casey, F. (2015). The role of benefit transfer in ecosystem service valuation. Ecol. Econ. 115, 51–58. doi: 10.1016/j.ecolecon.2014.02.018
Romero, J., Lee, K. S., Pérez, M., Mateo, M. A., and Alcoverro, T. (2006). “Nutrient dynamics in seagrass ecosystems,” in Seagrasses: Biology, Ecology and Conservation, eds A. W. D. Larkum, R. J. Orth, and C. M. Duarte (Dordrechdt: Springer), 227–254. doi: 10.1007/1-4020-2983-7_9
Rönnbäck, P., Kautsky, N., Pihl, L., Troell, M., Söderqvist, T., and Wennhage, H. (2007). Ecosystem goods and services from Swedish coastal habitats: identification, valuation, and implications of ecosystem shifts. Ambio 36, 534–544. doi: 10.1579/0044-7447(2007)36[534:EGASFS]2.0.CO;2
SAB (Science Advisory Board). (2009). Valuing the Protection of Ecological Systems and Services: A Report of the EPA Science Advisory Board. EPA SAB 09 012. Washington, DC. Available online at: http://yosemite.epa.gov/sab%5CSABPRODUCT.NSF/F3DB1F5C6EF90EE1852575C500589157/$File/EPA-SAB-09-012-unsigned.pdf
Sandström, M. (1996). Recreational Benefits from Improved Water Quality: A Random Utility Model of Swedish Seaside Recreation. SSE/EFI Working Paper Series in Economics and Finance 121. Stockholm School of Economics. Available online at: https://ideas.repec.org/p/hhs/hastef/0121.html
SEPA (Swedish Environmental Protection Agency). (2003). Konsekvensanalys Steg För Steg. Handledning I Samhällsekonomisk Konsekvensanalys För Naturvårdsverket (Impact Assessment Step by Step. Guide to Socio-Economic Impact Analysis for the Swedish Environmental Protection Agency). Stockholm: Naurvårdsverket. Available online at: http://www.naturvardsverket.se/Documents/publikationer/620-5314-0.pdf?pid=2959
Shabman, L. A., and Batie, S. S. (1978). The economic value of coastal wetlands: a critique. Coast. Zone Manag. J. 4, 231–237.
Short, F. T., Burdick, D. M., Short, C. A., Davis, R. C., and Morgan, P. A. (2000). Developing success criteria for restored eelgrass, salt marsh and mud flat habitats. Ecol. Eng. 15, 239–252. doi: 10.1016/S0925-8574(00)00079-3
SIKA (Statens institut f;r kommunikationsanalys). (2009). Värden Och Metoder För Transport- Sektorns Samhällsekonomiska Analyser – ASEK 4 (Values and Methods for Sociioeconomic Analysis in the Transport Sector). SIKA Rapport 2009:3. Stockholm. Available online at: http://www.trafikverket.se/contentassets/f250787d665a41f6ad73f76c95b70c9a/asek_4_varden_metoder_transportsektorns_samhallsekonomiska_analyser_sr2009_3.pdf
Söderqvist, T., and Scharin, H. (2000). The Regional Willingness to Pay for a Reduced Eutrophication in the Stockholm Archipelago. Beijer.
Soutukorva, Å. (2005). The Value of Improved Water Quality A Random Utility Model of Recreation in the Stockholm Archipelago. SUCOZOMA Project 1.2.1. 2005: Beijer International Institute of Ecological Economics. Available online at: http://www.beijer.kva.se/PDF/49545339_artdisc135.pdf
Sperduto, M. B., Powers, S. P., and Donlan, M. (2003). Scaling restoration to achieve quantitative enhancement of loon, seaduck, and other seabird populations. Mar. Ecol. Prog. Ser. 264, 221–232. doi: 10.3354/meps264221
Stål, J., Paulsen, S., Pihl, L., Roönnbäck, P., Söderqvist, T., and Wennhage, H. (2008). Coastal habitat support to fish and fisheries in Sweden: integrating ecosystem functions into fisheries management. Ocean Coast. Manag. 51:594–600. doi: 10.1016/j.ocecoaman.2008.06.006
Stern, N. H. (2007). The Economics of Climate Change: The Stern Review. Cambridge, UK: Cambridge University Press. doi: 10.1017/CBO9780511817434
Svedäng, H., and Bardon, G. (2003). Spatial and temporal aspects of the decline in cod (Gadus morhua) abundance in the Kattegatt and eastern Skagerrak. J. Mar. Sci. 60, 32–37. doi: 10.1006/jmsc.2002.1330
SwAM (2012). Good Environmental Status 2012: Part 1. Swedish Agency of Marine and Water Management (in Swedish).
SwAM (2014). Swedish Sea-fisheries During 2013: Definitive data. Swedish Agency for Marine and Water Management Report.
Swedish Water Authority (SWA) (2015). VISS (Water Information System Sweden). Text. (Accessed July 2, 2015). Available online at: http://www.vattenmyndigheterna.se/En/Pages/maps-and-data.aspx
Tanner, J. E., Irving, A. D., Fernandes, M., Fotheringham, D., McArdle, A., and Murray-Jones, S. (2014). Seagrass Rehabilitation off Metropolitan Adelaide: A Case Study of Loss, Action, Failure and Success. Ecol. Manag. Restor. 15, 168–179. doi: 10.1111/emr.12133
TEEB (2010). Ecological and Economic Foundations. TEEB. Available online at: http://www.teebweb.org/our-publications/teeb-study-reports/ecological-and-economic-foundations/
Thorhaug, A. (1990). “Restoration of mangroves and seagrasses - economic benefits for fisheries and mariculture,” in Environmental Restoration: Science and Strategies for Restoring the Earth, ed J. J. Berger (Washington, DC: Island Press).
Tol, R. S. J. (2009). The economic effects of climate change. J. Econ. Perspect. 23, 29–51. doi: 10.1257/jep.23.2.29
Troell, M., Pihl, L., Rönnbäck, P., Wennhage, H., Söderqvist, T., and Kausky, N. (2005). Regime shifts and ecosystem services in Swedish coastal soft bottom habitats: when resilience is undesirable. Ecol. Soc. 10, 30
Turner, R. K., Morse-Jones, S., and Fisher, B. (2010). Ecosystem valuation: a sequential decision support system and quality assessment issues. Ann. N.Y. Acad. Sci. 1185, 79–101. doi: 10.1111/j.1749-6632.2009.05280.x
Tuya, F., Haroun, R., and Espino, F. (2014). Economic assessment of ecosystem services: monetary value of seagrass meadows for coastal fisheries. Ocean Coast. Manag. 96, 181–187. doi: 10.1016/j.ocecoaman.2014.04.032
US Bureau of Labor Statistics (BLS) (2015). Inflation Calculator: Bureau of Labor Statistics. (Accessed July 2, 2015). Available online at: http://www.bls.gov/data/inflation_calculator.htm
Vassallo, P., Paoli, C., Rovere, A., Montefalcone, M., Morri, C., and Bianchi, C. N. (2013). The value of the seagrass Posidonia Oceanica: a natural capital assessment. Mar. Pollut. Bull. 75, 157–167. doi: 10.1016/j.marpolbul.2013.07.044
Warren, M. A., Gregory, R. S., Laurel, B. J., and Snelgrove, P. V. R. (2010). Increasing density of juvenile Atlantic (Gadus morhua) and Greenland cod (G. ogac) in association with spatial expansion and recovery of eelgrass (Zostera marina) in a coastal nursery habitat. J. Exp. Mar. Biol. Ecol. 394, 154–160. doi: 10.1016/j.jembe.2010.08.011
Watson, R.A., Coles, R.G., and Lee Long, W. (1993). Simulation estimates of annual yield and landed value for commercial penaeid prawns from a tropical seagrass habitat, northern Queensland, Australia. Aust. J. Mar. Freshw. Res. 44, 211–219.
Keywords: Swedish northwest coast, double-counting, non-market valuation, fish production, nutrient regulation, social cost of carbon, ecological endpoints, Zostera marina
Citation: Cole SG and Moksnes P-O (2016) Valuing Multiple Eelgrass Ecosystem Services in Sweden: Fish Production and Uptake of Carbon and Nitrogen. Front. Mar. Sci. 2:121. doi: 10.3389/fmars.2015.00121
Received: 03 July 2015; Accepted: 21 December 2015;
Published: 13 January 2016.
Edited by:
Kristy Wallmo, Department of Commerce, USAReviewed by:
Chris J. Kennedy, George Mason University, USAPeter Edwards, National Oceanic and Atmospheric Administration, USA
Copyright © 2016 Cole and Moksnes. This is an open-access article distributed under the terms of the Creative Commons Attribution License (CC BY). The use, distribution or reproduction in other forums is permitted, provided the original author(s) or licensor are credited and that the original publication in this journal is cited, in accordance with accepted academic practice. No use, distribution or reproduction is permitted which does not comply with these terms.
*Correspondence: Scott G. Cole, scott@eesweden.com