Relating Mandates in the United States for Managing the Ocean to Ecosystem Goods and Services Demonstrates Broad but Varied Coverage
 Christy M. Foran
 Jason S. Link
 Wesley S. Patrick
 Leah Sharpe3
  Matthew D. Wood
- 1Environmental Laboratory, U.S. Army Engineer Research and Development Center, Concord, MA, USA
- 2NOAA Fisheries, Woods Hole, MA, USA
- 3NOAA Fisheries, Silver Spring, MD, USA
HIGHLIGHTS
• A complete catalog is presented of the legislative, executive and international mandates related to NOAA, as well as the subset of these relevant to NOAA-Fisheries.
• The ecosystem goods and services addressed by each NOAA mandate were assessed, as well as the overlap between the major mandates.
• The collective coverage across the suite of ecosystem goods and services is shown in comparison to the portfolio of mandates; differences in these profiles indicate a continued need for ecosystem-based management.
There are numerous ecosystem goods and services (EGS) provided by the ocean. There are also multiple mandates to address this suite of EGS. What facets of the ocean EGS does this portfolio of mandates collectively address? How are these mandates interrelated? Are there gaps in their coverage of EGS? Are there areas of reinforcement? To elucidate this set of issues, we characterize the portfolio of mandates that a leading governmental ocean agency, the National Oceanographic and Atmospheric Administration (NOAA), and the subset of those that one of its Line Offices, the National Marine Fisheries Service (NOAA-Fisheries), is responsible for implementing. We link these mandates to a suite of EGS, evaluating the relative degree that each mandate addresses each EGS. The weighted overlap across mandates with respect to EGS was also estimated. Of the nearly 100 NOAA mandates, and the subset of 50 NOAA-Fisheries mandates, there was broad coverage of ocean EGS. Food production, habitat provision, genetic resources, recreation, tourism, historical and heritage value, and knowledge and science value were the EGS that had the highest degree of coverage. All EGS had at least some mandate coverage, although some had a limited number of mandates associated with them. There was some reinforcement across mandates, particularly for the top EGS, suggesting that the multiple facets of these EGS are being reasonably well addressed. The large number of mandates and the importance of EGS they address suggest that some form of coordination is warranted, particularly via adoption of an ecosystem-based approach to management.
Introduction
The oceans provide numerous ecosystem goods and services (EGS; MEA, 2003, 2005; Halpern et al., 2008). The term “goods and services” has been used to identify those benefits people obtain from ecosystems, either directly or indirectly (MEA, 2003). These reflect the derived benefits for and from human activities that are based on the function, structure, resilience and production of the ocean. This suite of EGS includes provisioning (e.g., food, oil and gas production), supporting (habitat), regulating (carbon sequestration to reduce green-house gases), and cultural (recreation, aesthetic value) facets of what ocean ecosystems provide (MEA, 2003, 2005; Halpern et al., 2008). To maintain these EGS, some form of management of the ocean and its component features is required (Christensen et al., 1996; Leslie and McLeod, 2007; Link, 2010).
Managing natural resources in the ocean is an important trust. Countries have traditionally addressed management of ocean ecosystems on an issue-by-issue basis for particular EGS (Slocombe, 1993; Crowder et al., 2006; McLeod and Leslie, 2009). The result is a plethora of mandates that are independent of one another, and are usually implemented in similar fashion by distinct agencies that focus on specific goods and services. Considering agency resources are limited, the large number of objectives and authorities that any agency is responsible for implementing can be quite difficult to manage, and necessitates the prioritization of some objectives over others. Increasingly the fulfillment of these mandates, and specific objectives within each of them, requires an understanding of and trade-offs between multiple facets of EGS. There are myriad legislative actions, executive orders, conventions, treaties and related authorities, collectively termed mandates, which address various facets of management of the ocean and its EGS. There are nearly 100 (McFadden and Barnes, 2009; Link, 2010) such mandates in the U.S. However, there is very little analysis of the facets of the ocean EGS that these mandates may collectively address. That type of analysis is necessary to determine if there are gaps in their coverage of EGS, and how these mandates are interrelated.
This myopic approach to managing EGS through a suite of uncoordinated mandates has several disadvantages, which has led many countries to adopt a more holistic, ecosystem-based management approach (EBM) (Christensen et al., 1996; FAO, 2003; Pitcher et al., 2009). At its core, EBM is about recognizing that many EGS, and uses thereof, are competitive in nature (Link, 2010), to the point that progress toward one objective (e.g., food production) can often be at the expense of another (e.g., conserving habitat or genetic resources). The tradeoffs inherent in the implementation of EBM mandates should be elucidated in order to ensure that they align with current national priorities. Identification and characterization of these mandates is a critical first step as we continue the dialogue on authorities to better adopt EBM toward the end of wise, effective management of our ocean EGS.
To elucidate this issue, here we characterize the portfolio of mandates that the National Oceanographic and Atmospheric Administration (NOAA) and the subset of these mandates that one of its Line Offices, the National Marine Fisheries Service (NOAA-Fisheries), is responsible for implementing. As one of the leading agencies dealing with ocean resources, NOAA's mission is critical for identifying, forecasting, maintaining, conserving and protecting a diverse set of goods and services provided by the oceans of the United States. NOAA-Fisheries focuses on one sector of ocean uses but has a wide range of mandates as well. This Line Office is particularly exemplary in that, although it has a focused mission of managing living marine resources, the scope and breadth of those resources encapsulates a wide range of ocean processes, dynamics and functioning. Thus, the portfolio of mandates that NOAA and the subset that NOAA-Fisheries are required to implement should both be instructive and illustrative to examine in relation to a suite of EGS. To that end we address four objectives in this work: (1) to catalog and characterize all the ocean-oriented mandates that drive NOAA's mission; (2) expressly link these mandates to a suite of EGS that they inform; (3) evaluate the collective coverage of the suite of EGS by these mandates; and (4) explore the overlap among mandates for NOAA and NOAA-Fisheries according to the various EGS they address.
Methods
Applicable Mandates and Estimation of Relative Effort
To characterize the mandates of NOAA, we first compiled a comprehensive list of mandates that apply to this organization (Table 1), and the subset relevant to NOAA-Fisheries. The initial list of mandates was provided by NOAA's Office of General Counsel which maintains a catalog of the mandates affecting NOAA. That list was compared to and augmented from the literature that explored more limited facets of the topic (McFadden and Barnes, 2009; Fluharty, 2014). It was further augmented from discussions with several NOAA personnel, where corrections, additions and removals were made (Link, pers. comm.). The final list of mandates was evaluated and characterized based on the relevant EGS they protect. For each of these mandates, the major tasks and requirements are synthesized.
Table 1. A listing of NOAA relevant mandates.
The relative effort that the mandates require of NOAA or NOAA-Fisheries in order to comply with it was estimated with a score of 1–10. These scores were informed by examining several years of budget allocations within the agency, strategic plan documents, and discussions with some NOAA planning personnel. An effort score of 1 indicated that the mandate requires minimal effort, while an effort score of 10 indicated that a major emphasis of agency resources is needed to meet the requirements of the mandate. The scale was purposefully intended to be ordinal but imprecise; we acknowledge that the distinction between any set of contiguous scores (i.e., difference between a 2 and 3) is apt to be indistinguishable, but the distinction between scores at different parts of the scale should be (i.e., the difference between a 2 or 3 and 6 or 7, and certainly 9 or 10). For example, for NOAA the relative effort required to comply with the MSA was considered to be a 9. All of these scores were reviewed by NOAA experts (L. Letson, D. Lipton, R. Methot, R. Shuford, F. Schwing, M. Brady, M. Effron, all pers. comm.) and modified following those discussions.
Linking the NOAA Portfolio of Mandates to Ecosystem Goods and Services
A list of EGS was created based on the Millennial Ecosystem Assessment (MEA) (MEA, 2003, 2005). Many other EGS classification schemes exist (de Groot et al., 2002; Costanza, 2008), and several have been adopted for an ocean ecosystem context (e.g., NRC, 2004; Halpern et al., 2008, 2012; Scarlett and Boyd, 2011; Reed et al., 2013; O'Higgins and Gilbert, 2014). The main categories were modified to align them with the missions of NOAA and NOAA-Fisheries, resulting in the final list of ocean-oriented EGS grouped into four major types of services- provisioning, supporting, regulating, or cultural (Table 2).
Table 2. A listing of ocean ecosystem goods and services (EGS) by type.
To explore the “coverage” of the suite of EGS by NOAA and NOAA-Fisheries mandates, we evaluated the relative degree that each mandate addressed each EGS. The term “coverage” implies the extent to which a mandate or mandates addresses a particular EGS or set of EGS. Certainly a mandate could address certain specific, focal features of a given EGS, but as long as it was topically relevant it would be considered as addressing it. The degree to which the tasks and requirements of the mandate specifically direct the agency to monitor, measure, forecast, maintain, conserve, protect, manage or otherwise afford governance attention to a particular EGS were estimated. The EGS addressed by each mandate were assigned using a modified Delphi method (Okoli and Pawlowski, 2004). Consultation with NOAA personnel (noted above) with expertise in policy, legislation and regulation, science, and resource management relevant to EGS and EBM was used to review and codify the initial assignments. The degree to which a mandate addressed an EGS was recorded as:
• Non-applicable (0): The mandate does not address the EGS.
• Minimal (1): Complying with the mandate may address a limited facet of the EGS.
• Low (2): Complying with the mandate is likely to addresses some features of the EGS.
• Moderate (3): Complying with the mandate addresses the EGS.
• High (4): Complying with the mandate significantly addresses the EGS.
As an example, the Magnuson-Stevens Fishery Conservation and Management Act (MSA) was identified as covering 7 of the EGSs. In linking the MSA to those 7 EGS for NOAA, the mandate was considered to have a high degree of coverage (4) for food provisioning, moderate coverage (3) for genetic resources, habitat provisioning, tourism and ecotourism, and recreation, low coverage (2) for bio-derivative products and minimal coverage (1) for knowledge and science value.
Evaluating the Coverage of the Suite of EGS by the NOAA Portfolio of Mandates
A 10-point weighting method was also used to estimate the priority of a particular EGS relative to NOAA's or NOAA-Fisheries' missions. These were informed by examining several years of strategic plan documents and discussions with some NOAA planning personnel. All weights were reviewed by NOAA experts (noted above) and modified after those discussions. These weights were used in comparison with the degree that mandates collectively address the EGS to visualize mandate coverage of the suite of EGS. The total number of mandates addressing each EGS was noted and normalized. The total degree of mandate coverage (sum of mandates times the degree to which each is addressed) was also noted and normalized. Both the simple count of relevant mandates and the scaled mandate coverage were displayed as a percentage of the total, plotted against a line showing the normalized EGS weight which represents the relative priority of each EGS to the agency.
Overlap Across Mandates with Respect to EGS
Each mandate was evaluated separately in terms of how it contributes to an understanding of the suite of EGS. However, it is clear that fulfillment of one mandate may support EGS as needed for another mandate. Therefore, the overlap across mandates was calculated for the 10 most prominent NOAA mandates in relations to all other mandates; the most prominent mandates were those with the highest estimated effort that addressed the most EGS. The same overlap calculation was done with the 5 most prominent NOAA-Fisheries mandates in relation to all other applicable mandates. These 15 mandates (10 NOAA, and 5 NOAA-Fisheries) were identified by ranking each mandate using the following approach:
(1) the value of each mandate for a particular EGS was obtained by multiplying the degree to which it addressed an EGS (i.e., 0–4) by the weight representing the organizational priority (i.e., 1–10);
(2) this value for each EGS was summed across all EGS for that mandate and multiplied by the score corresponding to the relative effort in compliance (i.e., 1–10);
(3) each mandate's calculated value [Σ EGS (degree* priority weight) * effort score] was ranked and the top 5 or 10 mandates were selected1.
For the overlap analysis, all 22 EGS were considered. Overlaps scores reflect the proportion of all 22 EGS in which each mandate of the pair were recorded as relevant (scores 1–4). For example, consider the MSA and Endangered Species Acts. Both were noted as addressing six of the same EGS and not addressing 5 of the same EGS, and they differed in the scoring for the remaining 11 EGS. These two mandates would have an overlap score of 0.5 or 50% (11 identical scores and 11 differing scores).
Results
Applicable Mandates and Linking the NOAA Portfolio of Mandates to Ecosystem Goods and Services
We cataloged 94 mandates (Table 1) that apply to NOAA, and a subset of 48 of these that apply to NOAA-Fisheries. URLs for each mandate are included in the Supplementary Information. Many of these, such as the Endangered Species Act or the Coral Reef Conservation Act, center on the conservation or protection of specific resources or species. These require analysis of current and historic information, development of management plans and best practices, periodic review and coordination of enforcement practices and protocols. The major international agreements generally include NOAA in international organizations which require the analysis and sharing of information and practices that inform a specific process or fishery (i.e., ozone depletion, tuna). The established international organizations generally require NOAA's periodic review of information and negotiation of specific recommendations or agreements (i.e., carbon pricing, catch limits). Executive Orders relevant to NOAA and NOAA-Fisheries often require participation of the agency in an additional “task force” and contribution to a plan or a process that positively impacts the problem (i.e., ecosystem restoration). The NOAA-Fisheries mandates, not surprisingly, focus on assessment and projection of the populations of high economic value fish species (i.e., MSA) and critical aspects of ecosystem function (i.e., ocean acidification, estuary monitoring and protection, coral reefs). Many of these mandates require regular monitoring and analysis, research, and the development and implementation of management plans.
We associated the mandates with 22 different EGS (Table 2). These EGS span the range of services and, although tailored for ocean ecosystems, are consistent with other categorizations and listings (MEA, 2003, 2005). These services can generally be considered as provisioning specific resources (food, minerals, and energy), supporting the ecosystem functionally, regulating (nutrients, elements, water levels, temperature) or being the source of cultural services (tourism, heritage value, knowledge value). Worth noting is that provisioning services are associated with economic value and therefore may require assessment and regulation for sustainable utilization. Supporting and regulating services may require protection; however, the roles of these resources and the factors that impact their performance must be understood in order to ensure these EGS are adequately addressed. Mandates associated with cultural services may be plentiful based on the long history of human observation of changing utilization of ocean resources over time, and the desire to preserve access to places of cultural importance.
Evaluating the Coverage of the Suite of EGS by the NOAA Portfolio of Mandates
Of the 22 EGS, four had the highest relative priority for NOAA (scored as 9 or 10) and two more had a notably high value (scored as 8) (Figure 1). These were food provisioning, energy resources, mineral resources, water cycling, shoreline stabilization and waste disposal. These top 6 collectively comprise/account for 35.5% of all the NOAA Fisheries' EGS priorities. For NOAA-Fisheries, 3 out of 22 were weighted at or above 9 and two more were considered higher priority (weight above 7) EGS. These were food provisioning, habitat provision, primary production, genetic resources and recreation. These top 5 collectively comprise/account for 35.2% of all the NOAA Fisheries' EGS priorities. Notably, each of the EGS was addressed to some extent by the NOAA or NOAA-Fisheries mandates. This implies there is wide coverage of EGS.
Figure 1. The relative priority of each EGS to NOAA's mission, and to NOAA-Fisheries' mission was estimated. Here we visualize the weight of each EGS as a percentage of the total (100%) for NOAA and NMFS. EGS are graphed in alphabetical order. Provisioning services are indicated with purple hues. Supporting services are indicated with blue hues. Regulating services are indicated with red hues. Cultural services are indicated with green hues. EGS are listed in alphabetical order.
There are 7 EGS that have at least 5% of mandates that address them for NOAA (Figure 2). These are food provisioning, habitat provision, genetic resources, recreation, tourism, historical and heritage value, and knowledge and science value. The mandates most relevant to addressing all of the these EGS (combined degree of relevance greater than 10) are the MSA, the Oil Pollution Act, the Resources and Ecosystems Sustainability, Tourism Opportunities and Revived Economy of the Gulf Coast Act of 2011 (RESTORE Act), the National Marine Sanctuaries Act, and the Chesapeake Bay Restoration Executive Order 13508. Clearly most EGS have multiple mandate coverage. Several EGS have a lower number of mandates that address them, less than 2% of all mandates. Conversely two EGS, genetic resources and knowledge and science value, have a high percentage (~8%) of NOAA mandates that address them. In comparing the relative number of mandates that address each EGS (dark bars) and the relative degree to which each EGS is addressed (light bar), a similar pattern is observed. Generally the count of relevant mandates is similar to the proportion of total score assessed for coverage or the degree to which each mandate addressed each EGS. The two EGS for which these measures showed the biggest difference were genetic resources, in which a smaller number of mandates were attributed a larger degree of relevance, and knowledge and science value, in which a larger number of mandates were attributed a smaller degree of relevance. The priority we assessed for the agency among all the EGS was not always reflected in the realized number of mandates or proportional degree of relevance (Figure 2). For instance, food was a high priority EGS and generally had high mandate coverage, yet genetic resources was a lower priority but had a high degree of mandate coverage.
Figure 2. The normalized value of all the mandates collectively is shown for all NOAA mandates. The dark bars reflect of the number of mandates relevant to each of the identified EGS (count). The light bars reflect the collective degree to which the mandates address each EGS, with the degree scored on a high, moderate, low, minimal scale (4, 3, 2, 1 respectively). The line shows the normalized organizational priority of the EGS for NOAA expressed as a percent.
Similar patterns are observed for NOAA-Fisheries (Figure 3). There are 7 different EGS that have at least 5% of mandates that address them for NOAA. These are food production, habitat provision, genetic resources, recreation, tourism, historical and heritage value, and knowledge and science value. The subset of mandates relevant to NOAA-Fisheries that are have the highest combined degree of relevance (greater than 10) for these EGS are the MSA, the Oil Pollution Act, the RESTORE Act, and the National Marine Sanctuaries Act. Clearly most EGS have multiple mandate coverage even within NOAA-Fisheries. This implies there is wide coverage of EGS in the fisheries sector. Three EGS have a lower number of mandates that address them, less than 2% of all mandates; these are climate regulation, carbon sequestration and water supply/hydrology. The EGS of genetic resources is addressed by more than 12% of the NOAA-Fisheries mandates. Generally the count of relevant mandates is similar to the proportion of total score assessed for the degree to which each mandate addressed each EGS for NOAA-Fisheries as well. The three EGS for which these measures showed the biggest difference were food, habitat provisioning and genetic resources; in all three cases, a smaller number of mandates were attributed with a larger degree of relevance. As was the case with NOAA, the number and proportional degree of relevance of the portfolio of mandates did not always match the weighted priority of EGS for NOAA-Fisheries (Figure 3). For instance, food and habitat provision were high priority EGS and generally had high mandate coverage. The genetic resources EGS was considered to be of slightly lower performance and yet a higher proportion of mandates were relevant to this EGS. Conversely nutrient cycling and climate regulation were considered higher priority EGS than tourism and knowledge and science value, yet the mandate coverage showed the opposite pattern.
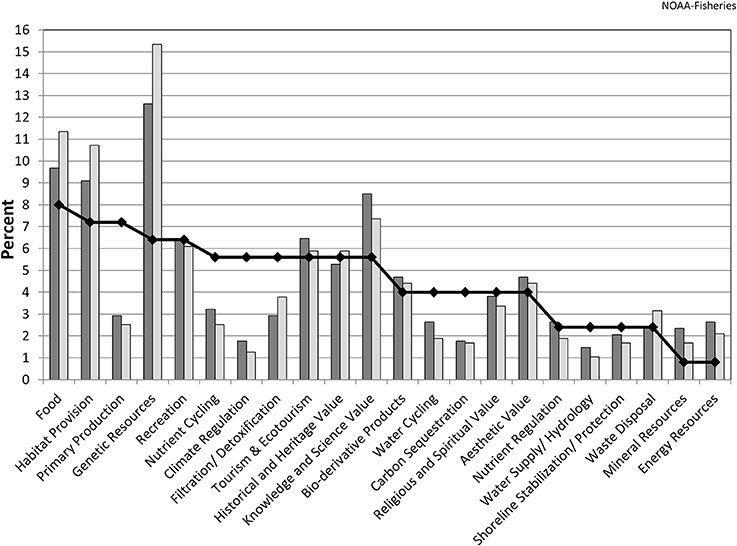
Figure 3. The normalized value of all the mandates collectively is shown for the subset of mandates informing the mission and activities of NOAA-Fisheries. The dark bars reflect of the number of mandates relevant to each of the identified EGS (count). The light colored bars reflect the collective degree to which the mandates address each EGS. The line shows the normalized organizational priority of the EGS for NOAA-Fisheries expressed as a percent.
An interesting observation is that the relative number of mandates associated with each EGS may imply the relative priority of that EGS to the agency. An important caveat to note, however, is the degree of coverage by total number of mandates may not necessarily be reflective of the comprehensiveness in addressing a given EGS. Therefore, there may not be a one-to-one match of mandate coverage relative to implied EGS prioritization. Yet it is interesting to note that some high priority EGS have a limited number of mandated coverage and vice versa. Further, many mandates require a high level of coordination from different levels of government (state, local, federal, and international) in order to collect, develop, disseminate, and implement outcomes from the agency's efforts. The profile of mandate coverage may, in part, reflect different agencies taking the lead on the evaluation and management of specific EGS (i.e., energy resources and mineral resources with Bureau of Ocean Energy Management).
Overlap across Mandates with Respect to EGS
Relative to the 10 major NOAA mandates, 69 out of 94 mandates have a calculated overlap >70% with at least one of the major mandates, and 7 have an overlap of >90% (Table 3). This means that across EGS, there is some reinforcement among mandates. Certainly the caveats of geographic, taxonomic, or process specificity need to be considered in the portfolio of such mandates. Yet for some of the mandates that address shared EGS, there is some potential for redundancy. Conversely, 48 out of 94 mandates have an overlap of < 20% with at least one of the 10 major NOAA mandates (Table 3). Note in this table that a single mandate under consideration may have an overlap of more than 70% with one of the major mandates and an overlap of less than 20% with another of the major mandates. This means that some facets of some EGS may have less reinforcement in their mandated coverage. The same caveats of geographic, taxonomic, or process specificity apply here, especially if the mandate is particularly integrative or general. Another caveat worth repeating is that the degree of coverage by total number of mandates may not necessarily be reflective of the comprehensiveness in addressing a given EGS. However, the analysis of overlap does highlight some mandates as being relatively unique in the EGS that they address.
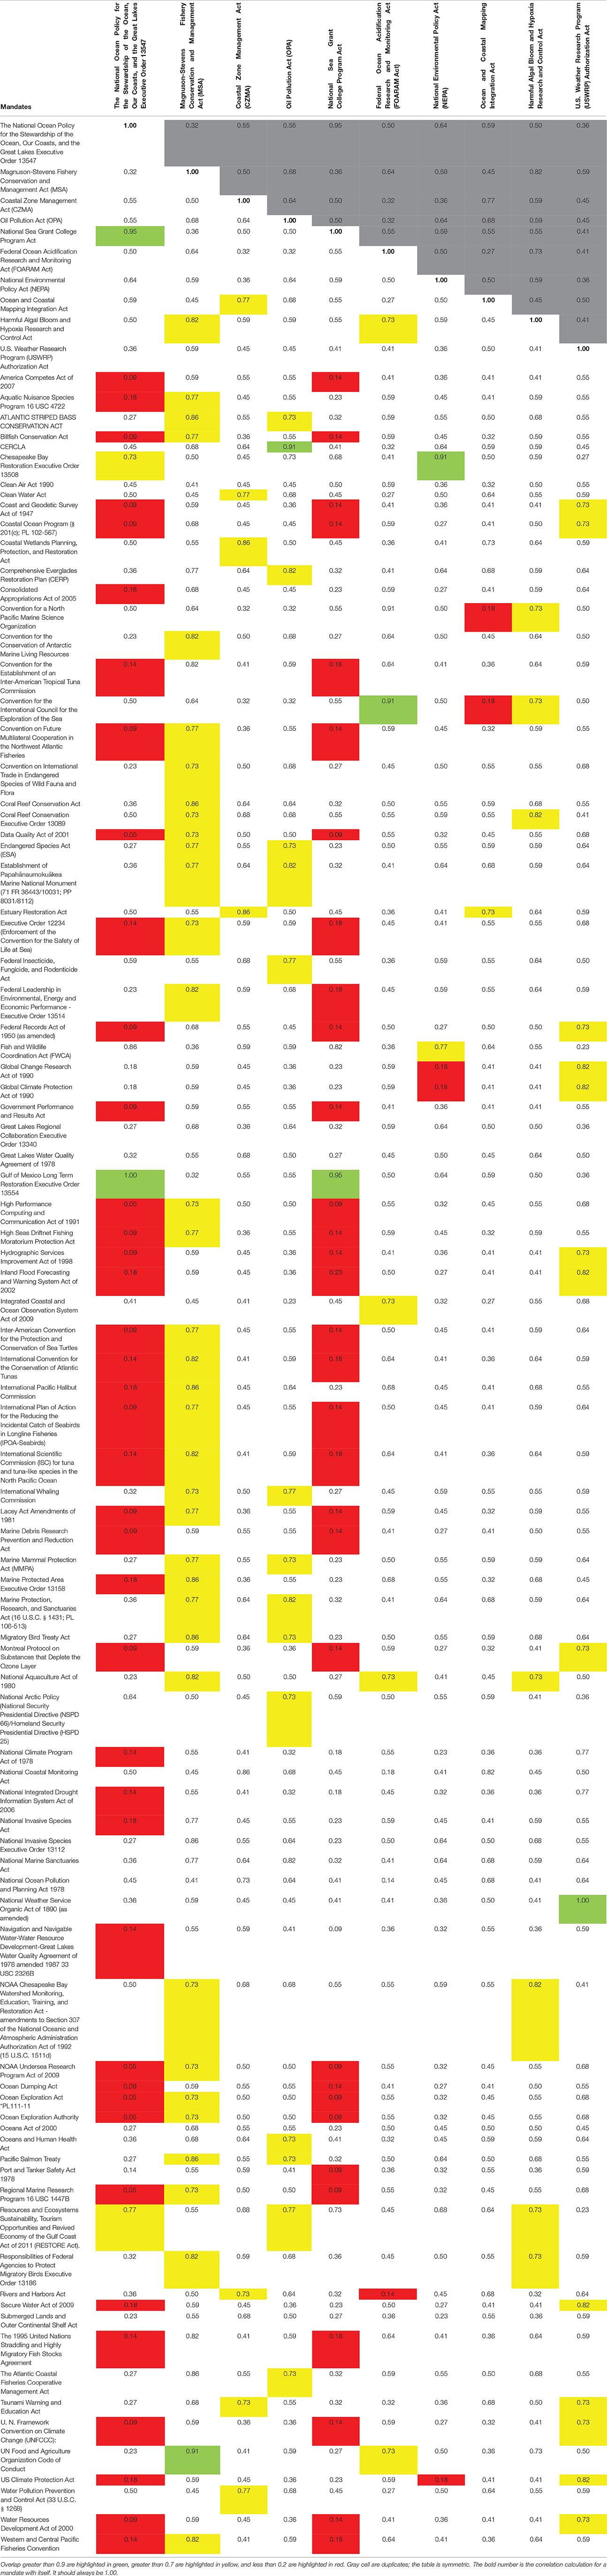
Table 3. A listing of the overlap between the 10 major NOAA mandates and all other mandates.
Relative to the five major NOAA-Fisheries mandates, 37 out of 48 that have an overlap calculated to be >70% with at least one of the major mandates, and 5 with >90% overlap with a major mandate (Table 4). This means that across EGS in the fisheries sector, there is reinforcement among the major mandates. Again, the caveats of geographic, taxonomic, or process specificity need to be considered in the portfolio of such mandates. However, for some of the mandates that address shared EGS, there is some potential for redundancy. Conversely, 13 out of 48 mandates have an overlap of <20% with at least one of the 5 major NOAA Fisheries mandates (Table 4). This means that some facets of some EGS may have less reinforcement in their mandated coverage for the fisheries sector. The same caveats of geographic, taxonomic, or process specificity also apply here, as do caveats pertaining to resources and effort applied to the fulfillment of a mandate. Yet again this implies that some elements of the EGS may be more vulnerable to not being addressed.
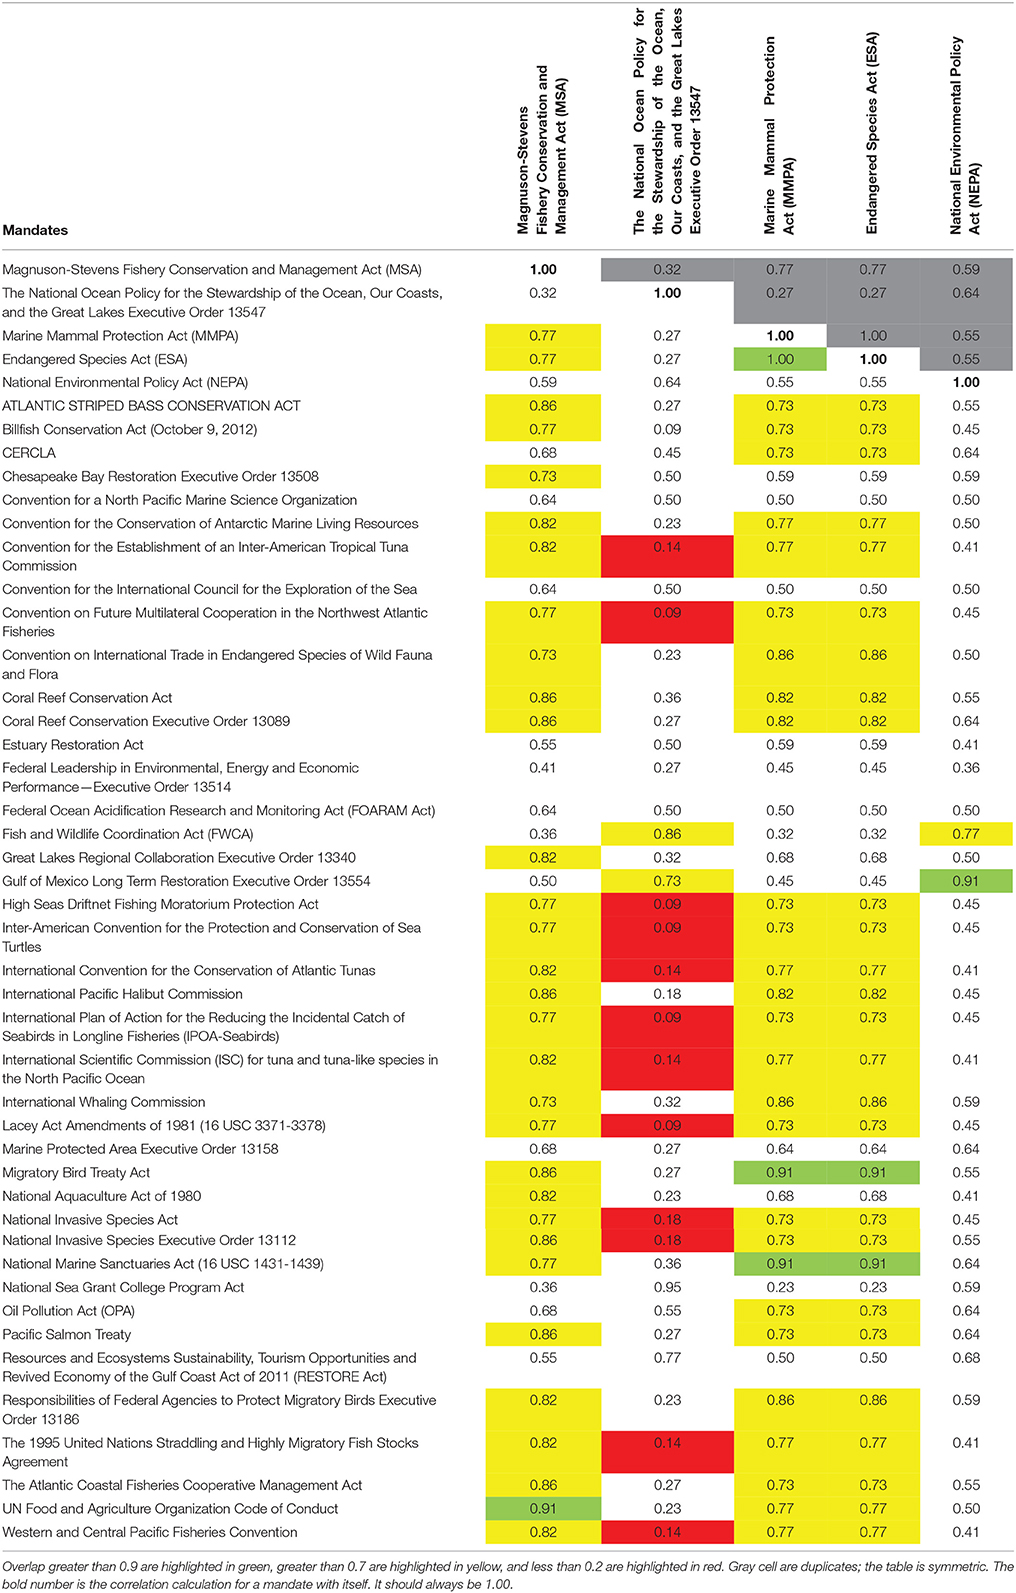
Table 4. A listing of the overlap between the 5 major NOAA-Fisheries mandates and all other mandates.
We started with an obvious observation, that there are a relatively large number of mandates providing requirements to address ocean EGS. One less obvious, emergent observation from this evaluation is that some mandates may overlap (Tables 3, 4), but have competing objectives (see tasks and requirements, Table 1). Certainly some EGS are supporting or regulating features that afford provisions for other EGS beyond direct human benefit. Yet some facets of even overlapping mandates highlight the need to balance the full range of mandated objectives and how they address EGS.
Discussion
Many EGS are provided by the ocean (Costanza et al., 1997; MEA, 2003, 2005; Halpern et al., 2008). A number of mandates address the monitoring, management, measurement, forecasting, maintenance, conservation, or protection of these goods and services. The interplay between mandate coverage of EGS remains worth examining. To our knowledge, this is the first attempt to comprehensively link mandates to the EGS they are addressing. Some EGS have a limited number of mandates addressing them. This may be acceptable; EGS may require different levels of resources in order to be assessed or protected. The interpretation of this low coverage must be understood with the caveats of the full amount of resources, effort, and prioritization that is actually afforded to the EGS by each mandate. Some mandates may have a narrow focus, touch on only a limited set of facets of any given EGS, but are well resourced and well emphasized. Other mandates may relate to these EGS but lay outside the purview of NOAA or NOAA-Fisheries. That would not necessarily emerge from this evaluation. However, we do note that EGS with a limited amount of mandate coverage should be monitored so that no significant deficiencies arise. Some EGS have copious numbers of mandates addressing them. This is excellent in terms of reinforcement of coverage to ensure that the EGS are being addressed adequately. It is wise to have some modicum of redundancy. Yet caveats associated with the geographic, taxonomic or topical focus of particular mandates may lessen the perceived coverage for a given EGS.
All EGS had some coverage by the portfolio of mandates. But are there EGS, or even emerging facets of some EGS, that we did not emphasize? The use of our categorization scheme may miss or deemphasize some EGS. For example, it is debatable whether biodiversity is in itself an EGS, or is an important facet of one, or is not one at all but rather an emergent feature of an ecosystem (Haines-Young and Potschin, 2010). The salient point is that any categorization and evaluation system of EGS needs to be flexible enough to handle these considerations. Yet despite this concern, it does appear that the majority of ocean-oriented EGS have some degree of mandated coverage.
This method has some utility. The prioritization weightings, effort scoring and establishment of linkages are undoubtedly reflective of our biases and limitations, even though they are generally reflective of documented priorities for the agency. Yet the method noted here represents a useful approach to examine and explore how a portfolio of mandates covers a suite of EGS. Certainly more nuanced inputs could be employed and future work could explore this topic more thoroughly, but any such advances would be able to build on the elements developed here.
Although technically feasible, we resisted the temptation to conduct a full multi-criteria portfolio analysis (e.g., Salo et al., 2011; Linkov and Moberg, 2012). We did not conduct this analysis for four main reasons. The first is the previously mentioned biases and limitations of our priority weightings and effort scoring. Second, the difficulty of establishing more detailed criteria for the effectiveness of efforts relative to addressing EGS from an understanding of the specific requirements of mandates limited our ability to characterize the extent to which an EGS was addressed. Third, these agencies are required to fulfill these mandates regardless of the level of priority, effort or resources. Finally, Congressional and Executive priorities change regularly, directly impacting the number and coverage of a portfolio of mandates. Rather this approach highlights a few areas of excellent EGS coverage and a few areas that may warrant closer attention as the oceans, and the human uses thereof, change in the future. Certainly the method could be amplified for further evaluation of realized and implied prioritization, and alignments or adjustments made accordingly. More so, it provides a transparent framework within which this could be done (Linkov and Moberg, 2012).
Most work on ocean-oriented EGS focuses on either descriptions thereof (Daily et al., 1997), limits thereto (MEA, 2003, 2005; Halpern et al., 2012), or valuation thereof (Costanza et al., 1997; de Groot et al., 2002). This work emphasized links between EGS and the mandates required to fully address them. An earlier study (Scarlett and Boyd, 2011) did qualitatively link a limited number of mandates to some EGS, even to the point of treating EGS as “natural capital” in a policy context (Schaefer et al., 2015). Other works describing mandates and associated policies (McFadden and Barnes, 2009) qualitatively hint at addressing some EGS. Yet to attempt to establish direct linkages between a portfolio of mandates and a suite of EGS, and then quantify them, is not only novel, it is illustrative as an approach of how future evaluations of ocean governance relative to ocean uses could be done. One conclusion from this work is that coordination across mandates is necessary to fully address all EGS. Certainly numerous mandates touch on all categories of EGS and there may be perceived redundancies. However, specific facets of any given EGS may still be missed. Conversely, some mandates may have competing objectives that affect the same EGS. Hence, the analysis highlights the need to adopt an EBM approach. Less obvious is that these nearly 100 mandates collectively provide a basis for doing EBM. Within the extant mandate portfolio, there is enough precedent collectively to authorize EBM. To implement these mandates in more fully coordinated, cross-linked and systematic manner is not only allowable, it is imperative if we are to wisely manage the important EGS of the ocean.
Author Contributions
All authors participated in the conceptualization and design of the analysis. Mandate collection and analysis performed by CF, JL, and WP, who drafted the original manuscript. All authors participated in refinement of the analysis, as well as in the editing of the manuscript.
Conflict of Interest Statement
The authors declare that the research was conducted in the absence of any commercial or financial relationships that could be construed as a potential conflict of interest.
Acknowledgments
This study was funded by the NOAA NMFS and the USACE Corps of Engineers. Permission was granted by the USACE Chief of Engineers to publish this material. The views and opinions expressed in this paper are those of the individual authors and not those of the US Army, NOAA or other organizations. The authors would like to thank Kenton Plourde for help with the initial identification and characterization of the mandates, and L. Letson, D. Lipton, R. Methot, R. Shuford, F. Schwing, M. Brady, M. Effron for their assistance in reviewing the mandate-EGS scores. We thank two reviewers for their constructive comments on earlier versions of the manuscript.
Supplementary Material
The Supplementary Material for this article can be found online at: https://www.frontiersin.org/article/10.3389/fmars.2016.00005
Footnotes
1 ^The RESTORE Act of 2011 was ranked #1 within the NOAA analysis and #2 in the NOAA-Fisheries analysis; however, this mandate was not included in the top 5 or 10 list because the mandate does not have a national focus (instead it is directed toward impacts of the Deepwater Horizon Oil Spill in the Gulf of Mexico).
References
Christensen, N. L., Bartuska, A. M., Brown, J. H., Carpenter, S., D'Antonio, C., Francis, R., et al. (1996). The report of the ecological society of America committee on the scientific basis for ecosystem management. Ecol. Appl. 6, 665–691.
Costanza, R. (2008). Ecosystem services: multiple classification systems are needed. Biol. Conserv. 141, 350–352. doi: 10.1016/j.biocon.2007.12.020
Costanza, R., d'Arge, R., de Groot, R., Farber, S., Grasso, M., Hannon, B., et al. (1997). The value of the world's ecosystem services and natural capital. Nature 387, 253–260.
Crowder, L. B., Osherenko, G., Young, O. R., Airamé, S., Norse, E. A., Baron, N., et al. (2006). Resolving mismatches in U.S. ocean governance. Science 313, 617–618. doi: 10.1126/science.1129706
Daily, G. C., Alexander, S., Ehrlich, P. R., Goulder, L., Lubchenco, J., Matson, P. A., et al. (1997). Ecosystem services: benefits supplied to human societies by natural ecosystems. Issues Ecol. 2, 1–18.
de Groot, R. S., Wilson, M. A., and Boumans, R. M. J. (2002). A typology for the classification, description and valuation of ecosystem functions, goods and services. Ecol. Econ. 41, 393–408. doi: 10.1016/S0921-8009(02)00089-7
FAO (Food and Agriculture Organization) (2003). The Ecosystem Approach to Fisheries. Rome: FAO Technical Guidelines for Responsible Fisheries 4, Supplement 2, 112.
Fluharty, D. (2014). Exploration of Ecosystem Based Fishery Management in the United States: A Report from the NOAA Science Advisory Board. Maryland: NOAA Fisheries, Office of Science and Technology, Silver Spring, 111. Available online at: http://www.sab.noaa.gov/Reports/SAB%20EBFM%20Report%20to%20NOAA_July%202014_Final.pdf
Haines-Young, R., and Potschin, M. (2010). “The links between biodiversity, ecosystem services and human well-being,” in Ecosystem Ecology: A New Synthesis, eds D. Raffaelli and C. Frid (Cambridge: Cambridge University Press), 110–139.
Halpern, B. S., Longo, C., Hardy, D., McLeod, K. L., Samhouri, J. F., Katona, S. K., et al. (2012). An index to assess the health and benefits of the global ocean. Nature 488, 615–620. doi: 10.1038/nature11397
Halpern, B. S., Walbridge, S., Selkoe, K. A., Kappel, C. V., Micheli, F., D'Agrosa, C., et al. (2008). A global map of human impact on marine ecosystems. Nature 319, 948–952. doi: 10.1126/science.1149345
Leslie, H. M., and McLeod, K. L. (2007). Confronting the challenges of implementing marine ecosystem-based management. Front. Ecol. Environ. 5, 540–548. doi: 10.1890/060093
Link, J. S. (2010). Ecosystem-Based Fisheries Management: Confronting Tradeoffs. Cambridge: Cambridge University Press.
Linkov, I., and Moberg, E. (2012). Multi-Criteria Decision Analysis. Environmental Applications and Case Studies. Boca Raton, FL: CRC Press.
MEA (Millennium Ecosystem Assessment) (2003). Ecosystems and Human Well-being: A Framework for Assessment. Washington, DC: Island Press.
McFadden, K. W., and Barnes, C. (2009). The implementation of an ecosystem approach to management within a federal government agency. Mar. Policy 33, 156–163. doi: 10.1016/j.marpol.2008.05.007
McLeod, K., and Leslie, H. (2009). Ecosystem-Based Management for the Oceans. Washington, DC: Cambridge University Press.
NRC (Natural Research Council) (2004). Valuing Ecosystem Services: Toward Better Environmental Decision-Making. Washington, DC: National Academies Press.
O'Higgins, T. G., and Gilbert, A. J. (2014). Embedding ecosystem services into the Marine Strategy Framework Directive: illustrated by eutrophication in the North Sea. Estuarine Coastal Shelf Sci. 140, 146–152. doi: 10.1016/j.ecss.2013.10.005
Okoli, C., and Pawlowski, S. D. (2004). The Delphi method as a research tool: an example, design considerations and applications. Inf. Manage. 42, 15–29. doi: 10.1016/j.im.2003.11.002
Pitcher, T. J., Kalikoski, D., Short, K., Varkey, D., and Pramod, G. (2009). An evaluation of progress in implementing ecosystem-based management of fisheries in 33 countries. Mar. Policy 33, 223–232. doi: 10.1016/j.marpol.2008.06.002
Reed, M. S., Hubacek, K., Bonn, A., Burt, T. P., Holden, J., Stringer, L. C., et al. (2013). Anticipating and managing future trade-offs and complementarities between ecosystem services. Ecol. Soc. 18:5. doi: 10.5751/ES-04924-180105
Salo, A., Keisler, J., and Morton, A. (2011). Portfolio Decision Analysis: Improved Methods for Resource Allocation. New York, NY: Springer Verlag.
Scarlett, L., and Boyd, J. (2011). “Ecosystem services: quantification, policy applications, and current federal capabilities,” in Resources for the Future Discussion Paper No. 11-13. Available online at: http://ssrn.com/abstract=1794242. doi: 10.2139/ssrn.1794242
Schaefer, M., Goldman, E., Bartuska, A. M., Sutton-Grier, A., and Lubchenco, J. (2015). Nature as capital: advancing and incorporating ecosystem services in United States federal policies and programs. Proc. Natl. Acad. Sci. U.S.A. 112, 7383–7389. doi: 10.1073/pnas.1420500112
Keywords: policy analysis, ecosystem-based management, decision analysis, portfolio approach, provisioning service, regulating service, supporting service, cultural service
Citation: Foran CM, Link JS, Patrick WS, Sharpe L, Wood MD and Linkov I (2016) Relating Mandates in the United States for Managing the Ocean to Ecosystem Goods and Services Demonstrates Broad but Varied Coverage. Front. Mar. Sci. 3:5. doi: 10.3389/fmars.2016.00005
Received: 27 October 2015; Accepted: 18 January 2016;
Published: 18 February 2016.
Edited by:
Sebastian Villasante, University of Santiago de Compostela, SpainReviewed by:
Andrew M. Fischer, University of Tasmania, AustraliaManel Antelo, University of Santiago de Compostela, Spain
Copyright © 2016 Foran, Link, Patrick, Sharpe, Wood and Linkov. This is an open-access article distributed under the terms of the Creative Commons Attribution License (CC BY). The use, distribution or reproduction in other forums is permitted, provided the original author(s) or licensor are credited and that the original publication in this journal is cited, in accordance with accepted academic practice. No use, distribution or reproduction is permitted which does not comply with these terms.
*Correspondence: Christy M. Foran, christy.m.foran@usace.army.mil