Spatial Variations of Prokaryotic Communities in Surface Water from India Ocean to Chinese Marginal Seas and their Underlining Environmental Determinants
 Xiaowei Zheng
 Xin Dai
 - State Key Laboratory of Microbial Resources, Institute of Microbiology, Chinese Academy of Sciences, Beijing, China
To illustrate the biogeographic patterns of prokaryotic communities in surface sea water, 24 samples were systematically collected across a large distance from Indian Ocean to Chinese marginal seas, with an average distance of 453 km between two adjacent stations. A total of 841,364 quality reads was produced by the high throughput DNA sequencing of the 16S rRNA genes. Phylogenetic analysis showed that Proteobacteria were predominant in all samples, with Alphaproteobacteria and Gammaproteobacteria being the two most abundant components. Cyanobacteria represented the second largest fraction of the total quality reads, and mainly included Prochlorococcus and Synechococcus. The semi-closed marginal seas, including South China Sea (SCS) and nearby regions, exhibited a transition in community composition between oceanic and coastal seas, based on the distribution patterns of Prochlorococcus and Synechococcus as well as a non-metric multidimensional scaling (NMDS) analysis. Distinct clusters of prokaryotes from coastal and open seas, and from different water masses in Indian Ocean were obtained by Bray-Curtis dissimilarity analysis at the OTU level, revealing a clear spatial heterogeneity. The major environmental factors correlated with the community variation in this broad scale were identified as salinity, temperature, and geographic distance. Community comparison among regions shows that anthropogenic contamination is another dominant factor in shaping the biogeographic patterns of the microorganisms. These results suggest that environmental factors involved in complex interactions between land and sea act synergistically in driving spatial variations in coastal areas.
Introduction
Microbes, estimated to be in the orders of 104 ~ 106 cells per milliliter in seawater (Azam and Malfatti, 2007), are believed to play essential roles in food webs (DeLong and Karl, 2005), biogeochemical cycles (Weber and Deutsch, 2010), and global climate changes (Sarmento et al., 2010; Coelho et al., 2013). However, the diversity and activities of microbes in many regions of the vast oceans have not been studied yet (Sunagawa et al., 2015), in part because of the sampling difficulties and the fact that large majority of marine microbes have not been obtained in pure culture, which used to be the only available way to describe marine microbes (Giovannoni and Stingl, 2007). In the past few decades, rapid technological advances (Metzker, 2010; Fadrosh et al., 2014) in cultivation-independent molecular surveys, which are based on the analysis of conserved molecular markers (chiefly small subunit ribosomal RNA genes) or PCR-independent metagenomics, has made it possible to detect marine microbiomes in unprecedented detail.
Prokaryotes in surface seawater (<200 m deep) represent a key player in primary production and in feeding of organic matter into biological pump in the ocean (Ducklow et al., 2001; Herndl and Reinthaler, 2013). Understanding of the ecological role of prokaryotes in surface seawater depends on knowledge of the community structure of these organisms. In recent years, efforts have been made to determine the community structures of prokaryotes in surface seawater in several marine regions, such as Mediterranean Sea (Feingersch et al., 2010; Techtmann et al., 2015), Baltic Sea (Herlemann et al., 2011), Red Sea (Qian et al., 2011), South Pacific Gyre (Yin et al., 2013), and North Atlantic Ocean (Hahnke et al., 2013). These studies have provided valuable insights into the microbial community in specific marine regions. Therefore, most of these studies are geographically restricted. More recently, several major programs have been initiated to collect samples from different oceans and to provide insights into the ocean microbiome in a global scale. These include the Sorcerer II Global Ocean Sampling Expedition (Rusch et al., 2007; Yooseph et al., 2007), the Tara Oceans Expedition (Armbrust and Palumbi, 2015), and the International Census of Marine Microbes (ICOMM, http://icomm.mbl.edu/). Despite these tremendous efforts, the vast majority of the ocean regions remain unexplored (Sunagawa et al., 2015) and few sampling surveys were made to compare the microbial communities of different marine region. Therefore, the biogeographic patterns of marine microorganisms and the environmental factors determining these patterns in surface water in a broad scale remain to be determined.
In the present study, we systematically collected samples of surface seawater from open seas, coastal regions, and semi-enclosed marginal seas during the DY125-30 cruise with R/V Dayang No.1 from Southwest Indian Ocean to Qingdao, China. The prokaryotic diversity in these samples were assessed and compared. Our results reveal the biogeographic patterns of prokaryotes in previously unexplored marine regions as well as the underlining environmental determinants of these patterns.
Materials and Methods
Sample Collection
Twenty four surface seawater samples were collected from a depth of ~4.0 m by an onboard surface seawater sampling system, from May 3 to 26, 2014, at 9:00 a.m. (local time), during the DY125-30 cruise with R/V Dayang No.1 as it traveled from Southwest Indian Ocean to Qingdao, China (Figure 1). Samples (~4.5 L) were filtered through polycarbonate filters with a 0.22-μm pore size and 47 mm diameter (Merck Millipore) under vacuum. The filters were then sealed in sterile plastic tubes and stored at −80°C until DNA extraction. GPS coordinates and environment characteristics were listed in Table S1 (Supplementary Materials). The temperature, salinity and pH of the water samples were kindly provided by Qunhui Yang and Huaiyang Zhou at Tongji University, Shanghai, China. Average distance between two adjacent sampling sites is about 453 km.
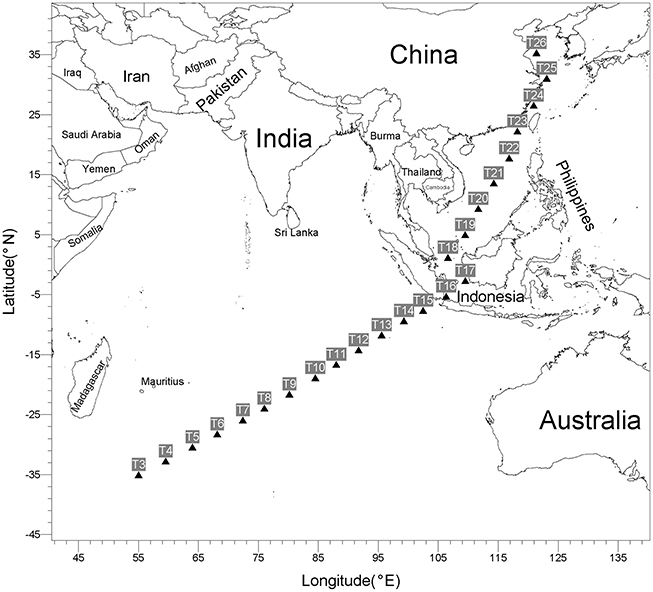
Figure 1. Location of the sampling sites during the DY125-30 cruise.
No specific permissions were required for sampling at the above locations as the activities did not involve endangered or protected species and did not occur within a private area.
DNA Extraction, Amplification, and Sequencing
Total DNAs were extracted from samples collected on the membrane filters using the phenol-chloroform extraction method described by Urakawa et al. (2010). The concentration and quality of extracted DNA were determined by a NanoDrop ND-1000 spectrophotometer (Thermo Scientific, USA). The archaeal and bacterial hypervariable regions V4 of the 16S rRNA genes were amplified using the primers 515F (5′- GTGCCAGCMGCCGCGG-3′) and 806R (5′- GGACTACHVGGGTWTCTAAT-3′), with a unique 8-bp error-correcting Golay barcode to each sample (Caporaso et al., 2011). PCR for each sample was carried out in triplicate in a 20−μl reaction volume using a GeneAmp 9700 Thermal Cycler (Applied Biosystems, USA) with the following cycling parameters, initial pre-denaturation at 95°C for 3 min, followed by 28 cycles of denaturation at 95°C for 30 s, annealing at 55°C for 30 s, elongation at 72°C for 45 s, and a final extension at 72°C for 10 min. The PCR mixture contained 0.4 μl of High Fidelity FastPfu polymerase (TransGen Biotech, Beijing), 4 μl of 5 × FastPfu buffer, 2 μl of 2.5 mM dNTPs, 0.8 μl of each primer (5 μM), 10 ng of template DNA, and de-ionized ultrapure water. Negative controls without template were included for each barcoded primer pair to test for reagent contamination. PCR products were visualized on 2% agarose gels, purified using the AxyPrep DNA Gel Extraction Kit (Axygen Biosciences, USA) and quantified by the QuantiFluor-ST system (Promega, USA). A mixture of the purified amplicons were pooled in an equimolar ratio and paired-end sequenced (2 × 300) on an Illumina MiSeq platform at Majorbio Bio-Pharm Technology Co., Ltd., Shanghai, China. The raw sequencing data from this study have been submitted to NCBI Sequence Read Archive database (http://www.ncbi.nlm.nih.gov/sra/) with accession no. SRP065252.
Quality-Filtering and Sequence Analysis
To obtain effective reads, the pair-end reads from MiSeq were de-multiplexed and filtered strictly using QIIME v1.7.0 (Quantitative Insights Into Microbial Ecology, http://qiime.org/index.html) software package (Caporaso et al., 2010), with the following criteria, as described previously (Bokulich et al., 2013; Hong et al., 2015): (i) the 300-bp reads were truncated at any site that obtained an average quality score of <20 over a 50-bp sliding window, and the truncated reads shorter than 50 bp were discarded; (ii) reads with any mismatch in barcode, more than two nucleotide mismatch in primer or containing ambiguous characters were removed; and (iii) overlapping sequences, shorter than 10 bp or with a mismatch ratio of more than 0.2, were eliminated. The chimeric sequences were checked and filtered out by UCHIME (Edgar et al., 2011), and operational taxonomic units (OTUs) with 97% similarity cutoff were clustered using UPARSE (version 7.1, http://drive5.com/uparse/) pipeline (Edgar, 2013). The taxonomic assignment of OTUs was performed by the mother Bayesian classifier (70% confidence) with the MOTHUR formatted version of the Ribosomal Database Project (RDP, version 11.1, http://rdp.cme.msu.edu/) (Maidak et al., 2001). To avoid the effects of different sequencing depths, all samples were normalized to 25,000 high quality sequences for subsequent analyses. To prevent artificial diversity inflation, the singletons (sequences or OTUs determined at a similarity level of 97% only occurred once in the entire datasets) were removed as putative sequencing errors or PCR amplification artifacts (Kunin et al., 2010).
Diversity Comparison and Statistical Analyses
For each sample, the diversity of microbial community (α-diversity) was assessed by calculating diversity indices, including Chao1 and ACE (estimating the species richness), and Shannon (estimating the species diversity) using MOTHUR program (Schloss et al., 2009). The Good's coverage (C) was calculated as [1-(n/N)] where n is the number of OTUs that had been observed once and N is the total number of OTUs in the sample. The community comparison of microbial assemblages (β-diversity) was mainly performed with R (v.3.2.2, http://www.r-project.org/) packages. Taxa with significant difference in abundance between groups were evaluated with a Welch's t-test in the STAMP program (Parks et al., 2014), the results were filtered based on p < 0.05 and an effect size (difference between proportions) of >1. Geographical distance matrix was calculated from the latitude and longitude coordinates obtained by Global Positioning System using Palaeoecological and Palaeogeographical Analysis Tools package (Vavrek, 2012). Non-metric multidimensional scaling (NMDS) analysis was conducted with fitting of the environmental parameters using the envfit function from the Vegan package, to illustrate the relationships between environmental variables and microbial community compositions. Heat map analysis of the 60 most abundant genera in each station was performed by Pretty Heatmaps package (Kolde, 2015).
Results
Environmental Characteristics
A total of 24 surface seawater samples were collected in this study (Figure 1 and Table S1). These include nine samples (T3–T11) from a subtropical gyre province in Indian Ocean, four samples (T12–T15) from a monsoon gyre province in Indian Ocean, five samples (T18–T22) from semi-enclosed marginal seas, two samples (T16 and T17) from the coastal regions of Indonesia and four samples (T23–T26) from the coastal regions of China. All samples were taken during a short span of 24 days to minimize the seasonal effect. As shown in Table S1, while there was only a small variation in pH among the samples, the level of salinity decreased along the sampling path from Indian Ocean to Chinese marginal seas. The temperature of the surface seawater ranged significantly from 18.3 to 31.4°C, being higher for samples taken closer to the equatorial regions. Surface seawater in Indian Subtropical Gyre Province (IS, 24.8°C on average) was colder than that in Indian Monsoon Gyre Province (IM, 29.7°C on average).
Prokaryotic Diversity and Community Dissimilarity
MiSeq high throughput sequencing of the 16S rRNA genes from the 24 samples yielded a total of 875,520 raw reads. After deleting singletons, 841,364 high quality reads, with 28,863–43,190 reads for each sample, were taxonomically assignable with reference database (Table 1). All samples were rarefied to 25,000 high quality reads for a consistent sequencing depth. In all, 2,419 different OTUs from all samples were assigned at a 97% threshold for sequence similarity and used for further analysis. The Good's coverage ranged from 83.33 to 90.64%, with an average of 85.81%, indicating that the majority of indigenous species were captured in most of the samples. Chao1, ACE, and Shannon indices were calculated to allow the comparison of the richness and diversity of the prokaryotic communities in the samples (Table 1).
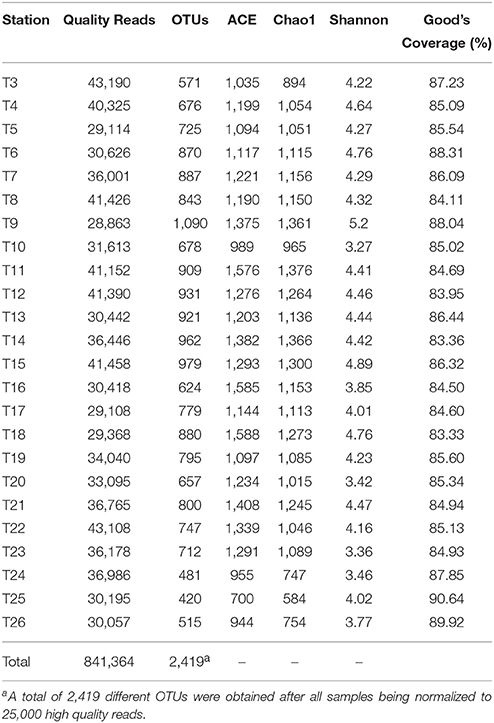
Table 1. Diversity indices and richness estimators of the surface marine water.
The community assemblages prepared from the 24 samples were compared at the OTU level by the Bray-Curtis dissimilarity analysis. As shown in Figure 2, most of the coastal samples are separated from the open sea samples. The samples from the Chinese coastal regions (T25 and T26) cluster together and are separated from the other coastal samples. T20, which is located in the southwest of South China Sea (SCS), a semi-enclosed marginal sea, is grouped with the coastal samples and not with the other open sea samples, pointing to a possible terrestrial anthropogenic contamination. Interestingly, the open seawater samples from IM are clustered with those from the semi-closed marginal seas, but not with those from IS (Figure 2). Similar clustering of the prokaryotic assemblages of our surface seawater samples is also obtained by the NMDS analysis (Figure 3).
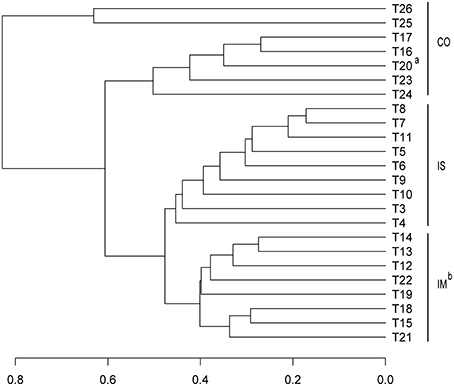
Figure 2. Bray-Curtis dissimilarity based dendrogram at the OTU level illustrating groups for surface sea water. CO, Coastal stations; IM, open sea stations from Indian Monsoon Gyre Province; and IS, open sea stations from Indian Subtropical Gyre Province. aT20 located in southwest of South China Sea showed a similar microbial community with coastal water group; bStations located in the semi-close marginal seas were clustered together with IM stations.
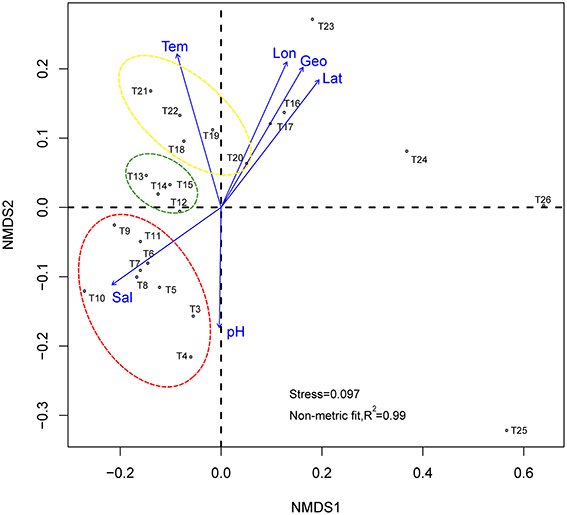
Figure 3. Non-metric multidimensional scaling based on Bray-Curtis community distances. Arrows show vector fitting of the environmental variables. Stations in yellow circle are located at semi-close marginal seas, those green, and red circles are located at Indian Monsoon Gyre Province and Indian Subtropical Gyre Province respectively. Tem, Temperature; Sal, salinity; Geo, geographic distance; Lon, longitude; Lat, latitude.
To test whether the observed similarities and differences between samples taken from various marine regions in microbial community composition are significantly (p < 0.05) correlated with the environmental parameters detected in this study (i.e., latitude, longitude, geographic distance, salinity, temperature, and pH in the sampling regions), the environmental vectors were fitted with the NMDS plot using the envfit function from the vegan package (Oksanen et al., 2015), with 999 permutations (Figure 3). The highest correlations exist for latitude (r2 = 0.7744, p = 0.001), longitude (r2 = 0.7111, p = 0.001), and, hence, geographic distance (calculated from longitude and latitude, r2 = 0.7553, p = 0.001). Salinity (r2 = 0.7694, p = 0.001) and temperature (r2 = 0.7015, p = 0.001) are also highly correlated, whereas pH (r2 = 0.3412, p = 0.013) appears to be a slightly weak correlation with a relatively high p-value. Briefly, all of the tested environmental parameters are statistically significant in explaining the similarity and dissimilarity of the samples.
Community Structures
A total of 13 phyla were identified from the 24 samples, and the five most abundant phyla contributed up to 93.9% of the total quality reads (Figure 4 and Table S2). We found that most of the quality reads were affiliated with various members of Proteobacteria (46.1% of the total), among which Alphaproteobacteria (25.3%) and Gammaproteobacteria (17.5%) were the most abundant classes and were found in all sampled locations (Figures 4, 5A). Cyanobacteria accounted for the second largest fraction of the total quality reads (21.8%) (Figure 4), and were mainly represented by the widely distributed genera in the ocean, Prochlorococcus and Synechococcus (Figure S1).
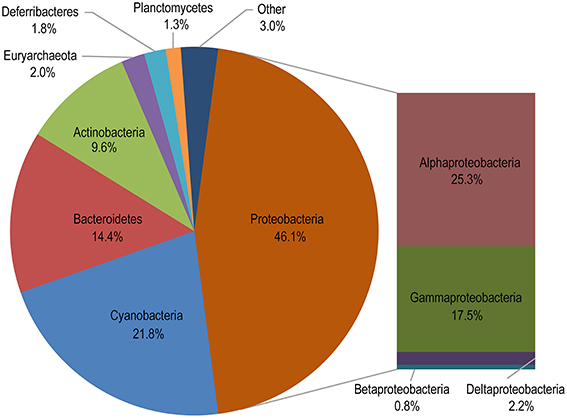
Figure 4. Taxonomic distribution of all assigned reads. “Other” comprises taxa accounting for <1% of the total quality reads.
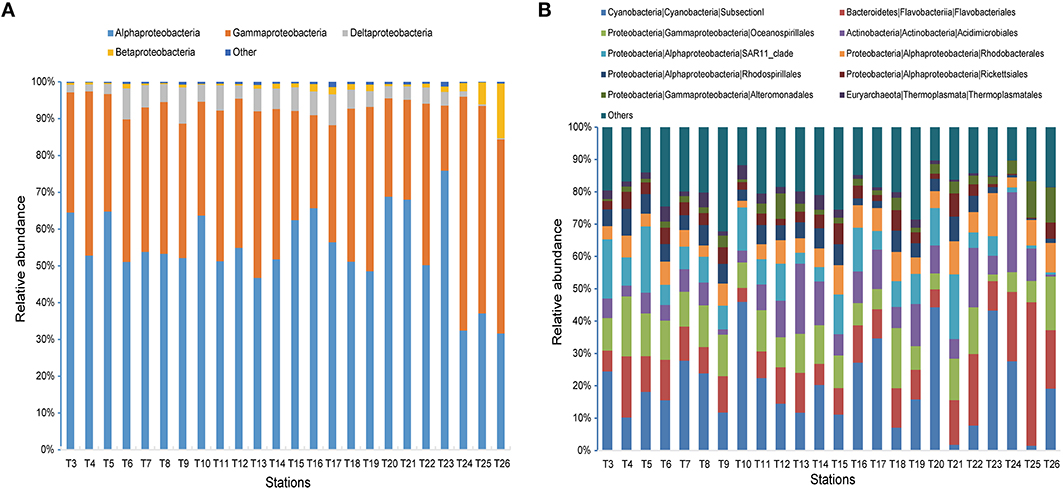
Figure 5. Microbial community compositions across all 24 samples. (A) The relative abundances of different classes in Proteobacteria. (B) The relative abundances of the dominant 10 orders.
When sequences were assigned to the taxonomic rank of “order,” 10 taxonomic groups were found to make up 81.3% of the total quality reads (Figure 5B). Cyanobacteria (20.3%) and Flavobacteriales (12.8%) were most abundant, followed by Oceanospirillales (10.7%), Acidimicrobiales (9.0%), and SAR11 clade (8.8%) (Figure 5B). At the genus level, most of the reads were assigned to uncultured genera (e.g., top 60 genera shown in the heat map in Figure S1), with those belonging to the genera Prochlorococcus and Synechococcus being the notable exceptions. This two representative cyanobacterial genera were observed to show a distinct distribution pattern (Figure 6). The relative abundance of Prochlorococcus was generally higher in the open sea samples than that in the coastal regions, while the reverse appeared to be true for the relative abundance of Synechococcus. The semi-closed marginal seas (areas from T18 to T22) were not only an intermediate region geographically, but also a transition zone in community composition between oceanic and coastal areas (Figure 6), which was also suggested by NMDS analysis (Figure 3).
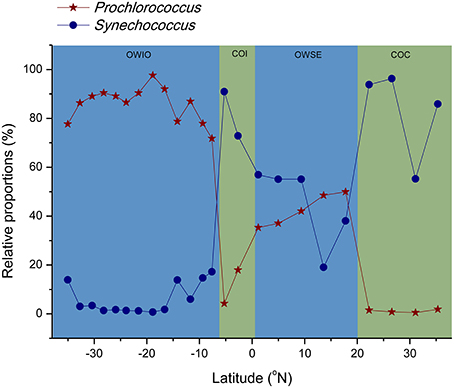
Figure 6. Trends of relative abundance for Prochlorococcus and Synechococcus in Cyanobacteria phylum along latitude. OWIO, open sea stations from Indian Ocean; OWSE, open sea stations from semi-close marginal seas; COI, coastal stations in Indonesia; COC, coastal stations in China.
Differences in Prokaryotic Community Composition among Regions
The Bray-Curtis dissimilarity analysis revealed different community compositions between the coastal and the open sea waters and between different water masses in Indian Ocean. These differences were not readily observed at the phylum level, but were found at the lower taxonomic levels (Table S2). Gammaproteobacteria were less abundant than Alphaproteobacteria in all samples except for those from the Chinese coastline (T24, T25, and T26) (Figure 5A). The abundance of Betaproteobacteria at the three coastal sites was also slightly lower than that at the other sites. In addition, Deltaproteobacteria showed the lowest abundance at the three sites. By comparison, the coastal waters near Sunda Strait (T16 and T17) and in Southwest Taiwan Strait (T23) appeared to be similar to the open sea sites in Deltaproteobacterial and Betaproteobacterial abundance (Figure 5A). The SAR11 clade was predominant in oceanic water (up to 20.4% of quality reads at T5) (Figure 5B). These organisms were nearly undetectable at the sampling sites in Chinese coastal water, especially at the Changjiang estuary and the Shandong Peninsula Coastline, but accounted for as high as 13.5% of total quality reads at the coastal site (T16) in Sunda Strait. On the other hand, the abundance of Flavobacteriales was found to be higher at the Changjiang estuary (T25) than other sampling sites. Moreover, members of the class Sphingobacteriia were low in abundance in all samples (<1%, Table S3), but were relatively more abundant at the Chinese coastal sites.
The STAMP program (Parks et al., 2014) was employed to determine taxa that contributed most significantly to the observed differences between the coastal and the open sea surface waters at the genus resolution (Figure 7A). We found that a total of nine genera showed significant variations between the coastal and the open sea surface waters. Eight of them were more abundant in the open sea waters than in the coastal waters. These include an archaeal genus (related to Marine Group II), a Deferribacteres genus (related to SAR406), a Gammaproteobacteria genus (related to SAR86), four Alphaproteobacteria genera (related to SAR11, SAR116, and AEGEAN-169_marine_group) and the genus Prochlorococcus. Synechococcus was the remaining genus which was significantly more abundant in the coastal waters than in the open sea waters. This distribution pattern of Prochlorococcus and Synechococcus agrees with the finding that the two genera were dominant photoautotrophs in oligotrophic and eutrophication marine ecosystems, respectively (Jiao et al., 2005; Lin et al., 2012). For the prokaryotic communities in IM and IS, variations in the abundance of SAR11 clade, Prochlorococcus and an unclassified Oceanospirillales were primarily responsible for the separation of the two groups (Figure 7B).
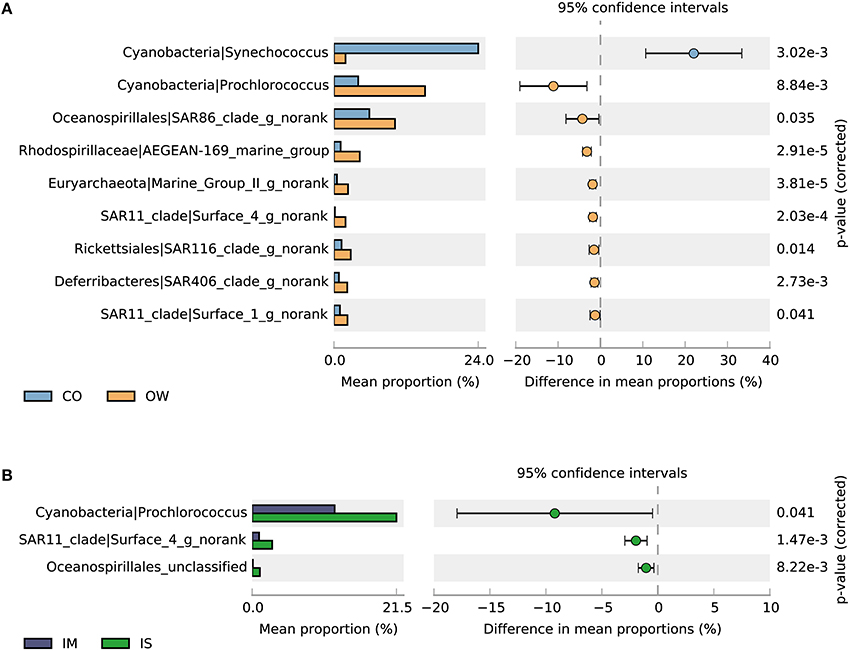
Figure 7. Taxa showing significantly different relative abundances at genus level. (A) Coastal (CO) and open seawater (OW). (B) Open seawater from Indian Monsoon Gyre Province (IM, T3-T11) and Indian Subtropical Gyre Province (IS, T12-T15). Differences were considered significant if q < 0.05 and filtered for effect sizes (difference between proportions >1).
Discussion
Overview of Abundant Taxa
In the present study, we showed that prokaryotic communities in surface seawaters, collected at various sites stretching from Indian Ocean to Chinese marginal seas, were dominated by Proteobacteria, Cyanobacteria, Bacteroidetes, and Actinobacteria. The observation was consistent with global surveys reported recently (Biers et al., 2009; Zinger et al., 2011; Sunagawa et al., 2015). Alphaproteobacteria and Gammaproteobacteria were the two most abundant classes in both coastal and open sea surface waters at our sampling sites, in agreement with the previous findings in Sargasso Sea (Sjostedt et al., 2014), Eastern Mediterranean Sea (Feingersch et al., 2010; Techtmann et al., 2015), and Eastern Atlantic Ocean (Friedline et al., 2012). Betaproteobacteria, a typical freshwater lineage (Zwart et al., 2002), comprised only of 0.8% of the total quality reads, and existed primarily in the sampling sites along the Chinese coastline, raising the possibility that the distribution pattern of Betaproteobacteria may be attributed to the contribution of offshore freshwater inflow to the surrounding sea areas (Feng et al., 2009; Tseng et al., 2015).
Cyanobacterial sequences represented the second largest fraction (21.7%) of total quality reads, but the abundance of cyanobacteria varied drastically from 2.6 (T21 in SCS) to 46.7% (T10 in India Ocean). This huge variation in cyanobacterial abundance was also observed in surface seawater in other regions. For example, the abundance of cyanobacteria was only ~2% at a station near Cape Verde islands in Atlantic Ocean (Friedline et al., 2012) and in the Gulf of Finland in Baltic Sea (Laas et al., 2014), over 25% in Eastern Mediterranean Sea (Feingersch et al., 2010) and South Pacific Gyre (Yin et al., 2013), and up to 50% in Red Sea (Qian et al., 2011). We found no specific patterns of the abundance of cyanobacteria in coastal and open seas. However, Prochlorococcus and Synechococcus, the two representative cyanobacterial genera widely distributed in the ocean (Flombaum et al., 2013), showed a distinct distribution pattern of high relative abundance for Prochlorococcus in open seas and Synechococcus in coastal regions (Figure 6). With small cell size (~0.6 μm) and resulting high surface/volume ratio, Prochlorococcus is capable of more efficient nutrient uptake than Synechococcus in oligotrophic open seas (Partensky et al., 1999; Partensky and Garczarek, 2010), partly explaining their distinct distribution patterns. In contrast to Prochlorococcus, Synechococcus with a comparatively larger genome (Partensky et al., 1999; Chung et al., 2014), has the potential to utilize complex organic matter and the ability to prosper in high organic coastal regions. Interestingly, the semi-closed marginal seas, including SCS and near regions, were found to be a transition zone between oceanic and coastal areas based on the distribution patterns of these two algae (Figure 6) and NMDS analysis (Figure 3), emphasizing the possibility of terrigenous influence in the community variation.
Biogeography of Microbial Communities and Correlation with Shaping Factors
Coastal Regions
As revealed by our results, the microbial composition of coastal regions differed from that of the open sea regions. The difference may have resulted from the difference in nutritional conditions between the two regions, presumably, caused by the terrestrial anthropogenic inflow. The relatively easy community exchanges between water and sediments in coastal regions (Feng et al., 2009) may also be responsible for the microbial composition differences between the coastal and the open sea regions.
Gammaproteobacteria, shown to be predominant in both seawater and sediments (Schauer et al., 2010; Haverkamp et al., 2014; Mohit et al., 2015), play an important role in the degradation of marine organic matter, such as polysaccharides (Edwards et al., 2010), hydrocarbon (Horel et al., 2014), and petroleum (King et al., 2015). The abundance of Gammaproteobacteria was higher than Alphaproteobacteria only in T24, T25, and T26 near the China coastline, suggesting a high level of organic pollution in these areas. Two of the nine genera primarily responsible for the community dissimilarities between coastal and open seas (Figure 7A) belong to the SAR11 clade (Alphaproteobacteria). This clade, estimated to account for 1/3 of the cells present in marine surface waters on average (Morris et al., 2002), made up ~20.4% of the quality reads at T5 (Figure 5B). However, SAR11 reads were particularly low (Figure 5B) at our sampling sites in the Chinese coastline. Since SAR11 is able to derive energy through the oxidation of methylated and one-carbon compounds (Sun et al., 2011; Tripp, 2013), but not the complex organic matters (Alonso and Pernthaler, 2006; Sun et al., 2011; Tripp, 2013), members of this clade may not be able to live in habitats rich in organic matters. The remaining seven genera, except for Synechococcus, were also less abundant in the coastal waters than in the open seas, and were auxotrophic for complex organic matter. Moreover, Sphingobacteriia, abundant only in the Chinese coastline, is able to degrade benzene, toluene, ethylbenzene, and xylenes (BTEX) (Li et al., 2012), and, therefore, most likely participated in the process of pollutant degradation in the polluted coastal regions. Based on these observation, we suggest that current pollution through the input of organic carbon, nutrients, or other contaminants may serve as a major determinant for the microbial community structure in the coastal water of China. By comparison, the community compositions of Sunda Strait were more similar to those of the open seas, as compared to those in the Chinese coastal water, indicating that the coastal water of China was possibly more seriously polluted than that of Indonesia.
Open Seas
Water samples from various sites in Indian Ocean showed a similar community structure. The similar microbial assemblage composition and a negative correlation with geographical distance appear to be caused mainly by the Indian Ocean Gyre, a large system of rotating ocean currents (Schott et al., 2009), which permit the distant transportation and mixing of the surface water. However, two discrete clusters of water samples from Indian Ocean were still observed (Figure 2), and they corresponded to the two biogeographic provinces (i.e., IM: Indian Monsoon Gyre Province and IS: Indian Subtropical Gyre Province), highlighting the tight coupling of microbial diversity in Indian Ocean with the physicochemical composition, especially the thermohaline properties and nutrient status of water masses (Jeffries et al., 2015). IS was characterized with a higher salinity than IM (Table S1), indicating salinity is an important factor in determining the variation of microbial diversity in India Ocean. A strong correlation between microbial assemblage dissimilarities in IS with salinity is indeed illustrated by NMDS analysis (Figure 3). Although this major determinant of microbial community composition was also observed among various habitats (Lozupone and Knight, 2007), salinity was not shown to be the only major correlation factor in the open seas. While the microbial communities of IS were associated with the more saline conditions, the microbial communities of IM were positively correlated with the higher temperature (Figure 3 and Table S1), indicating temperature is another important factor. The temperature for IM, located near the equator, was 29.7°C on average, compared with 24.8°C for IS (Table S1). As a primary genus responsible for the community dissimilarities between IM and IS, Prochlorococcus was found to grow well at temperatures below 29.8°C (Lin et al., 2012), with an optimal temperature of 25°C (Johnson et al., 2006). Therefore, temperature may be a major factor in explaining the slightly higher abundance of Prochlorococcus in IS than in IM. Moreover, one surface four taxon in SAR11 clade, another genus responsible for the community dissimilarities between IM and IS showed a significant difference in abundance (p = 1.47e-3) (Figure 7B). The decrease of SAR11 clade (surface 4) in abundance in IM may be related to high levels of organic matters, brought by Indonesian Throughflow (Gordon et al., 1997; Han and McCreary, 2001; Schott et al., 2009) from the Indonesian seas. In addition, samples from semi-closed marginal seas clustered together with those from IM in Indian Ocean, reflecting their similar community compositions and therefore, growth conditions. The semi-closed marginal seas, especially SCS, would inevitably be affected by nutrient input and freshwater from the continent, which shape the microbial community structure as major drivers (Zhang et al., 2014; Xia et al., 2015).
In conclusion, we have surveyed and compared, for the first time, microbial communities in surface sea water across a large distance from Indian Ocean to Chinese marginal seas. A clear spatial heterogeneity was demonstrated in community composition in a large scale. The semi-closed marginal seas, i.e., SCS and nearby regions, displayed a transition in community composition between the oceanic and the coastal regions. Environmental factors, such as salinity, temperature, and geographic distance, correlated well with the community variation. These results permit a better understanding of the biogeographic patterns of prokaryotic communities and their underlining environmental determinants in surface sea water.
Author Contributions
XZ provided funding for research, performed research, analyzed data, and wrote the manuscript. XD analyzed data. LH provided funding for research, laboratory equipment and space for research to be conducted, interpreted data, and edited the manuscript.
Conflict of Interest Statement
The authors declare that the research was conducted in the absence of any commercial or financial relationships that could be construed as a potential conflict of interest.
Acknowledgments
We thank all the scientists and crew members on the R/V Dayang No.1 during the expedition for their great efforts and help in sample collection, especially Qunhui Yang at Tongji University. This work was financially supported by the program of China Ocean Mineral Resources R&D Association (Nos. DY125-15-R-02 and DY125-22-QY-22), the National Science Foundation for Young Scientists of China (No. 41406145) and the National Science Foundation for Post-doctoral Scientists of China (No. 2013M541068).
Supplementary Material
The Supplementary Material for this article can be found online at: https://www.frontiersin.org/article/10.3389/fmars.2016.00017
References
Alonso, C., and Pernthaler, J. (2006). Roseobacter and SAR11 dominate microbial glucose uptake in coastal North Sea waters. Environ. Microbiol. 8, 2022–2030. doi: 10.1111/j.1462-2920.2006.01082.x
Armbrust, E. V., and Palumbi, S. R. (2015). Uncovering hidden worlds of ocean biodiversity. Science 348, 865–867. doi: 10.1126/science.aaa7378
Azam, F., and Malfatti, F. (2007). Microbial structuring of marine ecosystems. Nat. Rev. Microbiol. 5, 782–791. doi: 10.1038/nrmicro1747
Biers, E. J., Sun, S., and Howard, E. C. (2009). Prokaryotic genomes and diversity in surface ocean waters: interrogating the global ocean sampling metagenome. Appl. Environ. Microbiol. 75, 2221–2229. doi: 10.1128/AEM.02118-08
Bokulich, N. A., Subramanian, S., Faith, J. J., Gevers, D., Gordon, J. I., Knight, R., et al. (2013). Quality-filtering vastly improves diversity estimates from Illumina amplicon sequencing. Nat. Methods 10, 57–59. doi: 10.1038/nmeth.2276
Caporaso, J. G., Kuczynski, J., Stombaugh, J., Bittinger, K., Bushman, F. D., Costello, E. K., et al. (2010). QIIME allows analysis of high-throughput community sequencing data. Nat. Methods 7, 335–336. doi: 10.1038/nmeth.f.303
Caporaso, J. G., Lauber, C. L., Walters, W. A., Berg-Lyons, D., Lozupone, C. A., Turnbaugh, P. J., et al. (2011). Global patterns of 16S rRNA diversity at a depth of millions of sequences per sample. Proc. Natl. Acad. Sci. U.S.A. 108, 4516–4522. doi: 10.1073/pnas.1000080107
Chung, C. C., Huang, C. Y., Gong, G. C., and Lin, Y. C. (2014). Influence of the Changjiang river flood on synechococcus ecology in the surface waters of the East China Sea. Microb. Ecol. 67, 273–285. doi: 10.1007/s00248-013-0299-8
Coelho, F. J. R. C., Santos, A. L., Coimbra, J., Almeida, A., Cunha, A., Cleary, D. F. R., et al. (2013). Interactive effects of global climate change and pollution on marine microbes: the way ahead. Ecol. Evol. 3, 1808–1818. doi: 10.1002/ece3.565
DeLong, E. F., and Karl, D. M. (2005). Genomic perspectives in microbial oceanography. Nature 437, 336–342. doi: 10.1038/nature04157
Ducklow, H. W., Steinberg, D. K., and Buesseler, K. O. (2001). Upper ocean carbon export and the biological pump. Oceanography 14, 50–58. doi: 10.5670/oceanog.2001.06
Edgar, R. C. (2013). UPARSE: highly accurate OTU sequences from microbial amplicon reads. Nat. Methods 10, 996–998. doi: 10.1038/nmeth.2604
Edgar, R. C., Haas, B. J., Clemente, J. C., Quince, C., and Knight, R. (2011). UCHIME improves sensitivity and speed of chimera detection. Bioinformatics 27, 2194–2200. doi: 10.1093/bioinformatics/btr381
Edwards, J. L., Smith, D. L., Connolly, J., McDonald, J. E., Cox, M. J., Joint, I., et al. (2010). Identification of carbohydrate metabolism genes in the metagenome of a marine biofilm community shown to be dominated by Gammaproteobacteria and Bacteroidetes. Genes (Basel) 1, 371–384. doi: 10.3390/genes1030371
Fadrosh, D. W., Ma, B., Gajer, P., Sengamalay, N., Ott, S., Brotman, R. M., et al. (2014). An improved dual-indexing approach for multiplexed 16S rRNA gene sequencing on the Illumina MiSeq platform. Microbiome 2:6. doi: 10.1186/2049-2618-2-6
Feingersch, R., Suzuki, M. T., Shmoish, M., Sharon, I., Sabehi, G., Partensky, F., et al. (2010). Microbial community genomics in eastern Mediterranean Sea surface waters. ISME J. 4, 78–87. doi: 10.1038/ismej.2009.92
Feng, B. W., Li, X. R., Wang, J. H., Hu, Z. Y., Meng, H., Xiang, L. Y., et al. (2009). Bacterial diversity of water and sediment in the Changjiang estuary and coastal area of the East China Sea. FEMS Microbiol. Ecol. 70, 236–248. doi: 10.1111/j.1574-6941.2009.00772.x
Flombaum, P., Gallegos, J. L., Gordillo, R. A., Rincón, J., Zabala, L. L., Jiao, N. A. Z., et al. (2013). Present and future global distributions of the marine Cyanobacteria Prochlorococcus and Synechococcus. Proc. Natl. Acad. Sci. U.S.A. 110, 9824–9829. doi: 10.1073/pnas.1307701110
Friedline, C. J., Franklin, R. B., McCallister, S. L., and Rivera, M. C. (2012). Bacterial assemblages of the eastern Atlantic Ocean reveal both vertical and latitudinal biogeographic signatures. Biogeosciences 9, 2177–2193. doi: 10.5194/bg-9-2177-2012
Giovannoni, S., and Stingl, U. (2007). The importance of culturing bacterioplankton in the ‘omics’ age. Nat. Rev. Microbiol. 5, 820–826. doi: 10.1038/nrmicro1752
Gordon, A. L., Ma, S. B., Olson, D. B., Hacker, P., Ffield, A., Talley, L. D., et al. (1997). Advection and diffusion of Indonesian throughflow water within the Indian Ocean South Equatorial Current. Geophys. Res. Lett. 24, 2573–2576. doi: 10.1029/97GL01061
Hahnke, R. L., Probian, C., Fuchs, B. M., and Harder, J. (2013). Variations in pelagic bacterial communities in the North Atlantic Ocean coincide with water bodies. Aquat. Microb. Ecol. 71, 131–140. doi: 10.3354/ame01668
Han, W. Q., and McCreary, J. P. (2001). Modeling salinity distributions in the Indian Ocean. J. Geophys. Res. Oceans 106, 859–877. doi: 10.1029/2000JC000316
Haverkamp, T. H. A., Hammer, ø., and Jakobsen, K. S. (2014). Linking geology and microbiology: inactive pockmarks affect sediment microbial community structure. PLoS ONE 9:e85990. doi: 10.1371/journal.pone.0085990
Herlemann, D. P. R., Labrenz, M., Jürgens, K., Bertilsson, S., Waniek, J. J., and Andersson, A. F. (2011). Transitions in bacterial communities along the 2000 km salinity gradient of the Baltic Sea. ISME J. 5, 1571–1579. doi: 10.1038/ismej.2011.41
Herndl, G. J., and Reinthaler, T. (2013). Microbial control of the dark end of the biological pump. Nat. Geosci. 6, 718–724. doi: 10.1038/ngeo1921
Hong, C., Si, Y. X., Xing, Y., and Li, Y. (2015). Illumina MiSeq sequencing investigation on the contrasting soil bacterial community structures in different iron mining areas. Environ. Sci. Pollut. R 22, 10788–10799. doi: 10.1007/s11356-015-4186-3
Horel, A., Mortazavi, B., and Sobecky, P. A. (2014). Biostimulation of weathered MC252 crude oil in northern Gulf of Mexico sandy sediments. Int. Biodeter. Biodegr. 93, 1–9. doi: 10.1016/j.ibiod.2014.04.025
Jeffries, T. C., Ostrowski, M., Williams, R. B., Xie, C., Jensen, R. M., Grzymski, J. J., et al. (2015). Spatially extensive microbial biogeography of the Indian Ocean provides insights into the unique community structure of a pristine coral atoll. Sci. Rep. 5:15383. doi: 10.1038/srep15383
Jiao, N. Z., Yang, Y. H., Hong, N., Ma, Y., Harada, S., Koshikawa, H., et al. (2005). Dynamics of autotrophic picoplankton and heterotrophic bacteria in the East China Sea. Cont. Shelf Res. 25, 1265–1279. doi: 10.1016/j.csr.2005.01.002
Johnson, Z. I., Zinser, E. R., Coe, A., McNulty, N. P., Woodward, E. M. S., and Chisholm, S. W. (2006). Niche partitioning among Prochlorococcus ecotypes along ocean-scale environmental gradients. Science 311, 1737–1740. doi: 10.1126/science.1118052
King, G. M., Kostka, J. E., Hazen, T. C., and Sobecky, P. A. (2015). Microbial responses to the deepwater horizon oil spill: from coastal wetlands to the deep sea. Annu. Rev. Mar. Sci. 7, 377–401. doi: 10.1146/annurev-marine-010814-015543
Kolde, R. (2015). Pheatmap: Pretty Heatmaps (version1.0.7). Available online at: https://cran.r-project.org/web/packages/pheatmap/
Kunin, V., Engelbrektson, A., Ochman, H., and Hugenholtz, P. (2010). Wrinkles in the rare biosphere: pyrosequencing errors can lead to artificial inflation of diversity estimates. Environ. Microbiol. 12, 118–123. doi: 10.1111/j.1462-2920.2009.02051.x
Laas, P., Simm, J., Lips, I., and Metsis, M. (2014). Spatial variability of winter bacterioplankton community composition in the Gulf of Finland (the Baltic Sea). J. Mar. Syst. 129, 127–134. doi: 10.1016/j.jmarsys.2013.07.016
Li, H., Zhang, Q., Wang, X. L., Ma, X. Y., Lin, K. F., Liu, Y. D., et al. (2012). Biodegradation of benzene homologues in contaminated sediment of the East China Sea. Bioresour. Technol. 124, 129–136. doi: 10.1016/j.biortech.2012.08.033
Lin, L., He, J. F., Zhao, Y. L., Zhang, F., and Cai, M. H. (2012). Flow cytometry investigation of picoplankton across latitudes and along the circum Antarctic Ocean. Acta Oceanol. Sin. 31, 134–142. doi: 10.1007/s13131-012-0185-0
Lozupone, C. A., and Knight, R. (2007). Global patterns in bacterial diversity. Proc. Natl. Acad. Sci. U.S.A. 104, 11436–11440. doi: 10.1073/pnas.0611525104
Maidak, B. L., Cole, J. R., Lilburn, T. G., Parker, C. T., Saxman, P. R., Farris, R. J., et al. (2001). The RDP-II (Ribosomal Database Project). Nucleic Acids Res. 29, 173–174. doi: 10.1093/nar/29.1.173
Metzker, M. L. (2010). Sequencing technologies - the next generation. Nat. Rev. Genet. 11, 31–46. doi: 10.1038/nrg2626
Mohit, V., Archambault, P., and Lovejoy, C. (2015). Resilience and adjustments of surface sediment bacterial communities in an enclosed shallow coastal lagoon, Magdalen Islands, Gulf of St. Lawrence, Canada. FEMS Microbiol. Ecol. 91:fiv038. doi: 10.1093/femsec/fiv038
Morris, R. M., Rappé, M. S., Connon, S. A., Vergin, K. L., Siebold, W. A., Carlson, C. A., et al. (2002). SAR11 clade dominates ocean surface bacterioplankton communities. Nature 420, 806–810. doi: 10.1038/nature01240
Oksanen, J., Blanchet, F. G., Kindt, R., Legendre, P., Minchin, P. R., O'Hara, R. B., et al. (2015). Vegan: Community Ecology Package (Version 2.3-1). Available online at: https://cran.r-project.org/web/packages/vegan/
Parks, D. H., Tyson, G. W., Hugenholtz, P., and Beiko, R. G. (2014). STAMP: statistical analysis of taxonomic and functional profiles. Bioinformatics 30, 3123–3124. doi: 10.1093/bioinformatics/btu494
Partensky, F., and Garczarek, L. (2010). Prochlorococcus: advantages and limits of minimalism. Annu. Rev. Mar. Sci. 2, 305–331. doi: 10.1146/annurev-marine-120308-081034
Partensky, F., Hess, W. R., and Vaulot, D. (1999). Prochlorococcus, a marine photosynthetic prokaryote of global significance. Microbiol. Mol. Biol. R 63, 106–127.
Qian, P. Y., Wang, Y., Lee, O. O., Lau, S. C. K., Yang, J. K., Lafi, F. F., et al. (2011). Vertical stratification of microbial communities in the Red Sea revealed by 16S rDNA pyrosequencing. ISME J. 5, 507–518. doi: 10.1038/ismej.2010.112
Rusch, D. B., Halpern, A. L., Sutton, G., Heidelberg, K. B., Williamson, S., Yooseph, S., et al. (2007). The sorcerer ii global ocean sampling expedition: northwest atlantic through Eastern tropical pacific. PLoS Biol. 5:e77. doi: 10.1371/journal.pbio.0050077
Sarmento, H., Montoya, J. M., Vázquez-Domínguez, E., Vaqué, D., and Gasol, J. M. (2010). Warming effects on marine microbial food web processes: how far can we go when it comes to predictions? Philos. Trans. R. Soc. Lond. B Biol. Sci. 365, 2137–2149. doi: 10.1098/rstb.2010.0045
Schauer, R., Bienhold, C., Ramette, A., and Harder, J. (2010). Bacterial diversity and biogeography in deep-sea surface sediments of the South Atlantic Ocean. ISME J. 4, 159–170. doi: 10.1038/ismej.2009.106
Schloss, P. D., Westcott, S. L., Ryabin, T., Hall, J. R., Hartmann, M., Hollister, E. B., et al. (2009). Introducing mothur: open-source, platform-independent, community-supported software for describing and comparing microbial communities. Appl. Environ. Microbiol. 75, 7537–7541. doi: 10.1128/AEM.01541-09
Schott, F. A., Xie, S. P., and McCreary, J. P. (2009). Indian ocean circulation and climate variability. Rev. Geophys. 47:RG1002. doi: 10.1029/2007RG000245
Sjostedt, J., Martiny, J. B. H., Munk, P., and Riemann, L. (2014). Abundance of broad bacterial taxa in the Sargasso Sea explained by environmental conditions but not water mass. Appl. Environ. Microbiol. 80, 2786–2795. doi: 10.1128/AEM.00099-14
Sun, J., Steindler, L., Thrash, J. C., Halsey, K. H., Smith, D. P., Carter, A. E., et al. (2011). One carbon metabolism in SAR11 pelagic marine bacteria. PLoS ONE 6:e23973. doi: 10.1371/journal.pone.0023973
Sunagawa, S., Coelho, L. P., Chaffron, S., Kultima, J. R., Labadie, K., Salazar, G., et al. (2015). Structure and function of the global ocean microbiome. Science 348:1261359. doi: 10.1126/science.1261359
Techtmann, S. M., Fortney, J. L., Ayers, K. A., Joyner, D. C., Linley, T. D., Pfiffner, S. M., et al. (2015). The unique chemistry of eastern mediterranean water masses selects for distinct microbial communities by depth. PLoS ONE 10:e0120605. doi: 10.1371/journal.pone.0120605
Tripp, H. J. (2013). The unique metabolism of SAR11 aquatic bacteria. J. Microbiol. 51, 147–153. doi: 10.1007/s12275-013-2671-2
Tseng, C. H., Chiang, P. W., Lai, H. C., Shiah, F. K., Hsu, T. C., Chen, Y. L., et al. (2015). Prokaryotic assemblages and metagenomes in pelagic zones of the South China Sea. BMC Genomics 16:219. doi: 10.1186/s12864-015-1434-3
Urakawa, H., Martens-Habbena, W., and Stahl, D. A. (2010). High abundance of ammonia-oxidizing archaea in coastal waters, determined using a modified DNA extraction method. Appl. Environ. Microbiol. 76, 2129–2135. doi: 10.1128/AEM.02692-09
Vavrek, M. J. (2012). Fossil: Palaeoecological and Palaeogeographical Analysis Tools (Version 0.3.7). Available online at: https://cran.r-project.org/web/packages/fossil/
Weber, T. S., and Deutsch, C. (2010). Ocean nutrient ratios governed by plankton biogeography. Nature 467, 550–554. doi: 10.1038/nature09403
Xia, X. M., Guo, W., and Liu, H. B. (2015). Dynamics of the bacterial and archaeal communities in the Northern South China Sea revealed by 454 pyrosequencing of the 16S rRNA gene. Deep Sea Res. Part II 117, 97–107. doi: 10.1016/j.dsr2.2015.05.016
Yin, Q., Fu, B. B., Li, B. Y., Shi, X. C., Inagaki, F., and Zhang, X. H. (2013). Spatial variations in microbial community composition in surface seawater from the ultra-oligotrophic center to rim of the south pacific gyre. PLoS ONE 8:e55148. doi: 10.1371/journal.pone.0055148
Yooseph, S., Sutton, G., Rusch, D. B., Halpern, A. L., Williamson, S. J., Remington, K., et al. (2007). The sorcerer ii global ocean sampling expedition: expanding the universe of protein families. PLoS Biol. 5:e16. doi: 10.1371/journal.pbio.0050016
Zhang, Y., Zhao, Z. H., Dai, M. H., Jiao, N. Z., and Herndl, G. J. (2014). Drivers shaping the diversity and biogeography of total and active bacterial communities in the South China Sea. Mol. Ecol. 23, 2260–2274. doi: 10.1111/mec.12739
Zinger, L., Amaral-Zettler, L. A., Fuhrman, J. A., Horner-Devine, M. C., Huse, S. M., Welch, D. B. M., et al. (2011). Global patterns of bacterial Beta-diversity in seafloor and seawater ecosystems. PLoS ONE 6:e24570. doi: 10.1371/journal.pone.0024570
Keywords: prokaryotic diversity, biogeography, surface seawater, high throughput sequencing, 16S rRNA gene, environmental factors
Citation: Zheng X, Dai X and Huang L (2016) Spatial Variations of Prokaryotic Communities in Surface Water from India Ocean to Chinese Marginal Seas and their Underlining Environmental Determinants. Front. Mar. Sci. 3:17. doi: 10.3389/fmars.2016.00017
Received: 06 December 2015; Accepted: 03 February 2016;
Published: 19 February 2016.
Edited by:
Fengping Wang, Shanghai Jiao Tong University, ChinaCopyright © 2016 Zheng, Dai and Huang. This is an open-access article distributed under the terms of the Creative Commons Attribution License (CC BY). The use, distribution or reproduction in other forums is permitted, provided the original author(s) or licensor are credited and that the original publication in this journal is cited, in accordance with accepted academic practice. No use, distribution or reproduction is permitted which does not comply with these terms.
*Correspondence: Li Huang, huangl@sun.im.ac.cn