Seasonal Dynamics in Dissolved Organic Matter, Hydrogen Peroxide, and Cyanobacterial Blooms in Lake Erie
 Rose M. Cory1*
  Timothy W. Davis2
  Gregory J. Dick1,3
  Thomas Johengen4
  Vincent J. Denef3 Michelle A. Berry3 Sarah E. Page1† Susan B. Watson5
  Kate Yuhas1
  George W. Kling3
- 1Department of Earth and Environmental Sciences, University of Michigan, Ann Arbor, MI, USA
- 2Great Lakes Environmental Research Laboratory, National Oceanic and Atmospheric Administration, Ann Arbor, MI, USA
- 3Department of Ecology and Evolutionary Biology, University of Michigan, Ann Arbor, MI, USA
- 4Cooperative Institute for Limnology and Ecosystems Research, Ann Arbor, MI, USA
- 5Canada Centre for Inland Waters, Environment and Climate Change Canada, Burlington, ON, Canada
Hydrogen peroxide (H2O2) has been suggested to influence cyanobacterial community structure and toxicity. However, no study has investigated H2O2 concentrations in freshwaters relative to cyanobacterial blooms when sources and sinks of H2O2 may be highly variable. For example, photochemical production of H2O2 from chromophoric dissolved organic matter (CDOM) may vary over the course of the bloom with changing CDOM and UV light in the water column, while microbial sources and sinks of H2O2 may change with community biomass and composition. To assess relationships between H2O2 and harmful algal blooms dominated by toxic cyanobacteria in the western basin of Lake Erie, we measured H2O2 weekly at six stations from June to November, 2014 and 2015, with supporting physical, chemical, and biological water quality data. Nine additional stations across the western, eastern, and central basins of Lake Erie were sampled during August and October, 2015. CDOM sources were quantified from the fluorescence fraction of CDOM using parallel factor analysis (PARAFAC). CDOM concentration and source were significantly correlated with specific conductivity, demonstrating that discharge of terrestrially-derived CDOM from rivers can be tracked in the lake. Autochthonous sources of CDOM in the lake increased over the course of the blooms. Concentrations of H2O2 in Lake Erie ranged from 47 ± 16 nM to 1570 ± 16 nM (average of 371 ± 17 nM; n = 225), and were not correlated to CDOM concentration or source, UV light, or estimates of photochemical production of H2O2 by CDOM. Temporal patterns in H2O2 were more closely aligned with bloom dynamics in the lake. In 2014 and 2015, maximum concentrations of H2O2 were observed prior to peak water column respiration and chlorophyll a, coinciding with the onset of the widespread Microcystis blooms in late July. The spatial and temporal patterns in H2O2 concentrations suggested that production and decay of H2O2 from aquatic microorganisms can be greater than photochemical production of H2O2 from CDOM and abiotic decay pathways. Our study measured H2O2 concentrations in the range where physiological impacts on cyanobacteria have been reported, suggesting that H2O2 could influence the structure and function of cyanobacterial communities in Lake Erie.
Introduction
Hydrogen peroxide (H2O2) is an oxidative stressor to aquatic microorganisms (Lesser, 2006; Drábková et al., 2007), and its ubiquitous presence in surface waters (Petasne and Zika, 1987; Cooper et al., 1989, 1994) has been proposed to influence the community composition and toxicity of cyanobacterial harmful algal blooms (CHABs; Qian et al., 2010, 2012; Dziallas and Grossart, 2011; Paerl and Otten, 2013). In experimental work on whole bloom communities, addition of H2O2 (60 μM) resulted in selective killing of cyanobacteria as eukaryotic phytoplankton, zooplankton and macrofauna did not seem to be affected (Matthijs et al., 2012). The toxin microcystin, produced by some strains of M. aeruginosa and many other cyanobacterial species (O'Neil et al., 2012), has been hypothesized to protect against H2O2 (Paerl and Otten, 2013). For example, in lab cultures it was found that a microcystin-producing strain of M. aeruginosa better tolerated high H2O2concentrations than a non-microcystin-producing mutant of the same strain (Zilliges et al., 2011). Leunert et al. (2014) showed that a non-toxic strain of M.aeruginosa exhibited a physiological response to H2O2 concentrations as low as 50 nM, within the range of concentrations reported in surface waters (Cooper et al., 1994; Burns et al., 2012), while the toxic strain tolerated 10 times more H2O2. However, others have shown a more variable response of M. aeruginosa to H2O2 by strain and by H2O2 concentration, with responses varying between toxic and non-toxic strains of M. aeruginosa and by H2O2 concentration (Dziallas and Grossart, 2011).
While evidence from laboratory culture studies suggests that H2O2 has an effect on toxicity of M. aeruginosa, it is difficult to relate these findings to natural surface waters due to lack of information on the concentration of H2O2 that cyanobacteria may be exposed to during the course of a bloom. Predicting H2O2 concentrations during a bloom is not currently possible because sources and sinks of H2O2 are broader and more dynamic than previously recognized (Cooper et al., 1994; Vermilyea et al., 2010; Diaz et al., 2013; Marsico et al., 2015). Until recently, the dominant source of H2O2 in surface waters was thought to be from dissolved organic matter (DOM) interacting with UV light. Specifically, H2O2 is produced in all sunlit surface waters upon UV-light absorption by the chromophoric fraction of DOM (CDOM) (Petasne and Zika, 1987; Cooper et al., 1989). Variability in CDOM concentration and source affects the rate of UV light absorption and the depth of light penetration in the water column, which in turn control the photochemical production of H2O2 (Miller, 1998). Thus, knowing the concentration of CDOM and the apparent quantum yield for photochemical formation of H2O2 by CDOM, production of H2O2 in surface waters can be modeled as a function of depth, date, or latitude (Jerome and Bukata, 1998; Andrews et al., 2000; Kieber et al., 2014). Given strong gradients in CDOM in lakes or coastal waters related to riverine loading of terrestrially-derived CDOM (Minor and Stephens, 2008; Murphy et al., 2008; Abdulla et al., 2010; Stephens and Minor, 2010), variability in photochemical production of H2O2 in surface waters has also been suggested to be related to riverine discharge of CDOM (Andrews et al., 2000; O'Sullivan et al., 2005). Predicting H2O2 concentrations is more difficult in CHABs-impacted waters compared with coastal or open seawater due to high biological activity, which may decrease the total amount and the fraction of UV light absorption by CDOM in the water column, and possibly more importantly, due to increased biological production and decay of H2O2 (Dixon et al., 2013).
Research on the biological production of H2O2 has increased with the recognition that aerobic metabolism generates H2O2 and other reactive oxygen species (ROS) (Apel and Hirt, 2004). Biological sources of H2O2 have now been recognized as ubiquitous in the dark and sunlit water columns of streams, lakes, and coastal waters (Vermilyea et al., 2010; Diaz et al., 2013; Dixon et al., 2013; Winterbourn, 2013; Marsico et al., 2015). In addition, comparisons of photochemical to biological production rates of H2O2 have demonstrated that production of H2O2 by bacteria and algae may constitute a substantial fraction of the total H2O2 present in fresh and marine waters (Vermilyea et al., 2010; Dixon et al., 2013). Although the controls on biological production and decay of H2O2 in natural waters remain poorly understood, in general they have been proposed to depend on light and the abundance of microbial biomass (Zepp et al., 1987; Marsico et al., 2015). Thus, biological production may dominate over photochemical production of H2O2 by CDOM especially in particle-rich eutrophic waters characterized by high rates of respiration and potentially low rates of UV light absorption by CDOM.
While biological production of H2O2 could be high during a bloom, biological decay, the main sink for H2O2 in fresh and marine waters (Moffett and Zafiriou, 1990; Cooper et al., 1994), may also increase over the course of a bloom because rates of biological decay have been positively correlated with measures of microbial biomass (e.g., bacterial, algal, and total cell abundance; Marsico et al., 2015). The relationship between biological decay of H2O2 and biomass is consistent with the notion that many organisms have similar enzymatic capacity to break down H2O2 (i.e., catalase and peroxidase) (Moffett and Zafiriou, 1990; Cooper et al., 1994). Given the evidence that heterotrophic bacteria may be primarily responsible for H2O2 decay (Cooper et al., 1994), rates of biological decay may also depend on the availability of labile carbon (i.e., DOM) for bacteria. Therefore, DOM may influence H2O2 in natural waters both through photochemical production by CDOM, and also by fueling bacterial respiration and production (Wetzel, 1992).
Both the light-absorbing properties of CDOM and lability of DOM to bacteria depend on its sources and chemical composition (Cory and McKnight, 2005; Cory and Kaplan, 2012; Sleighter et al., 2014). These properties of DOM may vary in space and time in relation to proximity of riverine sources that deliver terrestrially-derived DOM rich in light-absorbing CDOM to lakes (Abdulla et al., 2010; Peterson et al., 2012), or over the course of a bloom as DOM source and composition shifts to more autochthonous carbon that is less light absorbing (Zhang et al., 2014) but likely more labile to bacteria (Cory and Kaplan, 2012; Hosen et al., 2014).
Understanding the potential influence of H2O2 on CHAB events is important given that these events in lakes and coastal waters are expected to worsen with climate or land-use change (O'Neil et al., 2012; Michalak et al., 2013; Paerl and Otten, 2013). Yet no study has examined the potential interactions between CDOM and H2O2 over the course of a bloom. To address this knowledge gap, we studied the spatial and temporal variability in H2O2 and CDOM concentration and sources approximately weekly across the western basin of Lake Erie from June to October and throughout Lake Erie in 2014 and 2015. Lake Erie is the most susceptible of the Laurentian Great Lakes to eutrophication and CHABs due to extensive anthropogenic nutrient inputs, warm summer temperatures, and shallow depth (Steffen et al., 2014). Within Lake Erie, CHABs have occurred annually since the mid-1990s, with blooms most frequently observed in the western basin (Brittain et al., 2000; Ouellette et al., 2006; Rinta-Kanto et al., 2009) that appear to be increasing in severity (Obenour et al., 2014). In the last 5 years Lake Erie has experienced two of the largest recorded blooms in its history (in 2011; Michalak et al., 2013; and in 2015), and in 2014, elevated concentrations of microcystins, shut down the drinking water supply to nearly a half million people in and around Toledo, OH for just over 2 days.
In this study, we measured H2O2 concentrations in Lake Erie and in field experiments, and combined these data with information from the literature to estimate photochemical and biological production and decay of H2O2. We concurrently measured CDOM and characterized its sources and composition using optical proxies including excitation emission matrices (EEMs) and parallel factor analysis (PARAFAC; Stedmon et al., 2003), which provide information on at least three types of carbon varying in source and lability to bacteria (Cory and McKnight, 2005; Cory and Kaplan, 2012). Biological activity over the course of the bloom in Lake Erie was characterized using whole water respiration rates, chlorophyll a, and particulate microcystins along with a suite of supporting water quality measurements. We present several lines of evidence for the importance of biological controls and responses to the H2O2 concentrations in Lake Erie.
Materials and Methods
Site Description
The western basin of Lake Erie is about one-fifth of the total lake surface area, the fourth largest lake in North America. The mean water depth of stations sampled in the western basin was 6 m, ranging from ~2–3 m at station 6 to 7–9 m at stations 4 and 13 (Figure 1), representative of the average depth of the western basin (7.4 m; O'Donnell et al., 2010). The waters of the western basin are more sediment and nutrient rich than other basins in the lake (and compared to other Great Lakes), due to the large loads from the Detroit and Maumee Rivers and due to re-suspension (Michalak et al., 2013). For example, the agricultural-dominated Maumee River system delivers nitrogen and phosphorus from farmland fertilizer that has been implicated in the increasing prevalence of CHABS. CHABs in western Lake Erie develop during summer months (Rinta-Kanto et al., 2005; Bridgeman et al., 2012) and in the open waters are generally dominated by the cyanobacterium, Microcystis (Rinta-Kanto et al., 2005). However, tributaries into Sandusky Bay, and the Maumee River, are dominated by the cyanobacterium Planktothrix (Conroy et al., 2007; Kutovaya et al., 2012; Davis et al., 2015). Both cyanobacteria are the primary toxin producers in the open waters and tributaries, respectively (Rinta-Kanto et al., 2009; Kutovaya et al., 2012; Davis et al., 2014).
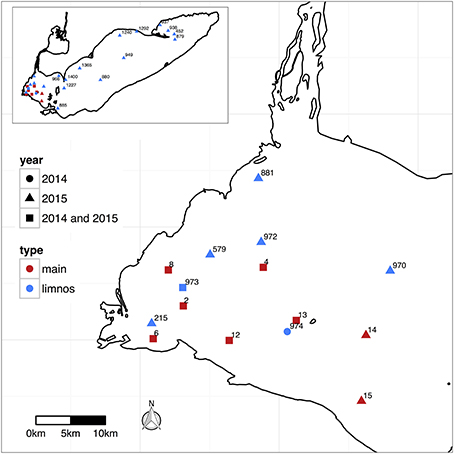
Figure 1. Stations sampled in Lake Erie during 2014 and 2015 identified by site ID number, with “main” corresponding the stations sampled weekly during summer 2014 and 2015, and “limnos” corresponding to the stations sampled on the CCGS Limnos cruises during August and September 2014 and August and October, 2015.
Sample Collection and Supporting Water Quality Analysis
In 2014 and 2015, samples were collected weekly from six sites in the western basin of Lake Erie (Figure 1) from June through October. In 2014, water samples were also collected from several of these sites in May. Water samples were collected using a peristaltic pump and tygon tubing deployed from the ship deck to collect a surface integrated water sample (over the top 2–3 m of the water column for sites in the western basin). On two dates (25 August and 18 September 2014), waters samples were collected in the western basin at Stations 2, 4, and 12 from two depths in the water column: “surface” (0.1 m), and “deep” (4–7 m, depending on the station). In August and October 2015, water samples were collected during the Lake Erie CCGS Limnos cruises from nine sites in the western basin, three in the central basin, and two in the eastern basin (Figure 1). Water samples for the Limnos cruises were collected using a rosette from a depth of 1 m, and at selected sites also from one meter above the bottom (with bottom depths ranging from 10 – 61 m depending on the site). Temperature, specific conductivity, turbidity, and photosynthetically active radiation (PAR) were measured using a CTD deck-board profiler. Water column pH was measured on the ship deck from unfiltered, whole water immediately after sample collection using a standard lab probe calibrated the morning of the cruise with standard buffer solutions (pH 4.0, 7.0, and 10.0, Fisher Scientific).
CDOM Characterization
Absorption coefficients of CDOM and optical proxies for CDOM source and composition were analyzed on GF/F-filtered water using an Aqualog (Horiba Scientific) using 1-cm quartz cuvettes. For lake water samples with relatively low CDOM concentrations, CDOM spectra were analyzed using a 5 or 10-cm quartz cuvette on a UV-Vis spectrophotometer (Cary Varian 300). The spectral slope (SR) ratio of CDOM, a proxy for the average molecular weight of DOM, was calculated from the absorbance spectrum of each sample (Helms et al., 2008). Naperian absorption coefficients of CDOM (aCDOMλ) were calculated as follows:
where A is the absorbance reading and l is the path length in meters. SUVA254 was calculated following (Weishaar et al., 2003) where absorbance readings at 254 nm were divided by the cuvette pathlength (m) and then divided by the DOC concentration (mg C L−1; Table 1).
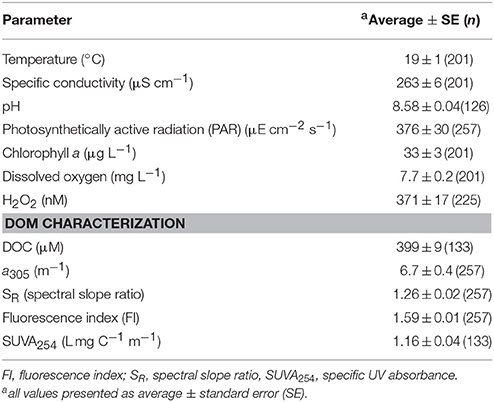
Table 1. Physical, chemical, biological water quality of the western basin in Lake Erie.
Fluorescence spectra of CDOM were measured from excitation-emission matrices (EEMs) analyzed on water samples with an Aqualog following (Cory et al., 2010b). EEMs were corrected for inner-filter effects and for instrument-specific excitation and emission corrections in Matlab (version 7.7) following Cory et al. (2010b). The fluorescence index (FI; McKnight et al., 2001) was calculated from each corrected EEM as the ratio of emission intensity at 470 nm over the emission intensity at 520 nm at an excitation wavelength of 370 nm (Cory et al., 2010b).
PARAFAC was employed to separate the dataset of 260 Lake Erie EEMs into mathematically and chemically-independent components (each representing a single fluorophore or a group of strongly co-varying fluorophores) multiplied by their excitation and emission spectra (representing either pure or combined spectra). The result is a reduction of the 3-dimensional EEM data into 2-dimensional spectra representing chemically independent components (Stedmon et al., 2003; Stedmon and Bro, 2008). A PARAFAC model allows identification of the underlying structure of a dataset of EEMs, but the components identified likely do not correspond to pure spectra. In a complex mixture such as CDOM, components represent spectra of chemically similar fluorophores or groups of fluorophores that strongly co-vary under the experimental conditions (Stedmon et al., 2003; Stedmon and Bro, 2008). The PARAFAC model was generated and validated following the procedures in Stedmon and Bro (2008) using the DrEEM Toolbox in Matlab V 7.7 (Murphy et al., 2013).
Briefly, the dataset of 260 EEMs from Lake Erie was normalized to unit intensity during the model tests to reduce the concentration-related collinearity of the components and to allow low concentration samples to influence the model (Murphy et al., 2013). Excitation wavelengths were 252–450 nm in 2-nm increments, while emission wavelengths ranged from 305 to 500 nm in 1-nm increments. During the exploratory analysis, model runs were evaluated for three to six components. Modeled, measured, and residual EEMs were visually examined for model fit and outliers, with five samples removed as outliers. A four component model was validated (Figure 2) using a multi-split analysis: 255 EEMs were split by alternating split style into six different datasets that were modeled independently from one another (Murphy et al., 2013). All three validation tests passed from the six-way-split validation. The model explained 99.8% of the variation within the dataset, with variation explained by each component decreasing in order from component one to component four (C1 through C4). Fmax values were used to quantify relative concentration of each component in a water sample (Stedmon et al., 2003; Murphy et al., 2013), which is the fluorescence of each component at the respective excitation and emission maximum (Table 2).
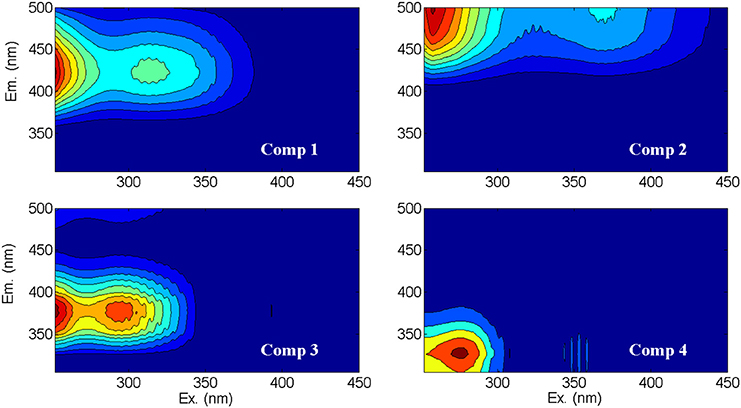
Figure 2. Contour plots of the fluorescent spectra of the four CDOM components (Comp 1 through Comp 4) identified by PARAFAC analysis of Lake Erie EEMs. The model explained 99.8% of the variation within the dataset, with variation explained by each component decreasing in order from component one to component four. Component descriptions and likely sources are in Table 2.
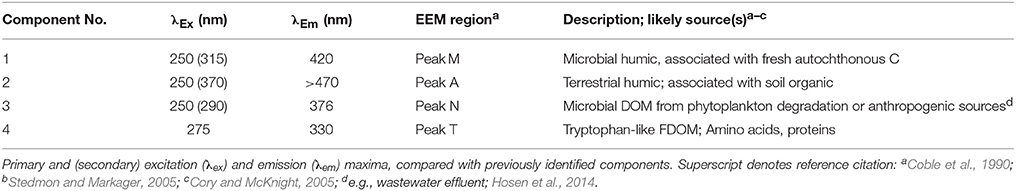
Table 2. Fluorescence characteristics of Lake Erie water.
UV Absorbance and Attenuation in Lake Erie
To determine the fraction of UV light absorbed by CDOM relative to all UV light-absorbing constituents in Lake Erie, the absorbance of unfiltered whole water was measured from each station visited during the weekly cruises between 25 August and 3 November 2014. Whole water samples were analyzed using a diffuse-reflectance accessory (Cary 5000, Varian Inc.). The absorption spectrum of the whole water (atot, λ) was determined by subtracting the reflectance from the transmittance of the suspension; this method corrects for the influence of light scattering on the absorption properties of suspended particles (Tassan and Ferrari, 2003).
UV light attenuation was measured in-situ in Lake Erie as a function of depth at several stations in June, August, and September 2014 using a compact optical profiling system for UV light in natural waters (UV C-OPS; Biospherical Instruments Inc.) as previously described (Cory et al., 2013, 2014). The C-OPS measured downwelling cosine-corrected irradiance at seven wavebands (305, 313, 320, 340, 380, 395, and 412 nm) and PAR (400–700 nm). Attenuation coefficients (Kd, λ) were calculated from the down-welling irradiance (Eλ) as a function of depth (z) at each waveband:
From multiple casts, (n = 2–4), the coefficient of variation of Kd, λ ranged from 1 to 3% in the UV and 9% for PAR.
Biological Activity
Chlorophyll-a concentration (Chl a) was measured by concentrating lake water on a glass fiber filter (Whatman GF/F, 47 mm diameter) using low vacuum pressure. Samples were extracted with N, N-dimethylformamide under low light levels and analyzed with a 10AU fluorometer (Turner Designs; Speziale et al., 1984). Particulate microcystins (MCs) were collected onto a 1.2 μm polycarbonate membrane and kept at −20°C until analysis. Particulate MCs were extracted from samples using a combination of physical and chemical lysis techniques. All samples were resuspended in 1 mL molecular grade water (pH 7; Sigma- Aldrich, St. Louis, MO) and subjected to three freeze/thaw cycles before the addition of the QuikLyse reagents (Abraxis LLC; Warminster, PA) as per the manufacturer' s instructions. The samples were then centrifuged for 5 min at 2 × 10³g to pellet cellular debris. The concentrations of microcystins (reported as microcystin-LR equivalents) were measured using an enhanced sensitivity microcystin enzyme-linked immunosorbent assay (Abraxis LLC) following the methodologies of (Fischer et al., 2001). This assay is congener-independent as it detects the ADDA moiety, which is found in almost all MCs. These analyses yielded a detection limit of 0.04 μg L−1.
Whole water respiration was measured from unfiltered water at three of the six main stations collected weekly in the western basin in summer 2014. Each water sample was incubated for 3–5 days in the dark at room temperature (25°C, similar to summer lake temperature) alongside killed controls (1% HgCl2) in air-tight, pre-combusted 12-mL borosilicate exetainer vials (Labco, Inc). Respiration was measured as dissolved oxygen (O2) consumption relative to killed controls using a membrane inlet mass spec (MIMS; Cory et al., 2014). There were four independent replicates from each water sample for every analysis type and treatment, and all values are presented as average ± standard error.
H2O2 Concentrations
During the weekly sampling in the western basin in 2014, 0.2 μm filtered water was prepared for H2O2 analysis below deck on the ship within 30 min of sample collection. In 2015, 0.2 μm filtered water samples were transported on ice in the dark back to the laboratory for H2O2 analysis (hold time 2–8 h). All samples collected onboard CCGS Limnos were immediately filtered through 0.2 μm membrane filters and placed in the dark at 4°C until batches of 3–4 samples were ready for H2O2 analysis (hold time <12 h). H2O2 concentrations were measured using the Amplex Red method on a UPLC (Waters Technology Corporation) due to its sensitivity and selectivity for H2O2 (Burns et al., 2012). Standard additions of H2O2 (40–500 nM) were performed on every sample with four replicates per concentration of added H2O2. H2O2 concentrations were determined from the x-intercept and slope of the linear regression of the standard additions (R2 typically >0.98). Uncertainty in each H2O2 measurement was quantified as the standard error of the concentration, calculated from the variance in the x-intercept of the standard addition. DI water, reagent blanks, and H2O2 check standards prepared in DI water were analyzed before, during, and after each cruise to identify contamination from “background” H2O2 present in the reagents and changes in H2O2 standards during the cruise. H2O2 in stock solutions used for the standard additions on the cruises generally decreased during the day by ~5–10%, and this decrease was taken into account for samples prepared in 2014 during the cruises.
Photochemical Production of H2O2 by CDOM
Photochemical production of H2O2 by CDOM in the water column over depth z is the product of three spectra: the apparent quantum yield (AQY) for H2O2 formation by CDOM (Φλ;mol H2O2 mol−1 photons absorbed), the spectrum of the UV photon flux absorbed by CDOM (Qa, λ;mol photons m−2s−1), and the spectrum of the ratio of absorption by CDOM to the total absorption (i.e., aCDOM, λ/ atot, λ):
Where λmin and λmax are the minimum and maximum wavelengths of light contributing to the photochemical formation of H2O2 by CDOM (280 and 420 nm, respectively), atot, λ is the total absorption in the water column (CDOM, particles, and water), and Qa, λ is the light absorbed by CDOM in the water column calculated as:
where E0, λ is the incident photon flux reaching the surface of Lake Erie. Here we provide information on how we quantified (a) the apparent quantum yield spectra (Φλ), (b) the photon flux spectra used to calculate photons absorbed by CDOM in the water column (Qa, λ), and (c) spectrum of the ratio of absorption by CDOM to the total absorption (i.e., aCDOM,λ/ atot,λ). A spectrum of aCDOM,λ/ atot,λ was obtained by dividing the absorption spectrum of CDOM by the absorption spectrum of whole water.
Several studies have reported little variation in the spectrum of the apparent quantum yield (Φλ) for H2O2 production from different sources of CDOM (Kieber et al., 2014; Powers and Miller, 2014), and thus average Φλ, pooled from multiple marine and freshwaters measurements, are often used to estimate photochemical production of H2O2 by CDOM (Vermilyea et al., 2010; Powers and Miller, 2014). To evaluate whether use of a previously reported, pooled apparent quantum yield is realistic for Lake Erie, we compared calculated vs. observed photochemical H2O2 production rates from laboratory experiments where filtered Lake Erie water was exposed to simulated sunlight in borosilicate tubes using a Suntest XLS solar simulator (Atlas) alongside foil-wrapped dark controls. Water temperature ranged from 20 to 23°C over the 40-min photo-exposures. For Lake Erie water, the photo-exposure experiments fit the criteria for optically thin conditions, and thus can be characterized as near-surface photo-production rates:
Where E0, λ is the incident light from the solar simulator reaching the water sample in the photo-tubes, corrected for transmission spectrum of the borosilicate glass (Cory et al., 2014). Exposure of river water and Lake Erie water collected in May 2014 resulted in production of H2O2 with no detectable dark loss of H2O2 from the filtered water over the experiment (Figure 3), consistent with biological decay as the main sink for H2O2 (Moffett and Zafiriou, 1990, 1993; Cooper et al., 1994). For each sample, the calculated photochemical production rate of H2O2 using previously reported Φλ was about three-fold lower than observed (at 310 or 350 nm). Thus, we used an Φλ spectrum approximately three times the pooled mean value spectrum reported from Powers and Miller (2014) to generate estimates of photochemical production of H2O2 in Lake Erie; this results in a bias toward higher estimated rates of photochemical production (see Discussion).
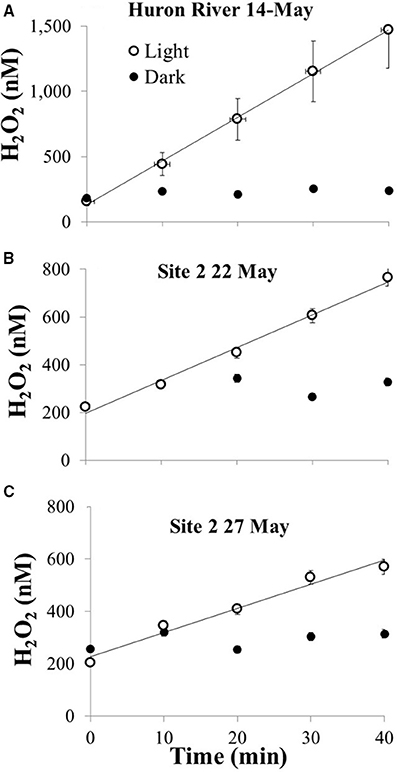
Figure 3. Photochemical production of H2O2 from 0.2 μm filtered water collected in May 2014 for (A) river that drains into Lake Erie, (B) Lake Erie site 2 collected on 22 May, and (C) Lake Erie site 2 collected on 27 May. All waters were exposed to simulated sunlight in the laboratory alongside foil-wrapped dark controls; water temperatures were between 20 and 23°C for light-exposed and dark samples.
To estimate the photon flux reaching the surface of Lake Erie (E0, λ), we used direct and indirect irradiance values corresponding to the time of the sample collection during each cruise (NCAR TUV calculator1 with latitude and longitude coordinates set at a station in the western basin of Lake Erie. This estimate of photon flux reaching the water surface of Lake Erie is likely a maximum, because it neglects the effects of clouds or reflection from the water surface.
Biological Production and Decay of H2O2
We estimated the net rate of biological production or decay of H2O2 in western Lake Erie from three microcosm experiments conducted during late August and early September 2014 onboard the CCGS Limnos. To initiate experiments, triplicate 2-L transparent, polycarbonate bottles were filled with whole surface water and either left unamended to serve as controls or spiked with nitrogen (ammonium nitrate; 20 μM final concentration) and orthophosphate (2 μM final concentration). Within an hour after sample collection, the experimental bottles were placed in flow-through incubators under natural light and temperature conditions for 48 h with nutrients replenished at 50% of initial spike concentrations every 12 h. The incubators were covered in neutral density screen (Lee Filters) that reduced UV and visible light by ~80–50% (as provided by the manufacturer, and checked in the laboratory using the diffuse reflectance accessory as described above for whole water absorbance measurements). Conducting experiments in visible light allowed the autotrophs to function while minimizing photochemical sources of H2O2, which depend on UV light (Andrews et al., 2000). Photochemical production of H2O2 by CDOM could range from ~1 nM h−1 to an upper limit of 36 nM h−1 during the microcosm experiments, with the most likely rate around 1–10 nM h−1. The values included in the calculation are well-constrained by measured values of CDOM in the water used in the microcosm experiments, by the transmission spectra of the filters used to screen the light, and by the apparent quantum yields of CDOM (Φλ) in the literature. While visible light has been reported to account for some photochemical production of H2O2 in freshwaters (Richard et al., 2007), the CDOM absorption coefficients and AQYs are likely too low to result in substantial H2O2 during these experiments (see Results and Discussion), and thus photochemical formation of H2O2 by CDOM during the microcosm experiments was probably on the low end of the calculated production rates (i.e., 1–10 nM h−1). Thus, the design of the microcosm experiments isolated the biological contribution of H2O2 from photochemical sources of H2O2.
Results
Spatial and Temporal Patterns in CDOM Concentration
CDOM absorption coefficients at 305 nm (a305) ranged from 1 to 37 m−1 and were significantly, positively correlated with dissolved organic carbon (DOC) as expected (Figure 4). Thus, spatial and temporal patterns of CDOM represent concentrations of bulk DOC and of the light-absorbing fraction of the DOC pool. CDOM was significantly, positively correlated with specific conductivity (Figure 5A). Specific conductivity is a proxy for water masses associated with the Detroit or Maumee Rivers in the western basin of Lake Erie given that these rivers have different average conductivities and deliver substantial loads of total dissolved solids to the lake (Richards et al., 2010; Larson et al., 2013; Scavia et al., 2014). Because specific conductivity generally decreases with distance from the river mouths as water masses are mixed within the lake, the correlation between a305 and specific conductivity also reflected the observation that CDOM increased with proximity to the rivers in both 2014 and 2015 (Figure 5).
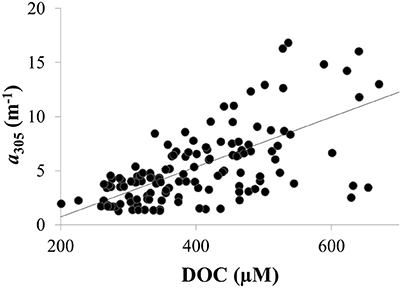
Figure 4. CDOM concentration was positively correlated with DOC concentrations in Lake Erie in 2014 as shown for CDOM absorption coefficient at 305 nm (a305) (R2 = 0.4; p < 0.01). Similar results were obtained using CDOM absorption coefficients at other wavelengths (not shown).
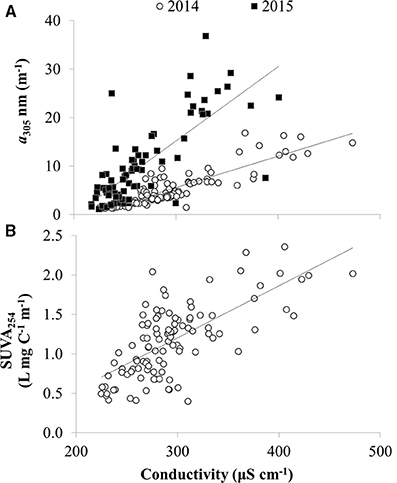
Figure 5. CDOM concentration and composition vs. specific conductivity in Lake Erie. (A) CDOM absorption coefficient at 305 nm (a305) vs. specific conductivity in 2014 and 2015. (B) Specific UV absorbance at 254 nm (SUVA254) vs. conductivity in 2014 (DOC data not available for 2015). Lake water with higher specific conductivity is more influenced by river water, whereas lake water with lower specific conductivity is less influenced by river water. Lines show linear regression fit for slopes significantly different than zero (p < 0.01).
Like the spatial gradients in CDOM in Lake Erie, year to year differences in CDOM also appeared to be related to river discharge. There was greater CDOM per unit specific conductivity in 2015 compared with 2014 (Figure 5A) concurrent with high Maumee River discharge associated with frequent storms in the region that led to the wettest June on record2. During both summers in 2014 and 2015, CDOM was generally higher at each station in June compared with October-November (Figure 6), consistent with high river discharge from spring runoff or storms that increase specific conductivity and CDOM in the lake. The seasonal decrease in CDOM was greater in 2015 compared with 2014 (Figure 6A), and at stations closest to the river (data not shown).
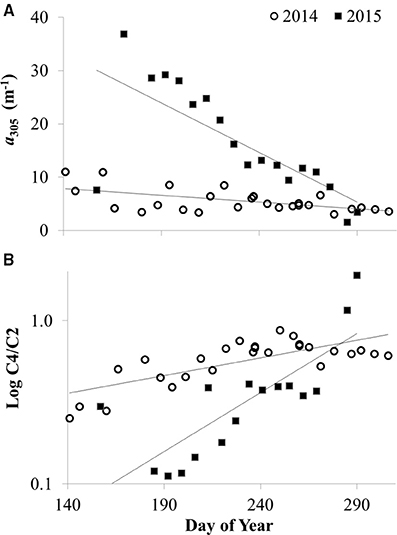
Figure 6. CDOM concentration and source vs. day of the year in 2014 and 2015 at site 2 (a near-shore station closest to the Maumee River) in Lake Erie. (A) CDOM concentration as measured by the absorption coefficient at 305 nm (a305). (B) CDOM source given by the ratio of CDOM fluorescence components: amino acid component C4 divided by terrestrial component C2 (C4/C2). Lines show linear regression fit for slopes significantly different than zero (p < 0.01).
Spatial and Temporal Patterns in CDOM Source
On average, CDOM in Lake Erie had low UV absorbance at 254 nm (SUVA254), high spectral slope ratio (SR), and a high fluorescence index (FI; Table 1). The values of these optical proxies for CDOM source (Tables 1, 2) demonstrated that CDOM has relatively low aromatic C content (SUVA254 and FI; McKnight et al., 2001; Weishaar et al., 2003), and was comprised of relatively low molecular weight compounds (SR; Helms et al., 2008), consistent with a strong contribution of microbially-derived organic matter to the CDOM pool in the lake (FI) (McKnight et al., 2001; Cory and McKnight, 2005).
Consistent with previous PARAFAC models of CDOM fluorescence (Table 2), the spectra of the CDOM components (Figure 2) suggested contributions from humic and fulvic acids associated with microbial (C1) or terrestrial precursor organic matter (C2), CDOM from recently produced microbial matter (C3), and CDOM associated with free or combined amino acids (C4). Like CDOM absorption coefficients (e.g., a305), the first three CDOM model components (C1, C2, C3; Table 2) were also significantly, positively correlated with specific conductivity (p < 0.01), providing further evidence for rivers as dominant sources of CDOM to the western basin of Lake Erie (shown for C2 in Figure 7A). Component C4 (amino-acid-like) was significantly, positively correlated with specific conductivity (p < 0.01; Figure 7B), although the relationship was weaker compared with components C1, C2, and C3; this suggests relatively greater in-lake (autochthonous) sources of C4 compared with the other CDOM components.
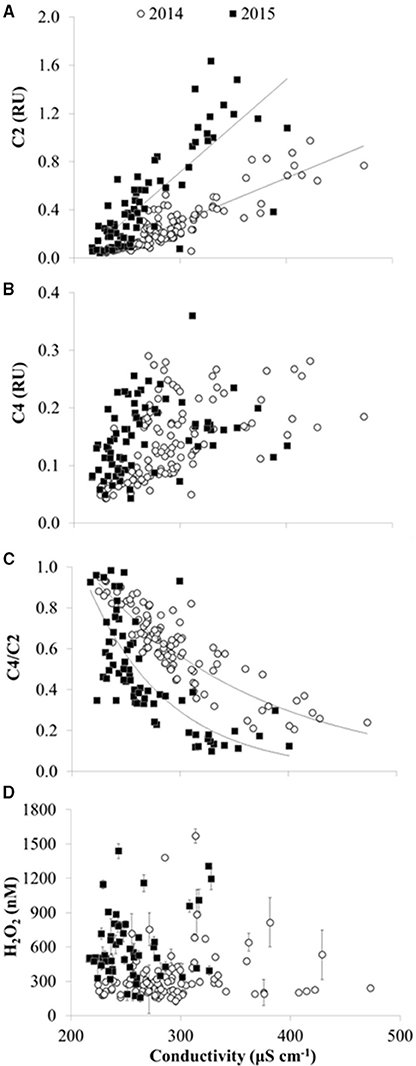
Figure 7. CDOM fluorescence and H2O2 vs. specific conductivity in 2014 and 2015 in Lake Erie. (A) Concentration of CDOM fluorescence component C2 (terrestrial humic-like FDOM) in Raman Units (RU). Lines show fit of linear regressions for slopes significantly different than zero at p < 0.01. (B) Concentration of CDOM component C4 (amino acid-like FDOM). While the slope of C4 vs. specific conductivity was significantly different than zero (p < 0.05) for 2014 and 2015, results of the linear regression were not plotted due to R2 < 0.3. (C) CDOM source given by the ratio of amino acid component C4 divided by terrestrial component C2 (C4/C2). Lines show exponential fit. (D) H2O2 concentrations (average ± SE, n = 4).
There were spatial patterns in CDOM composition and source in Lake Erie. For example, the specific UV absorbance at 254 nm (SUVA254), a proxy for the aromatic C content of DOM, was significantly, positively correlated with specific conductivity (Figure 5B), indicating a decrease in aromatic C with distance from the river mouths in western Lake Erie. Likewise, the ratio of amino-acid to terrestrial humic CDOM (C4/C2) was significantly, inversely correlated with specific conductivity (Figure 7C), consistent with a shift in CDOM source to relatively more autochthonous organic matter offshore compared with stations closest to the rivers.
In contrast to the spatial patterns in surface waters of Lake Erie, there was little difference in CDOM amount or composition with depth for the deeper sites sampled on the Limnos cruises. For example, the amount of terrestrial humic component C2 in surface vs. bottom waters was similar under mixed conditions (i.e., surface vs. bottom values of C2 plotted on the 1:1 line in Figure 8A), and only slightly higher C2 was observed in surface vs. bottom waters under stratified conditions (Figure 8A). Surface waters were slightly enriched compared to bottom waters in amino-acid component C4 compared with terrestrial component C2 under both stratified and mixed conditions (Figure 8B), suggesting more autochthonous production of amino-acid like FDOM in surface than in bottom waters.
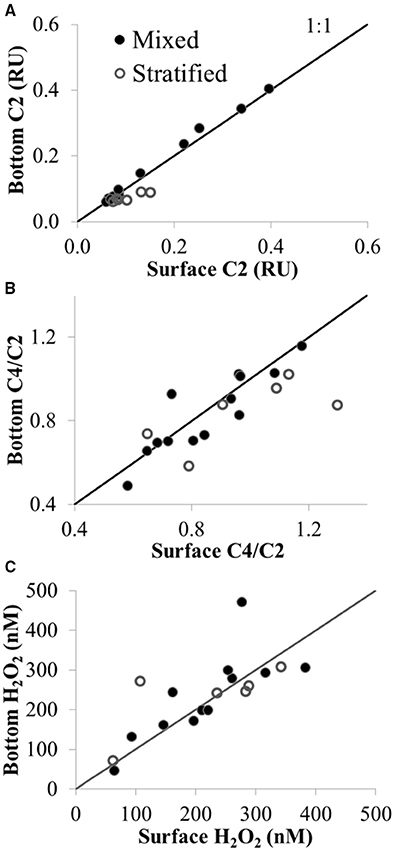
Figure 8. CDOM fluorescence and H2O2 in surface (upper 1 m) vs. bottom waters (4–61 m) under mixed and stratified conditions in Lake Erie plotted with the 1:1 line. (A) Concentration of CDOM component C2 (terrestrial humic-like FDOM) in Raman Units (RU). (B) Ratio of amino acid to terrestrial CDOM (C4/C2). (C) H2O2 concentration (nM). Sites sampled with depths >7 m were those sampled in the central and eastern basin of Lake Erie on the Limnos cruises (see Figure 1).
There were seasonal shifts in CDOM source. At most stations, the ratio of amino-acid to terrestrial humic components (C4/C2) increased from June through October in both 2014 and 2015 (Figure 6B), demonstrating a relative increase in autochthonous sources of CDOM over the summer. The increase in C4/C2 over the summer was greater in 2015 compared with 2014 (Figure 6B). Although CDOM shifted in a manner consistent with greater autochthonous inputs over the course of the bloom in Lake Erie during both 2014 and 2015, there were no significant correlations between CDOM concentration or composition and indicators of bloom strength or toxicity (i.e., Chl a, whole water respiration, or particulate microcystins).
Light Absorption and Attenuation
The fraction of UV light absorbed by CDOM relative to all UV-absorbing constituents in the water column (i.e., aCDOMλ /atotλ) ranged from 0.72 ± 0.02 at 305 nm to 0.67 ± 0.02 at 412 nm (n = 64; Figure 9). This result shows that CDOM accounted for ~70% of the UV light absorbed in the water column of Lake Erie. Similar results were obtained by comparing the absorbance coefficients of CDOM (aCDOMλ, measured on filtered water in the laboratory), to the attenuation coefficients measured in-situ in Lake Erie (Kd, λ, corrected for solar zenith angle at the time of collection in the field). For a smaller dataset (n = 9 comparisons) than the aCDOMλ/atotλ ratios, aCDOMλ values were on average 60 ± 10% to 40 ± 10% of the Kd, λ value for the same water at 305–412 nm, respectively (data not shown). Thus, independent of the approach used to characterize the fraction of UV light absorbed by CDOM in the water column, the results showed that CDOM accounted for 60–70% of UV absorbance in the water column of Lake Erie.
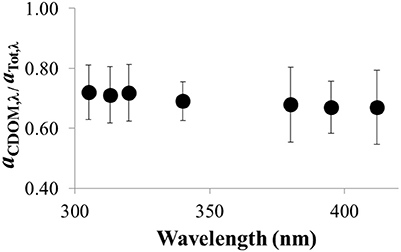
Figure 9. Ratio of of aCDOM, λ/aTot, λ vs. wavelength in the UV for Lake Erie water (average ± SE, n = 64 water samples collected over the summer in 2014).
However, there were some spatial and temporal differences in the fraction of total UV light absorbed by CDOM in Lake Erie. Maximum ratios of aCDOMλ/atotλ (~1) were most often observed at the most offshore stations (sites 4 and13; Figure 1), indicating that at these stations CDOM was the dominant UV light absorbing constituent in the water column with little contribution from algae or other particles. The lowest ratio of aCDOMλ/atotλ (0.14 ± 0.02 at 412 nm) was observed when the water was turbid likely from resuspension of bottom sediments following a storm in November 2014.
H2O2 Concentrations in Lake Erie
H2O2 concentrations in the surface waters of Lake Erie varied by over an order of magnitude during the study period, from 47 ± 16 nM to 1570 ± 60 nM (average ± SE from triplicate measurements of each water sample), with an overall average of 371 ± 17 nM (average ± SE, n = 225; Figure 10D). H2O2 concentrations were not correlated with any chemical or physical parameter in Lake Erie (e.g., DOC, CDOM concentration or sources, date, time, water temperature, PAR, pH, specific conductivity, wave height, or any other parameter measured concurrently with H2O2 concentrations; data not shown).
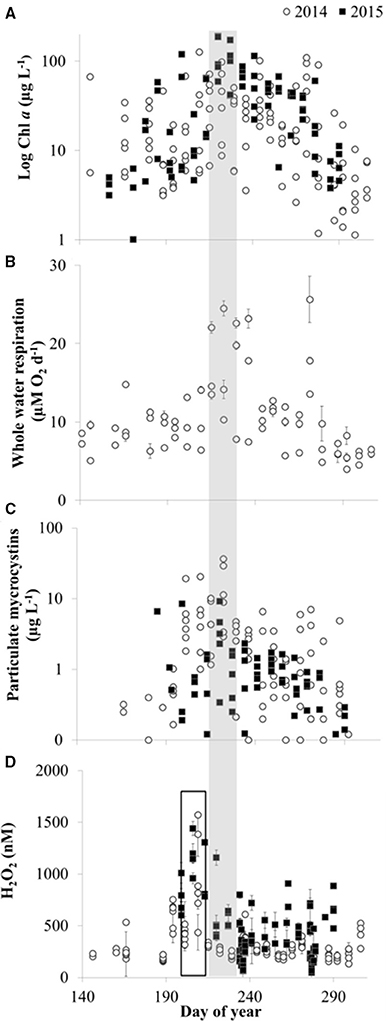
Figure 10. Temporal patterns in biological activity and H2O2 in Lake Erie. (A) Chlorophyll a (Chl a) concentrations. (B) Whole water respiration rates (average ± SE, n = 3). (C) Concentration of particulate microcystins. (D) H2O2 concentrations (average ± SE, n = 4). The shaded bar indicates the time of peak Chl a, whole water respiration, and particulate microcystins, while the open bar indicates the earlier peak in H2O2 concentrations.
Temporal patterns of variation in H2O2 concentrations were generally larger than spatial variation in H2O2 in the lake. In both 2014 and 2015, maximum H2O2 concentrations were observed at all stations in mid to late July, just prior to peak Chl a, whole water respiration rates, and particulate microcystins at all stations (Figure 10). In addition, fairly similar concentrations of H2O2 were observed between stations on a given date except when H2O2 concentrations were highest (Figure 11). For example, comparing H2O2 at the station closest to the river with the most offshore station, usually there was no detectable difference in H2O2 between stations (Figure 11) despite large differences in water chemistry or biology. In contrast, there were large differences in H2O2 concentrations between the near-river and offshore stations when H2O2 concentrations peaked in mid to late July 2014 (Figure 11)
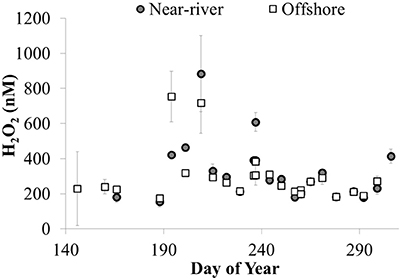
Figure 11. H2O2 concentrations (nM) at nearshore (site 12) and offshore (site 4) stations plotted vs. day of year in 2014 (average ± SE, n = 4).
H2O2 concentrations were generally similar between surface and bottom waters, despite a wide range in water depth (from 4 to 61 m, depending on the site sampled) and degree of stratification at the time of sample collection at each station (Figure 8C). The largest difference in H2O2 concentration between surface water and depth was observed when H2O2 at 21 m was nearly double the surface concentration at the same site under mixed conditions (471 ± 65 nM vs. 277 ± 49 nM H2O2 in bottom vs. surface, respectively at site 949 in the central basin; Figure 8C).
Calculated Photochemical Production of H2O2 by CDOM
UV light reaching the lake surface and CDOM concentrations peaked in June and then decreased over the summer season (Figure 12A). It follows that the calculated photochemical production of H2O2 in the water column by CDOM decreased from ~150 nM h−1 in waters with high light and high CDOM in May and June to <10 nM h−1 in waters with low light and low CDOM in October [assuming a constant apparent quantum yield for H2O2 production from CDOM; Equation (3)].
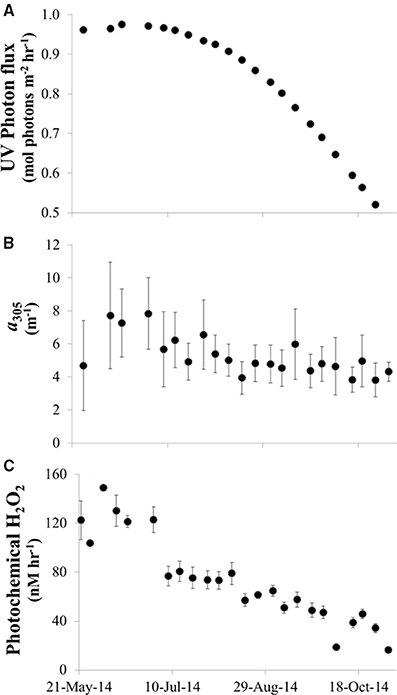
Figure 12. Photochemical production of H2O2 by CDOM in Lake Erie during summer 2014. (A) Modeled UV reaching the surface of Lake Erie at noon on each date that water samples were collected in 2014. (B) CDOM absorption coefficient at 305 nm vs. date (average CDOM absorption coefficient across all sites for each date). (C) Calculated photochemical production of H2O2 in Lake Erie (average H2O2 production across all sites for each date) calculated as described in Equation (3) using the modeled UV for the time of sample collection, the CDOM spectrum of the water sample, and a single, best fit apparent quantum spectrum (Φλ) for H2O2 production.
Biological Production of H2O2
There was a net increase in H2O2 production during the day (from ~09:00 h through 17:00 h) in the microcosm experiments conducted with Lake Erie waters, followed by little to no change in H2O2 concentrations overnight (Figure 13). Interpreting the increase in H2O2 concentrations over the first 8 h of the experiments as an estimate of the net rate of biological production (i.e., assuming both production and decay of H2O2 are occurring in the microcosms), then the net rate of biological production of H2O2 was 30 ± 14 nM h−1 (Figure 13). While addition of N and P had no statistically significant effect on the net rate of biological production of H2O2 compared to controls with no added nutrients (36 ± 17 nM h−1; Figure 13), addition of these nutrients did increase algal production as indicated by significantly higher Chl a concentrations at the end of the experiment (48 h) compared to the un-amended waters (Figure 14).
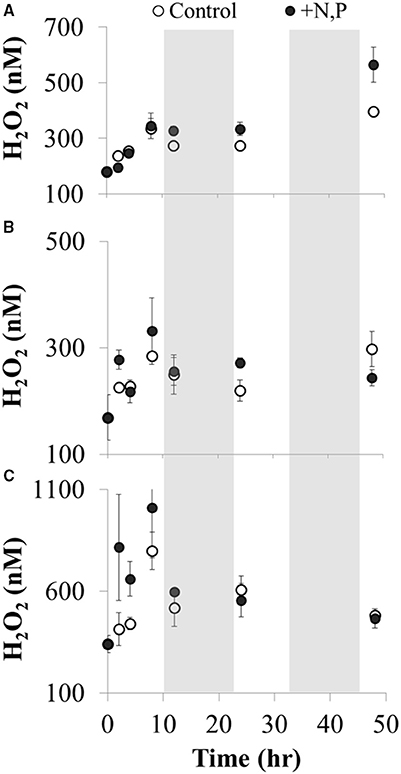
Figure 13. H2O2 concentrations vs. incubation time during microcosm experiments using Lake Erie water from three sites in the western basin of Lake Erie: (A) site 973 collected on 19 August 2014, (B) site 974 collected on 20 August 2014, and (C) site 973 collected on 3 September 2014. Water samples were incubated under natural sunlight and temperature on deck of the CCGS Limnos starting at 09:00 h and ending 48 h later. The shaded regions correspond to dark periods (night) during the experiment. The net rate of biological H2O2 production was calculated as the slope of H2O2 vs. time over the first eight h of the experiment (p < 0.05) separately for control and amended waters in each water sample. All H2O2 concentrations (nM) are plotted as average ± SE, n = 4 for each treatment and time point.
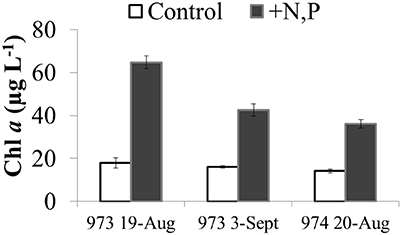
Figure 14. Chlorophyll a concentrations at the end of the microcosm experiments (t = 48 h) using Lake Erie water from the western basin (sites 973 and 974) in August and September 2014. Chlorophyll a in control (unamended lake water) is compared to the same water amended with N and P.
Discussion
The average and range of H2O2) concentrations in Lake Erie (371 ± 17 nM, range 47–1570 nM; Table 1 and Figure 10D) were higher than the range previously observed at one station in the western basin of Lake Erie in August 1987 (100–200 nM; Cooper et al., 1989), but within the wide range of H2O2 concentrations observed in lakes (~10 nM to >2 μM; Cooper and Zika, 1983; Cooper et al., 1989; Scully et al., 1996; Häkkinen et al., 2004; Febria et al., 2006; Mostofa et al., 2013). Although no studies have measured H2O2 concentrations in freshwaters with the same degree of spatial and temporal resolution and alongside supporting chemical and biological characterization as in this study, a similar range of H2O2 concentrations has been reported in a small, urban stream in New Zealand where daily measurements over one year showed H2O2 concentrations ranged from ~70 nM in winter to nearly 700 nM in summer (Rusak et al., 2005). The large range of H2O2 concentrations observed in Lake Erie spans the range of H2O2 concentrations shown to strongly impact microbial physiology in controlled laboratory experiments (Dziallas and Grossart, 2011; Zilliges et al., 2011; Leunert et al., 2014), or to result from microbial activity in eutrophic waters (Dixon et al., 2013; Marsico et al., 2015). Here, we present three lines of evidence in support of biological activity rather than photochemical production as the dominant source and control on H2O2 dynamics in Lake Erie.
First, photochemical production rates of H2O2 were likely too low to account for all H2O2 observed in Lake Erie. Using the average calculated photochemical production rate of 67 ± 3 nM h−1 H2O2 by CDOM, it would take about 5 h of mid-day light to produce the observed average concentration of H2O2 (371 ± 17 nM) assuming no other sources and no sinks. All water samples were collected between 0900 and 1530 h, with the majority of samples collected between 1000 and 1230 h, meaning that that there was often insufficient time and UV light for photochemical production to generate the observed concentrations, even in the absence of H2O2 sinks. The calculated photochemical production rates of H2O2 by CDOM in Lake Erie agreed very well with calculated rates in Lake Ontario (for similar days of the year and CDOM values; Jerome and Bukata, 1998) and overlapped with the range reported for photochemical production rates in higher latitude coastal waters (e.g., 20–45 nM h−1; Vermilyea et al., 2010). Calculated photochemical production rates of H2O2 by CDOM in this study and previous studies were likely upper estimates given that rates were not corrected for actual cloud cover or reflection of UV light off the water surface, both of which would decrease the UV light available and thus decrease the photochemical production of H2O2.
Photochemical production of H2O2 by CDOM could account for most of the observed H2O2 if CDOM in the lake consistently had ~3-fold higher apparent quantum yields [Φλ;Equation (3)] than we used. This is because photochemical production rates of H2O2 increase linearly with increasing Φλ (Equation 3). However, to generate an upper estimate for H2O2 from CDOM, we used an Φλ spectrum that was already ~3-fold higher (at 305 nm, see Section Photochemical Production of H2O2 by CDOM above) than the pooled mean spectra in recent literature syntheses (Kieber et al., 2014; Powers and Miller, 2014), because this Φλ spectrum accommodated the experimental photochemical production rate of H2O2 measured from laboratory irradiations of Lake Erie water collected in May 2014.
While variation in Φλ may be expected in space and time in Lake Erie given the shifts in CDOM source and thus composition (Figures 6, 7), the Φλ spectrum we used was likely on the high end expected from CDOM across all stations and dates in Lake Erie. In May when photochemical production of H2O2 was quantified from Lake Erie water samples, CDOM was more strongly terrestrially derived compared with CDOM in mid to late summer (Figure 6), and slightly higher Φλ spectra for H2O2 have been reported in freshwaters where CDOM is predominately terrestrially-derived compared with more autochthonous sources of CDOM predominately investigated in marine waters (Cooper et al., 1989; Scully et al., 1996; Andrews et al., 2000; O'Sullivan et al., 2005). Furthermore, recent syntheses of the literature reported a fairly narrow range of Φλ spectra and H2O2 photo-production from waters containing diverse sources of CDOM in seawater (Kieber et al., 2014; Powers and Miller, 2014). This narrow range of Φλ spectra is consistent with similar photochemical production rates of H2O2 from end-member sources of aquatic DOM (Cory et al., 2010a). Thus, we expect that Φλ spectra for H2O2 also spanned a relatively narrow range in Lake Erie, and that shifts in CDOM source to more autochthonous over the summer or with distance away from the river mouths most likely decreased Φλ for photochemical production of H2O2 from CDOM.
Photochemical production of H2O2 by CDOM may also have been higher than we calculated if the Φλ spectrum was relatively flat or only weakly exponential from the UV to visible wavelengths, instead of decreasing exponentially with wavelength as shown in all prior work on CDOM (Cooper et al., 1988; Scully et al., 1996; Andrews et al., 2000; Yocis et al., 2000; Kieber et al., 2014). Higher Φλ of H2O2 in the visible (i.e., >420 nm) would substantially increase photochemical H2O2 because there is more visible than UV irradiance reaching the water surface. Given the mean CDOM absorption coefficients at 412 nm (1.1 ± 0.1 m−1) for visible light (PAR) to account for the H2O2 formation in Lake Erie, the Φλ spectrum would have to be relatively high (~1 mmol H2O2 mol−1 photons nm−1) and flat (wavelength independent). There is no evidence in the literature for higher Φλ for H2O2 in the visible compared to UV for CDOM, and in fact all studies that have measured wavelength-dependent Φλ from CDOM show that the spectrum decreases exponentially with increasing wavelength from UV to visible for CDOM in fresh and marine waters (Scully et al., 1996; Andrews et al., 2000; Yocis et al., 2000).
The second line of evidence for predominately biological control is that H2O2 concentrations were decoupled from CDOM source or amount (Figure 7). CDOM was the dominant UV-light absorbing constituent in the water column even during peak algal activity in the lake (Figure 9), and over the range of CDOM absorption coefficients in Lake Erie, increasing UV and CDOM increased photochemical production of H2O2 in the water column [Equation (3); Figure 12]. However, there was no correlation between calculated photochemical production of H2O2 and H2O2 concentrations, or between H2O2 concentrations and any proxy for the high light or high CDOM conditions that favor photochemical production by CDOM (i.e., CDOM, PAR, date, or sample collection time).
Furthermore, H2O2 concentrations were not higher in surface waters compared to bottom waters, as would be expected if photochemistry controlled H2O2 concentrations (Figure 8C). In addition, bottom water concentrations were too high to have been produced by the light and CDOM available. For example, given that the depths of bottom water sampled (4–61 m) were also greater than the depth of UV light penetration (depth of 1% light was 1.5 m ± 0.1 m for 412 nm), there was not enough UV light to produce the 100–400 nM H2O2 observed at depth (Figure 8C). Recent work has also demonstrated higher concentrations of H2O2 at depth than could be accounted for by photochemical processes in deeper waters (Vermilyea et al., 2010; Zhang et al., 2016), suggesting a biological source of H2O2 in bottom waters Cooper et al. (1989) attributed greater H2O2 than expected from photochemistry at depth (~8 m) in Lake Erie to vertical mixing of surface and deep water, especially in the shallow western basin of Lake Erie where strong winds can mix surface water to the bottom. However, in this study, H2O2 concentrations were similar between surface and bottom waters even at depths >20 m during stratified conditions (Figure 8C). These results do not rule out photochemical contributions to H2O2 by CDOM. Instead, the results suggest that photochemical processes are unlikely to explain the high or peak H2O2 concentrations observed in late July and early August in 2014 and 2015, especially given that during this time the photochemical production by CDOM was lower than during May and June due to lower CDOM and lower solar radiation later in the summer (Figure 12).
The third line of evidence for an important biological role in H2O2 dynamics in Lake Erie is that H2O2 concentrations were more strongly aligned with biological processes than with CDOM or water mass movement of CDOM in the western basin (Figures 7, 10). For example, in both 2014 and 2015, H2O2 concentrations peaked at the end of July just before the peak in the Microcystis bloom that was indicated by Chl a, water column respiration rates, and concentrations of particulate microcystins (Figure 10). The same conditions that favor Microcystis blooms may favor biological production of H2O2 because while different organisms vary widely in their capacity to produce H2O2 (Zepp et al., 1987), high light, and total cell abundance are expected to be important controls on biological H2O2 production (Zepp et al., 1987; Marsico et al., 2015). Reactive oxygen species like H2O2 are produced by photosynthetic organisms under high-light conditions when light-driven electron transport outpaces electron consumption during CO2 fixation (Latifi et al., 2009). Thus, as photosynthetic biomass increased in Lake Erie during July in the warm and high-light surface waters (Figure 10A), biological production of H2O2 may have increased.
It is likely that biological production of H2O2 could account for the high concentrations of H2O2 observed in Lake Erie during late July and early August because absolute rates of biological production in H2O2 have been reported to be up to 250 nM h−1 in eutrophic lakes (Marsico et al., 2015). The rate of biological production measured here from microcosm experiments is the net of both biological production and decay, and is thus not directly comparable to photochemical production of H2O2 by CDOM (photochemical decay is <5% of production; (Moffett and Zafiriou, 1993) or comparable to studies using isotopically-labeled H2O2 to isolate biological production from decay in natural waters (Vermilyea et al., 2010; Marsico et al., 2015). However, the net rate of biological production measured in this study (30 ± 14 nM h−1; Figure 12) was within the range of calculated photochemical production of H2O2 by CDOM in Lake Erie (8–150 nM h−1; Figure 12) and within the range of absolute rates of biological production (Marsico et al., 2015). Thus, taking the net rate of biological H2O2 production in this study as a minimum and assuming that absolute rates of biological production in Lake Erie were on the high end of the range corresponding with other eutropic waters (50–250 nM h−1 Marsico et al., 2015), biological processes could produce the high concentrations of H2O2 observed in Lake Erie within a few hours especially if decay rates were slow during times leading up to peak H2O2 concentrations (prior to peak biological activity in Lake Erie, Figure 10).
As biomass increased in the lake leading up to the peak of the bloom in late July and early August, rates of biological decay of H2O2 may have also increased, thus leading to the relatively low concentrations of H2O2 from August through October (Figure 10). Recent work has reported high H2O2 decay rates during dense algal blooms (Marsico et al., 2015), as expected given significant, positive correlations between rates of biological decay of H2O2 and chlorophyll a and cell abundance (Cooper et al., 1994; Marsico et al., 2015). Furthermore, biological decay has been shown to increase with increasing H2O2 concentrations (Vermilyea et al., 2010). Increasing rates of biological decay concurrent with increasing biomass and biological production of H2O2 (Marsico et al., 2015) may be expected because microbes are equipped with anti-oxidant enzymes such as catalase and peroxidase that break down H2O2 (Giorgio et al., 2007). For example, in coastal waters, catalase, and peroxidase accounted for ~65–80 and 20–35%, respectively, of H2O2 decay (Moffett and Zafiriou, 1990).
Patterns in H2O2 during the microcosm experiments with Lake Erie water (Figure 13) were consistent with temporal patterns in Lake Erie over the course of the summer. That is, biological production of H2O2 was >H2O2 decay during the daylight portion of the experiments (approximately first 8–10 h, Figure 13), while overnight there was relatively greater decay as indicated by zero or low net increase in H2O2 (Figure 13). It was unlikely that photochemical production contributed substantially to the observed H2O2 production during these experiments given that photochemical production was calculated to be 3–10 times less than the observed production of H2O2 (1–10 nM h−1see Materials and Methods) The upper limit of photochemical production of H2O2 from CDOM during these experiments (36 nM h−1) was unlikely given that this estimate assumed that CDOM absorbs all UV light in the experiments; in contrast our results show that on average CDOM absorbed 70% of the UV light (Figure 9) in Lake Erie, and the ratio of CDOM to total UV absorbance was likely <70% in the microcosms given the increase in algal biomass over the course of the experiments. In addition, the apparent quantum yield of H2O2 formation by CDOM was likely lower than the high value we used in our calculations (Andrews et al., 2000). Instead of photochemical production of H2O2 by CDOM during these microcosm experiments, the results are more consistent with biological production of H2O2 under the relatively high-light conditions during the day, with increased H2O2 decay at night possibly by heterotrophic organisms (Cooper et al., 1994; Marsico et al., 2015). As discussed above, there is evidence in the literature that light may increase the biological production of H2O2 (Latifi et al., 2009) consistent with net production of H2O2 during the daylight hours of the microcosm experiments. The effect of nutrients on biomass production was apparently decoupled from H2O2 concentrations during the experiment, given that nutrients significantly increased Chl a concentrations compared to unamended controls (Figure 14), but did not increase rates of H2O2 production or H2O2 concentrations (Figure 13). This may be because as biological production of H2O2 increases, so does biological decay (Marsico et al., 2015).
Conclusions and Implications
This study demonstrated that CDOM and H2O2 concentrations were decoupled and that even the likely upper estimates of photochemical production of H2O2 by CDOM were too low to account for measured H2O2 (especially at depths below the photic zone). These results, combined with measured and estimated rates of biological production of H2O2 that can equal or exceed photochemical production (this study; Marsico et al., 2015), strongly suggest that biological activity is the dominant control on H2O2 in Lake Erie. Thus, conditions that favor high levels of H2O2 in Lake Erie were similar to conditions favoring bloom development, i.e., high light and warm water, as predicted by previous studies (O'Neil et al., 2012; Paerl and Otten, 2013). Future work should examine the causes and consequences of high H2O2 concentrations in Lake Erie and other surface waters where CHABs occur given that in both 2014 and 2015, maximum H2O2 concentrations occurred just prior to the peak in the Microcystis bloom corresponding with peak biological activity in the lake. These findings support the idea that H2O2 may exert selective pressure on Microcystis populations that would favor toxic over non-toxic strains (Leunert et al., 2014), possibly because bloom-forming cyanobacterial species such as Microcystis aeruginosa produce toxins like microcystins as one mechanism of protection against H2O2 (Zilliges et al., 2011; Paerl and Otten, 2013). While shifts in the ratio of toxic to non-toxic species or strains has been observed during bloom conditions (as discussed in O'Neil et al., 2012), the specific role of H2O2 in these shifts is as yet unknown.
Relatively lower H2O2 concentrations observed following peak bloom conditions were consistent with increased biological decay of H2O2 during this time (Figure 10). Lower H2O2 concentrations in Lake Erie coincided generally with a shift in CDOM source to more autochthonous organic matter (Figure 6), which has been shown to be more labile to aquatic bacteria compared with CDOM derived from terrestrial organic matter (Cory and Kaplan, 2012; Hosen et al., 2014). Thus, it may be that in eutrophic waters the photochemical influence of CDOM on H2O2 is less important than DOM's role in fueling bacteria that in turn produce enzymes to decay H2O2 (Moffett and Zafiriou, 1990; Cooper et al., 1994). Given the similarity in CDOM concentration and sources in Lake Erie compared with Lake Taihu (Zhang et al., 2014; Zhou et al., 2015), a large eutrophic lake in China severely impacted by CHABs every summer (Microcystis), it is likely that the trends reported here for photochemical production of H2O2 of CDOM and possibly lability of DOM to bacteria may apply to other CHABs-impacted waters.
Author Contributions
RC, TD, GD, TJ, VD, SP, SW, and GK designed the field sampling plans, and all authors contributed to the field work, data analysis, and manuscript preparation.
Conflict of Interest Statement
The authors declare that the research was conducted in the absence of any commercial or financial relationships that could be construed as a potential conflict of interest.
Acknowledgments
We thank Mr. Duane Gossiaux, Ashley Burtner, Danna Palladino, and Derek Smith for field support and NOAA GLERL captains and crew for logistical support. Funding was provided by the U-M Water Center and Fred A. and Barbara M. Erb Family Foundation and in part by NSF CAREER 1351745 (to RMC). This is NOAA GLERL contribution number 1806.
Footnotes
References
Abdulla, H. A. N., Minor, E. C., Dias, R. F., and Hatcher, P. G. (2010). Changes in the compound classes of dissolved organic matter along an estuarine transect: a study using FTIR and 13C NMR. Geochim. Cosmochim. Acta 74, 3815–3838. doi: 10.1016/j.gca.2010.04.006
Andrews, S. S., Caron, S., and Zafiriou, O. (2000). Photochemical oxygen consumption in marine waters: a major sink for colored dissolved organic matter? Limnol. Ocean. 45, 267–277. doi: 10.4319/lo.2000.45.2.0267
Apel, K., and Hirt, H. (2004). Reactive oxygen species: metabolism, oxidative stress, and signal transduction. Annu. Rev. Plant Biol. 55, 373–399. doi: 10.1146/annurev.arplant.55.031903.141701
Bridgeman, T. B., Chaffin, J. D., Kane, D. D., Conroy, J. D., Panek, S. E., and Armenio, P. M. (2012). From River to Lake: phosphorus partitioning and algal community compositional changes in Western Lake Erie. J. Great Lakes Res. 38, 90–97. doi: 10.1016/j.jglr.2011.09.010
Brittain, S. M., Wang, J., Babcock-Jackson, L., Carmichael, W. W., Rinehart, K. L., and Culver, D. A. (2000). Isolation and Characterization of microcystins, cyclic heptapeptide hepatotoxins from a lake erie strain of Microcystis aeruginosa. J. Great Lakes Res. 26, 241–249. doi: 10.1016/S0380-1330(00)70690-3
Burns, J. M., Cooper, W. J., Ferry, J. L., King, D. W., DiMento, B. P., McNeill, K., et al. (2012). Methods for reactive oxygen species (ROS) detection in aqueous environments. Aquat. Sci. 74, 683–734. doi: 10.1007/s00027-012-0251-x
Coble, P. G., Green, S. A., Blough, N. V., and Gagosian, R. B. (1990). Characterization of dissolved organic matter in the Black Sea by fluorescence spectroscopy. Nature 348, 432–435. doi: 10.1038/348432a0
Conroy, J. D., Quinlan, E. L., Kane, D. D., and Culver, D. A. (2007). Cylindrospermopsis in Lake Erie: testing its association with other cyanbacterial genera and major limnological parameters. J. Great Lakes Res. 33, 519–535. doi: 10.3394/0380-1330(2007)33[519:CILETI]2.0.CO;2
Cooper, W. J., Lean, D. R. S., and Carey, J. H. (1989). Spatial and temporal patterns of hydrogen peroxide in lake waters. Can. J. Fish. Aquat. Sci. 46, 1227–1231. doi: 10.1139/f89-158
Cooper, W. J., Shao, C., Lean, D. R. S., Gordon, A. S., and Scully, F. E. (1994). “Factors affecting the distribution of H2O2 in surface waters,” in Environmental Chemistry of Lakes and Reservoirs, Advances in Chemistry, ed L. A. Baker (Washington, DC: American Chemical Society), 391–422.
Cooper, W. J., Zika, R. G., Petasne, R. G., and Plane, J. M. (1988). Photochemical formation of hydrogen peroxide in natural waters exposed to sunlight. Environ. Sci. Technol. 22, 1156–1160. doi: 10.1021/es00175a004
Cooper, W., and Zika, R. (1983). Photochemical formation of hydrogen peroxide in surface and ground waters exposed to sunlight. Science 220, 711–712. doi: 10.1126/science.220.4598.711
Cory, R. M., Crump, B. C., Dobkowski, J. A., and Kling, G. W. (2013). Surface exposure to sunlight stimulates CO2 release from permafrost soil carbon in the Arctic. Proc. Natl. Acad. Sci. U. S. A. 110, 3429–3434. doi: 10.1073/pnas.1214104110
Cory, R. M., and Kaplan, L. A. (2012). Biological lability of streamwater fluorescent dissolved organic matter. Limnol. Oceanogr. 57, 1347–1360. doi: 10.4319/lo.2012.57.5.1347
Cory, R. M., and McKnight, D. M. (2005). Fluorescence spectroscopy reveals ubiquitous presence of oxidized and reduced quinones in dissolved organic matter. Environ. Sci. Technol. 39, 8142–8149. doi: 10.1021/es0506962
Cory, R. M., McNeill, K., Cotner, J. P., Amado, A., Purcell, J. M., and Marshall, A. G. (2010a). Singlet oxygen in the coupled photochemical and biochemical oxidation of dissolved organic matter. Environ. Sci. Technol. 44, 3683–3689. doi: 10.1021/es902989y
Cory, R. M., Miller, M. P., McKnight, D. M., Guerard, J. J., and Miller, P. L. (2010b). Effect of instrument-specific response on the analysis of fulvic acid fluorescence spectra. Limnol. Oceanogr. Methods 8, 67–78. doi: 10.4319/lom.2010.8.0067
Cory, R. M., Ward, C. P., Crump, B. C., and Kling, G. W. (2014). Carbon cycle. Sunlight controls water column processing of carbon in arctic fresh waters. Science 345, 925–928. doi: 10.1126/science.1253119
Davis, T. W., Bullerjahn, G. S., Tuttle, T., McKay, R. M., and Watson, S. B. (2015). Effects of increasing nitrogen and phosphorus concentrations on phytoplankton community growth and toxicity during planktothrix blooms in Sandusky Bay, Lake Erie. Environ. Sci. Technol. 49, 7197–7207. doi: 10.1021/acs.est.5b00799
Davis, T. W., Watson, S. B., Rozmarynowycz, M. J., Ciborowski, J. J. H., McKay, R. M., and Bullerjahn, G. S. (2014). Phylogenies of microcystin-producing cyanobacteria in the lower Laurentian Great Lakes suggest extensive genetic connectivity. PLoS ONE 9:e106093. doi: 10.1371/journal.pone.0106093
Diaz, J. M., Hansel, C. M., Voelker, B. M., Mendes, C. M., Andeer, P. F., and Zhang, T. (2013). Widespread production of extracellular superoxide by heterotrophic bacteria. Science 340, 1223–1226. doi: 10.1126/science.1237331
Dixon, T. C., Vermilyea, A. W., Scott, D. T., and Voelker, B. M. (2013). Hydrogen peroxide dynamics in an agricultural headwater stream: evidence for significant nonphotochemical production. Limnol. Oceanogr. 58, 2133–2144. doi: 10.4319/lo.2013.58.6.2133
Drábková, M., Admiraal, W., and Maršálek, B. (2007). Combined exposure to hydrogen peroxide and light selective effects on cyanobacteria, green algae, and diatoms. Environ. Sci. Technol. 41, 309–314. doi: 10.1021/es060746i
Dziallas, C., and Grossart, H.-P. (2011). Increasing oxygen radicals and water temperature select for toxic Microcystis sp. PLoS ONE 6:e25569. doi: 10.1371/journal.pone.0025569
Febria, C. M., Lesack, L. F., Gareis, J. A. L., and Bothwell, M. L. (2006). Patterns of hydrogen peroxide among lakes of the Mackenzie Delta, western Canadian Arctic. Can. J. Fish. Aquat. Sci. 63, 2107–2118. doi: 10.1139/f06-106
Fischer, W. J., Garthwaite, I., Miles, C. O., Ross, K. M., Aggen, J. B., Chamberlin, A. R., et al. (2001). Congener-independent immunoassay for microcystins and nodularins. Environ. Sci. Technol. 35, 4849–4856. doi: 10.1021/es011182f
Giorgio, M., Trinei, M., Migliaccio, E., and Pelicci, P. G. (2007). Hydrogen peroxide: a metabolic by-product or a common mediator of ageing signals? Nat. Rev. Mol. Cell Biol. 8, 722–728. doi: 10.1038/nrm2240
Häkkinen, P. J., Anesio, A. M., and Granéli, W. (2004). Hydrogen peroxide distribution, production, and decay in boreal lakes. Can. J. Fish. Aquat. Sci. 61, 1520–1527. doi: 10.1139/f04-098
Helms, J. R., Stubbins, A., Ritchie, J. D., Minor, E. C., Kieber, D. J., and Mopper, K. (2008). Absorption spectral slopes and slope ratios as indicators of molecular weight, source, and photobleaching of chromophoric dissolved organic matter. Limnol. Oceanogr. 53, 955–969. doi: 10.4319/lo.2008.53.3.0955
Hosen, J. D., McDonough, O. T., Febria, C. M., and Palmer, M. A. (2014). Dissolved organic matter quality and bioavailability changes across an urbanization gradient in headwater streams. Environ. Sci. Technol. 48, 7817–7824. doi: 10.1021/es501422z
Jerome, J. H., and Bukata, R. P. (1998). Impact of stratospheric ozone depletion on photoproduction of hydrogen peroxide in Lake Ontario. J. Great Lakes Res. 24, 929–935. doi: 10.1016/S0380-1330(98)70873-1
Kieber, D. J., Miller, G. W., Neale, P. J., and Mopper, K. (2014). Wavelength and temperature-dependent apparent quantum yields for photochemical formation of hydrogen peroxide in seawater. Environ. Sci. Process. Impacts 16, 777–791. doi: 10.1039/c4em00036f
Kutovaya, O. A., McKay, R. M. L., Beall, B. F. N., Wilhelm, S. W., Kane, D. D., Chaffin, J. D., et al. (2012). Evidence against fluvial seeding of recurrent toxic blooms of Microcystis spp. in Lake Erie's western basin. Harmful Algae 15, 71–77. doi: 10.1016/j.hal.2011.11.007
Larson, J. H., Trebitz, A. S., Steinman, A. D., Wiley, M. J., Mazur, M. C., Pebbles, V., et al. (2013). Great Lakes rivermouth ecosystems: scientific synthesis and management implications. J. Great Lakes Res. 39, 513–524. doi: 10.1016/j.jglr.2013.06.002
Latifi, A., Ruiz, M., and Zhang, C.-C. (2009). Oxidative stress in cyanobacteria. FEMS Microbiol. Rev. 33, 258–278. doi: 10.1111/j.1574-6976.2008.00134.x
Lesser, M. P. (2006). Oxidative stress in marine environments: biochemistry and physiological ecology. Annu. Rev. Physiol. 68, 253–278. doi: 10.1146/annurev.physiol.68.040104.110001
Leunert, F., Eckert, W., Paul, A., Gerhardt, V., and Grossart, H. P. (2014). Phytoplankton response to UV-generated hydrogen peroxide from natural organic matter. J. Plankton Res. 36, 185–197. doi: 10.1093/plankt/fbt096
Marsico, R. M., Schneider, R. J., Voelker, B. M., Zhang, T., Diaz, J. M., Hansel, C. M., et al. (2015). Spatial and temporal variability of widespread dark production and decay of hydrogen peroxide in freshwater. Aquat. Sci. 77, 523–533. doi: 10.1007/s00027-015-0399-2
Matthijs, H. C. P., Visser, P. M., Reeze, B., Meeuse, J., Slot, P. C., Wijn, G., et al. (2012). Selective suppression of harmful cyanobacteria in an entire lake with hydrogen peroxide. Water Res. 46, 1460–1472. doi: 10.1016/j.watres.2011.11.016
McKnight, D. M., Boyer, E. W., Westerhoff, P. K., Doran, P. T., Kulbe, T., and Andersen, D. T. (2001). Spectrofluorometric characterization of dissolved organic matter for indication of precursor organic material and aromaticity. Limnol. Oceanogr. 46, 38–48. doi: 10.4319/lo.2001.46.1.0038
Michalak, A. M., Anderson, E. J., Beletsky, D., Boland, S., Bosch, N. S., Bridgeman, T. B. A., et al. (2013). Record-setting algal bloom in Lake Erie caused by agricultural and meteorological trends consistent with expected future conditions. Proc. Natl. Acad. Sci. U. S. A. 110, 6448–6452. doi: 10.1073/pnas.1216006110
Miller, W. L. (1998). “Effects of UV radiation on aquatic humus: photochemical principles and experimental considerations,” in Aquatic Humic Substances, Ecological Studies, eds D. O. Hessen, L. J. Tranvik (Berlin, Heidelberg: Springer Berlin Heidelberg), 125–143.
Minor, E., and Stephens, B. (2008). Dissolved organic matter characteristics within the Lake Superior watershed. Org. Geochem. 39, 1489–1501. doi: 10.1016/j.orggeochem.2008.08.001
Moffett, J. W., and Zafiriou, O. C. (1990). An investigation of hydrogen peroxide chemistry in surface waters of Vineyard Sound with H218O2 and 18O2. Limnol. Oceanogr. 35, 1221–1229. doi: 10.4319/lo.1990.35.6.1221
Moffett, J., and Zafiriou, O. C. (1993). The photochemical decomposition of hydrogen peroxide in surface waters of the eastern Caribbean and Orinoco River. J. Geophys. Res. 98, 2307–2313. doi: 10.1029/92JC02768
Mostofa, K., Liu, C., Sakugawa, H., Vione, D., Minakata, D., and Wu, F. (2013). “Photoinduced and microbial generation of hydrogen peroxide and organic peroxides in natural waters,” in Photobiogeochemistry of Organic Matter, eds K. M. G. Mostofa, T. Yoshioka, A. Mottaleb, and D. Vione (Berlin; Heidelberg: Springer-Verlag), 139–207.
Murphy, K. R., Stedmon, C. A., Graeber, D., and Bro, R. (2013). Fluorescence spectroscopy and multi-way techniques. PARAFAC. Anal. Methods 5, 6557. doi: 10.1039/c3ay41160e
Murphy, K. R., Stedmon, C. A., Waite, T. D., and Ruiz, G. M. (2008). Distinguishing between terrestrial and autochthonous organic matter sources in marine environments using fluorescence spectroscopy. Mar. Chem. 108, 40–58. doi: 10.1016/j.marchem.2007.10.003
O'Donnell, D. M., Effler, S. W., Strait, C. M., and Leshkevich, G. A. (2010). Optical characterizations and pursuit of optical closure for the western basin of Lake Erie through in situ measurements. J. Great Lakes Res. 36, 736–746. doi: 10.1016/j.jglr.2010.08.009
O'Neil, J. M., Davis, T. W., Burford, M. A., and Gobler, C. J. (2012). The rise of harmful cyanobacteria blooms: the potential roles of eutrophication and climate change. Harmful Algae 14, 313–334. doi: 10.1016/j.hal.2011.10.027
O'Sullivan, D. W., Neale, P. J., Coffin, R. B., Boyd, T. J., and Osburn, C. L. (2005). Photochemical production of hydrogen peroxide and methylhydroperoxide in coastal waters. Mar. Chem. 97, 14–33. doi: 10.1016/j.marchem.2005.04.003
Obenour, D. R., Gronewold, A. D., Stow, C. A., and Scavia, D. (2014). Using a bayesian hierarchical model to improve Lake Erie cyanobacteria bloom forecasts. Water Resour. Res. 50, 7847–7860. doi: 10.1002/2014WR015616
Ouellette, A. J. A., Handy, S. M., and Wilhelm, S. W. (2006). Toxic Microcystis is widespread in Lake Erie: PCR detection of toxin genes and molecular characterization of associated cyanobacterial communities. Microb. Ecol. 51, 154–165. doi: 10.1007/s00248-004-0146-z
Paerl, H. W., and Otten, T. G. (2013). Blooms bite the hand that feed them. Science 342, 433–434. doi: 10.1126/science.1245276
Petasne, R. G., and Zika, R. G. (1987). Fate of superoxide in coastal sea water. Nature 325, 516–518. doi: 10.1038/325516a0
Peterson, B. M., McNally, A. M., Cory, R. M., Thoemke, J. D., Cotner, J. B., and McNeill, K. (2012). Spatial and temporal distribution of singlet oxygen in Lake Superior. Environ. Sci. Technol. 46, 7222–7229. doi: 10.1021/es301105e
Powers, L. C., and Miller, W. L. (2014). Blending remote sensing data products to estimate photochemical production of hydrogen peroxide and superoxide in the surface ocean. Environ. Sci. Process. Impacts 16, 792–806. doi: 10.1039/C3EM00617D
Qian, H., Hu, B., Yu, S., Pan, X., Wu, T., and Fu, Z. (2012). The Effects of hydrogen peroxide on the Circadian rhythms of Microcystis aeruginosa. PLoS ONE 7:e33347. doi: 10.1371/journal.pone.0033347
Qian, H., Yu, S., Sun, Z., Xie, X., Liu, W., and Fu, Z. (2010). Effects of copper sulfate, hydrogen peroxide and N-phenyl-2-naphthylamine on oxidative stress and the expression of genes involved photosynthesis and microcystin disposition in Microcystis aeruginosa. Aquat. Toxicol. 99, 405–412. doi: 10.1016/j.aquatox.2010.05.018
Richard, L. E., Peake, B. M., Rusak, S. A., Cooper, W. J., and Burritt, D. J. (2007). Production and decomposition dynamics of hydrogen peroxide in freshwater. Environ. Chem. 4, 49–50. doi: 10.1071/en06068
Richards, R. P., Baker, D. B., Crumrine, J. P., and Stearns, A. M. (2010). Unusually large loads in 2007 from the Maumee and Sandusky Rivers, tributaries to Lake Erie. J. Soil Water Conserv. 65, 450–462. doi: 10.2489/jswc.65.6.450
Rinta-Kanto, J. M., Konopko, E. A., DeBruyn, J. M., Bourbonniere, R. A., Boyer, G. L., and Wilhelm, S. W. (2009). Lake Erie Microcystis: relationship between microcystin production, dynamics of genotypes and environmental parameters in a large lake. Harmful Algae 8, 665–673. doi: 10.1016/j.hal.2008.12.004
Rinta-Kanto, J. M., Ouellette, A. J. A., Boyer, G. L., Twiss, M. R., Bridgeman, T. B., and Wilhelm, S. W. (2005). Quantification of Toxic Microcystis spp. during the 2003 and 2004 Blooms in Western Lake Erie using Quantitative Real-Time PCR. Environ. Sci. Technol. 39, 4198–4205. doi: 10.1021/es048249u
Rusak, S. A., Richard, L. E., Peake, B. M., and Cooper, W. J. (2005). “Long-term trends in steady-state hydrogen peroxide levels in relation to solar radiation in the water of leith, Dunedin, New Zealand,” in 2005 International Chemical Congress of Pacific Basin Societies (Honolulu).
Scavia, D., David Allan, J., Arend, K. K., Bartell, S., Beletsky, D., Bosch, N. S., et al. (2014). Assessing and addressing the re-eutrophication of Lake Erie: central basin hypoxia. J. Great Lakes Res. 40, 226–246. doi: 10.1016/j.jglr.2014.02.004
Scully, N., McQueen, D., Lean, D., and Cooper, W. (1996). Hydrogen peroxide formation: the interaction of ultraviolet radiation and dissolved organic carbon in lake waters along a 43-75 degrees N gradient. Limnol. Oceanogr. 41, 540–548. doi: 10.4319/lo.1996.41.3.0540
Sleighter, R. L., Cory, R. M., Kaplan, L. A., Abdulla, H. A. N., and Hatcher, P. G. (2014). A coupled geochemical and biogeochemical approach to characterize the bioreactivity of dissolved organic matter from a headwater stream. J. Geophys. Res. 119, 1520–1537. doi: 10.1002/2013JG002600
Speziale, B. J., Schreiner, S. P., Giammatteo, P. A., and Schindler, J. E. (1984). Comparison of N, N-dimethylformamide, dimethyl sulfoxide, and acetone for extraction of phytoplankton chlorophyll. Can. J. Fish. Aquat. Sci. 41, 1519–1522. doi: 10.1139/f84-187
Stedmon, C. A., and Bro, R. (2008). Characterizing dissolved organic matter fluorescence with parallel factor analysis: a tutorial. Limnol. Oceanogr. Methods 6, 572–579. doi: 10.4319/lom.2008.6.572
Stedmon, C. A., and Markager, S. (2005). Tracing the production and degradation of autochthonous fractions of dissolved organic matter using fluorescence analysis. Limnol. Oceanogr. 50, 1415–1426. doi: 10.4319/lo.2005.50.5.1415
Stedmon, C. A., Markager, S., and Bro, R. (2003). Tracing dissolved organic matter in aquatic environments using a new approach to fluorescence spectroscopy. Mar. Chem. 82, 239–254. doi: 10.1016/s0304-4203(03)00072-0
Steffen, M. M., Belisle, B. S., Watson, S. B., Boyer, G. L., and Wilhelm, S. W. (2014). Status, causes and controls of cyanobacterial blooms in Lake Erie. J. Great Lakes Res. 40, 215–225. doi: 10.1016/j.jglr.2013.12.012
Stephens, B. M., and Minor, E. C. (2010). DOM characteristics along the continuum from river to receiving basin: a comparison of freshwater and saline transects. Aquat. Sci. 72, 403–417. doi: 10.1007/s00027-010-0144-9
Tassan, S., and Ferrari, G. M. (2003). Variability of light absorption by aquatic particles in the near-infrared spectral region. Appl. Opt. 42:4802. doi: 10.1364/AO.42.004802
Vermilyea, A. W., Hansard, S. P., and Voelker, B. M. (2010). Dark production of hydrogen peroxide in the Gulf of Alaska. Limnol. Oceanogr. 55, 580–588. doi: 10.4319/lo.2009.55.2.0580
Weishaar, J. L., Aiken, G. R., Bergamaschi, B. A., Fram, M. S., Fujii, R., and Mopper, K. (2003). Evaluation of specific ultraviolet absorbance as an indicator of the chemical composition and reactivity of dissolved organic carbon. Environ. Sci. Technol. 37, 4702–4708. doi: 10.1021/es030360x
Wetzel, R. G. (1992). Gradient-dominated ecosystems - sources and regulatory functions of dissolved organic matter in freshwater ecosystems. Hydrobiologia 229, 181–198. doi: 10.1007/BF00007000
Winterbourn, C. C. (2013). “Hydrogen peroxide and cell signaling, Part C,” in Methods in Enzymology, eds E. Cadenas and L. Packer (San Diego: Elsevier).
Yocis, B. H., Kieber, D. J., and Mopper, K. (2000). Photochemical production of hydrogen peroxide in Antarctic Waters. Deep Sea Res. Part I Oceanogr. Res. Papers 47, 1077–1099. doi: 10.1016/S0967-0637(99)00095-3
Zepp, R. G., Skurlatov, Y. I., and Pierce, J. T. (1987). Photochemistry of Environmental Aquatic Systems, ACS Symposium Series. Washington, DC: American Chemical Society.
Zhang, F., Harir, M., Moritz, F., Zhang, J., Witting, M., Wu, Y., et al. (2014). Molecular and structural characterization of dissolved organic matter during and post cyanobacterial bloom in Taihu by combination of NMR spectroscopy and FTICR mass spectrometry. Water Res. 57C, 280–294. doi: 10.1016/j.watres.2014.02.051
Zhang, T., Hansel, C. M., Voelker, B. M., and Lamborg, C. H. (2016). Extensive dark biological production of reactive oxygen species in brackish and freshwater ponds. Environ. Sci. Technol. 50, 2983–2993. doi: 10.1021/acs.est.5b03906
Zhou, Y., Zhang, Y., Shi, K., Niu, C., Liu, X., and Duan, H. (2015). Lake Taihu, a large, shallow and eutrophic aquatic ecosystem in China serves as a sink for chromophoric dissolved organic matter. J. Great Lakes Res. 41, 597–606. doi: 10.1016/j.jglr.2015.03.027
Keywords: Hydrogen Peroxide, Lake Erie, cyanobacteria, Microcystis aeruginosa, microcystins, harmful algal blooms, Great Lakes, CDOM
Citation: Cory RM, Davis TW, Dick GJ, Johengen T, Denef VJ, Berry MA, Page SE, Watson SB, Yuhas K and Kling GW (2016) Seasonal Dynamics in Dissolved Organic Matter, Hydrogen Peroxide, and Cyanobacterial Blooms in Lake Erie. Front. Mar. Sci. 3:54. doi: 10.3389/fmars.2016.00054
Received: 15 January 2016; Accepted: 07 April 2016;
Published: 26 April 2016.
Edited by:
Colleen Hansel, Woods Hole Oceanographic Institution, USAReviewed by:
Jun Sun, Tianjin University of Science and Technology, ChinaHongmei Chen, Oak Ridge National Laboratory, USA
Copyright © 2016 Cory, Davis, Dick, Johengen, Denef, Berry, Page, Watson, Yuhas and Kling. This is an open-access article distributed under the terms of the Creative Commons Attribution License (CC BY). The use, distribution or reproduction in other forums is permitted, provided the original author(s) or licensor are credited and that the original publication in this journal is cited, in accordance with accepted academic practice. No use, distribution or reproduction is permitted which does not comply with these terms.
*Correspondence: Rose M. Cory, rmcory@umich.edu
†Present Address: Sarah E. Page, Arcadis U.S., Inc., Minneapolis, MN, USA