Chemical Assessment of Ballast Water Exchange Compliance: Implementation in North America and New Zealand
 Monaca Noble
 Gregory M. Ruiz
 Kathleen R. Murphy
- 1Marine Invasions Research Laboratory, Smithsonian Environmental Research Center, Smithsonian Institution, Edgewater, MD, USA
- 2Water Environment Technology, Department of Civil and Environmental Engineering, Chalmers University of Technology, Gothenburg, Sweden
Fluorescence by naturally occurring dissolved organic matter (FDOM) is a sensitive indicator of ballast water source, with high FDOM in coastal ballast water decreasing typically dramatically when replaced by oceanic seawater during ballast water exchange (BWE). In this study, FDOM was measured in 92 ships arriving at Pacific ports on the US west coast and in New Zealand, and used to assess their compliance with ballast water regulations that required 95% replacement of port water to minimize invasive species risks. Fluorescence in many ships that reported BWE was significantly higher than is usual for oceanic seawater, and in several cases, significantly higher than in other ships with similar provenance and ballast water management. Pre-exchange source port conditions represented the largest source of uncertainty in the analysis, because residual coastal FDOM when highly fluorescent can significantly influence the fluorescence signature of exchanged ballast water. A meta-analysis comparing the intensities of FDOM in un-exchanged ballast tanks with calculated pre-exchange intensities assuming that ships all correctly implemented and reported BWE revealed notable discrepancies. Thus, the incidence of high-FDOM port waters was seven times lower in reality than would be expected on the basis of these calculations. The results suggest that a significant rate of reporting errors occur due to a combination of factors that may include inadequate BWE and unintentional or deliberate misreporting of ballast water management.
Introduction
The transfer of ballast water between ports is an effective mechanism for moving a diverse assemblage of marine and estuarine organisms around the globe, posing considerable risk to the marine environment (Carlton and Geller, 1993; Ruiz et al., 1997; Roman and Darling, 2007). In the United States, controlling ballast water discharge is viewed as an important factor in the management of bays, estuaries, and the Great Lakes (Costello et al., 2007; Bailey et al., 2011). In New Zealand, economically and socially important fisheries are threatened by large volumes of ballast water discharged each year (Hewitt and Campbell, 2007). In both countries, ballast water is the suspected vector for several marine introductions. Damage caused to the Great Lakes by the Zebra Mussel, including extensive fouling and clogging of water intake pipes and impacts on native species, led in 1993 to the first ballast water exchange (BWE) requirements for ships entering the Great Lakes from outside the US exclusive economic zone. This authority was soon extended to other regions of the country by the National Invasive Species Act of 1996 (H. R. 4283, 104 Congress of the United States).
Ballast water is carried by vessels to provide stability and trim during sailing and during loading and unloading operations. It is usually loaded at the same time that cargo is unloaded and discharged in exchange for cargo, but may also be transferred between tanks within a vessel and carried for up to several months or even years. During BWE, port water within ballast tanks is replaced with oceanic water sourced outside of the coastal zone, preferably at least 200 nautical miles (nmi) from shore, although coastal BWE is often performed along routes that remain closer to shore (Miller et al., 2011). Depending on a range of factors including the tank design, type of exchange method used, and characteristics of individual species, BWE is capable of reducing concentrations of coastal organisms by 80–95% (Gray et al., 2007; Minton et al., 2015). The effectiveness of current BWE policy at reducing invasion rates is difficult to evaluate (Costello et al., 2007) and policy efforts over more than a decade have been directed toward replacing BWE with better technological solutions (Briski et al., 2015) and concentration-based performance standards (Albert et al., 2013). However, a range of setbacks have hampered the widespread adoption of new treatment technologies and performance standards with the result that BWE is still the only ballast water treatment method in widespread use (Minton et al., 2015).
Both the United States and New Zealand governments require commercial vessels arriving from overseas to treat or exchange their ballast water before discharge to reduce the risk of releasing invasive coastal species (MAF, 2007; Miller et al., 2011; United States Coast Guard (USCG), 2012a,b). Despite the legislative requirement for BWE in both countries, it is difficult to evaluate ships' claims regarding the origin and management of ballast water. In the United States, the process for determining whether a ship has conducted BWE are detailed in the US Coast Guard's Navigation and Inspection Circular 07–04, Ch-1. Ballast water management records may be examined, and salinity readings may be taken if non-compliance is suspected. In New Zealand, the Ministry of Primary Industries Biosecurity Division prohibits the discharge of ballast water into New Zealand waters without the permission of an inspector (MAF, 2005, 2007). To obtain permission, the vessel's Master must provide a signed declaration that the ballast water was subject to mid-ocean BWE. Inspectors approve ballast water discharge based on a combination of factors including agreement between ballast management records and salinity. In both countries, ballast water with salinity between 30 and 40 is considered consistent with BWE. However, this criterion fails to reliably detect ballast water originating in Pacific rim ports, since many ports in this region have high salinities either seasonally or year-round (Doblin et al., 2010).
Previous research indicates that fluorescence by naturally occurring dissolved organic matter (FDOM) is a robust coastal tracer, with sensitivity that exceeds many other chemical tracers including salinity and trace elements (Murphy et al., 2008a, 2013; Doblin et al., 2010). FDOM quantifies the organic matter fraction that absorbs light and reemits the radiation as fluorescence (Lakowicz, 2006). In estuaries, FDOM intensities vary with salinity gradients and biological activity as well as anthropogenic factors such as industrial effluent, and agricultural and urban runoff (Coble, 1996; Stedmon and Markager, 2005; Walker et al., 2009; Guo et al., 2011). Moving offshore away from terrestrial sources and as a result of exposure to sunlight, FDOM derived from terrestrial materials decreases (Duursma, 1974; Blough and Del Vecchio, 2002; Murphy et al., 2008b; Nelson et al., 2010). Because oceanic levels of FDOM are very low relative to concentrations at the coast, it can be deduced that samples with high FDOM are of coastal origin.
Previous studies have used fluorescence excitation-emission matrix spectroscopy to identify wavelengths most appropriate for measurement (Murphy et al., 2004, 2006). These found long-wavelength fluorescence associated with terrestrial organic matter to be an effective indicator of BWE. In shipboard experiments conducted in the North Pacific and Atlantic oceans, Murphy et al. (2006) determined that a threshold of 0.7 QSE (parts per billion quinine sulfate equivalents) measured at the C3* wavelength pair (λex/λem = 370/494 nm) discriminated between exchanged and unexchanged ballast water in >95% of tests (N = 40 ballast tanks), some of which were in the range of oceanic salinities. An extensive survey (>2000 samples) of C3* in ports and at varying distances from land confirmed that large differences in coastal vs. oceanic FDOM levels hold in the Pacific Ocean (Murphy et al., 2013). However, natural variability in coastal FDOM levels, which may legally represent as much as five percent of the water in an exchanged ballast tank, make it difficult to rely upon a simple C3* threshold. For example, assuming oceanic C3* levels of 0.5 QSE, any ship carrying ballast originally from a location where C3* exceeds 4.5 QSE will exceed 0.7 QSE even after performing 95% BWE.
In practice, given incomplete knowledge of FDOM distributions in coastal environments on a global scale, reliable chemical assessments of BWE must rely upon a forensic approach, in which multiple lines of evidence feed into the judgment of a vessel's compliance. Assuming that FDOM levels that were present in the ballast water tanks prior to BWE are unknown, then port survey data and/or data from other vessels with ballast from the same location can help to constrain estimates of the likely contribution of port water to the measured FDOM signal upon arrival. To test this approach, FDOM was measured in a diverse cohort of vessels (N = 92 ships) boarded by inspectors at various ports along the US west coast and New Zealand. The results were used to assess BWE compliance of individual ships and to gauge the overall level of compliance among the vessel cohort.
Materials and Methods
Experimental Design
Replicate ballast water samples were collected from 99 ballast tanks in 92 ships arriving to the United States or New Zealand. In the United States, ballast water samples were collected from 73 vessels that arrived at ports in California (47), Oregon (10), and Washington (16) in 2008 and 2009. Samples were collected by ballast water inspectors from three state agencies: the California State Lands Commission (CSLC), the Oregon Department of Environmental Quality (ODEQ), and the Washington Department of Fish and Wildlife (WDFW). In New Zealand, ballast water samples were collected from 19 vessels that arrived at the ports of Auckland (17), Tauranga (1), and Taharoa (1) in May, 2010. Sampling was performed by Ministry of Primary Industries (MPI, formerly Ministry of Agriculture and Forestry MAF) biosecurity inspectors, assisted by one researcher. Vessels of a range of types and trading histories were selected in an effort to maximize sample diversity. Ballast water source and management was self-reported by the vessel.
Sampling
Similar sampling methodologies were implemented in the United States and in New Zealand. Ballast water samples were collected through an open manhole from a single tank per vessel in the United States and one or two tanks per vessel in New Zealand. Three replicate samples were collected using large Clear-View™ PVC bailers (45.72 × 2.54 cm, 342 mL) from the vertical midpoint of the accessible sampling depth. The bailers have a stopper ball which allows them to collect samples from select depths. Water flows through the tube as the bailer is lowered into the tank, then when the bailer is retrieved the stopper-ball drops to the bottom of the tube sealing it. Once filled, the bailers were drained into a 60 mL syringe then filtered using Whatman 0.45 μm PVDF syringe filters into pre-ashed 125 mL amber glass bottles. All equipment was subject to stringent cleaning prior to sampling, bailers and syringes, and filters were acid washed (10% HCl) and rinsed with 18 MΩ deionized water and air dried in a laminar flow hood. Salinity was measured using a hand-held refractometer.
For all tanks scheduled for discharge, data regarding ballast water sources and management were obtained from ballast water reporting forms, which constitute legal declarations to the National Ballast Water Information Clearinghouse in the US and to MPI Biosecurity in New Zealand. For those tanks that were not to be discharged in the sampling port, source and management data were collected from the vessel's log books by the ballast water inspector. On the basis of these reports, each sampled tank was assigned to one of four management categories: exchanged in mid-ocean >200 nmi from shore (BWE, n = 57), exchanged < 200 nmi from shore (BWEc, n = 19), filled from empty in the mid-ocean (FS, n = 11), or carrying unexchanged port water (none, n = 12).
Laboratory Analyses
FDOM fluorescence was measured using a benchtop Fluorolog®-3 spectrofluorometer (Horiba Jobin Yvon, Edison, NJ). Undiluted filtered seawater samples were analyzed in ratio mode using a 0.5 s integration time and a 1-cm quartz cell held at 20°C. Fluorometer bandpasses were set to 5 nm for both the excitation and emission monochromators. The Fluorolog-3 is configured with a single excitation monochromator (1200 grooves/mm) blazed at 330 nm and a dual emission monochromator (1200 grooves/mm) blazed at 500 nm, a water-cooled, red sensitive photomultiplier tube and a 450-watt Xenon arc lamp.
Data were corrected for instrumental and lamp variability and normalized to quinine sulfate fluorescence intensity as previously described (Murphy et al., 2010). Fluorescence can be suppressed by absorbing species in the sample matrix, in a phenomenon known as the inner-filter effect (IFE). Suppression is below 5% at wavelengths where total absorbance (A) is below 0.042 in a 1-cm cell (Kothawala et al., 2013). Absorbance at 370 nm measured using a Cary 4E UV–Visible spectrophotometer was always below 0.015 m−1 so no inner filter correction was necessary. Fluorescence intensities were calibrated against a quinine sulfate dilution series and are expressed in units of concentration (ppb quinine sulfate equivalents, QSE). An approximate conversion of these data to Raman Units (RU, normalized to the area of the Raman peak in a clean water blank excited at 350 nm) is obtained by dividing intensities in QSE by 100 (Murphy et al., 2010). Data are reported here for a single wavelength pair, C3* (λex/λem = 370/494 nm) that has been extensively studied in the context of BWE, and for which BWE thresholds have already been developed and tested (Murphy et al., 2006, 2013; Doblin et al., 2010).
Chemical Assessments of Compliance
Since terrestrially derived FDOM in the open surface Pacific Ocean far from land is low and relatively stable compared to at the coasts (Nelson et al., 2010), then a lower bound for C3* prior to BWE can be deduced from measured C3* following BWE (Equation 1)
In Equation (1), is the measured fluorescence intensity in a ballast tank was reported as having undergone BWE, is the calculated fluorescence intensity prior to BWE, and ε is the BWE efficiency. is the fluorescence intensity in the ambient ocean where BWE was performed.
In the calculations, BWE efficiency (ε) was assumed equal to the minimum level specified by law (95%), except in the case of ballast tanks filled from empty in the ocean (FS). For these a higher exchange efficiency (99%) was assumed based on earlier studies (Cohen, 1998; Drake et al., 2007). Filling at sea is relatively efficient because the only sources of port signals are residual volumes of unpumpable ballast water and sediments. was assumed equal to 0.5 QSE in the open ocean, and = 1 QSE in coastal exchange zones. These levels are consistent with surveys in the North Pacific (Murphy et al., 2013) and are probably conservative (i.e., represent upper limits) except when BWE was performed north of 45°N where oceanic CDOM is relatively elevated (Nelson et al., 2010). If FDOM at the site of BWE was actually higher than the assumed level, this would result in being slightly overestimated, of if lower then would be slightly underestimated. However, a large over- or under-estimation is unlikely because even a 50% error in the assumed oceanic C3* represents no more than a small absolute difference in post-exchange C3*. Conversely, is very sensitive to BWE efficiency since a decrease from 95% to 90% efficiency doubles the influence of the residual port signal.
Calculated was used in two ways to assess compliance by individual vessels. First it was compared with measured C3* at the port of origin, when port data were available from earlier surveys and published reports. Second, it was used in comparisons with measured C3* in other ships that loaded ballast water in the same location at approximately the same time (within 2 weeks). To assess compliance by the cohort as a whole, the distribution of calculated was compared with the measured distribution of C3* in ballast tanks that were reported as having not undergone BWE (n = 48). The sample size for this comparison was increased by including data from any randomly-sampled tank containing unexchanged ballast water in our databases (n = 36). To avoid biasing the results, ships in our database that were deliberately targeted on the basis of source characteristics were excluded from this comparison.
Results
Table 1 summarizes C3* fluorescence and salinity measurements for each sampled tank, classified by ballast water source and reported ballast water management (N = 99 tanks from 92 ships). The majority of tanks (88%) reportedly underwent some type of ballast water management. Most were exchanged in mid-ocean more than 200 nmi from land (57%) or in coastal waters (20%), and 11% were filled from empty at sea. All ballast tanks reportedly sourced or exchanged at least 200 nmi from land (BWE and FS categories) had salinities between 31 and 41, i.e., within the range of salinities considered by regulatory agencies to be consistent with oceanic sources.
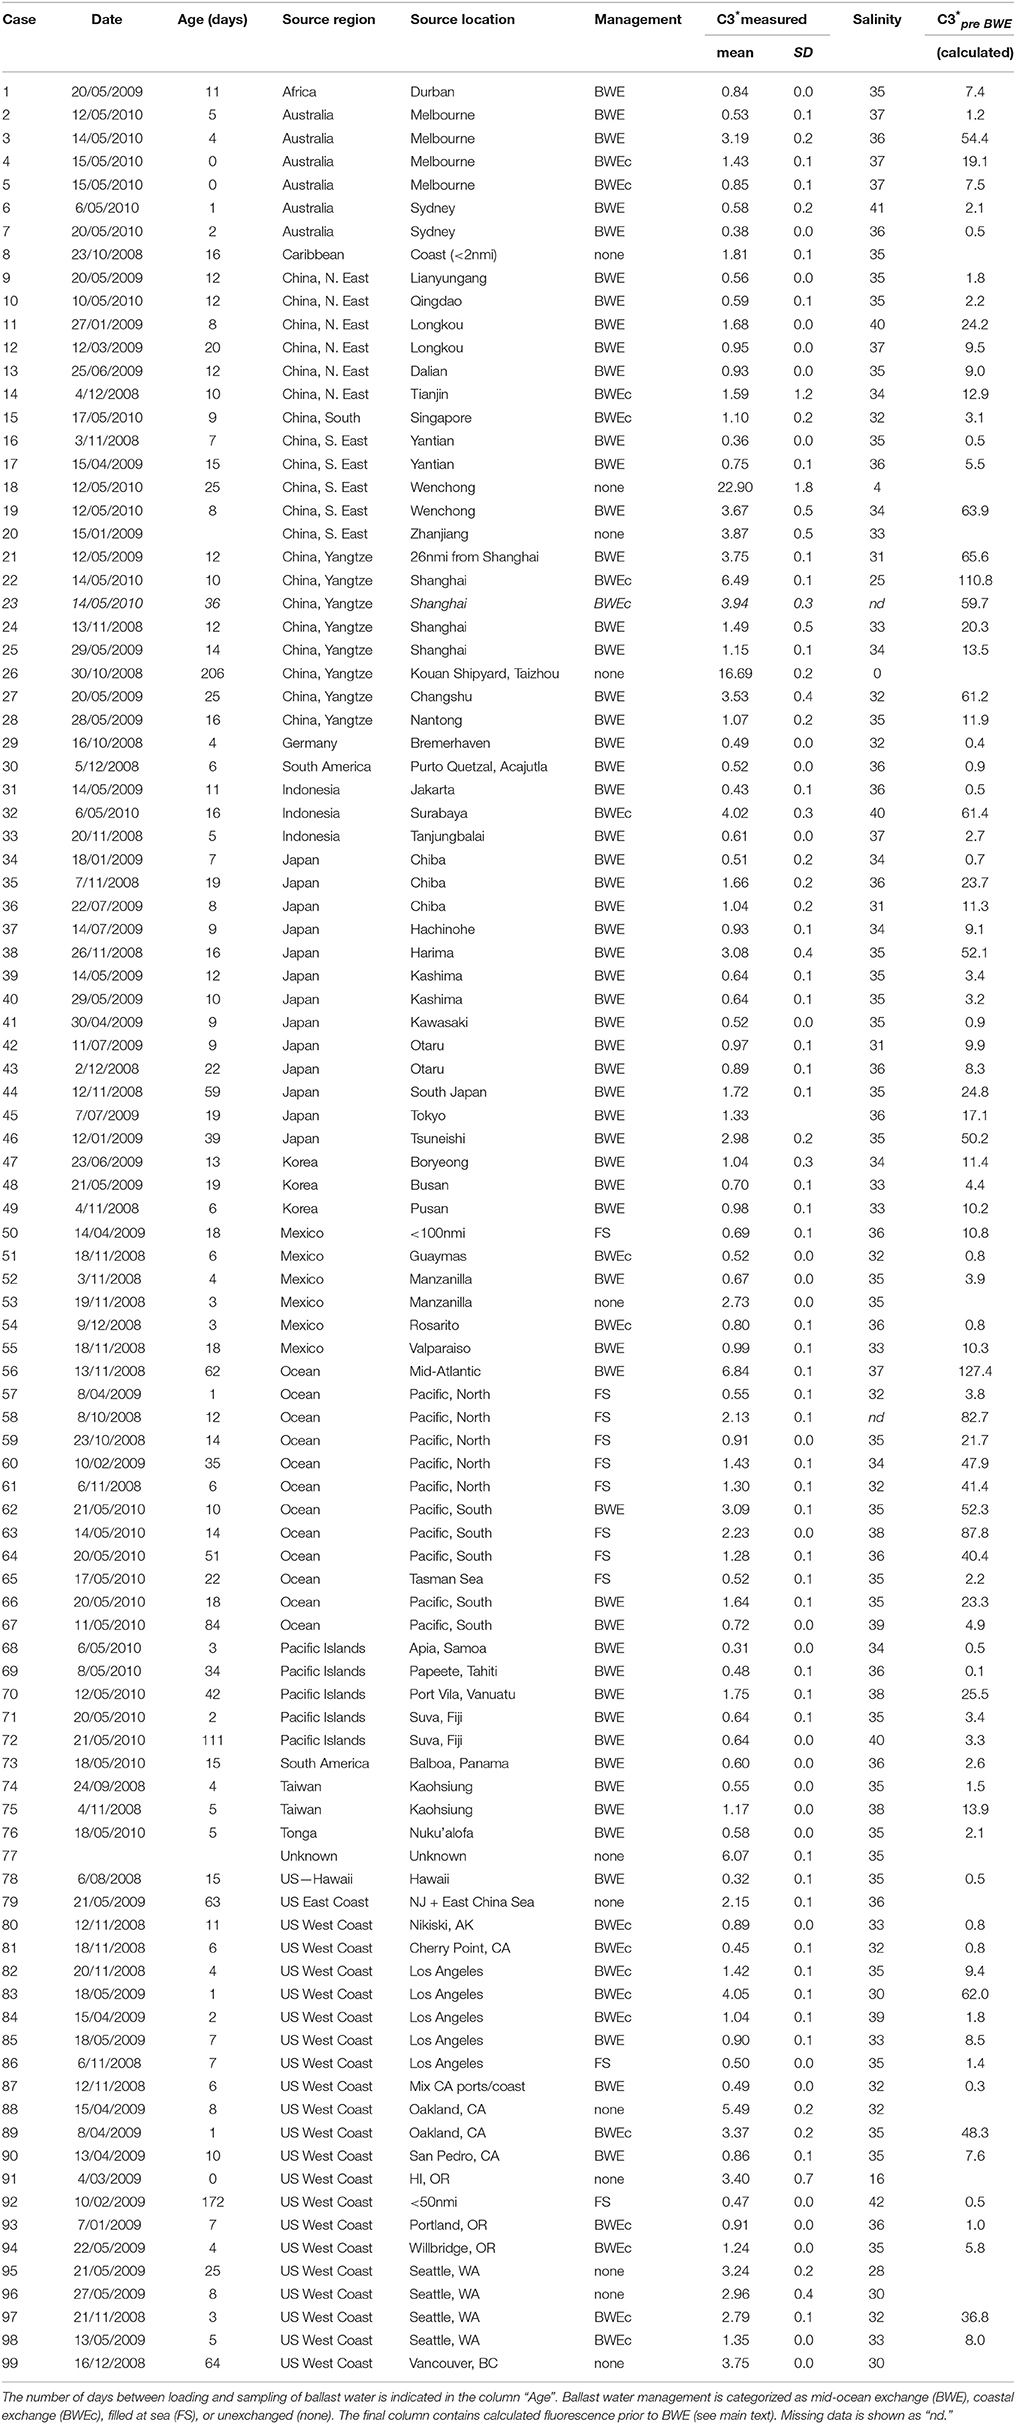
Table 1. Mean fluorescence intensities (C3* = 370/494 nm) measured in randomly sampled ballast tanks in ships arriving to Pacific Ocean ports in this study.
Figure 1 shows the distribution of fluorescence intensities among tanks sampled in each management category. Intensities are shown as multiples of the BWE threshold, tc. As expected in ships that reported no BWE, C3* always exceeded tc, while in half of the tanks, tc was exceeded by more than five times. Conversely, fluorescence intensities in exchanged ballast tanks were frequently much higher than expected. Among tanks that reportedly underwent mid ocean BWE or were filled at sea (BWE and FS, respectively), 54% of tanks had C3* fluorescence exceeding tc and 25% of tanks had fluorescence exceeding 3tc. Among 19 tanks that reportedly underwent coastal exchange (BWEc), 36% exceeded 3tc, and 26% exceeded 4tc.
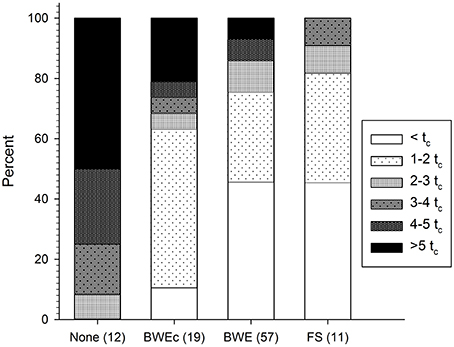
Figure 1. Measured C3* fluorescence in 99 ballast tanks as a function of reported management category. Fluorescence is expressed as a multiple of the BWE threshold (tc = 0.7 QSE) proposed by Murphy et al. (2006). Management categories are unexchanged (none), coastal exchange (BWEc), mid-ocean exchange (BWE), and filled at sea (FS), with number of tanks in each category listed in parentheses.
In Figure 2, fluorescence intensities measured in ships' ballast are mapped according to the reported geographical source of the ballast water. For unexchanged ballast water, the reported source was in a port, and for exchanged ballast water, the reported source was the offshore location where BWE took place. Blue symbols indicate low fluorescence consistent with oceanic sources, and orange and red symbols indicate high fluorescence consistent with coastal sources. C3* fluorescence was typically highest in tanks ballasted near land and lowest in ships that reported oceanic BWE. However, a significant number of tanks that were reportedly exchanged in the open ocean far from land stand out as obvious exceptions to this rule.
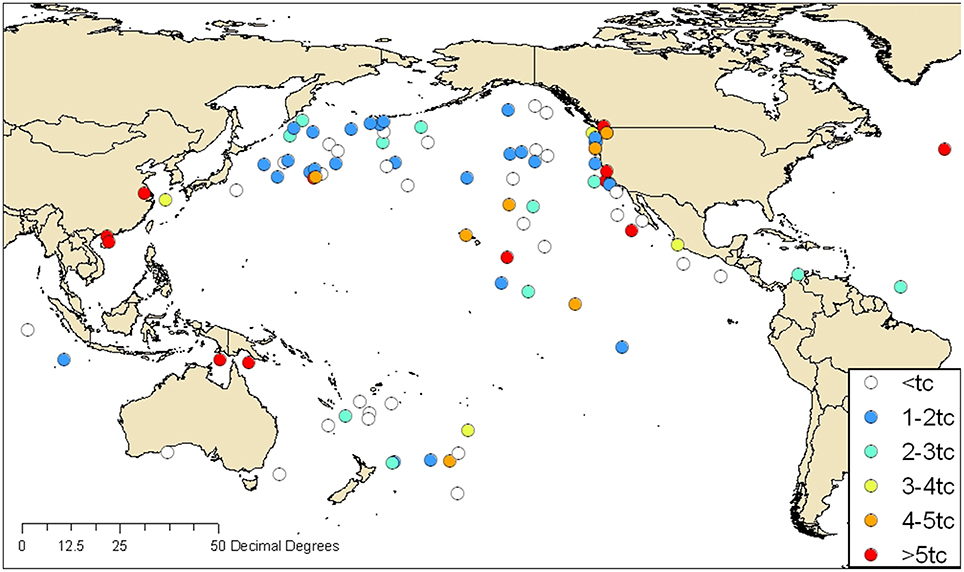
Figure 2. FDOM fluorescence intensities (C3* in QSE) in ships' ballast water mapped according to the reported origin of ballast water. Symbols indicate intensities in multiples of the BWE threshold (0.7 QSE) developed by Murphy et al. (2006). Orange and red symbols indicate C3* intensities that exceed the threshold by more than four and five times, respectively.
Table 1 contains the measured and reported data for each sampled ballast tank. Additionally, the final column contains calculated source intensities for reportedly exchanged ballast tanks, i.e. estimates of C3* prior to BWE deduced using Equation (1), assuming BWE was performed properly. These data are used in Figure 3 to compare the distribution of calculated source intensities with the measured distribution of source intensities in unexchanged ballast tanks. Table 1 shows that many calculated source intensities (Cases 3, 19, 21-23, 27, 32, 38, 46, 56, 58, 60–64, 83, 89, 97) represent extreme outliers. Most would remain outliers if the assumptions of the calculation were relaxed by assuming that C3* at the exchange location had been 50% higher and BWE efficiency were below 85%. Overall, these data suggest that in many cases BWE was either misreported or undertaken with much less than the mandated 95% exchange efficiency.
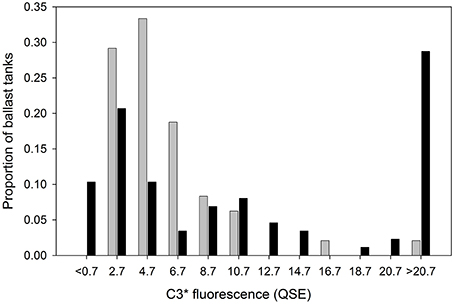
Figure 3. C3* distribution in randomly sampled unexchanged ballast tanks in this study (n = 48, dark bars) compared with expected pre-BWE C3* if ballast water exchange were reported correctly (n = 79, light bars).
A number of ships in this survey originated from ports that have previously been surveyed by our group. These port survey data can be used to explore whether high C3* might reasonably be explained by residual (< 5%) quantities of port water. Cases 3 and 4 represent two ballast tanks on the same ship ballasted in the port of Melbourne and later reportedly exchanged. Port surveys of FDOM in Melbourne do not support this reporting: C3* in both tanks (1.4 and 3.2 QSE) was within the typical range measured at the port of Melbourne during winter and spring surveys in 2007 whereas calculated pre-BWE C3* (9.6 and 54.4 QSE) greatly exceeded this range (Doblin et al., 2010). Similarly, Cases 57–67 represent ships that reportedly filled empty tanks in the Pacific Ocean at least 200 nmi from land, where C3* should have been extremely low. However, measured C3* intensities are consistent with predominantly open ocean sources in only two cases (57 and 65, with C3* ≤ 0.55). In six other cases, C3* intensities were in the range of 1.3–3.1 QSE, suggesting a moderate to large contribution by residual port water. Seasonal surveys at Los Angeles port and coastal waters in California have been conducted over several years by our group and indicate low background C3* in the port (< 2–3 QSE, Murphy et al., 2009) decreasing to below 0.8 QSE in the coastal ocean at distances exceeding 50 nmi from shore (Murphy et al., 2013). In Case 83, C3* exceeded 4 QSE after reported 95% coastal BWEc, which would require that C3* prior to BWE was around 30 times higher than the highest values measured during these earlier surveys.
The C3* measurements in Table 1 are organized geographically to facilitate comparisons between tanks having similar ballast water sources. When two ships ballast in the same port at around the same time and undertake similar ballast water management, C3* intensities in both ships should be comparable. For example, cases 95 and 96 represent unexchanged ballast water obtained in Seattle by two different ships within a 3 week period and differ by < 10%. Returning to Cases 3 and 4, these can be compared with Case 2, on another ship that ballasted in the port of Melbourne a few days earlier. For Case 2, C3* after BWE was below tc as expected, and 3–6 times lower than in Cases 3 and 4. These results again suggest that BWE was undertaken in Case 2, but not in Cases 3 and 4. Similarly, Cases 74 and 75 from Kaohsiung are inconsistent because (1) despite tanks having been loaded and exchanged at nearby locations within a month of one another, C3* was two-fold higher in Case 75, and (2) whereas for Case 74 the estimated pre-BWE C3* is within the known range of Kaohsiung port (1–2 QSE, Murphy et al., 2009), for Case 75 it is a factor of two higher. Finally, Cases 95 and 96 with unexchanged Seattle water provide some support for the claim that BWE was attempted in Case 98, although it appears to have been much less than 95% efficient.
In most cases where fluorescence data were at odds with BWE reporting in this study, there was no evidence of irregularities in the ship's paperwork. However, the vessel involved in Cases 3 and 4 had serious enough paperwork irregularities that the port authority involved denied permission to discharge ballast water. Although our data were not the basis of this decision, the fluorescence measurements independently corroborated the inspector's suspicions regarding the integrity of the ship's records. Cases 16 and 83 also had inconsistent reporting and elevated fluorescence results.
An evaluation of reporting by the entire cohort is provided by Figure 3. Here, the distribution of calculated (n = 72) can be compared directly with the measured distribution of C3* in ships that did not report exchanging ballast water (n = 48). The calculated C3* distribution has higher proportions of vessels in both the extremely low (< 0.7 QSE) and extremely high (>20.7 QSE) fluorescence ranges. The low anomaly indicates that at least 10% of ships who reported BWE encountered C3* levels in the ocean lower than those that were assumed in the calculations. The high anomaly indicates that the incidence of high-FDOM ports should be around an order of magnitude higher than it actually is, if ships were all correctly implementing and reporting BWE.
Discussion
This study presents the first report of dissolved organic matter fluorescence intensities (C3* = 370/494 nm) in ballast tanks of randomly-sampled ships arriving to Pacific ports. It was attempted to use these data to verify BWE when reportedly undertaken for those tanks, based upon reconciling fluorescence measurements with ships' reports without direct information regarding the chemical signatures of the ballast tanks prior to BWE. Previous research indicates that fluorescence is a stable and sensitive tracer of BWE in controlled experiments for which the source waters and treatments applied are able to be carefully monitored (Murphy et al., 2004, 2006). However, in a regulatory setting these data are usually unavailable or supplied by the ship and of unknown accuracy. Applying fluorescence as tool to verify BWE in a regulatory setting therefore introduces additional practical and technical challenges.
Applying a unilateral fluorescence threshold for determining BWE compliance, e.g., C3* < 0.7 QSE, would be expected to fail in two main situations. First, if a ship ballasts in a clear-water port with little terrestrial input of organic materials, then fluorescence intensities may be low regardless of whether BWE takes place. According to Figure 3, ports with C3* < 1 QSE account for < 10% of cases in our dataset. Also, tanks sampled in this study were nearly all ballasted and exchanged in the Pacific Ocean which experiences low coastal influences compared to the Atlantic Ocean (Opsahl and Benner, 1997; Siegel et al., 2002). Low-CDOM ports are therefore likely to be less common in the Atlantic Ocean. Second, verification could fail if a ship ballasts in a humic-rich port and retains 5% of this water following BWE, since residual port water could significantly elevate the total ballast water signal. Assuming BWE were performed with 95% efficiency in the mid-ocean where C3* is around 0.5 QSE, then ships that originally ballasted in ports where C3* > 10 QSE would have C3* above 1 QSE. Relatively high-CDOM ports with C3* > 10 QSE were uncommon in our dataset (< 10% of measured tanks), although would presumably be more common had ships originated from Atlantic ports. To limit the loss of sensitivity that inevitably would result from a one-size-fits-all BWE threshold, a forensic approach considering multiple lines of evidence was employed in this study.
The chemical signature of exchanged ballast tanks was shown to be very sensitive to ballast exchange efficiency. Previous research indicates that BWE efficiencies vary by ship type and according to the method of exchange. Using the empty-refill method, exchange efficiencies exceeding 98% are typical, however, flow-through exchange allows mixing between the incoming and outgoing water and often results in exchange efficiencies well below the mandated level. Increasing BWE efficiency from 95 to 98% decreases the port signal by more than half, whereas decreasing BWE efficiency from 95 to 90% doubles it. At the same time, biological risk is similarly sensitive to exchange efficiency. If the presence of 5% coastal organisms in ballast water represents the upper limit of acceptable risk, then accepting BWE with 90% efficiency results in twice the acceptable risk, and 85% BWE triples it.
The strength of the pre-BWE signal is also critical for determining the chemical profile of an exchanged ballast tank, even when oceanic water becomes 20 times more abundant than coastal water following BWE. Thus, for moderately fluorescent ports with C3* = 5 QSE, a two-fold increase in pre-BWE C3* has a similar effect on the post-exchange signal as a two-fold increase in open ocean C3*. Accurately estimating the pre-BWE signal for individual ships is difficult, since the water quality conditions encountered by individual ships while ballasting in port are subject to a number of sources of uncertainty, including temporally and spatially variable processes affecting terrestrial inputs (Stedmon et al., 2006; Yamashita et al., 2008). The picture is further complicated in ships that top up or transfer ballast water between tanks, which produces a blended chemical profile of indeterminable origin. For these reasons, it is difficult to conclusively identify ships that misreport BWE except in relatively extreme cases or when directly comparable measurements happen to be available. Approximately 10% of ships fell into this category in this study, although due to the generally conservative assumptions used in calculations together with the high prevalence of relatively low FDOM ports along the Pacific Rim (Murphy et al., 2009; Doblin et al., 2010), this probably represents a lower limit of BWE reporting/implementation errors.
Whereas conclusively determining BWE compliance by specific ships is often difficult, a meta-analysis of the chemical data is consistent with the finding that 95% BWE is not being performed as frequently as ships report. If this were not the case, then the distribution of measured C3* in unexchanged ballast tanks (Figure 3) should largely overlap with the pre-BWE C3* distribution back-calculated from C3* measured in exchanged ballast tanks. Instead, high-CDOM (C3* > 15 QSE) source ports were at least seven times more common in the calculated vs. measured pre-BWE datasets. Overall, the results suggest that a significant rate of reporting errors occur due to a combination of factors, including inadequate BWE and unintentional or deliberate misreporting of ballast water management.
Experience from the Great Lakes of North America suggests that compliance by ships with BWE legislation is strongly linked to inspection effort (Bailey et al., 2011). Whereas, our earlier research established the scientific basis for using fluorescence spectroscopy to trace ballast water origin, this is the first study to move this technique to the level of implementation and demonstrate how the technology works when implemented by governmental inspectors. In-situ FDOM sensors have recently entered the market and offer the possibility of simple real-time measurements as long as instrument reliability, stability, and calibration issues are appropriately handled. Incorporating such measurements into inspection programs at Pacific rim ports could improve the detection of high-risk ballast water and the overall implementation of BWE in the region.
Author Contributions
GR, MN, and KM conceived of the overall study and experimental design. MN performed the field trials and acquired the data in this study with assistance from others as described in the Acknowledgements. Statistical analyses were performed by MN and KM. KM and MN drafted the article and all authors revised it for intellectual content. All authors approve of the final version and are accountable for its accuracy.
Funding
Funding for this project was provided by California State Lands Commission (CSLC), Washington Department of Fish and Wildlife (WDFW), Oregon Department of Environmental Quality (ODEQ), New Zealand Ministry of Primary Industries (MPI), US Coast Guard Research and Development Center (RDC), and National Sea Grant Ballast Water Demonstration Program, Department of Commerce Award # NA050AR4171066.
Conflict of Interest Statement
The authors declare that the research was conducted in the absence of any commercial or financial relationships that could be construed as a potential conflict of interest.
Acknowledgments
The authors are indebted to many people and agencies that assisted with ballast water sampling during this project. We are grateful to Rian Hooff from ODEQ for assistance in Oregon. From CSLC we extend our thanks to Chris Beckwith, Tom Burke, Robert Chatman, Bob Chedsey, Nicole Dobrosk, Maurya Falkner, Ricky Galeon, Daphne Gehringer, Gary Gregory, Jackie Mackay, Chris Scianni, Bob Shilland, and David Stephens, amongst others. From WDFW we thank Gary Gertsen and Allen Pleus. From MPI we thank Clive Imrie, Stu Rawnsley, Greg Williams, Touzelle Batkin, Brendon Wakeman, Owen Aspen, Kevin Hawkes, Jeff O'Neil, Gary Higgins, Kristy Jacob, Tim Das, and others. Assistance with planning and organizing in New Zealand was provided by Chris Denny, Andrew Bell, Liz Jones, and Naomi Parker. Jennifer Boehme, Chris Brown, Darrick Sparks and Ashley Arnwine at SERC assisted with sampling and analyses.
References
Albert, R. J., Lishman, J. M., and Saxena, J. R. (2013). Ballast water regulations and the move toward concentration-based numeric discharge limits. Ecol. Appl. 23, 289–300. doi: 10.1890/12-0669.1
Bailey, S. A., Deneau, M. G., Jean, L., Wiley, C. J., Leung, B., and Macisaac, H. J. (2011). Evaluating efficacy of an environmental policy to prevent biological invasions. Environ. Sci. Technol. 45, 2554–2561. doi: 10.1021/es102655j
Blough, N. V., and Del Vecchio, R. (2002). “Chromophoric DOM in the coastal environment,” in Biogeochemistry of Marine Dissolved Organic Matter, eds D. A. Hansell and C. A. Carlson (San Diego, CA: Academic Press), 509–546.
Briski, E., Gollasch, S., David, M., Linley, R. D., Casas-Monroy, O., Rajakaruna, H., et al. (2015). Combining ballast water exchange and treatment to maximize prevention of species introductions to freshwater ecosystems. Environ. Sci. Technol. 49, 9566–9573. doi: 10.1021/acs.est.5b01795
Carlton, J. T., and Geller, J. B. (1993). Ecological roulette: the global transport of non-indigenous marine organisms. Science 261, 78–82. doi: 10.1126/science.261.5117.78
Coble, P. G. (1996). Characterization of marine and terrestrial DOM in seawater using excitation-emission matrix spectroscopy. Mar. Chem. 51, 325–346. doi: 10.1016/0304-4203(95)00062-3
Cohen, A. N. (1998). Ships' Ballast Water and the Introduction of Exotic Organisms Into the San Francisco Estuary: Current Status of the Problem and Options for Management. Richmond, CA: San Francisco Estuary Institute.
Costello, C., Drake, J. M., and Lodge, D. M. (2007). Evaluating an invasive species policy: ballast water exchange in the great lakes. Ecol. Appl. 17, 655–662. doi: 10.1890/06-0190
Doblin, M. A., Murphy, K. R., and Ruiz, G. M. (2010). Thresholds for tracing ships' ballast water: an Australian case study. Mar. Ecol. Prog. Ser. 408, 19–32. doi: 10.3354/meps08599
Drake, L. A., Doblin, M. A., and Dobbs, F. C. (2007). Potential microbial bioinvasions via ships' ballast water, sediment, and biofilm. Mar. Pollut. Bull. 55, 333–341. doi: 10.1016/j.marpolbul.2006.11.007
Duursma, E. K. (1974). “The fluorescence of dissolved organic matter in the sea,” in Optical Aspects of Oceanography, eds N. G. Jerlov and E. Steeman Nielsen (New York,NY: Academic Press), 237–256.
Gray, D. K., Johengen, T. H., Reid, D. F., and Macisaac, H. J. (2007). Efficacy of open-ocean ballast water exchange as a means of preventing invertebrate invasions between freshwater ports. Limnol. Oceanogr. 52, 2386–2397. doi: 10.4319/lo.2007.52.6.2386
Guo, W. D., Yang, L. Y., Hong, H. S., Stedmon, C. A., Wang, F. L., Xu, J., et al. (2011). Assessing the dynamics of chromophoric dissolved organic matter in a subtropical estuary using parallel factor analysis. Mar. Chem. 124, 125–133. doi: 10.1016/j.marchem.2011.01.003
Hewitt, C. L., and Campbell, M. L. (2007). Mechanisms for the prevention of marine bioinvasions for better biosecurity. Mar. Pollut. Bull. 55, 395–401. doi: 10.1016/j.marpolbul.2007.01.005
Kothawala, D., Murphy, K., Stedmon, C., Weyhenmeyer, G., and Tranvik, L. (2013). Inner filter correction of dissolved organic matter fluorescence. Limnol. Oceanogr. Methods 11, 616–630. doi: 10.4319/lom.2013.11.616
Lakowicz, J. R. (2006). Principles of fluorescence spectroscopy, 3rd Edn. New York, NY: Plenum Press.
MAF (Ministry of Agriculture Forestry) (2005). Import health standard for ships' ballast water from all countries. Rule issued pursuant to Section 22 of the Biosecurity Act 1993 on 13 June 2005. Wellington.
MAF (Ministry of Agriculture Forestry) (2007). Managing Controlling the Risk to the Marine Environment from Ballast Water Discharges: New Zealand's Response to the International Convention for the Control Management of Ship's Ballast Water Sediments. Wellington: MAF Biosecurity New Zealand Discussion Paper No: 2007/04
Miller, A. W., Minton, M. S., and Ruiz, G. M. (2011). Geographic limitations and regional differences in ships' ballast water management to reduce marine invasions in the contiguous United States. Bioscience 61, 880–887. doi: 10.1525/bio.2011.61.11.7
Minton, M. S., Miller, A. W., and Ruiz, G. M. (2015). Implications of ship type on delivery and management of ballast water, in Biological Invasions in Changing Ecosystems Vectors, Ecological Impacts, Management and Predictions Canning-Clode, ed J. De Gruyter Open. 343–364. doi: 10.1515/9783110438666-021
Murphy, K., Boehme, J., Brown, C., Noble, M., Smith, G., Sparks, D., et al. (2009). Investigation Into the Distribution of Ballast Water Tracers in Coastal Waters. US Coast Guard Research and Development Center, Report No: CG-D-01-10 (Groton, CT).
Murphy, K., Boehme, J., Coble, P., Cullen, J., Field, P., Moore, W., et al. (2004). Verification of mid-ocean ballast water exchange using naturally occurring coastal tracers. Mar. Pollut. Bull. 48, 711–730. doi: 10.1016/j.marpolbul.2003.10.015
Murphy, K. R., Boehme, J., Noble, M., Brown, C., Smith, G., Sparks, D., et al. (2013). Dissolved organic matter fluorescence in the coastal ocean along the US Pacific coast: exploring the limits to chemical verification of ballast water exchange by ships. J. Mar. Syst. 111–112, 157–166. doi: 10.1016/j.jmarsys.2012.10.010
Murphy, K. R., Butler, K. D., Spencer, R. G. M., Stedmon, C. A., Boehme, J. R., and Aiken, G. R. (2010). The measurement of dissolved organic matter fluorescence in aquatic environments: an interlaboratory comparison. Environ. Sci. Technol. 44, 9405–9412. doi: 10.1021/es102362t
Murphy, K. R., Field, M. P., Waite, T. D., and Ruiz, G. M. (2008a). Trace elements in ships' ballast water as tracers of mid-ocean exchange. Sci. Total Environ. 393, 11–26. doi: 10.1016/j.scitotenv.2007.12.011
Murphy, K. R., Ruiz, G. M., Dunsmuir, W. T. M., and Waite, T. D. (2006). Optimized parameters for fluorescence-based verification of ballast water exchange by ships. Environ. Sci. Technol. 40, 2357–2362. doi: 10.1021/es0519381
Murphy, K. R., Stedmon, C. A., Waite, T. D., and Ruiz, G. M. (2008b). Distinguishing between terrestrial and autochthonous organic matter sources in marine environments using fluorescence spectroscopy. Mar. Chem. 108, 40–58. doi: 10.1016/j.marchem.2007.10.003
Nelson, N. B., Siegel, D. A., Carlson, C. A., and Swan, C. M. (2010). Tracing global biogeochemical cycles and meridional overturning circulation using chromophoric dissolved organic matter. Geophys. Res. Lett. 37:L03610. doi: 10.1029/2009gl042325
Opsahl, S., and Benner, R. (1997). Distribution and cycling of terrigenous dissolved organic matter in the ocean. Nature 386, 480–482. doi: 10.1038/386480a0
Roman, J., and Darling, J. A. (2007). Paradox lost: genetic diversity and the success of aquatic invasions. Trends Ecol. Evol. (Amst). 22, 454–464. doi: 10.1016/j.tree.2007.07.002
Ruiz, G. M., Carlton, J. T., Grosholz, E. D., and Hines, A. H. (1997). Global invasions of marine and estuarine habitats by non-indigenous species: mechanisms, extent, and consequences. Am. Zool. 37, 621–632. doi: 10.1093/icb/37.6.621
Siegel, D. A., Maritorena, S., Nelson, N. B., Hansell, D. A., and Lorenzi-Kayser, M. (2002). Global distribution and dynamics of colored dissolved and detrital organic materials. J. Geophys. Res. Oceans 107, 21-1–21-14. doi: 10.1029/2001jc000965
Stedmon, C. A., and Markager, S. (2005). Resolving the variability of dissolved organic matter fluorescence in a temperate estuary and its catchment using PARAFAC analysis. Limnol. Oceanogr. 50, 686–697. doi: 10.4319/lo.2005.50.2.0686
Stedmon, C. A., Markager, S., Søndergaard, M., Vang, T., Laubel, A., Borch, N. H., et al. (2006). Dissolved organic matter (DOM) export to a temperate estuary: seasonal variations and implications of land use. Estuaries Coasts 29, 388–400. doi: 10.1007/BF02784988
United States Coast Guard (USCG) (2012a). Ballast Water Management for Control of Non-Indigenous Species in Waters of the United States, 33 C.F.R. §151.2000–§151.2080.
United States Coast Guard (USCG) (2012b). Ballast Water Discharge Standard (BWDS), 33 C.F.R. §151.1511.
Walker, S. A., Amon, R. M. W., Stedmon, C., Duan, S., and Louchouarn, P. (2009). The use of PARAFAC modeling to trace terrestrial dissolved organic matter and fingerprint water masses in coastal Canadian Arctic surface waters. J. Geophys. Res. Biogeosci. 114:G00F06. doi: 10.1029/2009jg000990
Keywords: Pacific Ocean, fluorescence spectroscopy, FDOM, invasion vectors, invasive species, AIS, NIS, CDOM
Citation: Noble M, Ruiz GM and Murphy KR (2016) Chemical Assessment of Ballast Water Exchange Compliance: Implementation in North America and New Zealand. Front. Mar. Sci. 3:66. doi: 10.3389/fmars.2016.00066
Received: 19 February 2016; Accepted: 18 April 2016;
Published: 09 May 2016.
Edited by:
Angel Borja, AZTI-Tecnalia, SpainReviewed by:
Rafael Riosmena-Rodriguez, Universidad Autonoma de Baja California Sur, MexicoJosé Lino Vieira De Oliveira Costa, Centre of Oceanography of the Faculty of Sciencies of the Lisbon University, Portugal
Copyright © 2016 Noble, Ruiz and Murphy. This is an open-access article distributed under the terms of the Creative Commons Attribution License (CC BY). The use, distribution or reproduction in other forums is permitted, provided the original author(s) or licensor are credited and that the original publication in this journal is cited, in accordance with accepted academic practice. No use, distribution or reproduction is permitted which does not comply with these terms.
*Correspondence: Monaca Noble, noblem@si.edu;
Kathleen R. Murphy, murphyk@chalmers.se