Conched Out: Total Reconstructed Fisheries Catches for the Turks and Caicos Islands Uncover Unsustainable Resource Usage
 Aylin Ulman
 Lily Burke
 Edward Hind
 Robin Ramdeen5
  Dirk Zeller
- 1Sea Around Us, Global Fisheries Cluster, University of British Columbia, Vancouver, BC, Canada
- 2Department of Earth and Environmental Sciences, University of Pavia, Pavia, Italy
- 3Faculty of Social Sciences, School of Environmental Studies, University of Victoria, Victoria, BC, Canada
- 4Center for Marine Resource Studies, School for Field Studies, South Caicos, Turks and Caicos Islands
- 5Waitt Institute, Blue Halo Initiative, Brades, Montserrat
The Turks and Caicos Islands' total marine fisheries catches were estimated for 1950–2012 using a catch reconstruction approach, estimating all removals, including reported catch destined for export, and unreported domestic artisanal and subsistence catches. Total reconstructed catch for the period is approximately 2.8 times that reported by the Turks and Caicos to the FAO, and 86% higher than the export-adjusted national reported baseline. The pattern of total catches (strong decline to 1970, followed by gradual increase) differs distinctly from that shown by data reported to FAO. Reported landings show a steady increase from less than 1000 t·year−1 in the 1950s to around 6000 t·year−1 in the 2000s. In contrast, the total reconstructed catches suggest declines in total catches from around 20,000 t in 1950 to a low of about 5000 t in 1970, before gradual increases to about 12,500 t·year−1 in the late 2000s. Major discrepancies between reported and reconstructed data are under-reported artisanal catches in the early decades (accounting for 86% of total catches), and the absence of subsistence catches (14% of total catches) in reported data. Queen conch (Strombus gigas) and Caribbean spiny lobster (Panulirus argus) dominate reconstructed catches. No discards were estimated as fishing has been highly selective, carried out by hand collection (conch), trap or hook (lobster), or hook and line (finfish). New data published here from local seafood consumption surveys demonstrates that the total local consumption of conch equates to almost the entire total allowable catch, before exported amounts are even factored. Policy-makers in the Turks and Caicos need to act if the sustainability of the fisheries stock and fishing industry is to be ensured.
Introduction
Fisheries catch under-reporting is evident in multiple regions and nations (e.g., Pauly et al., 2014; Ulman et al., 2015; Zeller et al., 2015; Pauly and Zeller, 2016). It can often be attributed to the acceptance and use of zeros where data are missing, even when there is documented evidence a fishery exists. When this occurs, it can lead to erroneous expectations about present and future resource levels and therefore may lead to poor management and policy decisions. Without comprehensive accounting of total catches from all sectors, it is difficult to measure the formal and informal economic values of resources, and to identify the risks that the under-reported catch may represent.
Catch reconstructions previously conducted in several small island states have shown under-reporting of fishery landings, particularly in small-scale fisheries (Ramdeen et al., 2012; Van der Meer et al., 2014). The Turks and Caicos Islands (TCI), an archipelago nation (Figure 1) where fishing has historically been the main industry, shares the profile of these nations and its catches may be similarly under-reported. Its fisheries are already identified as being fished at potentially unsustainable levels (Lockhart et al., 2007), so any such finding would have profound implications for fisheries management within the country. Here, the aim is to reconstruct the total marine fisheries catches for the TCI from 1950 to 2012 by supplementing existing fisheries data with new data sources. A reliable baseline of commercial fish catches would be a welcome aid to local marine resource managers if it allowed them to ensure that those resources were truly sustainable.
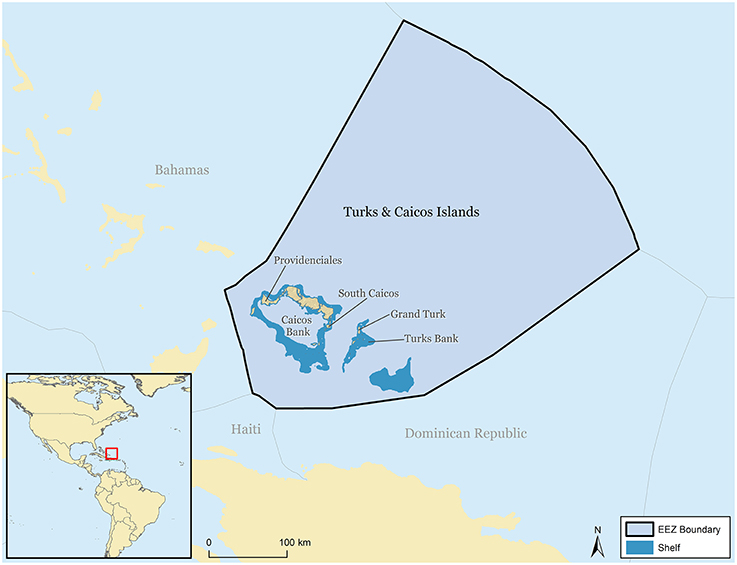
Figure 1. The Exclusive Economic Zone (EEZ) and continental shelf (to 200 m depth) of the Turks and Caicos Islands.
The TCI fisheries are defined here as having a small-scale commercial (i.e., artisanal) sector, a subsistence sector (i.e., for the primary purpose to feed one's self or one's family), and a small recreational sector (i.e., fishing primarily for enjoyment and pleasure). The three main commercial fishery target species on the islands are queen conch (Strombus gigas), Caribbean spiny lobster (Panulirus argus), and finfish (Taylor and Medley, 2003; Lockhart et al., 2007). All three groups are also caught for subsistence consumption and local commercial sale. Lobster is the preferred catch, since their value exceeds the value of conch fourfold, but most fishers switch to conch when the lobster fishery is closed or when conch catches are high. Finfish are opportunistically speared by lobster fishers (Medley and Ninnes, 1999). In recent decades, tourism has surpassed fishing as the leading industry, and visitors demanding locally caught seafood have put additional pressure on the TCI's marine resources (Klaus, 2001).
The Department of Environment and Marine Affairs (DEMA) is the TCI institution responsible for coastal zone management and it has taken the lead role in enforcing legislation pertaining to the marine environment. It collects daily conch (since 1887) and lobster (since 1947) landings data at each of the islands' processing plants, and estimates consumption for all species using national seafood surveys. Their data is crucial in conducting this reconstruction, and will be supplemented with new data where necessary.
Lobster
The lobster fishery is the most economically important fishery, becoming profitable in the late 1950s when snorkeling gear was introduced and the first processing plant was established (CRFM, 2011). Further value was added with the advent of freezing technology in 1966 (Halls et al., 1999). Profitability brought steep catch increases with the fishery growing until 1979, after which declines began due to overfishing. The average lobster taken by early trap fisheries was around 3 kg in weight, but this decreased to only 0.7 kg by the 1970s (Rudd, 2003). Lobsters are landed whole, and weighed as such, although only tails are exported.
Catch per unit effort (CPUE) reportedly declined, from approximately 65 kg·boat−1·day−1 in the early 1990s to around 20 kg·boat−1·day−1 by 2000 (Tewfik and Béné, 2004). Some suggest that the CPUE has actually remained stable at around 58 kg·boat−1·day−1 (Clerveaux et al., 2003), however this likely does not account for increases in engine power and depth fished; thus masking a decline by not accounting for technological creep.
There is no quota on the amount of lobster caught, but a seasonal closure does exist. The majority of lobster is landed when the fishery opens from August 15-March 31, with over 1/3 landed immediately following the fishery opening during the “Big Grab” (Halls et al., 1999; Tewfik and Béné, 2004). The reported DEMA data only include lobster sent for processing, destined for export. Thus, reported data lack information on domestic and tourist consumption.
Conch
In the late 1800s, the TCI's largest conch export markets were Haiti and the Dominican Republic (Doran, 1958). Catches increased substantially from 1937–1945 as local labor switched from salt production to fishing (Béné and Tewfik, 2000). The export industry rapidly developed again in the mid-1970s, when the USA began importing frozen conch to supply newly settled Caribbean immigrants accustomed to this traditional food (Brownwell and Stevely, 1981). Processing peaked in the late 1970s as processors reached capacity at 20,000 conch·day−1 (Brownwell and Stevely, 1981).
Conch meat is removed from the shells at sea and then frozen for export. Processing or “cleaning” involves trimming the head, foot and digestive system. There is currently a catch quota of 700–750 t of unprocessed meat of wild origin (not farmed), or between 270 and 290 t of “cleaned” processed meat, which equates to about 1900 t of live (wet) animal weight (Thiele, 2001; Lockhart et al., 2007; TCI Government, 2013).
The fishery is managed by a quota system intended to keep the stock at sustainable levels, with the quota divided in two; one portion set aside for exports and the other for domestic consumption. Catch quotas are calculated by a derivative of the previous year's exports and estimated domestic consumption (Clerveaux and Lockhart, 2008), and are occasionally adjusted based on the results of underwater visual surveys. Thus, quotas are not based on fully informed scientific stock assessments.
The export quota for the 2010-2011 season was 4125 t·year−1 of wild unprocessed meat but the catch was < 2800 t. The quota was lowered for the 2012–2013 season to 2540 t, 62.5% of which was reserved for export and the remainder for local consumption.
Landings contributions to the export quota only include the meat landed and weighed at the five processing plants. While these data are accurately recorded by DEMA, contributions to domestic quota are not as precisely recorded. Conch eaten domestically is landed at public docks or informal sites where no official recording takes place. The filling of this quota is estimated using a decadal household and tourist consumption survey (Clerveaux and Lockhart, 2008). The TCI Government is obligated to report their conch catches if they wish to continue to trade with signatory nations to the Convention of International Trade of Endangered Species of Wild Flora and Fauna (CITES).
Finfish
The majority of finfish are caught for domestic consumption (subsistence purposes and local commercial sales), and few are exported. It appears that bonefish (Albula vulpe) and Nassau grouper (Epinephelus striatus) were the preferred local species in the early period (circa 1950). Maitland (2006) calculated that at least once per week, over 97% of households in the TCI ate fish, 79% ate conch, and 46% consumed lobster. Fish populations appear to be in relatively good shape compared to neighboring islands as traditionally preferred species are still available. Species traditionally preferred are bonefish and Nassau grouper, but snapper (Lutjanidae), grunts (Haemulidae), hogfish (Lachnolaimus maximus), parrotfish (Scaridae), and triggerfish (Balistidae) are also landed (Klaus, 2001). A handline fishery exists for bigeye tuna (Thunnus obesus), blackfin tuna (Thunnus atlanticus), barracuda (Sphyraena barracuda) and other inshore pelagics (Halls et al., 1999).
The only finfish ever reported by DEMA are blue marlin (Makaira nigricans) (2 t in 2006), yellowfin tuna (Thunnus albacares) (1 t in 2007), “miscellaneous marlins and sailfishes” (Istiophoridae, 1 t in 2007), and “miscellaneous marine fish,” which were reported until the late 1990s, after which they disappeared from the reported data. As DEMA does not record most finfish landings, local and tourist seafood consumption surveys have recently been used to gather data on their exploitation. All sales for domestic consumption are missing from reported catch data.
Here, total marine fisheries extractions from the TCI Exclusive Economic Zone (EEZ) were reconstructed to species level, by year, and for each sector. Attempts are made to account for all fishery removals by incorporating catches from previously unreported fishery sectors. Landings of turtles, sponges, and cetaceans were not considered.
Methods
A catch “reconstruction” approach (Pauly, 1998; Zeller et al., 2007, 2015) was used to estimate total fisheries catches from 1950 to 2012. The first step was to understand the data reported by the TCI to the FAO. That data, reported in the institution's Fishstat database (Garibaldi, 2012), were used as the reported landings baseline in this study. The second step was to compare the reported data to other data sources for inconsistencies, and to make corrections to the baseline data where these sources were more trusted. Thirdly, missing fishery sectors were identified and added to the baseline. The best available data was then sought out and used to estimate the missing catches for the missing fishery sectors. These estimates were carried out using a series of established anchor points, with catches linearly interpolated between anchor points to reflect national trends as per Pauly and Zeller (2016). The principle behind this approach is that when no data are formally recorded, but the fishery is known to exist, it is imperative to use best available estimates rather than inserting a “Not Applicable, or NA” which later is turned into a zero in the database.
Reported Data Baseline
Based on the catch-reporting infrastructure of the TCI, the reported data only include commercial catches destined for export and a very small volume of historically farmed conch (Rudd, 2003; Tewfik and Béné, 2004; Lockhart et al., 2007). Farmed conch previously accounted for circa 1% of exports, but commercial conch farming has now ceased. Even though conch and lobster landings data for the TCI span a long time-series, it has been suggested that most reporting has been inaccurate (Lockhart et al., 2007). Any catches not sent to one of the five export-oriented processing plants are deemed missing from the national catch statistics reported to FAO. Imports are not accounted for as they generally address tourist demand and are thought to not affect local consumption patterns in a substantial manner.
Working closely with local experts, accurate landings data for both conch and lobster (after accounting for the shell conversion factor for conch) were found in a TCI Government report (TCI Government, 2004) and in Clerveaux and Lockhart (2008). At the time the latter was published, W. Clerveaux was head of the TCI Department of the Environment and K. Lockhart was a TCI fisheries scientist. These national conch data were higher than the data reported by FAO from 1950–1968 on behalf of the TCI, and they were used here to correct the reported baseline data as presented by FAO on behalf of the TCI, as the sources were deemed reliable. From 1969–1974, data reported by FAO appear to over-report conch catches, which were adjusted downwards based on data in a TCI Government (2004) plan and Clerveaux and Lockhart (2008). From 1975 onwards, the data reported to FAO were considered to be accurate and were accepted.
The reported lobster data from 1950–1971 were adjusted to account for minor over- and under-reporting discrepancies so as to match the trusted national data from the TCI Government (2004) plan and Clerveaux and Lockhart (2008), while data reported by FAO were accepted for 1972–2012. All of the reported catches were considered to have been caught by the artisanal sector (small-scale commercial sector) for export, leaving artisanal catches for local sale, and subsistence and recreational sectors to be estimated separately.
Local Population and Tourist Numbers
TCI human population data were available for 1950–1958 from the Population Statistics Historical Demography web site (www.populstat.info/) and for 1959–2012 from the World Bank (Figure 2). Data on the number of stop-over tourists (travelers who stay for more than a day) were available for 1962, 1967, and 1968 in Bryden (1973), for 1995–2005 from the TCI Department of Planning and Statistics, and for 2006–2012 from the TCI Tourist Board (Figure 2). A linear interpolation was used to estimate tourist arrivals in years with missing data.
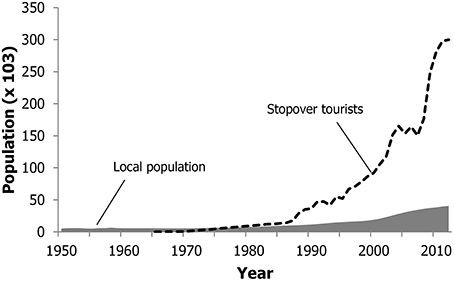
Figure 2. Local and stop-over tourist population of the TCI, 1950–2012. Sources: (Bryden, 1973), 1962 anchor point; Caribbean Tourism Organization, 1980–2006 data; Turks and Caicos Islands Tour Board Statistics, 2007–2012 data. Note: stopover tourists average between 6 and 7 days each, and tourist-days were used to calculate consumption.
Domestic Consumption
Since only exports for the TCI were reported during the 1950–2012 time-series, domestic and tourist seafood consumption were estimated using estimates from past seafood consumption surveys as anchor points. The per capita seafood consumption amounts were then multiplied by conversion factors to derive live fish weight, which were then multiplied by annual human population records to determine annual domestic consumption catches. These catches were then categorized to species level.
Seafood consumption anchor points were derived from Olsen (1985), Rudd (2003), Lockhart et al. (2006) and Hind (unpublished data, 2013); The most recent national seafood consumption survey interviewed over 580 residents and was undertaken in late 2013 (Edward Hind, unpublished data). It was the most extensive and representative survey completed to date because it included representation across all ages (18+), ethnic groups, genders, and islands. The portion sizes used for all domestic consumption are taken from Lockhart et al. (2006). The survey results presenting per capita consumption from this study are presented in Table 1.
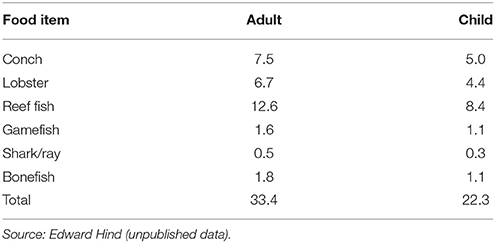
Table 1. Per capita national seafood consumption rate in the Turks and Caicos Islands, 2013 (kg·year−1).
Conch Conversion and Allocation
Conch data from the TCI is converted to live weight by the FAO using a 7.5 conversion factor (FAO, 2012). To convert serving sizes to live animal weight to estimate local consumption from the seafood consumption surveys, an initial conversion factor of 2 was applied to account for trimmed and unused meat (Thiele, 2001), which was multiplied by the FAO factor of 7.5 to account for the shell, equating to a total conversion factor of 15.
In 1950, conch catches were assumed to have been taken 75% for subsistence purposes and 25% for artisanal (i.e., commercial) purposes. These rates were linearly interpolated to 50% subsistence and 50% artisanal by 2013, as a 2004 survey indicated that 36% of locals receive conch as gifts from fishers, and 15% personally capture conch [c. 50% subsistence] (Lockhart et al., 2006). Thus, it was assumed the remainder of conch meat is bought commercially.
Lobster Conversion and Allocation
Lobsters are weighed whole before the tails are removed for export, and thus no conversion factor was required, unless just the tail was reported for export, in which case a factor of 2.6 was used (Halls et al., 1999). To convert the meal sizes from the seafood consumption survey to live fish weight for lobster, the FAO conversion factor of 2.6 was applied.
In 1950, lobster catches were assumed to have been 75% subsistence and 25% artisanal, which was linearly interpolated to 10% subsistence and 90% artisanal by 2012. This was based on rising lobster prices that encouraged most fishers to profit from their catches instead of keeping them for personal consumption.
Finfish Allocation
There are four types of fish consumed in the TCI: reef fish, gamefish, sharks and bonefish (Edward Hind, unpublished data). The allocations used for reef fish and gamefish are presented in Table 2. Sharks were categorized as Subclass Elasmobranchii since no local studies detailing shark taxa have been done. To convert individual portion weights to live fish weight, for game fish, tuna, and sharks, a conversion factor of 1.92 was applied to account for the filet of meat and likely higher uneaten portions, but a lower conversion factor of 1.35 was used for reef fish and bonefish. Table 3 shows per capita domestic consumption amounts for conch, lobster and finfish.
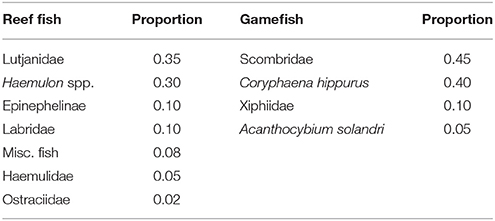
Table 2. Taxonomic allocation used for reef-fish and gamefish for both domestic and tourist consumption in the Turks and Caicos Islands.
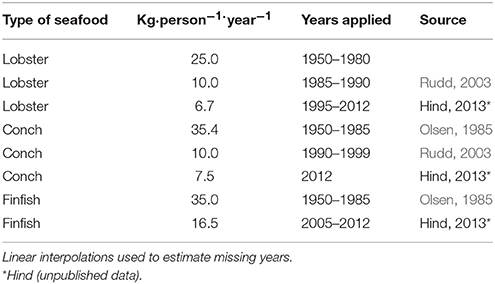
Table 3. Per capita seafood consumption used for domestic consumption, years applied and sources used.
The taxonomic breakdown applied to both 1950 and 2012 are displayed in Table 4. This table excludes gamefish in 1950, which we assumed began as a very small target fishery (at 1% of total finfish catch) after engines were first introduced in 1965. The gamefish contribution was linearly increased to the 2012 levels of 10% of the finfish catch, and all estimates were linearly interpolated for the intervening years. Nassau grouper has been the preferred target species for many decades due to their substantial size and ease of catching (Rudd 2003). Bonefish were once the preferred local fish species (Olsen, 1985), but consumption rates have decreased in recent decades with older fishers retiring and younger generations regarding it as “poor man's” food. For domestic finfish consumption in 1965, 50% was assumed to have been caught as subsistence and 50% as artisanal, which was linearly interpolated to 20% subsistence and 80% artisanal by 2012.
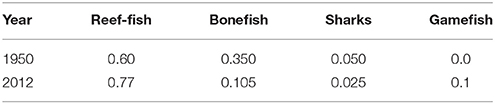
Table 4. Fish allocation (fractions) for 1950 and 2012 for both subsistence and artisanal catches, interpolated for years between.
Tourist Consumption
To calculate stopover tourist consumption, the following steps were taken:
1) The annual number of tourists from 1967–2012 was established (Figure 2; Bryden, 1973);
2) This was multiplied by the average number of meals (15.2) consumed on the island for an average 6–7 day stay (Lockhart et al., 2006);
3) This was multiplied by tourist seafood consumption rates from the 2013 consumption survey for conch (0.0071 kg·meal−1), lobster (0.0102 kg·meal−1), reef (0.0163 kg·meal−1) and game fish (0.0026 kg·meal−1, 0.0006 kg·breakfast−1), and then adjusted to mean live weight;
4) This was applied to individual taxonomic groups as was done for domestic consumption (Table 2);
5) Available information on imported fish was subtracted. Excluding conch and lobster (because conch are not imported and lobster imports are negligible), we assumed that 50% of tourist finfish consumption is domestically sourced, the remainder being imported;
6) The remainder was taken as the unreported tourist demand fulfilled by domestic artisanal fisheries.
A similar calculation was completed to account for cruise ship tourists who began arriving in the TCI in 2006. To estimate the percentage of cruise ship tourists consuming a local meal while on an onshore daytrip, a customer service representative estimated that approximately 30% of the guests consume one meal while ashore for the day (Nikki Beare, Princess Cruises, pers. comm.). Thus, it was assumed 30% of cruise ship passengers consumed one meal while ashore.
New data from the most recent 2013 survey suggested a tourist seafood consumption rate of 0.56 kg·person−1·day−1 which was used as an anchor point to calculate recent tourist seafood consumption.
Recreational Catches
Recreational catches are defined here as catches taken for the primary purpose of sport or pleasure. A sport fishery was assumed to have begun with the onset of tourism in 1965. Surveys suggested that 0.02% of all tourists in 2002, and 0.04% in 2004, came to the TCI primarily to fish (TCI Tourist Board, 2003, 2005). From 1965–1980, 0.01% of tourists were assumed to come primarily to fish, from 1990–2002, 0.02%, and from 2004–2013, 0.04%. The percentage of tourists assumed to be recreational fishers was linearly interpolated between the three time-series anchor points. All tourists with a focus on fishing were assumed to catch 10 kg·visit−1 (visits average 6 days). The following species were allocated at 10% of catches each: bonefish, blue marlin, sailfish (Istiophorus albicans), wahoo (Acanthocybium solandri), bigeye tuna, blackfin tuna, swordfish (Xiphias gladius), shark (Elasmobranchii), barracuda (Sphyraenidae), and dolphinfish (Coryphaena hippurus).
Foreign (Illegal) Fishing
There have been reports of illegal fishing (i.e., poaching) from neighboring Haiti and the Dominican Republic for conch, lobster and finfish (MacAlister Eliot Partners Ltd, 2003; Rudd, 2003). This is viewed as a significant issue, since poaching vessels “can carry several tons of seafood to their homeland per trip” (TCI Government, 2013). Estimates of these foreign catches, using a flowchart of catch origins provided by Halls et al. (1999) suggest the equivalent of less than 1% of total conch catches is caught by foreign fishers. Since no specific information could be found regarding other foreign catches, this figure of “less than 1% of total conch” was used to create a proxy for foreign (illegal) conch, lobster and finfish catches. The equivalent of 0.5% of total reconstructed conch and 0.3% of total reconstructed lobster and finish (requiring more skill) catches were estimated to account for foreign poaching. The Dominican Republic was assumed responsible for 85% of these foreign catches and Haiti 15%, since Dominicans have a higher usage of motorized vessels.
Results
Adjusted Reported Data Baseline
The FAO landings data, which were used as our time-series of officially reported catches, amounted to 219,173 t for the 1950–2012 period. Our reconstruction improved on the reported data using more trusted national data. From 1950–1964, these exported catch amounts were raised, and from 1965–1973 they were lowered which resulted in an adjusted reported baseline of 360,000 t for the 1950–1975 period (Figure 3A).
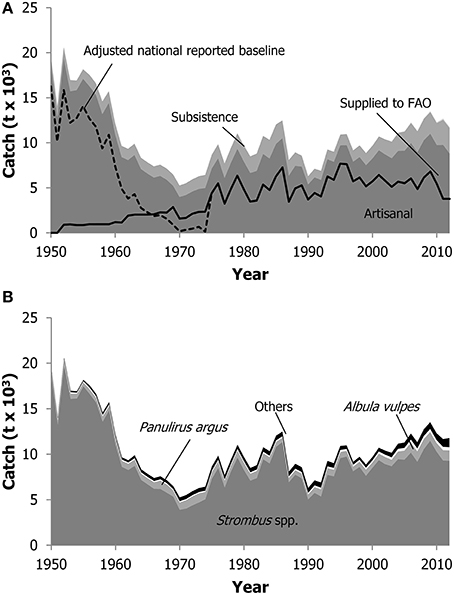
Figure 3. (A,B) Time-series of reconstructed domestic marine catches for Turks and Caicos Islands by (A) fishing sector (recreational is too small to show), with data reported by FAO on behalf of the TCI, as well as the adjusted national reported data overlaid as dashed lines; and (B) by major taxa, with the “others” grouping consisting of 20 additional taxa.
Reconstructed Total Catch
The reconstructed total catch resulting from the combination of exported fish and lobster with the newly estimated domestic and tourist consumption amounted to approximately 668,000 t for the 1950–2012 period (Figure 3A). The reconstructed total catch peaked in the early 1950s at around 20,000 t·year−1, after which it declined to a low of around 5300 t in 1970, gradually increasing thereafter to average about 11,500 t·year−1 in the 2000s (Figure 3A). Please see Appendix Table 1 in Supplementary Material for a detailed comparison of the reported data and the adjusted reported data, as well as each sector's catches for the duration of the time-series. The reconstructed total catch was 86% higher than the adjusted reported national baseline catch for 1950–2012, and 2.8 times higher than the data reported to the FAO for the TCI (Figure 3A).
The main fisheries catch in the TCI was from the artisanal sector, which contributed around 85% to the reconstructed total catch (Figure 3A). The artisanal catch consisted mainly of conch (89%) and lobster (6%), while various fish taxa (over 20 taxa) each made minor contributions. The subsistence sector contributed 15% to the reconstructed total catch (Figure 3A), and consisted of conch (85%) and lobster (11%), with various fish taxa making minor contributions. The recreational catches contributed only around 0.1%, or about 1,000 t in total, to the reconstructed catch.
Overall, the major taxonomic contributors to the total catch were conch (by weight, 87%) and lobster (7%), while bonefish, snapper, grunts, grouper, wrasses, sharks, and 18 other taxa contributed considerably smaller amounts to the total reconstructed catch (Figure 3B, Appendix Table 2 in Supplementary Material).
Domestic Consumption
Local subsistence consumption for conch averaged 200 t·year−1 in the early 1950's which gradually increased to about 350 t·year−1 from 2011 to 2012. For lobster, it averaged 143 t·year−1 in the early 1950s, which gradually increased until 1980 at 188 t. It then decreased to 95 t in 1984, before then gradually increasing again to average 305 t·year−1 from 2011–2012. Finfish consumption was at 124 t in 1965, but soon decreased to 89 t by 1971. It then gradually increased to average 167 t·year−1 for 2011 and 2012. The catches were allocated to 17 taxa, with the most allocated to bonefish, snapper, grunts, and sharks.
Tourist Consumption
For the stopover tourists to the TCI, conch consumption was estimated to begin at 1.24 t in 1967, which gradually rose as tourism increased to average 533 t·year−1 for 2011 and 2012. Tourist lobster consumption was estimated to begin at 0.315 t in 1967 which gradually increased to average 134 t·year−1 for 2011 and 2012.
For the cruise ship tourists who spend less than a day ashore, conch consumption was estimated to begin in 2006 at 6.3 t which gradually increased to average 14.2 t·year−1 for 2011 and 2012. Lobster consumption of this group was estimated to begin at 0.16 t in 2006, increasing slightly to average 0.36 t·year−1 for 2011 and 2012.
Conch
Total conch catches from the TCI, including both exports and domestic consumption, amounted to nearly 573,000 t from 1950 to 2012, or 87% of the island's total catches by weight.
Lobster
Total lobster catches from the TCI, including both exports and domestic consumption, amounted to nearly 46,000 t from 1950–2012, or 7% of the islands' total catches by weight.
Finfish
Total finish catches from the TCI amounted to just over 39,000 t from 1950–2012, which consisted mainly of bonefish, and then to a much lesser extent, snappers, grunts and sharks (See Appendix Table 2 in Supplementary Material for annual details).
Recreational Catches
Recreational catches from sports fishing commenced in 1965 with 0.025 t of fish caught, which gradually increased to average 130 t·year−1 from 2011–2012.
Foreign (Illegal) Catches
The Dominican Republic was estimated to catch a total of approximately 2600 t, averaging about 44 t·year−1, and Haiti just over 500 t in total at 9 t·year−1. The catch composition for both countries was assumed to have consisted of conch (88%), finfish (7%), and lobster (4%).
Discussion
The reconstructed baseline of the TCI fisheries is almost twice the pre-existing one, which has troubling implications. The incomplete totals have been used for decades to calculate supposedly sustainable catch limits for the islands' marine resources. We can now see that these limits have been far from sustainable and have facilitated overexploitation of national fish stocks. Considering marine resources contribute over 10% of the GDP as of 2015 (IndexMundi.com), and benefit residents by providing readily available and potentially long-term sources of local protein and employment, there is an urgent need to act on the results of this study. Policy-driven, future increases in the TCI's national population and its tourist numbers (TCI Government, 2012), with the increase in local seafood consumption that will result, will be devastating to the health of TCI fisheries without legislation to curb catches and/or consumption.
Queen conch were found to contribute 87% to the total reconstructed catches for the TCI, emphasizing that this is an extremely important species, however, their future looks bleak. The TCI's queen conch population is seen as one of the more abundant and thus, healthier populations in the greater Caribbean, and their continued “health” is important to the sustainability of the species as a whole. Although the TCI marine resource managers have tried to limit conch catch, the results of this study show that the unaccounted for local and tourist consumption essentially accounts for what managers see as a sustainable catch (the maximum sustainable catch calculated for the 2013–2014 season was assumed to be 372 t processed catch, with 145 t reserved as domestic quota, which nearly equates to the estimated local and tourist consumption). The whole export quota may resultantly be unsustainable catch. It should be no surprise that a snapshot assessment by means of a visual survey conducted toward the end of that season signaled a declining conch population, even with official landings inside the quota.
The TCI government, advised by DEMA, has looked to act on some of the new data used in this reconstruction. Referencing the 2013 seafood consumption survey, as well as the underwater visual survey, they subsequently announced that the sustainable catch quota will be reduced to just 277 t of processed conch for the following season. Knowing that over 90% of this quota would have been taken up by domestic consumption, DEMA then recommended an export cessation of up to five years. Reducing domestic consumption would be much more difficult as much of this fishery is unreported and therefore challenging to regulate. However, the TCI government has delayed in actually implementing the export cessation, which may further impair the conch stocks. The full reconstruction, as presented here, adds further weight to the their need to act as soon as possible to reduce conch landings. With the TCI only permitted to export conch to CITES signatories if it demonstrates a well-developed management plan, any lack of further action could see CITES effectively implement an export ban with the TCI.
The TCI is not the only country where marine policy-makers need to take notice of fishery catch reconstructions. The data presented here are part of the global study summarized by Pauly and Zeller (2016). Although the TCI is the only country where artisanal and subsistence catches decreased from the mid-1980s to the mid-1990s, the increase in artisanal and subsistence catches over time aligns with the results of other catch reconstructions. Overall catches in the TCI have noticeably declined, which fits the regional profile for the Western Central Atlantic of catches peaking around 1985 and declining thereafter. In the immediate neighboring region, the underreporting of fisheries catches has been a similar issue. Reconstructed catches for Haiti, the Dominican Republic and Jamaica were found to be over 3, 4 and 5 times (respectively) those reported (Ramdeen et al., 2012; Van der Meer et al., 2014). Findings in these studies also support calls for the more regular collection and estimation of local and tourist consumption, so that stock evaluations and catch quota estimation can be undertaken using the best available data.
In the TCI, only exports were being accurately assessed in the calculation of quotas. Local consumption, a necessary and substantial addition, was omitted or underestimated, as data were not always available or up-to-date. With this issue brought to light, it is hoped future catch quotas will be calculated based on total removals by all sectors. For a nation with limited resources, the recent seafood consumption surveys are a fairly simple and low-cost approach to collect the required domestic consumption data. With a high number of participants enrolled, the surveys are resistant to being skewed by atypical variations discovered in individual diets, and can be considered representative. It is recommended, if possible, they be continued at an interval of every 5 years.
The detailed technical catch reconstruction report that underpins the present contribution is freely available at http://www.seaaroundus.org/doc/publications/wp/2015/Ulman-et-al-Turks-and-Caicos.pdf, and can also be found at the Turks and Caicos EEZ data page at http://www.seaaroundus.org/data/#/eez/796?chart=catch-chart&dimension=taxon&measure=tonnage&limit=10.
Ethics Statement
The ethics committee that approved the seafood survey carried out as part of this study was the School for Field Studies (SFS) Office of Academic Affairs, IRB Administration. The IRB approval number is TCI-01-14a. The research was exempted from a full IRB process under Category 2 of the U.S. Code of Federal Regulation Title 45 Public Welfare Part 46 Protection of Human Subjects 46.101b. Qualification for this exemption was achieved as the survey procedures ensured (i) information was obtained and recorded in such a manner that human subjects could not be identified, directly or through identifiers linked to the subjects; and (ii) because any disclosure of the human subjects' responses outside the research could not reasonably place the subjects at risk of criminal or civil liability or be damaging to the subjects' financial standing, employability, or reputation.
Author Contributions
The original methodology was decided upon by DZ. EH provided some of the background data. AU, RR, and DZ helped calculate the methodology. AU, LB, EH, and DZ contributed to both the writing and editing of the paper.
Funding
This research was funded by The Pew Charitable Trusts and The Paul G. Allen Family Foundation. The School for Field Studies and DEMA from the Turks and Caicos Islands helped fund the seafood consumption survey.
Conflict of Interest Statement
The authors declare that the research was conducted in the absence of any commercial or financial relationships that could be construed as a potential conflict of interest.
Acknowledgments
This work was completed as part of the Sea Around Us, a scientific initiative supported by The Paul G. Allen Family Foundation and The Pew Charitable Trusts. EH gratefully acknowledges the key financial and logistical support provided by The School for Field Studies (SFS) and DEMA, as well as the staff and students of The SFS Center for Marine Resources Studies Fall 2013 Program, and Kathleen Wood, Luc Clerveaux and Maggie Wisniewski of DEMA for their assistance with collecting the data for the 2013 tourist and domestic seafood consumption study.
Supplementary Material
The Supplementary Material for this article can be found online at: https://www.frontiersin.org/article/10.3389/fmars.2016.00071
References
Béné, C., and Tewfik, A. (2000). Analysis of Fishing Effort Allocation and Fishermen Behaviour Through a System Approach. University of Portsmouth: CEMARE Research Paper 155.
Brownwell, W., and Stevely, J. (1981). The biology, fisheries, and management of the Queen Conch, Strombus gigas. Mar. Fish. Rev. 43, 1–12.
Bryden, J. (1973). Tourism and Development: A Case Study of the Commonwealth Caribbean. Cambridge: Cambridge University Press.
Clerveaux, W., and Lockhart, K. (2008). “Fisheries of the Turks and Caicos Islands,” in A history of the Turks and Caicos Islands, ed C. Mills (Oxford: Macmillan), 68–78.
Clerveaux, W., Puga, R., and Medley, P. (2003). “National report on the spiny lobster fishery of the Turks and Caicos Islands,” in Report of the Second Workshop on the Management of Caribbean Spiny Lobster Fisheries in the WECAFC Area, Havana, Cuba, 30 September – 4 October 2002 (Rome: Food and Agriculture Organization), 162–174.
CRFM (2011). “Baseline review of the status and management of the Caribbean spiny lobster fisheries in the Caricom region,” in CRFM Technical & Advisory Document - Number 2011/5, ed C. Secretariat (Belize City: Caribbean Regional Fisheries Mechanism Secretariat, Belize and St. Vincent and the Grenadines), 27–28.
Garibaldi, L. (2012). The FAO global capture production database: a six-decade effort to catch the trend. Mar. Policy 36, 760–768. doi: 10.1016/j.marpol.2011.10.024
Halls, A. S., Lewins, R., and Farmer, N. (1999). Information Systems for the Co-Management of Artisanal Fisheries. Field Study 2- Turks & Caicos. London: MRAG Ltd.
Klaus, D. (2001). Baseline Assessment of Commercially Viable Finfish for Future Management in the Turks and Caicos Islands. Thesis, BA, Claremont Colleges.
Lockhart, K., De Fontaubert, C., and Clerveaux, W. (2007). “Fisheries of the Turks and Caicos Islands: Status and Threats,” in Proceedings of the 58th Gulf and Caribbean Fisheries Institute, (San Andrés), 66–71.
Lockhart, K., Magnusson, G., and Clerveaux, W. (2006). “Consumption of local Conch by residents of the TCI,” in Proceedings of the 57th Gulf and Caribbean Fisheries Institute (St. Petersburg, FL), 791–801.
MacAlister Eliot Partners Ltd (2003). “Impact of fisheries bycatch on endangered migratory species,” in Convention on the Conservation of Migratory Species of Wild Animals (CMS). Twelfth Meeting of the CMS Scientific Council. Glasgow, 31 March-3 April 2004 (Lymington).
Maitland, T. (2006). Dietary habits, diversity and the indigenous diet of The Turks and Caicos Islands. Implications for Island-specific nutrition intervention. West Indian Med. J. 55, 1–13. doi: 10.1590/S0043-31442006000600003
Medley, P., and Ninnes, C. (1999). A stock assessment for the conch (Strombus gigas L.) fishery in the Turks and Caicos islands. Bull. Mar. Sci. 64, 399–406.
Olsen, D. A. (1985). “Fishery resource assessment of the Turks and Caicos Islands,” in Final Report on FAO Project TCI/83/002 (Rome).
Pauly, D., Ulman, A., Piroddi, C., Bultel, E., and Coll, M. (2014). ‘Reported’ versus ‘likely’ fisheries catches of four Mediterranean countries. Scienta Marina 78S1, 11–17. doi: 10.3989/scimar.04020.17A
Pauly, D., and Zeller, D. (2016). Catch reconstructions reveal that global marine fisheries catches are higher than reported and declining. Nat. Commun. 7, 9. doi: 10.1038/ncomms10244
Ramdeen, R., Smith, N., Frotte, L., Lingard, S., Harper, S., Zeller, D., et al. (2012). “Reconstructed total catches by the marine fisheries of countries of the wider Caribbean (1950–2010),” in Proceedings of the Gulf and Caribbean Fisheries Institute (Santa Marta).
Rudd, M. (2003). “Fisheries landings and trade of the Turks and Caicos Islands,” in Fisheries Centre Research Reports (Vancouver, BC: Fisheries Centre, University of British Columbia), 149–161.
Taylor, O., and Medley, P. (2003). Marine Resource Assessment Group's (MRAG) Fisheries Management Science Programme (FMSP). Turks and Caicos Islands field report. Participatory Fisheries stock assessment project R7947, Marine Resources Assessment Group Limited, London, 1–56.
TCI Government (2004). Plan for Managing the Marine Fisheries of the Turks and Caicos Islands 2005–2010. Department of Environment and Coastal Resources, Grand Turk, Turks and Caicos Islands, 8–37.
TCI Government (2012). Turks and Caicos Islands Development Strategy 2013-2017. Grand Turk: Turks and Caicos Islands Government.
TCI Government (2013). “Turks and Caicos Islands National Report on the Queen Conch Fishery 2012/2013.” Lower Bight Road, Providenciales: Department of Environment and Maritime Affairs, Ministry of Environment and Home Affairs.
TCI Tourist Board (2003). “Survey of Departing Visitors Report– 2002,” in Statistical Office Department of Economic Planning and Statistics.
TCI Tourist Board (2005). “Survey of Departing Visitors Report June– 2004,” in Statistical Office Department of Economic Planning and Statistics.
Tewfik, A., and Béné, C. (2004). “The Big Grab”: Non-compliance with regulations, skewed fishing effort allocation and implications for a spiny lobster fishery. Fish. Res. 69, 21–33. doi: 10.1016/j.fishres.2004.04.004
Thiele, S. (2001). “Queen Conch fisheries and their management in the Caribbean,” in TRAFFIC Europe. WWF and IUCN.
Ulman, A., Çiçek, B., Salihoglu, I., Petrou, A., Patsalidou, M., Pauly, D., et al. (2015). Unifying the catch data of a divided island: Cyprus's marine fisheries catches, 1950–2010. Environ. Dev. Sustain. 17, 801–821. doi: 10.1007/s10668-014-9576-z
Van der Meer, L., Ramdeen, R., Zylich, K., and Zeller, D. (2014). “Reconstruction of total marine fisheries catches for the Dominican Republic (1950-2009),” in Fisheries Catch Reconstructions: Islands, Part IV, eds K. Zylich, D. Zeller, M. Ang, and D. Pauly (Vancouver, BC: Fisheries Centre), 43–54.
Zeller, D., Booth, S., Davis, G., and Pauly, D. (2007). Re-estimation of small-scale fisheries catches for U.S. flag island areas in the Western Pacific: The last 50 years. US Fish. Bull. 105, 266–277.
Keywords: artisanal fishery, catch reconstruction, Caribbean fisheries, gastropod fisheries, queen conch, subsistence fishery, sustainable consumption, unreported catch
Citation: Ulman A, Burke L, Hind E, Ramdeen R and Zeller D (2016) Conched Out: Total Reconstructed Fisheries Catches for the Turks and Caicos Islands Uncover Unsustainable Resource Usage. Front. Mar. Sci. 3:71. doi: 10.3389/fmars.2016.00071
Received: 06 January 2016; Accepted: 25 April 2016;
Published: 10 May 2016.
Edited by:
Maria Lourdes D. Palomares, FishBase Information and Research Group, Inc., PhilippinesReviewed by:
Athanassios C. Tsikliras, Aristotle University of Thessaloniki, GreeceJonathan A. Anticamara, University of the Philippines-Diliman, Philippines
Copyright © 2016 Ulman, Burke, Hind, Ramdeen and Zeller. This is an open-access article distributed under the terms of the Creative Commons Attribution License (CC BY). The use, distribution or reproduction in other forums is permitted, provided the original author(s) or licensor are credited and that the original publication in this journal is cited, in accordance with accepted academic practice. No use, distribution or reproduction is permitted which does not comply with these terms.
*Correspondence: Aylin Ulman, aylinh.ulman@unipv.it