Establishing an Anthropogenic Nitrogen Baseline Using Native American Shell Middens
 Autumn Oczkowski
 Thomas Gumbley2
  Austin Humphries
- 1Atlantic Ecology Division, U.S. Environmental Protection Agency, Narragansett, RI, USA
- 2Economics and Environmental Sciences Departments, Stonehill College, North Easton, MA, USA
- 3Department of Biological Sciences, Bowling Green State University, Bowling Green, OH, USA
- 4Dauphin Island Sea Lab, Dauphin Island, AL, USA
- 5Department of Fisheries, Animal, and Veterinary Sciences, College of the Environment and Life Sciences, University of Rhode Island, Kingston, RI, USA
Narragansett Bay, Rhode Island, has been heavily influenced by anthropogenic nutrients for more than 200 years. Recent efforts to improve water quality have cut sewage nitrogen (N) loads to this point source estuary by more than half. Given that the bay has been heavily fertilized for longer than monitoring programs have been in place, we sought additional insight into how N dynamics in the system have historically changed. To do this, we measured the N stable isotope (δ15N) values in clam shells from as early as 3000 BP to the present. Samples from Native American middens were compared with those collected locally from museums, an archeological company, and graduate student thesis projects, during a range of time periods. Overall, δ15N values in clam shells from Narragansett Bay have increased significantly over time, reflecting known patterns of anthropogenic nutrient enrichment. Pre-colonization midden shell δ15N values were significantly lower than those post-European contact. While there were no statistical differences among shells dated from the late fifteenth century to 2005, there was a significant difference between 2005 and 2015 shells, which we attribute to the higher δ15N values in the effluent associated with recent sewage treatment upgrades. In contrast, the δ15N values of shells from the southern Rhode Island coast remained constant through time; while influenced by human activities, these areas are not directly influenced by point-source sewage discharge. Overall, our results show that this isotope technique for measuring δ15N values in clam shells provides useful insight into how N dynamics in coastal ecosystems have changed during thousands of years, providing managers vital historical information when setting goals for N reduction.
Introduction
Narragansett Bay (RI, USA) has undergone appreciable change in its physical and biological properties in recent years, some intentional and others indirect. In particular, the bay receives most of its anthropogenic nitrogen (N) from sewage. During the last decade, all of the major sewage treatment plants discharging to the bay and watershed have upgraded to tertiary treatment (Nixon et al., 2008; Krumholz, 2012). These upgrades have reduced sewage N loads to the bay by more than half, from 16 to 20 mg L−1 to less than 8 mg L−1 (Krumholz, 2012). The impetus for the upgrades was to improve water quality in the upper portions of the Bay, where bottom water hypoxia is common in summer months (Bergondo et al., 2005; Spaulding and Swanson, 2008; Codiga et al., 2009). The bay also has warmed by ~1.6°C during the past 50 years, and long term datasets show trends in decreased wind speeds and increased cloudy days (Pilson, 2008; Fulweiler et al., 2015). Others have observed declines in surface water chlorophyll concentrations and there is emerging evidence for decreased benthic-pelagic coupling (Fulweiler and Nixon, 2009). Distinguishing between ecological responses to reduced N conditions and the increasingly apparent effects of climate change, therefore, is difficult and has important implications for future management scenarios.
Ultimately, managers want the best possible water quality in Narragansett Bay, which, ideally is as close to pre-European contact conditions as possible. Giovanni da Verrazzano discovered Narragansett Bay for Europe in 1594 (Wroth, 1970), after which began a period of colonization and extensive land clearing. Nixon (1997) estimated that pre-contact dissolved inorganic nitrogen loads to Narragansett Bay, from the land were on the order of 4.7–23 × 106 mol y−1, while loads of dissolved inorganic phosphorous were about 0.3 mol y−1. When considered on a per unit area basis, these estimated N inputs were far lower than those for well-known oligotrophic systems like the Sargasso Sea and North Central Pacific Gyre (Nixon et al., 1996, 2008). With such low pre-contact terrestrial nutrient loads, some 80–90% of the N inputs to the bay may have come from offshore sources (Nixon, 1997). In contrast, Nixon (1997) estimated that, at least in the mid-1990s, the offshore contribution was only 15% of the N load to Narragansett Bay.
Overall, Narragansett Bay has been highly impacted by human activities for more than 200 years (Nixon, 1995). The US Industrial Revolution began in the Narragansett Bay watershed in 1790 and led to rapid development and associated increases in both human populations and manufacturing wastes. There was also massive land-clearing co-occurring and by 1850, 80% of Rhode Island was classified as farmland (Hooker and Compton, 2003). The biggest increase in N inputs to the Bay, however, happened at the end of the nineteenth century, when the city of Providence's sewer system was completed (Figure 1; Nixon et al., 2008). Populations served by the sewer systems around Narragansett Bay have been stable since the 1950s, but the methods of wastewater treatment have changed (see Nixon et al., 2008 for a more detailed discussion).
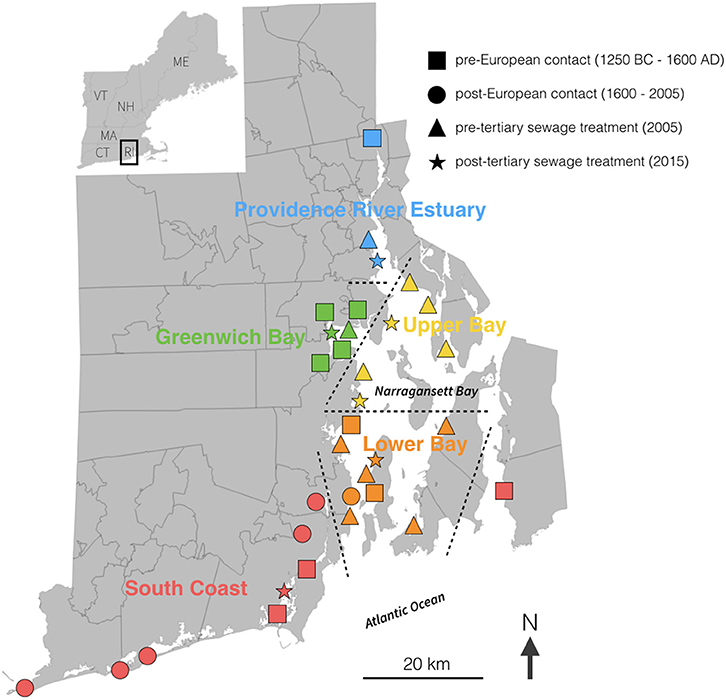
Figure 1. Map of Rhode Island showing sample locations and regional delineations. The shapes of the symbols indicate the time of sampling and colors indicate region. The regional delineations are further illustrated by dashed lines. More detailed information on sample type (clam or oyster) and time period are provided in Table 1.
As recent efforts to reduce nutrient loads and improve water quality have been increasingly successful, it seems reasonable to ask what a remediated Narragansett Bay might look like. Unfortunately, we have no direct knowledge of the system prior to large-scale alteration; our water quality and ecological datasets do not extend back that far. Carmichael et al. (2008) and Kovacs et al. (2010) developed methods to measure nitrogen stable isotope ratios (δ15N) recorded in clam and oyster shells during life, where organic N, bound in the shell's matrix in seasonal depositional bands, reflect the bioavailable N at the time of deposition. By looking at the stable isotope ratios of this N, we can understand something about the N sources to the clam or oyster. These methods allow us to measure δ15N values in shells from a range of time periods, including those from Native American shell middens, to provide data on historical δ15N values. Such data could provide insight into N dynamics in both modern and pre-European contact environments and establish an anthropogenic baseline from which to compare alterations in δ15N associated with changes in source N loads (as also demonstrated by Darrow, 2015).
A number of stable isotope studies have been conducted in Narragansett Bay to discern the impact of human sources of N on the ecosystem. Some have focused on the sediment (e.g., Garber, 1982; King et al., 2008), and a core from the Providence River Estuary showed a pronounced 1.7‰ shift after 1950 that was associated with rapid residential development (King et al., 2008). Other studies have focused on how N from sewage treatment plants is taken up and distributed throughout the bay ecosystem (e.g., Chaves, 2004; Oczkowski et al., 2008; DiMilla et al., 2011; Schmidt, 2014; Pruell and Taplin, 2015). Collectively, these studies provide context from which to assess shell δ15N isotope data. Schmidt (2014), Oczkowski et al. (2008), and Chaves (2004) observed gradients in δ15N values in particulate material and macroalgae from the urban upper Bay to the more marine dominated lower Bay. Pruell and Taplin (2015) made similar observations in juvenile winter flounder. In contrast, the δ15N values in hard clams (Mercenaria mercenaria) were spatially homogenous, with mean values of 13.2 ± 0.5‰ (n = 485, Oczkowski et al., 2008) in 2006 and 13.7 ± 0.5‰ in 2012 (n = 166, Schmidt, 2014). Because the observed values were characteristic of sewage-enriched systems, Oczkowski et al. (2008) suggested the hard clams might be consuming phytoplankton supported, in part, by sewage effluent. Between 2006 and 2008, the δ15N values in macroalgae in the Providence River Estuary and upper Narragansett Bay increased by about 1‰, potentially associated with the upgrade from secondary to tertiary treatment. A recent study has demonstrated that, while concentrations of bio-available N in tertiary treated effluent has been greatly reduced, the denitrification process has increased effluent δ15N values by about 7‰ (Schmidt et al., 2016). Thus, while N inputs have been reduced, the signature of that N has increased substantially.
To better define how N dynamics in the Narragansett Bay system have historically changed, we measured δ15N values in clam shells from as early as 3000 BP to the present. We hypothesized that the δ15N values would record significant differences in nitrogen dynamics, both spatially and over time, in shells from Rhode Island waters. We suggest that the pre-European Contact values provide a quantitative metric from which to compare more recent changes in N sources. Also, to calibrate shell data as a proxy for δ15N values typically measured in tissues, the δ15N values in clam shells from 2005 and 2015 were compared to values in soft tissues.
Materials and Methods
Sample Collection
Hard clam (M. mercenaria) and oyster (Crassostrea virginica) shells from before 2005 were obtained from museums, archeological research groups, and colleagues (see Table 1), where the next most recent shells were from 1983. All shells were stored dry. While few oyster shells were available, we included them here to provide additional context for the clam shell dataset and to contribute to the research community's understanding of species specific shell stable isotope values. Shells from 2005 were collected in subtidal regions by the Rhode Island Department of Environmental Management (RI DEM) and subsamples were used in a sclerontological project (Henry, 2007). Hard clam samples from 2015 were collected by hand in intertidal regions or obtained from the RI DEM (Table 1). Overall, whole shells were similarly sized, with a mean length of 6.2 ± 1.8 cm and width of 4.2 ± 1.3 cm. Tissues (foot) from some of the 2005 Narragansett Bay clams and the 2015 clams were retained for stable isotope analysis (Oczkowski et al., 2008, 2010).
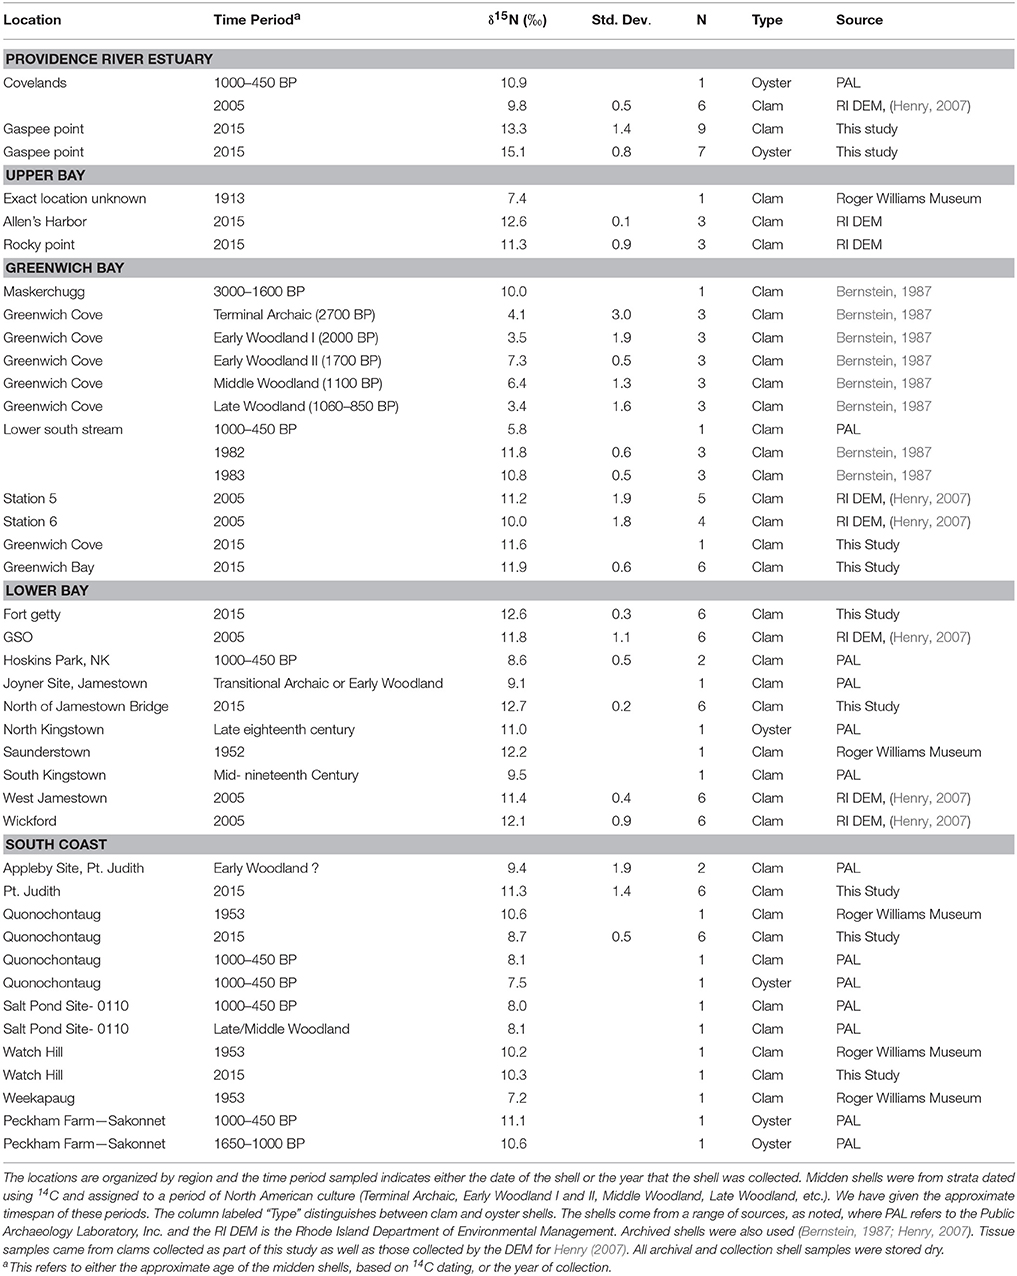
Table 1. Mean δ15N values of clam and oyster shells, by location.
Shell Preparation
Details of shell preparation were described by Kovacs et al. (2010) and Carmichael et al. (2008). Shells were sanded with a Dremel 8220 (Robert Bosch Tool Corporation, Waltham, Massachusetts, USA) until surfaces were smooth. The outer millimeter of shell was removed through this process. The shells were then rinsed with deionized water and dried in a 60°C oven for at least 24 h. Dried shells were ground to a fine powder using a SPEX SamplePrep 8530 ShatterBox (SPEX SamplePrep, Metuchen, New Jersey USA). The powdered shell material was then transferred to acid-washed glass scintillation vials.
It was necessary to remove the carbonate from shell material but leave the N containing organic matter. For shells older than 1950, about 1000 mg of powdered shell was transferred to an acid-washed scintillation vial, but only 500 mg was needed for the more recent shells. Two milliliters of a 1% PtCl2 in 1 N HCl solution was added daily to each vial, until all apparent reaction stopped. About 14 ml of solution was needed for 1000 mg of powdered shell. The vial contents were syringe filtered through a pre-combusted glass-fiber filter. The syringe was then rinsed with 5 ml of deionized water and this water was also pushed through the same filter. The filter was then dried in a 60°C oven for at least 24 h. Dried filters were pelletized in preparation for analysis.
Tissue Preparation
The 2015 clam tissue samples were processed in the same manner as described in Oczkowski et al. (2008), where the foot of each clam was removed, rinsed with deionized water, and dried in a 60°C oven for at least 24 h. The intent was to consistently isolate a clearly identifiable portion of muscle tissue and to exclude stomach contents. Dried clam tissue samples were ground to a fine, homogenous powder using a mortar and pestle and stored in acid-washed glass scintillation vials until analysis.
Stable Isotope Analysis
The δ15N content of the shell and tissue samples was measured using an Isoprime 100 Isotope Ratio Mass Spectrometer interfaced with a Micro Vario Elemental Analyzer (Elementar Americas, Mt. Laurel, New Jersey, USA). The nitrogen isotope composition was expressed as a part per thousand (per mil) deviation (δ15No) from air, where δ15N = [(Rsample−Rstandard)/Rstandard] × 103 and R is the ratio 15N/14N in either the sample or a reference standard (air). Samples were analyzed randomly and laboratory standards were used to check for instrument drift in each run and to correct for instrument offset. Approximately 20% of the shell samples were extracted and analyzed in duplicate, with replicate δ15N values measured on separate runs. Samples were reproducible to within 0.30‰.
Data Analysis
To look for differences in nitrogen isotope values across regions and at different periods of time (and associated levels of anthropogenic impact), we grouped the δ15N data for statistical analysis. Data were assigned regional bins of the Providence River Estuary, upper Bay, Greenwich Bay, lower Bay, and South Coast (Figure 1). We considered all regional bins except South Coast to be within Narragansett Bay. While receiving some anthropogenic N from non-point sources (Ernst, 1996), nutrient inputs to the South Coast water bodies are lower than the inputs to Narragansett Bay. Thus, the samples collected at these South Coast water bodies were grouped together. Samples were also binned according to time period: (a) pre-European contact from roughly 3000 BP to 350 BP, (b) post-European contact between 1600 (350 BP) and 2005, (c) 2005, and (d) 2015.
We used a linear mixed-effects model (LME) to evaluate the effects of region and time period, and their interaction, on δ15N values in clam shells. Where there were statistically significant interactions, Tukey post-hoc comparisons were used to determine formal relationships. We tested the data for normality using Shapiro–Wilks test and quantile–quantile plots and all data met statistical assumptions (Zuur et al., 2009). We also calculated Pearson's correlation coefficients between clam shell and tissue δ15N values. Since there were few oyster shell data, we did not formally test these. Statistical analyses were done in R, version 3.1.3. All values are reported as mean δ15N values.
Results
Clam Shells
The mean δ15N values measured in clam shells ranged from 3.4 to 13.3‰ across all regions and time periods (Table 1). δ15N varied by region (F-value = 28.23, p < 0.001) and time period (F-value = 54.91, p < 0.001), as well as their interaction (F-value = 7.27, p < 0.001). In general, clam shells collected from all sites in Narragansett Bay in 2015 had higher values than those from earlier time periods, particularly from those dated pre-European contact (Figure 2). In contrast to observations from Narragansett Bay, there were no significant differences among δ15N values in clam shell from different time periods in the Southern Coast region (F-value = 1.129, p = 0.347).
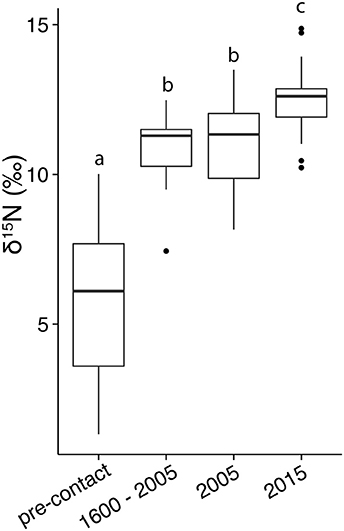
Figure 2. Box and whisker plot of δ15N values of clam shells from Narragansett Bay (all regions except South Coast) from pre-European contact to present day. Horizontal lines in the middle of the boxes represent the median, the box limits represent the upper and lower quartiles, the vertical lines indicate the maximum and minimum, and the dots lie outside of the 95% confidence interval. Letters indicate homogeneous subgroups using Tukey post-hoc comparisons (p < 0.05). Sample sizes: pre-contact = 29, 1600–2005 = 13, 2005 = 33, 2015 = 54.
The differences across time were consistent in the mainstem of Narragansett Bay (Figures 3A,B,D). In Greenwich Bay, where the most pre-European contact samples were available, all clams from time periods since European contact had significantly higher δ15N values than pre-European contact samples (Figure 3C). But, there were no statistically significant differences among the post-European contact categories in Greenwich Bay. Clam shells from 2005 were not different from shells collected between European contact and 2005 in both the overall, whole Bay comparisons, as well as in the regions where samples were available (Greenwich Bay, lower Bay; Figure 3 and Table 2). However, the 2015 clams from both the Providence River Estuary and Lower Narragansett Bay had significantly higher δ15N values than those from 2005 (Figures 3A,D); as with the broader Narragansett Bay dataset.
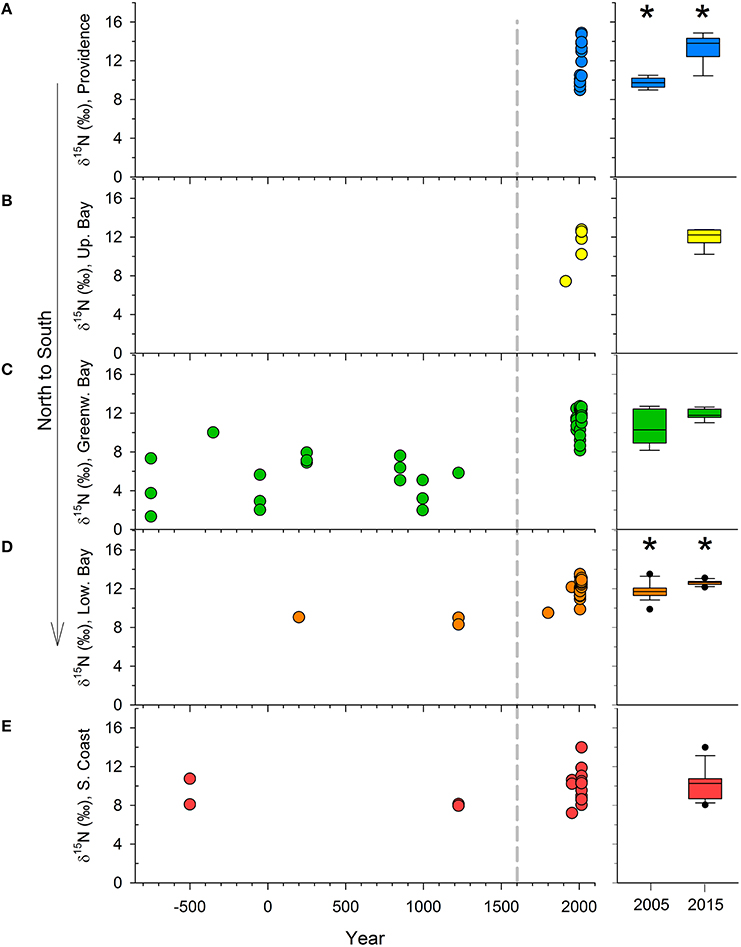
Figure 3. The δ15N values in organic material from clam shells, through time and by region, including the Providence River Estuary (A), upper Bay (B), Greenwich Bay (C), lower Bay (D), and the Southern Rhode Island Coast and Sakonnet (E). The dashed gray line denotes the approximate time of European Contact. For clarity, the 2005 and 2015 data are expanded and given as box and whisker plots in the right column. Asterisks denote significant differences between 2005 and 2015 samples.
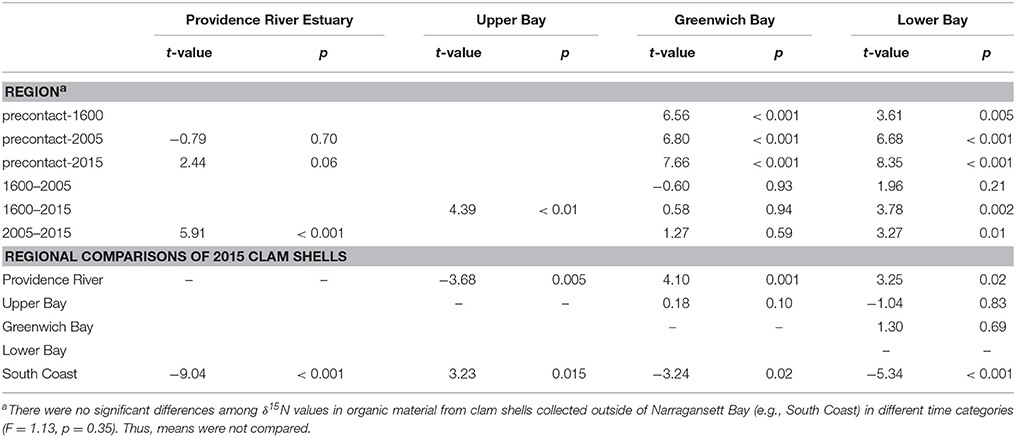
Table 2. Statistical results from the Tukey post-hoc comparisons to determine statistically significant differences among shell δ15N values over time and across regions, where p < 0.05 indicate significance and t-values the strength of the significance.
Regionally, δ15N values in clams from the Providence River Estuary were significantly higher than those from the rest of the Bay and the South Coast regions (Table 2, Figure 3). Clams from Greenwich Bay and the lower and upper Bay were statistically indistinguishable from one another, but had higher δ15N values than in clam shells from the South Coast (Table 2).
Oyster Shells
Oyster shell δ15N values ranged from 7.5 to 15.1‰ among the five midden samples from different places and time periods. The mean δ15N in modern (2015) oyster shells (n = 7) was almost 2‰ higher than the δ15N in clam shells (n = 9) from the same location (Table 1). The two oyster shell samples from middens near the Sakonnet River (on the East side of the bay near the outlet) were ~11‰, similar to midden oyster shells from near the Providence River Estuary and North Kingstown (upper Bay). All of these samples were about 3.5‰ enriched compared to shells from middens near Quonochontaug salt pond along the South Coast (Table 1).
Shell vs. Tissue
There was a significant correlation between δ15N values in clam tissue (foot) with organic material in shell (R = 0.649, p < 0.001; Figure 4). Due to sample size, availability of both shell and tissue samples, and distribution at the different sampling locations, these comparisons were only possible for the 2005 and 2015 samples. On average, the difference between tissue and shell (δ15Ntissue−shell) was 1.13 ± 1.37‰ for all data, but the mean at each station ranged from −0.8 at Pt. Judith in 2015 to 2.6‰ in the Providence River Estuary in 2005.
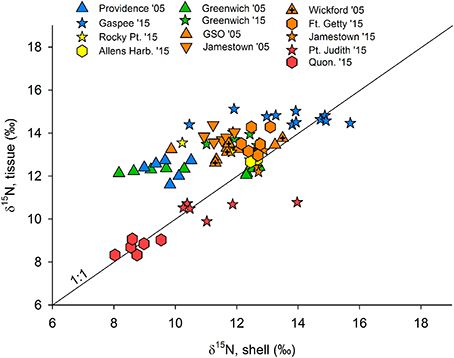
Figure 4. Shell δ15N values plotted against tissue (clam foot) data, where data are available, namely in 2005 and 2015. Colors indicate sampling regions (shown in Figure 1), where blue represents the Providence River estuary, yellow is upper Bay, green is Greenwich Bay, orange is lower Bay, and red indicates the coastal ponds. Quon. is Quonochontaug and a 1:1 line is given.
Discussion
The Anthropogenic Baseline
Our results support the hypothesis that N from clam shells reflects changes in N sources to the bay. The finding that clams from after European contact had higher δ15N values than those from before contact, for example, is consistent with the ~ five-fold increase in N inputs (predominantly from sewage treatment plants with some degree of advanced treatment) since that time (Nixon, 1997). While the midden δ15N values were variable, they suggest that baseline, pre-human overprinting of the nitrogen cycle, values were about 6‰. Offshore dissolved inorganic nitrogen concentrations are thought to be < 7‰ (Chaves, 2004). In contrast, mean δ15N values of nitrate (NO) and ammonium (NH) were measured as 6.8 ± 0.8‰ and 11.2 ± 0.5‰, respectively, in secondary treatment effluent from the major sewage treatment plants discharging to Narragansett Bay in 2004 and 2005 (DiMilla, 2006). The change in clam shell δ15N values between 2005 and 2015 reflected the change in δ15N value of the source N, despite changes in the quantity of N inputs in recent years. When the sewage treatment plants upgraded to tertiary treatment in the late-2000s, the N concentration in effluent decreased by more than half, but the δ15N values of nitrate in the remaining effluent increased from about 7‰ (2009) to 13.4‰ (2012) (Chaves, 2004; Schmidt et al., 2016). Thus, the source decreased but the δ15N value of that source increased and was recorded in the shell organic matter of local clams. Although there are temporal gaps in our dataset and it is likely that the δ15N values that characterize the anthropogenic N sources to Narragansett Bay were variable through time, our data indicate that those sources have been typically higher than the marine waters that were once the dominant source of N to the bay (Nixon, 1997).
Human sources of N to areas along the Southern Coast are fewer and more diffuse, potentially explaining why clam shell δ15N values were similar within this region. While there are some water quality concerns in the area, none of the waterbodies receive direct sewage inputs (Bernstein, 1990; Ernst, 1996; Desbonnet et al., 1999). Chlorophyll and nutrient concentrations in Point Judith Pond, one of the Southern Coast ponds, for example, were similar to values in lower portions of Narragansett Bay (Oczkowski et al., 2015), suggesting that the ponds of the Southern Coast were not as enriched by anthropogenic nutrients as the upper portions of Narragansett Bay. As the coastal ponds are within about a 30 mile radius of Lower Narragansett Bay, the chronologically homogenous shell isotope dataset from the South Coast further strengthens the hypothesis that the differences between the South Coast and Narragansett Bay data were due to human-sourced N-loads and not climatological effects, which would be reflected similarly in both regions over this relatively small spatial scale.
The Potential Role of Diagenesis
Diagenesis associated with weathering or breakdown of organic material has also been suggested as a possible source of variation in elemental ratios in ancient shell (Risk et al., 1996; Darrow, 2015). Many stable isotope studies on prehistoric samples, and thus discussions of diagenetic effects, have focused on human and animal remains (e.g., Hare et al., 1991; Larsen et al., 1992; Grupe et al., 2002; Schmidt-Schultz and Schultz, 2004). It is difficult to extrapolate this work to our clam shell data because the organic matter extraction techniques are different and varied. Hence, the effect of diagenesis on the stable isotope values in midden clam shells cannot be known with certainty from the available data. In modeling the impacts on bone, Grupe et al. (2002) found that bacterial degradation could shift the overall δ15N values higher, on the order of a trophic level. If this were true for clam shells, then ancient midden shells may be even lighter than observed, and the difference between δ15N values in midden and modern shells could be greater than we reported. Burning alters bone and shell isotope values (DeNiro, 1985; Darrow, 2015), suggesting that the heat associated with cooking also affects δ15N values (Darrow, 2015). We carefully examined our midden shells for scorch marks and none were present. Other work specific to bivalves, however, suggests organic matter in shell can be well preserved (Risk et al., 1996). Darrow (2015) also found differences in stable isotope ratios between ancient and modern bivalve shell that were distinguishable and dominant due to shifts in N source through time, even when more detailed analyses were conducted to detect the effects of diagenesis. Midden shells analyzed as part of this study were deposited over a period of at least 2000 years, and there were no trends evident (no consistent increase or decrease during that time), suggesting that diagenetic effects were not responsible for the differences observed between midden and more recent shells.
Regional Differences within Narragansett Bay
The 2015 Narragansett Bay shell δ15N values were consistent with our understanding of anthropogenic nutrient distribution and associated δ15N values in phytoplankton and macroalgae in the bay (e.g., Krumholz, 2012; Schmidt, 2014), where Providence River clam shells from 2015 had significantly higher δ15N values than those from the rest of the bay, while the upper and lower Bays were indistinguishable (Table 1). Similarly, the 2015 clam tissues had higher δ15N values in the Providence River Estuary (δ15N = 14.7 ± 0.3‰, n = 11) than the rest of the bay (δ15N = 13.2 ± 0.6‰, n = 18; Oczkowski et al., 2008). We hypothesize that the currently higher δ15N values in the Providence River Estuary clam shells and tissues reflected the recent tertiary treatment upgrades.
If we assume that anthropogenic N loads did not change substantially during the time period represented by the Greenwich Bay midden samples, particularly compared to more recent fluctuations in N sources, then the observed variability in midden data was unexpected. This variability may reflect inconsistencies in diagenetic processes during the prehistoric period, environmental stress such as periodic hypoxia that affects bivalve condition (Patterson, 2014), localized variability, or large-scale climatic shifts that affected the entire region during the time of deposition. It has been hypothesized that the exploitation of different shellfish species can be linked to paleoecology and, specifically, to cooling water temperatures across the Woodland period (Braun, 1974). It may be possible that the shift in midden δ15N values over time could be related to some of these shifts. While we cannot elicit a specific mechanism, particularly as there were no comparable midden samples from outside of Greenwich Bay in which to look for similar variability, the effect of climactic conditions on δ15N values cannot be ruled out. Others have documented shifts in δ15N values associated with the acidification of sediments, animal tissues, and plants (Bunn et al., 1995; Ryba and Burgess, 2002). But, previous studies on modern clam and oyster shells (Carmichael et al., 2008; Kovacs et al., 2010), indicated the effects of acidification, if any, should be minimal for modern shells when using the method applied for this study. In ancient bivalve shells, acidification was shown to increase variability in stable isotope ratios in some cases, but did not affect mean values (Darrow, 2015), suggesting this may be a factor contributing to variation in our midden shells. For this study, acidification was needed to isolate sufficient organic material for analyses. Because all shells were treated in the same manner, variability due to analytical methods was consistent among shell samples and did not appear to affect broader comparisons among locations or time periods.
The lack of a significant difference in the δ15N values of the Greenwich Bay post-contact clam shells was not entirely surprising. The hydrodynamics of Greenwich Bay are quite different from the main bay. Prevailing winds, particularly those that are dominant in the summer, can reduce water exchange between Greenwich Bay and Narragansett Bay (Balt, 2014), contributing to recirculation and, often, poor water quality (Rogers, 2008; Spaulding and Swanson, 2008). Carbon stable isotope data from clam tissues support this observation, where clam tissues reflected a gradient of values in suspended particulate matter from east to west, across Greenwich Bay (Figure 1; Oczkowski et al., 2010). The δ15N values in clam shells from Greenwich Bay may reflect processes like respiration, as well as Providence area municipal sewage δ15 N values.
Tissue vs. Shell
To assess the potential for linking our shell-based nitrogen baseline with more recent measurements of isotopes in tissues and primary producers (e.g., food webs), we compared shell and tissue δ15N values when both were available. While the relationship between clam tissue and shell was statistically significant, it was not highly predictive. The significant, but weak correlation observed between clam tissues and shell appears to be driven by variability in the shell isotope values (Figure 4). The average offset of all available tissue-shell pairings was 1.13 ± 1.37‰ in the present study, but there were wide variations across stations and between sample years. These ratios are also consistent with ratios observed in a range of bivalve species and tissue types (O'Donnell et al., 2003; Carmichael and Kovacs, 2010). In other studies, however, shell δ15N has been found to be more highly predictive of tissue δ15N values (Carmichael et al., 2008; Kovacs et al., 2010), with variation relative to land use among sites greater than variation within sites. These studies, however, sampled bivalves during short periods of time in areas of typically little known change in land use during the period of study. In a system that has recently undergone major shifts in nutrient source abundance and δ15N signature, the range of δ15N values in bivalve shell may, at least in part, reflect this recent shift. For example, δ15N values in individual growth layers of bivalve shell can record wastewater plume entry to an estuary in the form of heavier δ15N values in subsequent growth layers during the life of a clam (Carmichael unpublished data). Because the turnover time for N in clam tissues is on the order of days to weeks (Carmichael et al., 2008), δ15N values in soft tissue will consistently reflect N in recently consumed foods. In contrast, N accumulated in shells during the life of the clam is not readily mobilized. Thus, the shell, when analyzed in its entirety, will reflect the mean values of N deposited over the life of the clam. This structural and metabolic difference between shell and soft tissues can result in larger than expected differences in δ15N values between shell and tissue in systems undergoing change and may explain the within site variation observed among recent shells (2005, 2015) in this study. Comparison of tissue δ15N values to only the outermost growing region of modern shell could reduce this source of variation. At this point, it is important to acknowledge the ecological uncertainty associated with using clam shell δ15N values to estimate specific pre-contact food web δ15N values for this region and dataset.
Conclusions
The δ15N values of N deposited in clam and oyster shells, during formation, and collected from historical middens provide useful insight into coastal nutrient dynamics over thousands of years. While such data are not stand-alone metrics of anthropogenic nitrogen inputs, they support evidence and hypotheses posited by others about the long history of N fertilization in Narragansett Bay (e.g., Nixon, 1997; Nixon et al., 2008), where shells harvested before European contact had lower δ15N values than those harvested more recently. We suggest that the pre-contact shell values represent a baseline from which to compare more recent shell values. Overall, our data support the premise that Narragansett Bay has been heavily and steadily enriched with nutrients for more than a hundred years (Nixon et al., 2008) and recent differences in δ15N values reflect changes in the source of the fertilization. In Narragansett Bay, where recent upgrades to sewage treatment plants have reduced effluent N concentrations, but increased the δ15N of the discharge (Schmidt, 2014), 2015 clams had higher δ15N values than those from 2005 and earlier. This study further illustrates the potential to apply these methods to document anthropogenic N inputs in coastal ecosystems.
Author Contributions
AO and AH developed the initial hypothesis, based on the methods developed and contributed by RC. TG, BC, and AO obtained and analyzed samples while AH conducted statistical analyses. AO, RC, and AH contributed to data analysis and all authors contributed to manuscript development.
Conflict of Interest Statement
The authors declare that the research was conducted in the absence of any commercial or financial relationships that could be construed as a potential conflict of interest.
Acknowledgments
We thank the Roger Williams Museum, the Public Archaeology Laboratory, the Rhode Island Department of Environmental Management, and in particular Jeff Mercer, as well as Kelly Henry and David Bernstein for the use of their shells. Further, we appreciate the efforts of Carolyn Kovacs and Elizabeth Darrow to help develop these methods. The manuscript was improved by feedback from Drs. Suzy Ayvazian, Rick McKinney, and Rich Pruell. This is ORD Tracking Number ORD-015462 of the Atlantic Ecology Division, National Health and Environmental Effects Research Laboratory, Office of Research and Development, U. S. Environmental Protection Agency. Although the research described in this article has been funded in part by the U.S. Environmental Protection Agency, it has not been subjected to Agency review. Therefore, it does not necessarily reflect the views of the Agency. Mention of trade names or commercial products does not constitute endorsement or recommendation for use.
References
Balt, C. (2014). Subestuarine Circulation and Dispersion in Narragansett Bay. Dissertation, University of Rhode Island, Kingston, RI.
Bergondo, D. L., Kester, D. R., Stoffel, H. E., and Woods, W. L. (2005). Time-series observations during the low sub-surface oxygen events in narragansett bay during summer 2001. Mar. Chem. 97, 90–103. doi: 10.1016/j.marchem.2005.01.006
Bernstein, D. J. (1987). Prehistoric Subsistence at Greenwich Cove, Rhode Island. Dissertation, State University of New York at Binghamton, Binghamton, NY.
Bernstein, D. J. (1990). Prehistoric seasonality studies in coastal southern new england. Am. Anthropol. 92, 96–115. doi: 10.1525/aa.1990.92.1.02a00070
Braun, D. P. (1974). Explanatory models for the evolution of coastal adaptation in prehistoric eastern new england. Am. Antiq. 39, 582–596. doi: 10.2307/278906
Bunn, S., Loneragan, N., and Kempster, M. (1995). Effects of acid washing on stable isotope ratios of C and N in penaeid shrimp and seagrass: implications for food-web studies using multiple stable isotopes. Limnol. Oceanogr. 40, 622–625. doi: 10.4319/lo.1995.40.3.0622
Carmichael, R. H., Hattenrath, T. K., Valiela, I., and Michener, R. H. (2008). Nitrogen stable isotopes in the shell of Mercenaria mercenaria trace wastewater inputs from watersheds to estuarine ecosystems. Aquat. Biol. 4, 99–111. doi: 10.3354/ab00106
Carmichael, R. H., and Kovacs, C. J. (2010). Comment on Watanabe et al. (2009). Mar. Pollut. Bull. 60, 314–315. doi: 10.1016/j.marpolbul.2009.11.001
Chaves, J. E. (2004). Potential Use of 15N to Assess Nitrogen Sources and Fate in Narragansett Bay. Dissertation, University of Rhode Island, Kingston, RI.
Codiga, D. L., Stoffel, H. E., Deacutis, C. F., Kiernan, S., and Oviatt, C. A. (2009). Narragansett bay hypoxic event characteristics based on fixed-site monitoring network time series: intermittency, geographic distribution, spatial synchronicity, and interannual variability. Estuar. Coasts 32, 621–641. doi: 10.1007/s12237-009-9165-9
Darrow, E. C. (2015). Biogeochemical and Microbial Indicators of Land-Use Change in a Northern Gulf of Mexico Estuary. Dissertation, University of South Alabama, Mobile, AL.
DeNiro, M. J. (1985). Postmortem preservation and alteration of in vivo bone collagen isotope ratios in relation to palaeodietary reconstruction. Nature 317, 806–809. doi: 10.1038/317806a0
Desbonnet, A., Kapka, T., Presley, F., Duhaime, R., Barrett, J., Klinger, J., et al. (1999). The Narrow River Special Area Management Plan. Available online at: http://www.crmc.ri.gov/regulations/SAMP_NarrowRiver.pdf
DiMilla, P. A. (2006). Using Stable Nitrogen Isotopes to Characterize and Evaluate Nitrogen Sources to Greenwich Bay, RI and their Influence on Isotopic Signatures in Estuarine Organisms. Master's thesis, University of Rhode Island, Kingston, RI.
DiMilla, P. A., Nixon, S. W., Oczkowski, A. J., Altabet, M. A., and McKinney, R. A. (2011). Some challenges of an “upside down” nitrogen budget–Science and management in greenwich bay, RI (USA). Mar. Pollut. Bull. 62, 672–680. doi: 10.1016/j.marpolbul.2011.01.031
Ernst, L. M. (1996). The Cumulative Impacts of Management Decisions on Nitrogen Loading to the Rhode Island Salt Ponds. Master's thesis, University of Rhode Island, Kingston, RI.
Fulweiler, R., Oczkowski, A., Miller, K., Oviatt, C., and Pilson, M. (2015). Whole truths vs. half truths–and a search for clarity in long-term water temperature records. Estuar. Coast. Shelf Sci. 157, A1–A6. doi: 10.1016/j.ecss.2015.01.021
Fulweiler, R. W., and Nixon, S. W. (2009). Responses of benthic-pelagic coupling to climate change in a temperate estuary. Hydrobiologia 629, 147–156. doi: 10.1007/s10750-009-9766-0
Garber, J. H. (1982). 15N-Tracer and Other Laboratory Studies of Nitrogen Remineralization in Sediments and Waters from Narragansett Bay, Rhode Island. Dissertation, University of Rhode Island, Kingston, RI.
Grupe, G., Balzer, A., and Turban-Just, S. (2002). Modeling protein diagenesis in ancient bone: towards a validation of stable isotope data, in Biogeochemical Approaches to Paleodietary Analysis, eds S. H. Ambrose and M. A. Katzenberg (New York, NY: Springer), 173–187.
Hare, P. E., Fogel, M. L., Stafford, T. W., Mitchell, A. D., and Hoering, T. C. (1991). The isotopic composition of carbon and nitrogen in individual amino acids isolated from modern and fossil proteins. J. Archaeol. Sci. 18, 277–292. doi: 10.1016/0305-4403(91)90066-X
Henry, K. M. (2007). Understanding Environmental Influences on the Growth Pattern and Growth Rate of the Hard Clam, Mercenaria mercenaria, in Narragansett Bay, Rhode Island (USA), University of Rhode Island. Master's thesis, University of Rhode Island, Kingston, RI.
Hooker, T. D., and Compton, J. E. (2003). Forest ecosystem carbon and nitrogen accumulation during the first century after agricultural abandonment. Ecol. Appl. 13, 299–313. doi: 10.1890/1051-0761(2003)013[0299:FECANA]2.0.CO;2
King, J. W., Hubeny, J. B., Gibson, C. L., Laliberte, E., Ford, K. H., Cantwell, M., et al. (2008). Anthropogenic eutrophication of narragansett bay: evidence from dated sediment cores, in Science for Ecosystem-Based Management, eds A. Desbonnet and B. A. Costa-Pierce (New York, NY: Springer), 211–232.
Kovacs, C. J., Daskin, J. H., Patterson, H., and Carmichael, R. H. (2010). Crassostrea virginica shells record local variation in wastewater inputs to a coastal estuary. Aquat. Biol. 9, 77–84. doi: 10.3354/ab00228
Krumholz, J. S. (2012). Spatial and Temporal Patterns in Nutrient Standing Stock and Mass-Balance in Response to Load Reductions in a Temperate Estuary, University of Rhode Island. Dissertation, University of Rhode Island, Kingston, RI.
Larsen, C. S., Schoeninger, M. J., van der Merwe, N. J., Moore, K. M., and Lee-Thorp, J. A. (1992). Carbon and nitrogen stable isotopic signatures of human dietary change in the Georgia Bight. Am. J. Phys. Anthropol. 89, 197–214. doi: 10.1002/ajpa.1330890206
Nixon, S., Ammerman, J., Atkinson, L., Berounsky, V., Billen, G., Boicourt, W., et al. (1996). The fate of nitrogen and phosphorus at the land-sea margin of the North Atlantic Ocean. Biogeochemistry 35, 141–180. doi: 10.1007/BF02179826
Nixon, S. W. (1995). Metal Inputs to Narragansett Bay: A History and Assessment of Recent Conditions, 109. Narragansett, RI: Rhode Island Sea Grant.
Nixon, S. W. (1997). Prehistoric nutrient inputs and productivity in narragansett bay. Estuaries 20, 253–261. doi: 10.2307/1352341
Nixon, S. W., Buckley, B. A., Granger, S. L., Harris, L. A., Oczkowski, A. J., Fulweiler, R. W., et al. (2008). Nitrogen and phosphorus inputs to narragansett bay: past, present, and future, in Science for Ecosystem-Based Management, eds A. Desbonnet and B. A. Costa-Pierce (Springer), 101–175.
Oczkowski, A., McKinney, R., Ayvazian, S., Hanson, A., Wigand, C., and Markham, E. (2015). Preliminary evidence for the amplification of global warming in shallow, intertidal estuarine waters. PLoS ONE 10:e0141529. doi: 10.1371/journal.pone.0141529
Oczkowski, A., Nixon, S., Henry, K., DiMilla, P., Pilson, M., Granger, S., et al. (2008). Distribution and trophic importance of anthropogenic nitrogen in Narragansett Bay: an assessment using stable isotopes. Estuar. Coasts 31, 53–69. doi: 10.1007/s12237-007-9029-0
Oczkowski, A. J., Pilson, M. E., and Nixon, S. W. (2010). A marked gradient in δ13C values of clams Mercenaria mercenaria across a marine embayment may reflect variations in ecosystem metabolism. Mar. Ecol. Prog. Ser. 414, 145–153. doi: 10.3354/meps08737
O'Donnell, T. H., Macko, S. A., Chou, J., Davis-Hartten, K. L., and Wehmiller, J. F. (2003). Analysis of δ13C, δ15N, and δ34S in organic matter from the biominerals of modern and fossil Mercenaria spp. Org. Geochem. 34, 165–183. doi: 10.1016/S0146-6380(02)00160-2
Patterson, H. K. (2014). Dissolved Oxygen Stress on the Eastern Oyster, Crassostrea Virginica: Implications for Physiology, Management and Restoration Efforts. Dissertation, University of South Alabama, Mobile, AL.
Pilson, M. E. (2008). Narragansett Bay amidst a globally changing climate, in Science for Ecosystem-based Management, eds A. Desbonnet and B. A. Costa-Pierce (New York, NY: Springer), 35–46.
Pruell, R. J., and Taplin, B. K. (2015). Carbon and nitrogen isotope ratios of juvenile winter flounder as indicators of inputs to estuarine systems. Mar. Pollut. Bull. 101, 624–631. doi: 10.1016/j.marpolbul.2015.10.037
Risk, M. J., Sayer, B. G., Tevesz, M. J. S., and Karr, C. D. (1996). Comparison of the organic matrix of fossil and recent bivalve shells. Lethaia 29, 197–202. doi: 10.1111/j.1502-3931.1996.tb01876.x
Rogers, J. M. (2008). Circulation and Transport in Upper Narragansett Bay, University of Rhode Island. Master's thesis, University of Rhode Island, Kingston, RI.
Ryba, S. A., and Burgess, R. M. (2002). Effects of sample preparation on the measurement of organic carbon, hydrogen, nitrogen, sulfur, and oxygen concentrations in marine sediments. Chemosphere 48, 139–147. doi: 10.1016/S0045-6535(02)00027-9
Schmidt, C. E. (2014). Investigation of Nitrogen Cycling Using Stable Nitrogen and Oxygen Isotopes in Narragansett Bay, RI. Dissertation, University of Rhode Island, Kingston, RI.
Schmidt, C. E., Robinson, R. S., Fields, L., and Nixon, S. W. (2016). Changes to nitrate isotopic composition of wastewater treatment effluent and rivers after upgrades to tertiary treatment in the narragansett bay watershed, RI. Mar. Pollut. Bull. 104, 61–69. doi: 10.1016/j.marpolbul.2016.02.010
Schmidt-Schultz, T. H., and Schultz, M. (2004). Bone protects proteins over thousands of years: extraction, analysis, and interpretation of extracellular matrix proteins in archeological skeletal remains. Am. J. Phys. Anthropol. 123, 30–39. doi: 10.1002/ajpa.10308
Spaulding, M. L., and Swanson, C. (2008). Circulation and transport dynamics in narragansett bay, in Science for Ecosystem-Based Management, eds A. Desbonnet and B. A. Costa-Pierce (New York, NY: Springer), 233–279.
Wroth, L. C. (1970). The Voyages of Giovanni da Verrazano 1524-28. New Haven, CT: Pierpont Morgan Library.
Keywords: shell, nitrogen, stable isotope, midden, Mercenaria mercenaria, Crassostrea virginica
Citation: Oczkowski A, Gumbley T, Carter B, Carmichael R and Humphries A (2016) Establishing an Anthropogenic Nitrogen Baseline Using Native American Shell Middens. Front. Mar. Sci. 3:79. doi: 10.3389/fmars.2016.00079
Received: 19 February 2016; Accepted: 12 May 2016;
Published: 27 May 2016.
Edited by:
Alberto Basset, University of Salento, ItalyReviewed by:
Jose M. Riascos, Universidad del Valle, ColombiaPaolo Magni, National Research Council of Italy, Italy
Copyright © 2016 Oczkowski, Gumbley, Carter, Carmichael and Humphries. This is an open-access article distributed under the terms of the Creative Commons Attribution License (CC BY). The use, distribution or reproduction in other forums is permitted, provided the original author(s) or licensor are credited and that the original publication in this journal is cited, in accordance with accepted academic practice. No use, distribution or reproduction is permitted which does not comply with these terms.
*Correspondence: Autumn Oczkowski, oczkowski.autumn@epa.gov