Fe- and Cu-Complex Formation with Artificial Ligands Investigated by Ultra-High Resolution Fourier-Transform ion Cyclotron Resonance Mass Spectrometry (FT-ICR-MS): Implications for Natural Metal-Organic Complex Studies
 Hannelore Waska
 Andrea Koschinsky
 Thorsten Dittmar
- 1Research Group for Marine Geochemistry (ICBM-MPI Bridging Group), Institute for Chemistry and Biology of the Marine Environment (ICBM), Carl von Ossietzky University Oldenburg, Oldenburg, Germany
- 2Department of Physics and Earth Sciences, Jacobs University Bremen, Bremen, Germany
In recent years, electrospray-ionization mass spectrometry (ESI-MS) has been increasingly used to complement the bulk determination of metal-ligand equilibria, for example via competitive ligand exchange-adsorptive cathodic stripping voltammetry (CLE-ACSV). However, ESI-MS speciation analyses may be impacted by instrumental artifacts such as reduction reactions, fragmentation, and adduct formation at the ESI source, changes in the ionization efficiencies of the detected species in relation to sample matrix, and peak overlaps in response to increasing sample complexity. In our study, equilibria of the known artificial ligands citrate, ethylenediaminetetraacetic acid (EDTA), 1-nitroso-2-naphthol (NN), and salicylaldoxime (SA) with iron (Fe) and copper (Cu) were investigated by ultra-high resolution ESI-MS, Fourier-transform ion cyclotron resonance mass spectrometry (FT-ICR-MS), under a variety of sample matrix and ionization settings. The acquired mass spectra were compared with metal-ligand equilibrium data from the literature as well as an adapted speciation model. Overall, the mass spectra produced representative species mentioned in previous reports and predicted by the speciation calculations, such as Fe(Cit), Cu(Cit)2, Fe(EDTA), Cu(EDTA), Fe(NN)3, and Cu(SA)2. The analyses furthermore revealed new species which had been hypothesized but not measured directly using other methods, for example ternary complexes of citrate with Fe and Cu, Cu(SA) monomers, and the dimer Fe(SA)2. Finally, parallel measurements of a Cu+SA calibration series and a Cu+SA+EDTA competition series indicated that FT-ICR-MS can produce linear responses and low detection limits analogous to those of ACSV. We propose that ultra-high resolution FT-ICR-MS can be used as a representative tool to study interactions of trace metals with artificial as well as natural, unknown ligands at the molecular level.
Introduction
Electrospray-ionization mass spectrometry (ESI-MS) has become a promising new technique for the description of metal-ligand equilibria using known ligands. The advantage of ESI-MS resides in its easy application—samples in solution can be swiftly processed under a wide array of conditions—and its soft ionization procedure which allows for the detection of whole metal-organic compounds (Di Marco and Bombi, 2006). The ESI-MS measurements of known metal-ligand mixtures can be compared with speciation data acquired from other methods such as computational speciation modeling, crystallography, or complex affinity titrations. For example, the complexing behavior of citrate, an important natural metal chelator which forms highly diverse species with iron under different pH and stoichiometry conditions, has been studied by ESI-MS in comparison with complementary techniques, such as spectrophotometric titrations and chemical modeling (Gautier-Luneau et al., 2005; Nischwitz and Michalke, 2009; Silva et al., 2009; Bertoli et al., 2015). In parallel to these studies on artificial metal-organic compounds under well-constrained conditions, ESI-MS has recently been applied to identify unknown metal-binding ligands isolated from natural waters, which ubiquitously occur as a component of natural dissolved organic matter (DOM), and which govern the mobility and availability of bioactive trace metals such as iron (Fe) and copper (Cu) (McCormack et al., 2003; Ross et al., 2003; Mawji et al., 2008, 2011; Stenson, 2009; Velasquez et al., 2011). Although the number of studies in the field is scarce, they have shown that ESI-MS is currently the only technique with the potential to study a large number of metal-organic complexes simultaneously at the molecular level: ESI-MS and in particular ESI-FT-ICR-MS (Electrospray-ionization Fourier-transform ion cyclotron resonance mass spectrometry) are capable of resolving the high complexity of DOM, where thousands of unique compounds occur at pico- to nanomolar concentrations (Repeta, 2015). As such, they complement one of the most wide-spread methods currently applied to characterize the bulk metal-binding capacity of natural DOM, competitive ligand exchange-adsorptive cathodic stripping voltammetry (CLE-ACSV, Buck and Bruland, 2005; Buck et al., 2007). CLE-ACSV is highly sensitive (detection limits are usually at pico- to nanomolar levels), quantitative, and metal-ligand speciation can be investigated at near-natural conditions with regards to pH and sample matrix (including ionic strength). However, the high complexity of DOM is not sufficiently represented in CLE-ACSV measurements, even though metal-binding ligands within DOM are treated as a composite of multiple sub-classes defined by the analytical window (i.e., the amount of added artificial ligand for competition with the natural ligands). Furthermore, the natural ligands are investigated based on the response of the added competing artificial ligand, rather than by direct observation of their behavior. ESI-MS, and in particular high-resolution ESI-FT-ICR-MS, thus holds great potential to extend this field of research (Waska et al., 2015).
To complement CLE-ACSV by ESI-MS and ESI-FT-ICR-MS, potential instrument-specific artifacts of the ESI-MS technique have to be taken into account (Di Marco and Bombi, 2006; Keith-Roach, 2010; Waska et al., 2015). Examples for such effects are:
(1) Speciation changes of the sample, for example through reduction, adduct formation, and fragmentation at the ESI source or in the gas phase can impact metal-ligand equilibria and prevent the detection of target molecules.
(2) Signal intensities of the different species are affected by their net charge in aqueous solutions, but also by compound specific response factors influenced by ionization mode and sample matrix (for example, the presence of other ions causing signal enhancement or suppression).
(3) Sample requirements for the optimum performance of the instrument, such as low ionic strengths, and the addition of organic solvents for ionization enhancement, may prevent quantitative and qualitative comparisons of in vitro metal-ligand equilibria with those taking place in natural aqueous environments.
All of the above mentioned issues have been known for a while (Di Marco and Bombi, 2006), but only in recent years, systematic, and compound-specific investigations have been increasingly used to evaluate ESI-MS as a quantitative tool in metal-ligand equilibrium studies (Gledhill, 2001; Rellán-Álvarez et al., 2008; Keith-Roach, 2010; Reinoso-Maset et al., 2012). In this study, we aim to address the above mentioned analytical challenges, and report the applicability of ultra-high resolution ESI-FT-ICR-MS for the qualitative and quantitative investigation of metal-ligand equilibria. ESI-FT-ICR-MS is traditionally used to resolve complex mixtures of organic compounds such as natural DOM (Koch et al., 2005). Organic compounds show linear responses in FT-ICR-MS based on their relative abundance in a complex matrix (Seidel et al., 2015), but this approach is rarely used for quantitative studies of known target compounds in natural DOM. Compared to ESI-MS systems with lesser resolving power, the employment of ESI-FT-ICR-MS provides a higher degree of certainty in the detection of monoisotopic mass differences of metal-containing complexes (Waska et al., 2015), and furthermore enables the automatized assignment of molecular formulae based on the Kendrick mass defect (Koch et al., 2007). Both these advantages result in a swifter and more accurate detection of target compounds in known metal-ligand equilibria, and provide the additional opportunity to identify unknown molecules in complex natural mixtures such as DOM.
For our study, we chose two experimental approaches:
(1) A baseline study of well-known metal-organic complexes in a fixed metal-ligand stoichiometry at fixed pH under different sample matrix and ionization conditions. The resulting qualitative speciation patterns and response factors were compared with speciation data from the literature.
(2) A quantitative study where a known artificial ligand was titrated with increasing metal concentrations, once in the absence and once in the presence of another known competing ligand analogous to a CLE-ACSV calibration series. The resulting calibration curves were compared to the results of simultaneous CLE-ACSV measurements of the same sample setup.
The experimental approaches were backed up by metal-ligand speciation calculations using the modeling program PHREEQC (PHREEQC for Windows, version 2.18.00, http://wwwbrr.cr.usgs.gov/projects/GWC_coupled/phreeqc/) with a default minteqv4 database designed to predict metal-ligand speciation in aqueous solutions. This database already included several known ligands, and was extended in the scope of this study to accommodate all investigated artificial ligands, by using conditional stability constants from the literature (e.g., Gledhill and van den Berg, 1994; Abualhaija et al., 2015).
The focus of our study lays on Fe - and Cu- complexes due to their bioactive nature and high affinity for organic ligands (Van den Berg, 1984; Rue and Bruland, 1995; Buck and Bruland, 2005; Buck et al., 2007). For the qualitative study, we chose a representative range of previously described ligands with different functional groups, binding stoichiometries, and binding strengths (Table 1): Citrate is a naturally occurring, physiologically important metal chelator which has been studied in-depth by ESI-MS and other speciation methods (Gautier-Luneau et al., 2005; Nischwitz and Michalke, 2009; Silva et al., 2009; Bertoli et al., 2015). Because it is a tricarboxylate chelator with an additional binding hydroxyl group, it could be seen as a representative of natural DOM which is largely composed of CxHyOz compounds and also contains a high density of carboxyl and hydroxyl functional groups as revealed by NMR analyses (Hertkorn et al., 2006; Repeta, 2015). EDTA, an artificial ligand produced for industrial and pharmaceutical applications, has gained recent interest due to its accumulation in the aquatic environment, where it impacts trace metal mobility (Nowack, 2002). It is a hexadentate ligand with two amine and four carboxylate functional groups and forms strong 1:1 or 1:2 complexes with transition metals and other cations (Chen et al., 2008; Reinoso-Maset et al., 2012). 1-nitroso-2-naphthol (hereafter referred to as NN) is a hydrophobic metal chelator with a nitroso- and a hydroxyl group. Due to its ability to form strong, electroactive 1:3 complexes with Fe it is used for the determination of free (Van den Berg et al., 1991) and organically bound (Wu and Luther, 1995; Hawkes et al., 2013) Fe in natural water samples via adsorptive cathodic stripping voltammetry (ACSV) and CLE-ACSV, respectively. Salicylaldoxime (SA), a salicylaldehyde oxime, is a chelator with an oxime and a hydroxyl functional group which forms 1:1 and 1:2 complexes with Cu and Fe, and is routinely used in the determination of Fe- and Cu-complexing capacities of DOM in natural water samples via CLE-ACSV (Campos and van den Berg, 1994; Rue and Bruland, 1995). For the quantitative study, we chose an SA-EDTA ligand system competing for Cu. This system has been extensively studied by CLE-ACSV under variations of matrix conditions such as pH and ionic strength (Campos and van den Berg, 1994; Buck and Bruland, 2005).
Table 1. Properties of investigated ligands.
To the best of our knowledge, NN and SA have not been studied in detail by ESI-MS, and none of the abovementioned ligands have been investigated by ultra-high resolution ESI-FT-ICR-MS (Di Marco and Bombi, 2006; Keith-Roach, 2010). Our study thus lays the foundation to describing the natural metal-DOM pool with two contrasting and complementary techniques (CLE-ACSV and ESI-FT-ICR-MS) in the future.
Materials and Methods
Sample Preparation
Baseline Setup
We produced a series of metal-ligand complex solutions by adding NIST traceable Fe and Cu standards (Alfa Aesar plasma standard solutions, original stock solutions in 5% HNO3, diluted in 0.01 M HCl suprapur for this study) to solutions of citrate (mono-sodium citrate, AppliChem), EDTA (EDTA tripotassium salt dihydrate, AppliChem), NN (1-nitroso-2-naphthol, 99%, Alfa Aesar), and SA (salicylaldoxime ≥98%, Sigma Aldrich; Table 1). With the exception of NN, which was prepared using Optima LC-MS grade methanol (Fisher Chemicals), all ligand solutions were prepared with ultrapure water. The final metal-ligand solutions amounted to 20 μM metal (10 μM Fe and 10 μM Cu) and 100 μM ligand, producing a theoretical metal:ligand stoichiometry of 1:5 each. We chose this stoichiometry to provide sufficient ligands for both trace metals, thus preventing competition for binding sites and enabling simultaneous detection of free ligands as well as Fe- and Cu-complexes. The pH of the solutions was adjusted to pH = 7.1 ± 0.2 in two setups using either sodium hydroxide or aqueous ammonia (both suprapur, Merck) and they were equilibrated overnight (>12 h) at room temperature. Thereafter, methanol (Optima LC-MS grade, Fisher Chemicals) was added to one set of solutions to produce a 1:1 methanol-water matrix, whereas the second set was kept in a water matrix. Both setups amounted to the same final ligand and trace metals concentrations. All solutions were filtered through 0.2 μm PTFE syringe filters prior to measurement.
Quantitative Setup
First, a calibration series was made by titrating increasing amounts of Cu (0–20 μM) to a constant amount of SA (200 μM) in 15 mL polytetrafluorethylene (PTFE) vials (VWR). The pH of the calibration solutions was adjusted to pH = 7.5 ± 0.2 using sodium hydroxide. Subsamples were filtered through 0.2 μm PFTE syringe filters into acid-washed 2 mL Eppendorf safe-lock tubes, and Optima-grade methanol was added to each vial to produce a 1:1 (v:v) sample solution for FT-ICR-MS analysis. In a second treatment, we added 2 μM EDTA to each vessel of the same SA-Cu titration setup (0–20 μM Cu, 200 μM SA), and the samples were allowed to equilibrate overnight. Again, subsamples of the solutions were filtered into pre-cleaned safe-lock tubes and methanol was added prior to FT-ICR-MS measurements to produce a 1:1 (v:v) solution. The dilution with methanol resulted in final concentrations of 100 μM SA, 1 μM EDTA, and 0–10 μM Cu. Both setups (Cu + SA or Cu + EDTA + SA) were reproduced three times with the used reagent solutions being discarded after overnight equilibration, to condition all reaction vessels (PTFE and Eppendorf vials) before final sample preparations for the FT-ICR-MS measurement.
FT-ICR-MS Analyses
The artificial metal-ligand solutions were analyzed in duplicates (qualitative setup) and triplicates (quantitative setup) on an ultra-high resolution 15Tesla ESI-FT-ICR-MS (SolariX, Bruker Daltonics). All sample measurements were conducted in positive and negative ionization mode to compare speciation and ionization efficiencies of the complexes under the experimental pH and solvent settings. The measurement parameters were adapted from in-house tuning procedures commonly used for DOM analyses, in broadband scan mode with a syringe flow rate of 120 μL h−1 and an ion accumulation time of 0.20 s for negative and 0.25 s for positive ionization mode. For each sample, 100 mass scans were accumulated. Calibration was conducted internally using the Bruker DataAnalysis software with an error of <0.1 ppm, based on a specifically created mass list containing the calculated monoisotopic masses of the most dominant free ligands and complexes (Compass IsotopePattern, Bruker Daltonics), as well as known contaminations commonly found in ESI-MS spectra, such as fatty acids (Keller et al., 2008). The calibrated mass spectra were assembled to a common data table using a mass matching in-house Matlab script. To ensure reproducibility of the detected compounds and remove any noise, any detected mass had to occur in all replicate measurements of each setup to be considered for further data processing. Additionally, the acquired mass lists were processed with a Matlab search routine detecting 54∕56Fe, 63∕65Cu, 35∕37Cl, 12∕13C, and 39∕41K monoisotopic patterns based on the mass and abundance differences of the naturally occurring isotopes (Waska et al., 2015). This search routine was modified to detect peaks for up to three elements per molecule (54∕56Fe, 63∕65Cu, 35∕37Cl), and multiple ionization patterns (12∕13C). Thereafter, molecular formulae were assigned with the DataAnalysis software. A maximum mass error of 0.5 ppm was allowed, and the elements C1−50 H1−200 O1−100 N0−6 Fe0−3 Cu0−3 Na0−5 Cl0−5 were considered, allowing evenand odd electron configurations where applicable (radicals with free electrons were not considered). Since EDTA had been added as potassium salt, K0−5 was included for the assignment of molecular formulae in the EDTA samples to account for potassium adducts. Only molecular formulas containing the molecular building blocks of the measured ligand (for example, C6 and O7 and their multiples for citrate) with a matching isotope pattern (12∕13C plus the corresponding heteroatoms of the calculated molecular formulae) were taken into account. Thus, fragmented complexes or compounds with adducts other than , Na+, K+, and Cl− were not included.
CLE-ACSV Analyses
The Cu + SA ± EDTA titration setups were diluted 1:50 (Cu + SA only) and 1:25 (Cu + SA + EDTA) with ultrapure water and measured by ACSV (Campos and van den Berg, 1994; Waska et al., 2015). Immediately before the measurements, 100 μL of 3M KCl suprapur and 100 μL chelexed HEPES buffer (pH = 7.8) were added. The final solutions had a volume of 10 mL. Addition of KCl and HEPES buffer were included to (i) ensure enough ionic strength for the voltammetric cell, and (ii) achieve a stable pH for a reproducible location (and thus sensitivity) of the Cu-SA peak in the potential-current diagram. The instrument used was a Metrohm 757VA Computrace equipped with a hanging drop mercury electrode (HDME), a 3M KCl-filled reference electrode and a glassy carbon counter electrode. Samples were initially purged for 300 s with high purity Ar gas, then the salicylaldoxime–copper complex was deposited for 60 s at a potential of −50 mV. After an equilibration time of 5 s, the samples were scanned from −50 to −600 mV at a sweep rate of 20 mV s-1. The measurement of each sample was repeated three times.
Speciation Calculations using PHREEQC
To predict ligand and metals speciation, thermodynamic equilibrium calculations were performed using the aqueous geochemical modeling program PHREEQC (Parkhurst and Appelo, 1999) with a minteqv4 database already containing conditional stability constants of EDTA and citrate with a variety of cations including Fe and Cu. Conditional stability constants were implemented into the minteqv4 database as follows: The conditional stability constant (logK) for Cu(NN)2was used directly from Sathe and Shetty (1970), whereas for Fe(NN)3, Cu(SA), Cu(SA)2, Fe(SA), and Fe(SA)2, logK' values were adjusted for an approximation of salinity ~0 (salinity = 1 × 10⁻⁵) using the respective equations reported by Gledhill and van den Berg (1994) and Abualhaija et al. (2015) (Table 1). To calculate activity coefficients, by default a Davies equation was used by the program. The modified database is provided as Supplementary Information. Sample solutions for the calculations contained the adjusted pH and known added concentrations of Fe, Cu, and ligands. Only Fe(III) and Cu(II) were considered in the calculations, which were the main expected oxidation states of the NIST traceable standard solutions originally provided from Alfa Aesar in 5% HNO3. For oxygen and inorganic carbon contents, default concentrations of 64.5 and 0.49 μM, respectively, were incorporated from the PHREEQC examples database. Concentrations of K and Na corresponded to the added amounts of EDTA and citrate salts, respectively. In addition, concentrations of Cl, Na, and N(-3) corresponded to the added amounts of HCl (via the Fe and Cu spikes), NaOH, and aqueous ammonia (during pH adjustments). Because minteqv4 was created for aqueous solutions, the methanol content was not taken into account for the speciation calculations. This and other limitations of the speciation model (for instance, lack of data for complexes with yet unknown stoichiometries, metal valences, or cations such as Na+ and K+) may have impacted the outcome and should thus be kept in mind when considering the subsequent interpretations.
Results
Speciation Patterns of the Target Compounds
In both ionization modes, the mass spectra of the investigated metal-ligand solutions were comprised mostly (86–90%) of singly ionized target compounds as revealed by the single charge 12∕13C isotope patterns opposed to those with double (9–14%) or triple (1–2%) charge. Moreover, all of the detected metal-ligand complexes were singly charged as well (Tables 2–5). The high mass resolution allowed the confirmation of the majority of the target compounds based on their unique isotopic patterns. For example, in negative ionization mode, the isotope mass differences of the detected complexes were (average of >10 measurements ± standard deviation): 54∕56Fe (1.995329 ± 0.00003 Da, natural difference: 1.995327 Da), 63∕65Cu (1.998198 ± 0.000006 Da, natural difference: 1.99819 Da), 35∕37Cl (1.99705 ± 0.00003 Da, natural difference: 1.99705 Da), 12∕13C (1.00337 ± 0.00002 Da, natural difference: 1.00336 Da), and 39∕41K (1.99824 ± 0.0002 Da, natural difference: 1.99812 Da). It should be noted that in complexes with a co-occurrence of K and Cu (found only in the solutions with EDTA), the isotope patterns of the two elements could not be resolved from each other due to their similar mass spacing: The overlap of the 65Cu and 41K signals changed the signal intensities of the apparent isotopologues, and prevented detection by the automated Matlab script.
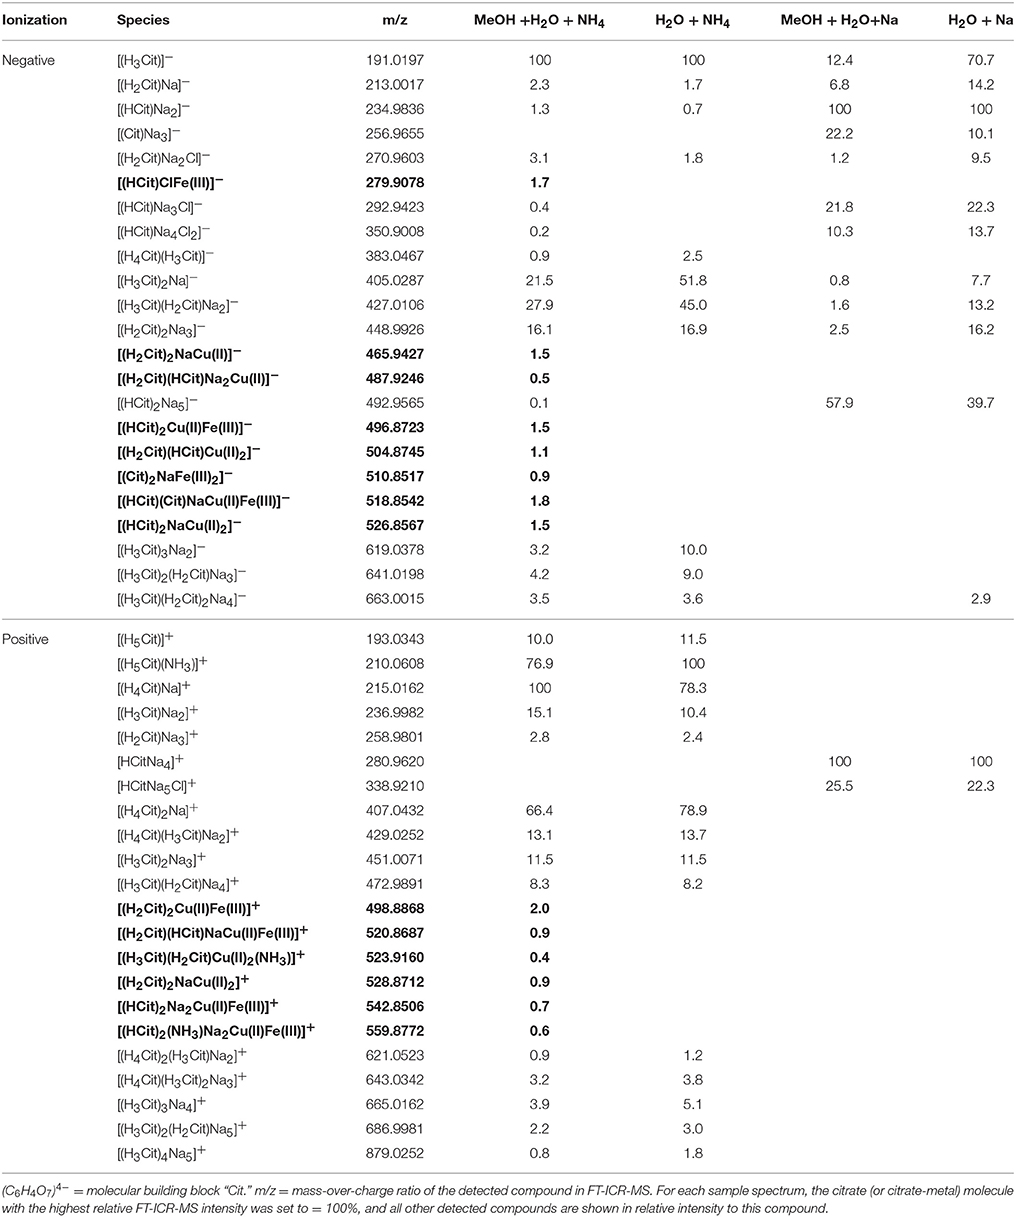
Table 2. Detected citrate and citrate ± Fe ± Cu species (bold) in the four analytical setups at the FT-ICR-MS.
For all investigated ligands and both ionization modes, adduct formation was observed: The dominant adduct was Na+, followed by K+ (only for EDTA measurement setups) and Cl−. Despite addition of aq. ammonia for pH adjustment in half of the experimental setups, adducts were rarely found (Tables 2–5). In contrast to the numerous adduct-containing compounds detected via FT-ICR-MS, PHREEQC results had predicted that > 99% of Na+, K+, and Cl− occurred as free ions in aqueous solution, while unbound ligand species differed only in their degree of protonation by free H+ ions. Only sodium citrate species were calculated to occur in non-negligible amounts (732 nM), and only for the sample setup with NaOH as added base.
In the mass spectra, citrate compounds were mostly detected as mono-, di-, and trimers (Table 2), while mono- and dimers prevailed in the PHREEQC calculations. Three out of the four complexes predicted by the speciation calculations also occurred in the FT-ICR-MS spectra: a Fe(Cit) monomer, a Cu(Cit)2 dimer, and a Cu2(Cit)2 dimer. A Cu(Cit) monomer predicted by PHREEQC was not detected in the mass spectra; instead, a 2:2 (metal:ligand) complex of Fe with citrate, and a ternary 2:2 complex of Fe and Cu with citrate, were found (Table 2). FT-ICR-MS and PREEQC speciation results also overall agreed for the EDTA setups: Mostly monomers occurred, and Fe and Cu were exclusively complexed in 1:1 stoichiometries as well (Figure 1, Table 3). Although most detected metal-EDTA complexes in the mass spectra were with Fe(III) and Cu(II), three reduced Fe(II) complexes [(HEDTA)Fe(II)]− (m/z = 345.0026), [(EDTA)KFe(II)]− (m/z = 382.9585), and [(H2EDTA)(NH3)Fe(II)]+ (m/z = 363.0361) occurred with small intensities (Table 3). NN generally occurred as mono- to trimers in negative, and mono- to pentamers in positive ionization mode. The Cu-NN ratio in the detected complexes was 1:2, while Fe was complexed by NN in 1:3, 1:4, and 1:5 stoichiometries. In negative ionization mode, these metal-NN complexes exclusively contained reduced Fe(II) and Cu(I), while in positive mode, Fe(III)(NN)3 and Cu(II)(NN)2 complexes were also detected (Table 4). In comparison, the speciation models predicted the occurrence of free NN exclusively as monomers, while for Fe and Cu, only the 1:3 and 1:2 stoichiometries, respectively, were calculated. Finally, all Cu and Fe were calculated in PHREEQC to be bound to SA in both 1:1 and 1:2 stoichiometries, and free SA was predicted to occur as monomer. Analogous to citrate, free SA also occurred in trimers in addition to the predicted mono-, and dimers in the mass spectra. It was bound to Fe in 1:1 and 1:2, and to Cu in 1:1, 1:2, and 1:3 stoichiometries. Both Cu(I) and Cu(II) were involved in the 1:1 complex formation with SA, while Fe was bound as Fe(III) (Table 5).
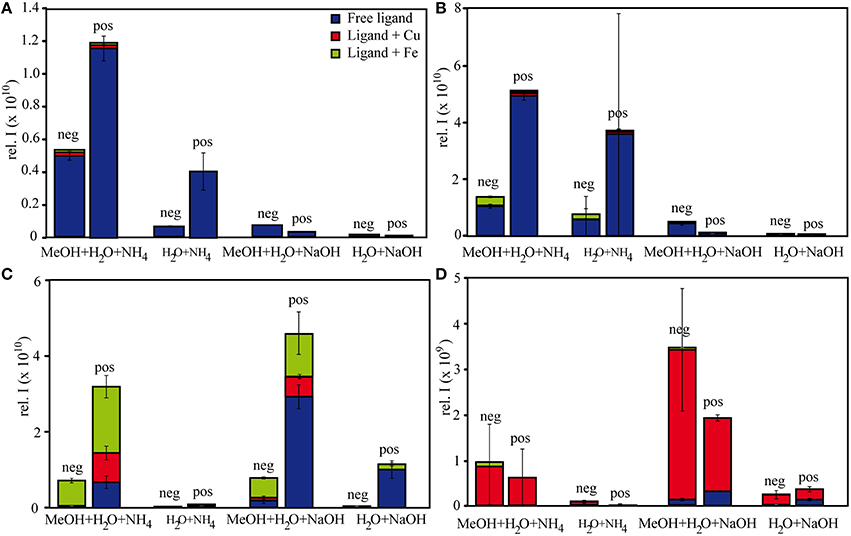
Figure 1. Relative intensities of free and complexed (A) citrate, (B) EDTA, (C) NN, and (D) SA under different measurement settings. The relative intensities of each of the subgroups (free ligand, Fe-ligand, Cu-ligand) are calculated as the sum of all intensities of the detected species in the subgroup.
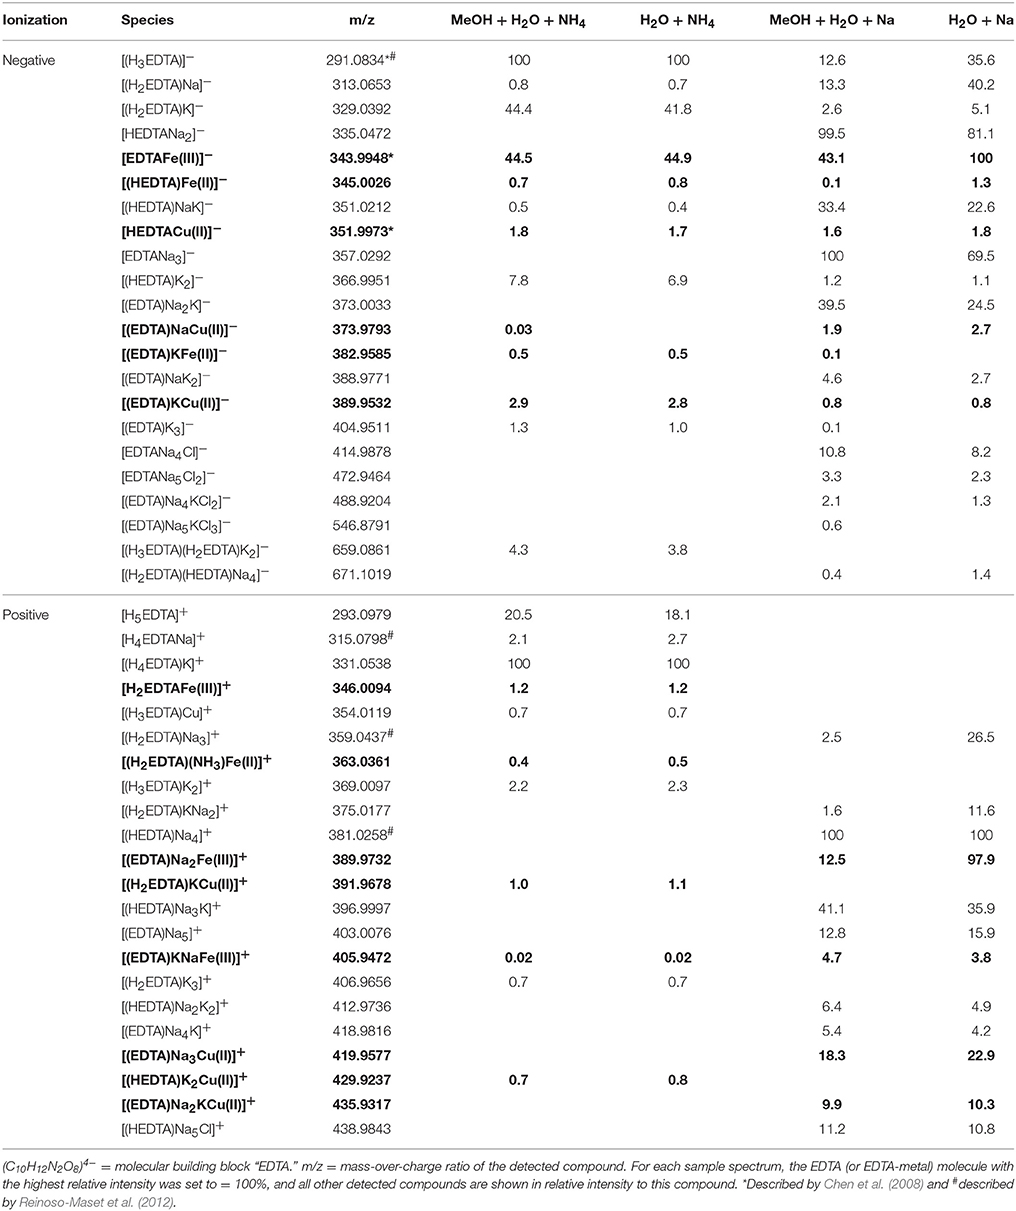
Table 3. Detected EDTA and EDTA ± Fe ± Cu species (bold) in the four analytical setups at the FT-ICR-MS.
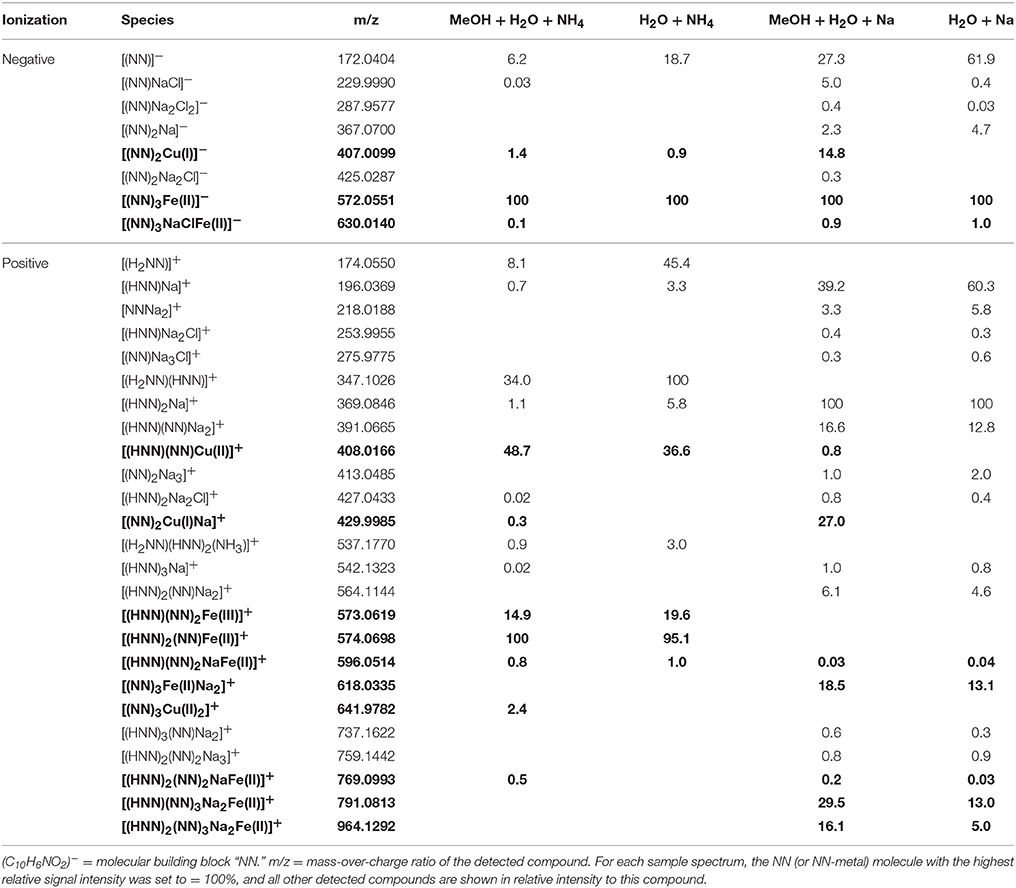
Table 4. Detected NN and NN ± Fe ± Cu species (bold) in the four analytical setups at the FT-ICR-MS.
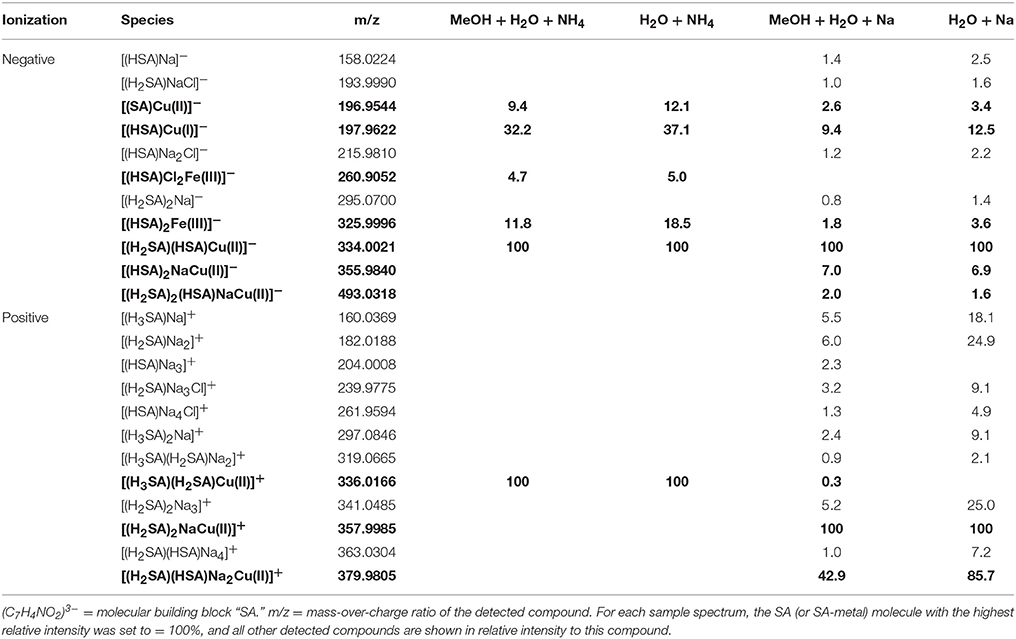
Table 5. Detected SA and SA ± Fe ± Cu species (bold) in the four analytical setups in FT-ICR-MS.
Relative Abundances of the Target Compounds
The relative FT-ICR-MS signal intensities of the target species were generally highest when methanol was present in the samples (Figure 1). In sum, citrate and EDTA compounds had their highest intensities in positive ionization mode when aq. ammonia was the added base. Contrastingly, the NN compounds had highest (total) signal intensities in positive ionization mode after sodium hydroxide additions, and SA compounds had highest signal intensities with sodium hydroxide addition and measurement in negative ionization mode. The citrate speciation patterns were dominated by free uncomplexed ligands, both in relative intensity and number of detected species, particularly in positive ionization mode (Figure 1). In comparison, all detected metal-citrate complexes had much lower intensities and were only found in the samples with methanol + water and aq. ammonia, albeit in both ionization modes (Table 2). The abundance patterns found in the mass spectra are in line with the PHREEQC-based speciation patterns for citrate, with uncomplexed citrate accounting for the highest concentrations (88 μM), Cu-citrate species contributing the second largest amount (10 μM), and Fe citrate species contributing the least (1.3 μM). Similar to citrate, the EDTA compounds detected in the mass spectra had the highest signal intensities in the samples with methanol + water and aq. ammonia compared to those samples with sodium hydroxide. Overall highest intensities were found for the free uncomplexed EDTA, particularly in positive ionization mode, again as predicted by the PHREEQC calculations (80 μM uncomplexed EDTA; Table 3). However, Fe was calculated to be complexed with EDTA at slightly lower concentrations than Cu (8 and 10 μM, respectively), while the relative intensities of the detected species in the mass spectra decreased in the order EDTA > Fe(EDTA) > Cu(EDTA). This trend was consistent for all measurement settings, although a tendency of a relative Fe-EDTA decrease with relative Cu-EDTA increase was observed from negative to positive mode (Figure 1). Like EDTA and citrate, the NN and metal-NN compounds detected in the mass spectra had generally higher signal intensities in positive compared to negative ionization mode. In contrast to citrate and EDTA, only the relative intensities of the Fe-NN compounds were enhanced in the samples with methanol + water and aq. ammonia compared to those with sodium hydroxide. The uncomplexed ligands, as well as Cu-NN, always had their highest intensities in the samples with methanol + water measured in positive ionization mode, regardless of the added base (Figure 1). NN was the first ligand in the series for which the mass balances of the speciation calculations started to deviate substantially from the signal intensities of the corresponding compounds in the mass spectra: Calculations predicted free NN to be the major species (70 μM), while uncomplexed NN was only dominant in the FT-ICR-MS measurement settings where its signal intensities were enhanced due to Na adduct formation (Figure 1, Table 4). Furthermore, Cu was predicted to be bound only in low nanomolar concentrations (5 nM), but reached relatively higher signal intensities in the mass spectra, particularly under conditions favoring ionization of free NN as well: There, the Cu(NN)2 complex made up almost a third of the most abundant NN species (Table 4). Fe was calculated to occur exclusively as Fe(NN)3 complex (10 μM) for both types of base addition, and was the dominant complex throughout the mass spectra. In the case of SA, differences between calculated concentrations and detected abundances were even more pronounced: The PHREEQC model predicted SA to occur primarily in its uncomplexed form (82 μM), but the uncomplexed ligand was almost undetectable in the mass spectra (Figure 1, Table 5). In the speciation calculations, Cu was fully complexed (2.7 μM for Cu(SA) and 7.3 μM for Cu(SA)2), whereas Fe was mostly complexed as Fe(SA)2 (118 nM), with very small amounts of Fe(SA) (8.2 fM). In line with these calculations, the Cu(SA)2 peak was most prominent in the mass spectra, with more than 2-fold higher signal intensities than Cu(SA), and up to 50-fold higher signal intensities than the Fe(SA)2 complex (Table 5). In general, the SA mass spectra also differed from those of the other ligand-metals solutions: The detected SA-compounds had overall lower intensities compared to those of the other metal-ligand solutions (up to one order of magnitude compared to NN, Figure 1), and the intensities of the detected compounds in the mass spectra were highest in samples with methanol+water matrix and sodium hydroxide as added base. Finally, the free, uncomplexed ligands were only detectable with sodium adducts in samples with added sodium hydroxide (Table 5), while Cu-SA species had the highest signal intensities at all settings (Figure 1, Table 5).
Speciation and Abundances of the SA-Cu-titration Series
Overall, the distribution of the Cu-SA species in the calibration series resembled those of the qualitative SA sample solutions with the methanol + water matrix and sodium hydroxide as added base: Cu-SA mono-, di-, and trimers occurred, and the Cu(II)(SA)2 complex had the highest signal intensities throughout the calibration series. Based on the results of the initial speciation and abundance experiments including all ligands, only the results from the ESI negative measurements were investigated in detail due to the higher signal intensities of the Cu-SA complexes with this ionization mode compared to ESI positive. In ESI negative mode, two new Cu2(SA)4 complexes occurred as well, most notably a [(H2SA)2(HSA)2NaCu(II)2]− complex at m/z = 690.9938, which was detected at about ~ 10% of the signal intensity of the main Cu(II)(SA)2 compound. The detected Cu-SA species all showed a linear increase in signal intensities when plotted against Cu concentrations, although the fit of the curve appeared to become worse at the highest amount of added Cu. In agreement with the FT-ICR-MS data, parallel measurements of dilutions of the SA-Cu-titration series via ACSV also resulted in linear response curves, although again the calibration curve seemed to decrease slightly at the highest added Cu concentration. Meanwhile, the combined Cu(SA) and Cu(SA)2 complex concentrations calculated by PHREEQC showed a linear increase throughout (Figures 2A,B after Cu concentrations >1 μM). In addition, the calculated relative contribution of the Cu(SA) monomer to the Cux(SA)y pool was predicted to be in a similar magnitude (13–16% of the Cu(SA)2 dimer) than what was derived from the relative signal intensities in the mass spectra (15–20%). The monomer was calculated to increase with increasing Cu concentrations by 2.7%, while FT-ICR-MS measurements revealed a slight decrease of Cu(SA) compared to Cu(SA)2 species by 2.8%. Thus, the dominance of the Cu(SA)2 dimer was more important than the relative contributions of the Cu(SA) monomer in instrumental setups and speciation calculations, despite the changes in the SA:Cu stoichiometries over the course of the titrations. As in the qualitative setup, PHREEQC and FT-ICR-MS results differed with regards to the abundance of the free ligand, which had overall lower signal intensities than expected from its concentration in solution, and for which the SAx and xNa intensities in the mass spectra initially increased upon addition of the first aliquot of the Cu calibration solution, but then decreased continuously over the rest of the titration series, and at much faster rates than the PHREEQC predictions for free SA concentrations (Figure 2D). Meanwhile, the signal intensities of SA species containing Cl− adducts (SAxNaCl) in the mass spectra increased with increasing Cu solution additions (Figure 2D), but these species were likely adduct artifacts and not considered in the PHREEQC calculations.
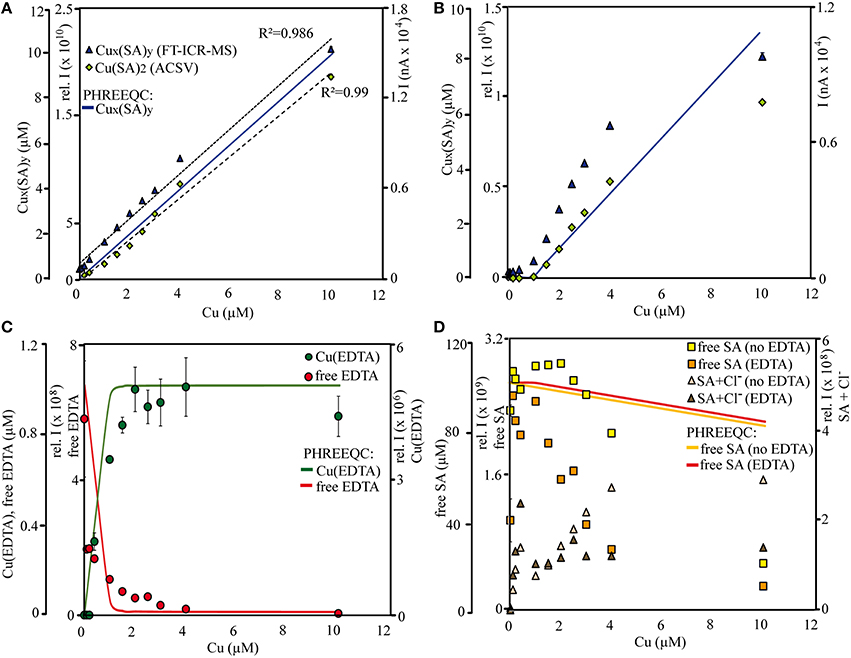
Figure 2. Titration curves for Cu-SA species in treatments (A) without and (B) with 1 μM EDTA, (C) for free and Cu-EDTA species in the EDTA treatments, and (D) for free SA and SA-Cl− species. Measurements were conducted (A–D) by FT-ICR-MS in negative ionization mode and (A,B) by (CLE-)ACSV. Calculations of μM concentrations for (A,B) Cu-SA species, (C) free EDTA and Cu(EDTA), and (D) free SA species were conducted with PHREEQC. The results of the (CLE-)ACSV measurements were dilution-corrected to compare them with the FT-ICR-MS samples. All data points acquired by (CLE-)ACSV and FT-ICR-MS are averages from triplicate measurements of the same sample (error bars denote standard deviation). “Cux(SA)y,” “free SAx,” “SA+Cl−,” and “free EDTA” were calculated as the sum of intensities of all detected species fitting those categories (with and without Na+ adducts).
The same Cux(SA)y species occurred for the EDTA+SA+Cu equilibration titration as for that with SA and Cu alone; again, Cu(SA)2 was the species with the highest signal intensities, and free SA as well as SAxNaCl compounds could be detected. In line with the Cu-SA-calibration series, we only report the ESI negative results here. In addition, several forms of uncomplexed EDTA, as well as one Cu(EDTA) complex ([(EDTA)NaCu(II)]−, m/z = 373.9793) could be identified (Figure 2C). Compared to the calibration series without EDTA, the signal intensities for FT-ICR-MS and current peaks for CLE-ACSV of the Cux(SA)y complexes were overall lower in this titration setup. They increased only from added Cu concentrations >1 μM and leveled off again at Cu concentrations >4 μM (Figure 2B). Again, the PHREEQC calculations predicted a similar amount of Cu(SA) compared to Cu(SA)2 (13%, increasing to 15% at the highest Cu addition) as observed in the mass spectra (20.8%, decreasing to 14.8%). The PHREEQC-derived Cux(SA)y curve did not show the decrease observed at Cu concentrations of 10 μM for the other two methods, and the free SA concentrations did not decrease as steeply in the speciation models as in the mass spectra (Figure 2D). Meanwhile, PHREEQC-calculated patterns of steeply increasing Cu(EDTA) and sharply decreasing free EDTA concentrations mirrored signal intensity distribution changes recorded from the FT-ICR-MS, albeit with slightly differing curve slopes (Figure 2C). Finally, in the FT-ICR-MS spectra, free, uncomplexed SA, as well as SAxNaCl again displayed similar increases and decreases, respectively, as in the setup with SA and Cu only (Figure 2D).
Discussion
Metal-Ligand Speciation Patterns: Integrity and Reproducibility
Overall, our findings agreed well with those from other studies and the predictions from the speciation models: Most EDTA-compounds described by previous reports including uncomplexed EDTA and metal-EDTA were detected in this study as well as predicted by the PHREEQC calculations (Table 3, Chen et al., 2008; Reinoso-Maset et al., 2012). In addition, mostly monomers, and only two dimers were detected, indicating that metal-EDTA equilibrium studies are likely to be comparable amongst different experimental and instrumental setups. Also, Fe(NN)3 was found to be the dominant metal-NN species in our mass spectra (Table 4) in line with our speciation data as well as reports from CLE-ACSV where it is used to study the Fe-complexing capacities of natural seawater samples (Gledhill and van den Berg, 1994; Wu and Luther, 1995; Hawkes et al., 2013). Furthermore, all Cux(SA)y and Fex(SA)y species predicted by the PHREEQC calculations and previous studies were found in our mass spectra under the tested conditions (Campos and van den Berg, 1994; Buck and Bruland, 2005; Abualhaija and van den Berg, 2014). One remarkable difference between the PHREEQC calculations and the mass spectra was the higher abundance of molecular assemblages such as tri-, tetra, and even pentamers in the latter compared to the former (Tables 2–5). Analogous to (single ion) adduct formation, the formation of molecular assemblages is not uncommon in ESI. However, because data on the formation of the investigated complexes in aqueous solutions is not available, we also cannot exclude the possibility that such species also exist in aqueous solutions, but cannot be predicted because the thermodynamic equilibrium constants are not known.
Adduct formation in ESI may obscure compound identification (Tables 2–5): Na+- and K+-containing adducts were ubiquitous in positive ionization mode in those samples that contained Na+ and K+ in solution or potassium, even though PHREEQC speciation models did not predict significant concentrations of sodiated species in solution. Adduct formation in ESI was particularly pronounced for the metal-citrate solutions, where none of the metal-citrate species previously reported by others (Gautier-Luneau et al., 2005; Nischwitz and Michalke, 2009; Silva et al., 2009; Bertoli et al., 2015) could be found, although their pH and stoichiometry settings were in a comparable range to those in this study. These discrepancies can primarily be explained by a re-distribution of Na+, Cl−, and H+ (which occurred in the aqueous phase as free ions according to the PHREEQC calculations) during ionization and gas phase transfer. For example, a Fe(Cit) monomer (m/z = 279.9078) and two Cu(Cit)2 dimers (m/z = 465.9427 and 487.9246) had also been described by Bertoli et al. (2015), albeit without a Cl− adduct for the former and without Na+ adducts for the latter. Nischwitz and Michalke (2009) also observed a Cu(Cit)2 complex, but with a NH instead of Na+ adduct. In line with the results from the literature and our FT-ICR-MS data, the PHREEQC calculations predicted the occurrence of a Fe(Cit) monomer and a Cu(Cit)2 dimer in aqueous solution. Furthermore, in the case of both PHREEQC calculations and FT-ICR-MS measurements, Cu2(Cit)2 complexes were reported to occur (Table 2). Finally, the Fe2(Cit)2 complex (m/z = 510.8517) detected in our study was also listed by Gautier-Luneau et al. (2005) and Silva et al. (2009), there again containing H+ instead of Na+ adducts. Together with the FT-ICR-MS data and the PHREEQC speciation results, we conclude that the rearrangement of ions normally expected to freely occur in aqueous solutions, such as Na+, Cl−, and H+, produces a wide variety of adducts during ionization. Adduct formation in ESI is to be expected because ESI functions on this principle. In addition, e− transfer for metal ions such as Fe and Cu, also takes place during negative ionization mode, as demonstrated especially for the complexes formed with NN (Table 4). Any adduct formation would be valid as long as the complex stoichiometry and net charge are preserved. The only compounds for which no literature or PHREEQC speciation data could be found were the FeCu(Cit)2 complexes (again, with varying amounts of Na+ and Cl− adducts, Table 2). PHREEQC predicted that <2% of the added Fe would form complexes with citrate, while 7.7 μM still occurred as Fe(OH)2+ ions. In principle, it is feasible that the remaining dissolved Fe became attached to Cu(Cit)2 complexes during ionization. On the other hand, to the best of our knowledge, this is the first ESI-MS study to be conducted with both metals and citrate in the same solution, and while the PHREEQC database does not contain stability constants for such a complex, the stoichiometry is theoretically possible in the aqueous environment considering the often described existence of Cu2(Cit)2 and Fe2(Cit)2 complexes.
As mentioned above, reduction at the ESI source produced reduced metal-ligand complexes for Fe-NN and Cu-NN, Fe-EDTA, and Cu-SA (Di Marco and Bombi, 2006; Rellán-Álvarez et al., 2008). Oddly, a reduced Fe-NN complex was also detected in positive ionization mode (Table 4). It is possible that partial reduction of Fe(III)(NN)3 happened during equilibration of the aqueous samples, or that Fe(II)(NN)3 was formed with traces of Fe(II) present in the NIST standard solution, and that this complex has a much higher response factor than Fe(III)(NN)3, analogous to Fe(II)nicotianamide opposed to Fe(III)nicotianamide (Rellán-Álvarez et al., 2008). Changes in the oxidation state may influence the binding strength. For example, it has been suggested that reduction of Fe(III) to Fe(II) during photolysis of siderophores may increase its bioavailability (Barbeau et al., 2001). Nevertheless, the integrity of the Fe(II)(NN)3 complex indicated that under the soft ionization conditions, the complex was still stable even if binding strengths had decreased. Incidentally, the methanol additions used for the increased ionization efficiencies could also decrease the metal-ligand binding strength, as has been demonstrated for EDTA (Xue and Traina, 1996). Within the parameters of our study, the relative intensity distributions of the samples with and without methanol do not indicate a decrease in complexing capacity with an increase of organic solvent (Tables 2–5), and subtle changes may have been masked by matrix-induced changes in response factors.
Metal-ligand equilibria, in particular those involving citrate, are sensitive to changes in pH (Gautier-Luneau et al., 2005; Silva et al., 2009). pH also influences ESI (Di Marco and Bombi, 2006; Van Berkel and Kertesz, 2007). During positive ionization of metal-bipyridyl complexes the pH of the ESI troplets can decrease by 4–5 units (Gatlin and Tureček, 1994) and can increase by 1–2 units during negative ionization of metal-NA complexes (Rellán-Álvarez et al., 2008). At higher pH mononuclear prevail over di- and trinuclear iron citrate complexes (Gautier-Luneau et al., 2005; Silva et al., 2009). Consistently, we found that mononuclear Fe- and Cu-citrate complexes were present in negative ionization mode, while the samples measured in positive mode exclusively contained dinuclear metal-citrate species (Table 2). This may indicate a relative increase of the pH from positive to negative ionization settings. On the other hand, the relative intensities of the Cu(SA) species compared to those with a Cu(SA)2 stoichiometry decreased from negative to positive mode in our study, although PHREEQC calculations over a pH range from 2 to 9 resulted in an opposite trend. It is not possible to judge whether any pH changes within the scope of our experiments may have been as dramatic as those reported by others (Gatlin and Tureček, 1994; Rellán-Álvarez et al., 2008). This is, because firstly, only near-neutral settings (7.1 ± 0.2 and 7.5 ± 0.2) were investigated, thus preventing the evaluation of artifacts based on changing ionization efficiencies with changing pH. Secondly, most tested ligands are known to form strong complexes with Fe and Cu above a pH threshold of ~5, and thirdly, excess ligands were always present in solution, providing a certain buffering capacity (Rellán-Álvarez et al., 2008). It should be noted that the curves of the EDTA ± SA+ titration series acquired by FT-ICR-MS matched those produced by (CLE-)ACSV, although the latter had a higher ionic strength and higher (HEPES buffered) pH (7.8) compared to the former, indicating a resilience of the tested metal-ligand equilibria toward the induced changes of the sample matrix. For studies of kinetically more labile metal-organic complexes, additional measures such as higher sample flow rates, generally low ionic strength, and/or the use of a buffer, may further prevent electrochemical interferences of the equilibria at the ESI source (Wang and Agnes, 1999; Van Berkel and Kertesz, 2007).
Relative Abundances of Detected Species: Impact of Response Factors
To a large extent, the observed abundance patterns in signal intensities depicted in Figure 1 can be explained by the relative abundances of the compounds: For example, citrate and EDTA formed 1:2 and 1:1 complexes with Fe and Cu, and thus a comparatively large proportion of free ligands still remained in solution. The high relative intensities of the free ligands corresponded to the results of the PHREEQC calculations as well (88 and 80 μM for unbound citrate and EDTA, respectively). SA formed complexes up to 1:3 stoichiometries, and NN even formed pentamer complexes with Fe, and this relative decrease in free ligands opposed to the relative increase of metal-ligand complexes is also reflected in the intensity distributions in Figure 1. However, the intensity distributions were also influenced by the different response factors (or ionization efficiencies) of the different species in the solution. For example, based on the metal-ligand stoichiometries of the detected complexes and the PHREEQC speciation calculations, SA still should have had a slightly higher amount of free ligands in solution (82 μM) compared to NN (70 μM), but the signal intensities of the free ligands were much smaller for the former compared to the latter (Figure 1). It has been previously proposed that the ionization efficiency of organic compounds increases with increasing pKa and molecular size (Oss et al., 2010). Although the pKa (which increases in the order of citrate < EDTA < NN < SA) did not seem to have an influence on the relative ionization of the studied compounds, a slight trend of increasing signal intensities with increasing molecular weight was apparent over a wide range of compound types and measurement settings (Figure 3).
Figure 3. Relationship between molecular weight and signal intensity for samples prepared with a methanol:water matrix. Each point in the correlation plot is the calculated average m/z and average signal intensity of a compound group at a specific setting (e.g., all free citrate ligands in samples with aq. ammonia, detected in negative ionization mode). The outlier is influenced by the denoted EDTA-K-compound.
Most importantly, large differences in FT-ICR-MS signal intensities (absolute and relative) were found for all tested reagents between negative and positive ionization mode (Figures 1, 4). From Figure 4, it is evident that the signal intensities of all free ligands (citrate, EDTA, NN, and SA) increased through Na+ or K+ adduct formation in positive mode. This led to the effect that citrate and EDTA, which have net negative charges in aqueous solutions, displayed overall higher signal intensities for all compounds in positive rather than negative ionization mode (Figure 1). Citrate and EDTA solutions were prepared from sodium and potassium salts respectively, and an initial concentration of 100 μM Na+ was present in all sample setups for citrate, while all EDTA setups contained 300 μM K+. Consequently, adduct formation already occurred in the samples without added sodium hydroxide. In contrast, SA and NN had been prepared from pure ligand stock solutions, and Na adduct formation occurred mainly upon addition of sodium hydroxide, leading to overall higher response factors of the uncomplexed ligands (Figure 4). The additional input of sodium to the citrate and EDTA setups for pH adjustment did not enhance the ionization of sodiated species further, but had an opposite effect, with speciation changing drastically (Tables 2, 3, Figure 4) together with an overall sharp decrease in relative signal intensities of all (free and complexed) target compounds (Figure 1). Reinoso-Maset et al. (2012) demonstrated in their ESI-MS study on Mn-EDTA and Th-EDTA complexes, that ion suppression of EDTA occurred in negative mode as soon as metals salts were added, both through the salt additives Cl− or NO, as well as the metal ions themselves, and that signal intensities of target metal-ligand complexes could decrease up to 72%. Based on our study, we suggest that small additions of cations can in fact increase the response factors in positive ionization mode, but ionization may be severely decreasing once a (sample-specific) threshold of ion concentrations has been crossed. In this respect, it is noteworthy that the added amounts of sodium hydroxide (~1 mM) in this study corresponded to the concentration ranges of the metal salts used in Reinoso-Maset et al. (2012).
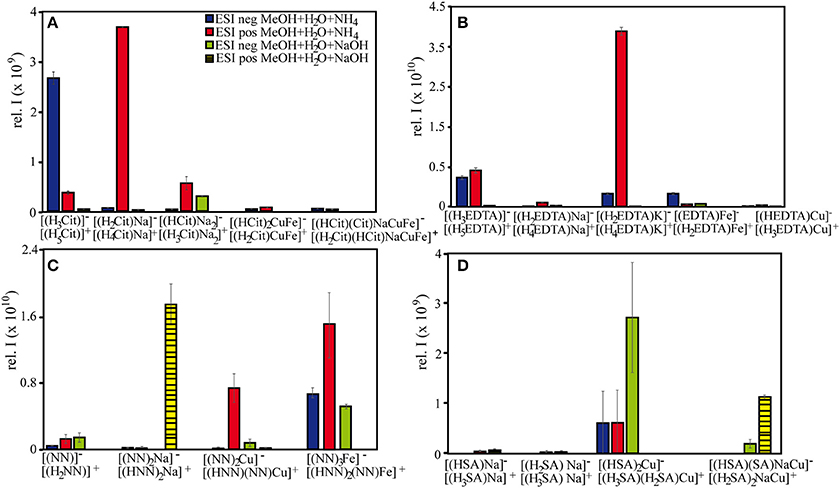
Figure 4. Signal intensities of selected (A) citrate, (B) EDTA, (C) NN, and (D) SA species under different measurement settings. All depicted samples were prepared with a methanol:water matrix, with differing bases and ionization modes.
In both Cu-SA-calibration series, the signal intensities of the free SA species increased after adding the first Cu aliquot, counterintuitive to the expectations that free ligand abundances should decrease with increasing Cu-SA species formation (Figure 2D). In line with our findings on EDTA and citrate, as well as the qualitative observations of free and Cu-SA ionization patterns upon addition of sodium hydroxide, this also indicates that the addition of (Na+, Cl−, and Cu2+) ions during the first titration had a beneficial effect on the ionization of these selected species (Figures 1, 2D). Nevertheless, the signal intensities of the free SA compounds decreased further on with increasing Cu concentrations, presumably due to scavenging by the added Cu. Overall, all acquired mass spectra had increasing signal intensities over the course of the titrations (as indicated by an increase in the sum of all signal intensities for each sample), because they were governed by the quantitative increase of the newly formed metal-ligand complexes. In fact, linear increases of signal intensities were also found for unknown compounds, for which SA-specific sum formulae could not be assigned a priori using our set criteria. The majority of these compounds were the 13C or 65Cu-containing masses corresponding to the detected species listed in Table 5. However, some new molecules could also be identified based on their linear increase. For example, for a compound with the m/z = 168.9595, which occurred in all 11 titration samples, was significantly positively correlated with Cu concentrations (Pearson's ρ = 0.97), and contained 12∕13C and 63∕65Cu isotopologues, we could assign the molecular formula C6H4CuNO, likely the complex of a by-product from the original SA solution with the added Cu. Thus, the titration series was a useful means to distinguish between non-related singular changes in ionization efficiencies, and actual quantitative responses of newly formed Cu-ligand complexes.
While ionization of free ligands was enhanced due to sodium or potassium adduct formation, signal intensities of metal-ligand complexes did not appear to be influenced by this process. Nevertheless, the relative abundances of the metal-ligand compounds in the mass spectra were not always representative of their thermodynamic equilibrium concentrations in aqueous solutions: For example, in the case of EDTA, the Fe(EDTA) signal intensities were up to 3-fold higher than expected, while Cu(EDTA) abundances were 3-fold lower (Figure 1, Table 3). Even more extreme were the discrepancies between free NN and free SA and their metal-ligand complexes, where the latter were up to three orders of magnitude higher than the former, despite the high thermodynamic equilibrium concentrations for the uncomplexed ligands. These patterns can partly be attributed to the relatively poor ionization efficiencies of the unbound ligands, even when their response factors were increased upon adduct formation (Figure 4). Furthermore, Cu in the speciation models was predicted to be fully >99% complexed with three out of the four added ligands (citrate, EDTA, SA), whereas in solutions with NN, 7 μM free Cu2+ were calculated to occur which may have formed adducts to the free ligand at the ESI source, thus increasing the Cu(NN)2 signature. For Fe, the dominant inorganic forms in aqueous solutions containing citrate and SA were Fe(III)oxihydroxides, and Fex(Cit)y and Fex(SA)y complexes did occur mainly at ESI negative mode where reduction at the ESI source could cause Fe adduct formation as well. As mentioned before, the NN and SA data for the PHREEQC speciation models may not have been sufficient to explain all of the observed patterns; for example, the calculated Fe(SA) concentrations are very low considering that SA is used as a competitive ligand in CLE-ACSV to study the Fe-complexing capacity of natural DOM (Abualhaija and van den Berg, 2014). Probably, a combination of instrumental effects (different response factors, metal adduct, and molecular assembly formations), and lack of data for “unpredictable” compounds caused the discrepancies between the models and the measured abundance patterns.
Overall, citrate complexes with Fe and/or Cu had similar signal intensities in negative and positive ionization mode, whereas complexes of EDTA, NN, and SA with Fe appeared to ionize better in negative mode and those with Cu were relatively higher in positive mode. In line with our findings, Waska et al. (2015) showed that the desferrioxamine B (DFoB) complex with iron could be detected at concentrations as low as 1 nM via FT-ICR-MS, while DFoB-Cu was detected at the high end of the calibration series (150–300 nM), and only in positive ionization mode. In contrast, Chen et al. (2008) showed higher intensities of Cu-EDTA over Fe-EDTA at negative ionization in their study of a multi-metal-EDTA complex mixture. Finally, Rellán-Álvarez et al. (2008) found that in negative mode, the ionization efficiencies of Cu- complexes of the aminocarboxylate ligand nicotinianamine (NA) were more sensitive to changes in the capillary cone voltages of their ESI-MS(TOF) system, and more likely to decrease sharply with increasing voltages compared to those with Fe. However, all abovementioned trends in response factors of Fe-complexes and Cu-complexes during different ionization modes are empirically derived, and future studies will be necessary to explain the responsible mechanisms.
Qualitative and Quantitative Comparison of FT-ICR-MS with (CLE)-ACSV
The calibration curves of both the FT-ICR-MS and the ACSV measurements remained linear over the course of the titration series, although the curve leveled slightly off at the highest added Cu concentrations (Figure 2A). For ACSV, the limit of detection (LOD) was calculated as LOD = 3s + a (a = average peak height, s = standard deviation) of the blank signal of the first sample in the titration series, where no Cu had been added. The resulting value corresponded to a Cu concentration of 1.45 nM, which is relatively high for this method (Campos and van den Berg, 1994). This is partly owed to a high Cu blank, and partly to the concentration of SA (2 μM) in the diluted sample which decreases the sensitivity of the method by ~50% compared to the concentrations normally used for the determination of dissolved Cu (20–25 μM SA, Campos and van den Berg). In comparison, the signal intensity of the method detection limit (MDL, Riedel and Dittmar, 2014) of the ESI-FT-ICR-MS was on average 1.01 × 10⁶, and corresponded to a LOD of 0.71 nM for the Cu(SA)2 complex with m/z = 334.0021. Thus, this complex is measured with a sensitivity comparable to that acquired by the ACSV method, as well as to iron-siderophore complexes, which had been reported to be detectable in the low nanomolar range for ESI-(FT-ICR)MS (Gledhill, 2001; Waska et al., 2015). If all identified Cux(SA)y species are taken into account, the resulting calibration curve corresponds to an even lower LOD of 0.41 nM. Even though ACSV only captures the Cu(SA)2 complex and ESI-FT-ICR-MS revealed a multitude of Cux(SA)y complexes, LODs in comparable orders of magnitude for the two methods were achieved in our study, and the acquired calibration curves were remarkably similar. We attribute this to the dominance of the Cu(SA)2 complexes (i.e., the sum of all detected Cu(SA)2 complexes, including Na+ adducts) in the mass spectra, which constantly contributed the majority of the Cux(SA)y signal intensities. The occurrence of several dimer compounds is an artifact of the FT-ICR-MS (due to adduct formation), and all dimers combined contribute to the ACSV signal as one Cux(SA)y compound.
Analogous to the SA-Cu-calibration series, the detected Cu-complexes in the SA + EDTA + Cu competition series behaved similarly in both FT-ICR-MS and ACSV measurements (Figure 2B), and the Cux(SA)y dimers dominated the mass spectra throughout (81.7–81.1% contribution to the total signal intensities). Furthermore, the decreasing signal intensities of the free SA and EDTA ligands with increasing Cu concentrations in the FT-ICR-MS mass spectra were similar to those of free SA in the titration series with SA and Cu alone, and indicative of ligand scavenging of the added Cu (Figure 2D). Due to competition between EDTA and SA for free Cu, a slower increase of the SA-Cu complex signal intensities was found, especially in the low Cu concentration range (0–2 μM). Surprisingly, however, the Cu-SA complex signal intensities only increased linearly between Cu concentrations of 1.5–4 μM and then leveled off in both measurement modes, in contrast to the expectation that more, free SA and Cu should result in higher rates of Cu-SA complex formation (Figure 2B). Meanwhile, the PHREEQC calculations with the known Cux(SA)y complex stoichiometries did not indicate a substantial equilibrium shift between the mono- and dimer, or a decrease in linearity of all accounted Cux(SA)y complexes. In the SA + EDTA + Cu measurements via FT-ICR-MS, we also did not detect any new compounds in addition to the already described Cux(SA)y, Cu(EDTA), and free ligand types. Explanations for the decrease of the Cux(SA)y complex intensities in both FT-ICR-MS and CLE-ACSV at the highest Cu concentration could be 2-fold: (1) through formation of yet unknown Cu ± SA ± EDTA compounds which were undetectable in the mass spectra and/or removed from the sample solutions, for example through adsorption to the reaction vessel walls or the PTFE syringe filters before subsequent analyses; (2) due to matrix-dependent “constituent overload” of both ACSV and FT-ICR-MS: In the case of ACSV, through adsorption processes which exceed the surface capacity of the mercury drop of the working electrode (Campos and van den Berg), and in the case of FT-ICR-MS, through ion suppression (Rellán-Álvarez et al., 2008; Reinoso-Maset et al., 2012).
We calculated the concentrations and conditional stability constants of EDTA (Figure 2B) based on the two titration curves (the last titration point was omitted), by using the ProMCC software created for voltammetric titrations by Omanović et al. (2015). For the titration curves acquired by CLE-ACSV and FT-ICR-MS, the EDTA concentrations amounted to 1.11 ± 0.02 and 1.00 ± 0.03 μM, respectively, while the logK'CuEDTA was calculated to be 17.33 ± 0.03 and 15.49 ± 0.04, respectively. While the calculated concentrations of both methods agreed well with the added amounts of EDTA, the conditional stability constants deviated substantially from each other and from those obtained from the literature. Generally, EDTA binding constants (overall, as well as compared to SA) tend to increase with decreasing ionic strength (Campos and van den Berg, 1994), and thus one would expect a higher logK'CuEDTA for the samples measured by FT-ICR-MS compared to those by CLE-ACSV, since the latter contained 0.06M KCl as additional electrolyte. K+ and Na+ were present in low amounts, however, and they do not provoke as strong side reactions for EDTA and SA as other salt ions usually found in seawater samples, such as Mg2+ or Ca2+. In fact, we observed the opposite trend of a decreasing logK'CuEDTA with decreasing ionic strengths of the samples, although it should be noted that they were in line with previous reports: The CLE-ACSV results are in the range of those found by Xue and Traina (1996) based on potentiometric titrations of Cu-EDTA in 50–60% methanol-water mixtures (17.35–17.87), while the FT-ICR-MS results are more similar to those calculated by Boija et al. (2014) for Cu-EDTA (15.0 ± 0.1), who used Ni as a competing metal ion and conducted measurements by ESI-MS. Thus, the acquired conditional stability constants may be subject to method-dependent artifacts (potentiometric vs. ESI-MS). Because PHREEQC calculations are always based on empirically derived parameters, the speciation models can be impacted as well, and this has to be taken into account when comparing models with instrument-derived speciation results.
Implications for Natural Metal-DOM Studies
As demonstrated by our study, FT-ICR-MS is able to capture the speciation of metal-organic complexes with a wide range of structures, binding stoichiometries, and binding strengths, and the detected species agree well with predictions from other analytical methods, earlier ESI-MS reports from the literature, and speciation calculations (Tables 1–5). Nevertheless, even simple artificial metal-ligand solutions can produce mass spectra of high complexity due to adduct formation or dimerization during ionization, and care must be taken in the interpretation of the results when true metal-ligand complexes present in aqueous solution are sought to be identified. Based on the signal intensities of the detected compounds (Figures 1, 2), we can identify several common trends for all tested ligand types: Overall, highest FT-ICR-MS signal responses were found for methanol-water mixtures, and selective ionization of metal-organic complexes in pure water solutions did not play an important role. In contrast to Stenson (2009), and in line with Silva et al. (2009), we suggest that for metal-ligand measurements, the enhanced ionization efficiency due to the methanol matrix outweighs any potential advantage of a selective ionization of metal-containing compounds predicted for samples made up with pure water only. Furthermore, it appears that Fe-ligand complexes benefitted most from the addition of aq. ammonia rather than sodium hydroxide, and had highest signal intensities in negative ionization mode. Cu-ligands and free ligand species were overall preferentially ionized in positive mode, and the addition of a base enhanced the free ligand response factors through adduct formation, also particularly in positive ionization mode.
Although only a few specific compounds were investigated, the abovementioned observations may also be applicable to unknown natural ligands found in DOM. Traditionally, DOM is desalinated and pre-concentrated by solid-phase extraction (SPE-DOM), and FT-ICR-MS analyses of the extracts are routinely used for DOM fingerprinting of water masses as well as exometabolome studies (Dittmar et al., 2008). It has been shown that metal-organic complexes, as well as free Fe- and Cu-binding ligands, can be solid-phase extracted together with DOM (Macrellis et al., 2001; McCormack et al., 2003; Mawji et al., 2008, 2011; Velasquez et al., 2011; Waska et al., 2015). For example, in the scope of this study, we tested artificial ligands with a variety of metal-binding functional groups, including carboxylate and hydroxyl groups, as well as N-containing groups such as oximes and amines (Table 1). NMR analyses of marine SPE-DOM indicate that it predominantly contains carboxylic groups (Hertkorn et al., 2006; Repeta, 2015), demonstrating that functional groups such as those tested here may also occur in natural ligands. Furthermore, catecholate and hydroxamate groups typical for siderophores have been found in marine SPE-DOM using spectrophotometric methods (Macrellis et al., 2001). CLE-ACSV of natural seawater samples as well as SPE extracts also revealed that uncomplexed SPE-ligands (1) have binding strengths in the range of those found for natural seawater (logK'FeL~12, Macrellis et al., 2001, logK'CuL ~13–14, Waska et al., 2015) and (2) are extracted at efficiencies similar to total DOM and higher than those of intact metal-organic complexes (Waska et al., 2015). Therefore, SPE-ligands may represent a near-natural ligand population, and based on the range of the binding strengths tested in this study, we would expect the majority of metal-organic complexes with natural ligands to stay intact during ESI-MS analyses. It should be noted that the conditional stability constants from Waska et al. (2015) were derived from CLE-ACSV titrations of SPE-DOM re-dissolved in artificial seawater to correct for side reactions of SA with salt ions. For FT-ICR-MS analyses, SPE-ligands in the original desalinated extracts have to be used, and as seen from our SA-EDTA-Cu competitive titration, binding strengths may differ substantially depending on matrix and used methodology, especially when side reactions affect some ligand types in DOM to a greater extent than others (Campos and van den Berg, 1994). Thus, conditional stability constants derived from FT-ICR-MS measurements likely do not capture the complexation properties of the original water sample, although they can be used in several other ways, for example to determine ligand concentrations, intercalibrate FT-ICR-MS and CLE-ACSV, or link metal binding of SPE-ligands to other SPE-DOM characteristics such as elemental composition of detected molecules. SPE-ligands can also be spiked with excess trace metals concentrations, and in past studies, compounds, which newly occurred in DOM mass spectra after metal salt additions, have been identified as metal-organic complexes, and confirmed by isotopic pattern recognition and/or molecular formulae assignment (“presence-absence check,” (McCormack et al., 2003; Mawji et al., 2008; Stenson, 2009; Velasquez et al., 2011)). However, the study presented here confirms previous reports (e.g., Reinoso-Maset et al., 2012) that the response factors of metal-organic compounds, as well as uncomplexed ligands, can be selectively sensitive toward changes in the sample matrix, for example through additives in trace metals solutions (for example NO, Na+, or Cl−), the trace metals themselves, and enhancement/suppression effects of bases such as aq. ammonia and sodium hydroxide. Thus, simple presence-absence patterns of newly detected compounds have to be treated with caution, particularly when considering that even state-of-the-art ultra-high resolution mass spectrometry still contains uncertainties hampering isotope pattern recognition and molecular formulae assignments, for example due to peak overlaps (Waska et al., 2015). Based on the results from our study, we propose that presence-absence studies could be conducted as titrations within the range of the natural ligand pool instead of excess equilibrations, to track linear increases in signal intensities. This approach still includes uncertainties due to metal adduct formation as opposed to the production of “real” aqueous metal-ligand complexes, and for it to be a valid knock-out criterion, we suggest a co-evaluation of the sample complexing capacity using CLE-ACSV, and/or the employment of a competing ligand such as SA or NN to scavenge excess metals. In addition, molecular formulae assignments and isotope pattern recognition in sample scans at high resolution (for example, through mass window isolation) may aid in the unambiguous identification of metal-organic target compounds in SPE-DOM.
Conclusion
In this study, we applied a soft ionization mass spectrometric technique with ultra-high resolution (FT-ICR-MS) to characterize equilibria of the model ligands citrate, EDTA, 1-nitroso-2-naphthol, and salicylaldoxime with iron (Fe) and copper (Cu). In general, methanol-containing samples had much higher sensitivities compared to those only containing water. We also suggest that easily ionized ligands, such as citrate and EDTA (and possibly, carboxylic-rich DOM), produce better results with aqueous ammonia as added base, while less polar ligands such as NN and SA may profit from an ionization-enhancing base like sodium hydroxide. In comparison with a PHREEQC speciation model, the predicted metal-ligand complex stoichiometries all were found in the tested sample solutions, although the patterns were sometimes obscured by instrument-based dimerization or adduct formation. The signal intensities of some compounds (for example, unbound NN and SA, or Cu(NN)2 and Fe(SA) complexes) differed from predicted concentrations, indicating that ionization efficiencies may impact the abundance distribution patterns of some metal-ligand equilibria. An intercomparison between CLE-ACSV and FT-ICR-MS revealed that FT-ICR-MS-derived complex formation is a quantitative process which can be used to (1) identify unknown compounds based on their linear increase with increasing added metal concentrations, and (2) calculate the concentration of a titrated free ligand (in the case of this study, EDTA). Although no conclusive evidence was found for an impact of pH or organic solvent (methanol) on the overall integrity of the compounds or their linear increase with increasing concentrations, FT-ICR-MS- and CLE-ACSV-calculated conditional stability constants differed. Thus, we conclude that FT-ICR-MS-derived conditional stability constants can only be compared between similarly processed sample types such as SPE-DOM measured by MS. We finally suggest that CLE-ACSV should be used for an a priori characterization of the natural sample and corresponding SPE-DOM ligand pool, with FT-ICR-MS being applied for subsequent molecular characterizations, for example, based on the methods described in this paper. This approach will provide novel insights into the large, yet unknown pool of small organic ligands still hidden in DOM.
Author Contributions
HW planned and conducted this study and wrote the manuscript. TD, AK contributed to data interpretation and writing of the manuscript.
Funding
This work was funded by a DFG “Eigene Stelle” fellowship to HW (WA3067/2-1).
Conflict of Interest Statement
The authors declare that the research was conducted in the absence of any commercial or financial relationships that could be construed as a potential conflict of interest.
Acknowledgments
We would like to thank Katrin Klaproth, Heike Simon, Andrea Mentges, and Jeff Hawkes for technical assistance and insightful comments on the study. Furthermore, we are indebted to David Turner and Janek Greskowiak for their valuable advice on PHREEQC speciation modeling.
Supplementary Material
The Supplementary Material for this article can be found online at: https://www.frontiersin.org/article/10.3389/fmars.2016.00119
References
Abualhaija, M. M., and van den Berg, C. M. G. (2014). Chemical speciation of iron in seawater using catalytic cathodic stripping voltammetry with ligand competition against salicylaldoxime. Mar. Chem. 164, 60–74. doi: 10.1016/j.marchem.2014.06.005
Abualhaija, M. M., Whitby, H., and van den Berg, C. M. G. (2015). Competition between copper and iron for humic ligands in estuarine waters. Mar. Chem. 172, 46–56. doi: 10.1016/j.marchem.2015.03.010
Barbeau, K., Rue, E. L., Bruland, K. W., and Butler, A. (2001). Photochemical cycling of iron in the surface ocean mediated by microbial iron(III) binding ligands. Nature 413, 409–413. doi: 10.1038/35096545
Bertoli, A. C., Carvalho, R., Freitas, M. P., Ramalho, T. C., Mancini, D. T., Oliveira, M. C., et al. (2015). Structural determination of Cu and Fe-citrate complexes: theoretical investigation and analysis by ESI-MS. J. Inorg. Biochem. 144, 31–37. doi: 10.1016/j.jinorgbio.2014.12.008
Boija, S., Almesåker, A., Hedenström, E., Bylund, D., Edlund, H., and Norgren, M. (2014). Determination of conditional stability constants for some divalent transition metal ion-EDTA complexes by electrospray ionization mass spectrometry. J. Mass Spectrom. 49, 550–556. doi: 10.1002/jms.3372
Buck, K. N., and Bruland, K. W. (2005). Copper speciation in San Francisco Bay: a novel approach using multiple analytical windows. Mar. Chem. 96, 185–198. doi: 10.1016/j.marchem.2005.01.001
Buck, K. N., Lohan, M. C., Berger, C. J. M., and Bruland, K. W. (2007). Dissolved iron speciation in two distinct river plumes and an estuary: implications for riverine iron supply. Limnol. Oceanogr. 52, 843–855. doi: 10.4319/lo.2007.52.2.0843
Campos, M. L. A. M., and van den Berg, C. M. G. (1994). Determination of copper complexation in sea water by cathodic stripping voltammetry and ligand competition with salicylaldoxime. Anal. Chim. Acta 284, 481–496. doi: 10.1016/0003-2670(94)85055-0
Chen, Z., Sun, Q., Xi, Y., and Owens, G. (2008). Speciation of metal-EDTA complexes by flow injection analysis with electrospray ionization mass spectrometry and ion chromatography with inductively coupled plasma mass spectrometry. J. Sep. Sci. 31, 3796–3802. doi: 10.1002/jssc.200800292
Di Marco, V. B., and Bombi, G. G. (2006). Electrospray mass spectrometry (ESI-MS) in the study of metal-ligand solution equilibria. Mass Spectrom. Rev. 25, 347–379. doi: 10.1002/mas.20070
Dittmar, T., Koch, B., Hertkorn, N., and Kattner, G. (2008). A simple and efficient method for the solid-phase extraction of dissolved organic matter (SPE-DOM) from seawater. Limnol. Oceanogr. Methods 6, 230–235. doi: 10.4319/lom.2008.6.230
Furia, T. E. (1972). “Sequestrants in food,” in CRC Handbook of Food Additives, ed T. E. Furia (Boca Raton, FL:CRC Press), 271–294.
Gatlin, C. L., and Tureček, F. (1994). Acidity determination in droplets formed by electrospraying methanol-water solutions. Anal. Chem. 66, 712–718. doi: 10.1021/ac00077a021
Gautier-Luneau, I., Merle, C., Phanon, D., Lebrun, C., Biaso, F., Serratrice, G., et al. (2005). New trends in the chemistry of iron(III) citrate complexes: correlations between X-ray structures and solution species probed by electrospray mass spectrometry and kinetics of iron uptake from citrate by iron chelators. Chem. Eur. J. 11, 2207–2219. doi: 10.1002/chem.200401087
Gledhill, M. (2001). Electrospray ionization-mass spectrometry of hydroxamate siderophores. Analyst 126, 1359–1362. doi: 10.1039/b101268l
Gledhill, M., and van den Berg, C. M. G. (1994). Determination of complexation of iron(III) with natural organic complexing ligands in seawater using cathodic stripping voltammetry. Mar. Chem. 47, 41–54. doi: 10.1016/0304-4203(94)90012-4
Hawkes, J. A., Gledhill, M., Connelly, D. P., and Achterberg, E. P. (2013). Characterisation of iron-binding ligands in seawater by reverse titration. Anal. Chim. Acta 766, 53–60. doi: 10.1016/j.aca.2012.12.048
Hertkorn, N., Benner, R., Frommberger, M., Schmitt-Kopplin, P., Witt, M., Kaiser, K., et al. (2006). Characterization of a major refractory component of marine dissolved organic matter. Geochim. Cosmochim. Acta 70, 2990–3010. doi: 10.1016/j.gca.2006.03.021
Keith-Roach, M. J. (2010). A review of recent trends in electrospray ionization-mass spectrometry for the analysis of metal-organic ligand complexes. Anal. Chim. Acta 678, 140–148. doi: 10.1016/j.aca.2010.08.023
Keller, B. O., Sui, J., Young, A. B., and Whittal, R. M. (2008). Interferences and contaminants encountered in modern mass spectrometry. Anal. Chim. Acta 627, 71–81. doi: 10.1016/j.aca.2008.04.043
Koch, B. P., Dittmar, T., Witt, M., and Kattner, G. (2007). Fundamentals of molecular formula assignment to ultrahigh resolution mass data of natural organic matter. Anal. Chem. 79, 1758–1763. doi: 10.1021/ac061949s
Koch, B. P., Witt, M., Engbrodt, R., Dittmar, T., and Kattner, G. (2005). Molecular formulae of marine and terrigenous dissolved organic matter detected by electrospray ionization Fourier transform ion cyclotron resonance mass spectrometry. Geochim. Cosmochim. Acta 69, 3299–3308. doi: 10.1016/j.gca.2005.02.027
Macrellis, H. M., Trick, C. G., Rue, E. L., Smith, G., and Bruland, K. W. (2001). Collection and detection of natural iron-binding ligands from seawater. Mar. Chem. 76, 175–187. doi: 10.1016/S0304-4203(01)00061-5
Mawji, E., Gledhill, M., Milton, J. A., Tarran, G. A., Ussher, S., Thompson, A., et al. (2008). Hydroxamate siderophores: occurrence and importance in the Atlantic Ocean. Environ. Sci. Technol. 42, 8675–8680. doi: 10.1021/es801884r
Mawji, E., Gledhill, M., Milton, J. A., Zubkov, M. V., Thompson, A., Wolff, G. A., et al. (2011). Production of siderophore type chelates in Atlantic Ocean waters enriched with different carbon and nitrogen sources. Mar. Chem. 124, 90–99. doi: 10.1016/j.marchem.2010.12.005
McCormack, P., Worsfold, P. J., and Gledhill, M. (2003). Separation and detection of siderophores produced by marine bacterioplankton using high-performance liquid chromatography with electrospray ionization mass spectrometry. Anal. Chem. 75, 2647–2652. doi: 10.1021/ac0340105
Nischwitz, V., and Michalke, B. (2009), Electrospray ionization with selected reaction monitoring for the determination of Mn-citrate, Fe-citrate, Cu-citrate, Zn-citrate. Rapid comm. Mass Spectrom. 23, 2338–2346. doi: 10.1002/rcm.4156
Nowack, B. (2002). Environmental chemistry of aminocarboxylate chelating agents. Environ. Sci. Technol. 36, 4009–4016. doi: 10.1021/es025683s
Omanović, D., Garnier, C., and PiŽeta, I. (2015). ProMCC: an all-in-one tool for trace metal complexation studies. Mar. Chem. 173, 25–39. doi: 10.1016/j.marchem.2014.10.011
Oss, M., Kruve, A., Herodes, K., and Leito, I. (2010). Electrospray ionization efficiency scale of organic compounds. Anal. Chem. 82, 2865–2872. doi: 10.1021/ac902856t
Parkhurst, D. L., and Appelo, C. A. J. (1999). User's Guide to PHREEQC (Version 2) – A Computer Program for Speciation, Batch-Reaction, One-Dimensional Transport, and Inverse Geochemical Calculations. U. S. Geological Survey Water-Resources Investigations Report, 99-4259.
Reinoso-Maset, E., Worsfold, P. J., and Keith-Roach, M. J. (2012). Evaluation of electrospray ionization mass spectrometry as a technique for the investigation of competitive interactions: a case study of the ternary Th-Mn-EDTA system. Rapid. Comm. Mass Spectrom. 26, 2755–2762. doi: 10.1002/rcm.6404
Rellán-Álvarez, R., Abadía, J., and Álvarez-Fernández, A. (2008). Formation of metal-nicotianamine complexes as affected by pH, ligand exchange with citrate and metal exchange. A study by electrospray ionization time-of-flight mass spectrometry. Rapid. Comm. Mass Spectrom. 22, 1553–1562. doi: 10.1002/rcm.3523
Repeta, D. (2015). “Chemical characterization and cycling of dissolved organic matter,” in Biogeochemistry of Dissolved Organic Matter, eds D. A. Hansell and C. A. Carlson (Boston, MA: Academic Press), 21–63.
Riedel, T., and Dittmar, T. (2014). A method detection limit for the analysis of natural organic matter via Fourier transform ion cyclotron resonance mass spectrometry. Anal. Chem. 86, 8376–8382. doi: 10.1021/ac501946m
Ross, A. R. S., Ikonomou, M. G., and Orians, K. J. (2003). Characterization of copper-complexing ligands in seawater using immobilized copper(II)-ion affinity chromatography and electrospray ionization mass spectrometry. Mar. Chem. 83, 47–58. doi: 10.1016/S0304-4203(03)00095-1
Rue, E. L., and Bruland, K. W. (1995). Complexation of iron(III) by natural organic ligands in the Central North Pacific as determined by a new competitive ligand equilibration/adsorptive cathodic stripping voltammetric method. Mar. Chem. 50, 117–138. doi: 10.1016/0304-4203(95)00031-L
Sathe, R. M., and Shetty, S. Y. (1970). Potentiometric studies of the complexes of Be2+ and Cu2+ with some naphthalene derivatives. J. Inorg. Nucl. Chem. 32, 1383–1386. doi: 10.1016/0022-1902(70)80140-3
Seidel, M., Yager, P. L., Ward, N. D., Carpenter, E. J., Gomes, H. R., Krusche, A. V., et al. (2015). Molecular-level changes of dissolved organic matter along the Amazon River-to-ocean continuum. Mar. Chem. 177, 218–231. doi: 10.1016/j.marchem.2015.06.019
Silva, A. M., Kong, X.-L., Parkin, M. C., Cammack, R., and Hider, R. C. (2009). Iron(III) citrate speciation in aqueous solution. Dalton Trans. 40, 8616–8625. doi: 10.1039/b910970f
Stenson, A. C. (2009). Fourier transform ion cyclotron resonance mass spectral characterization of metal-humic binding. Rapid. Comm. Mass Spectrom. 23, 465–476. doi: 10.1002/rcm.3889
Van Berkel, G. J., and Kertesz, V. (2007). Using the electrochemistry of the electrospray ion source. Anal. Chem. 79, 5510–5520. doi: 10.1021/ac071944a
Van den Berg, C. M. G. (1984). Determination of the complexing capacity and conditional stability constants of complexes of copper(II) with natural organic ligands in seawater by cathodic stripping voltammetry of copper-catechol complex ions. Mar. Chem. 15, 1–18. doi: 10.1016/0304-4203(84)90035-5
Van den Berg, C. M. G., Nimmo, M., Abollino, O., and Mentasi, E. (1991). The determination of trace levels of iron in seawater using adsorptive cathodic stripping voltammetry. Electroanalysis 3, 477–484. doi: 10.1002/elan.1140030606
Velasquez, I., Nunn, B. L., Ibisamni, E., Goodlett, D. R., Hunter, K. A., and Sander, S. G. (2011). Detection of hydroxamate siderophores in coastal and Sub-Antarctic waters off the South Eastern Coast of New Zealand. Mar. Chem. 126, 97–107. doi: 10.1016/j.marchem.2011.04.003
Wang, H., and Agnes, G. R. (1999). Kinetically labile equilibrium shifts induced by the electrospray process. Anal. Chem. 71, 4166–4172. doi: 10.1021/ac981375u
Waska, H., Koschinsky, A., Ruiz Chanchos, M. J., and Dittmar, T. (2015). Investigating the potential of solid-phase extration and Fourier-transform ion cyclotron resonance mass spectrometry (FT-ICR-MS) for the isolation and identification of dissolved metal-organic complexes from seawater. Mar. Chem. 173, 78–92. doi: 10.1016/j.marchem.2014.10.001
Wu, J., and Luther, G. W. (1995). Complexation of Fe(III) by natural organic ligands in the Northwest Atlantic Ocean by a competitive ligand equilibration method and a kinetic approach. Mar. Chem. 50, 159–177. doi: 10.1016/0304-4203(95)00033-N
Keywords: ligands, FT-ICR-MS, iron, copper, EDTA, citrate, salicylaldoxime, 1-nitroso-2-naphthol
Citation: Waska H, Koschinsky A and Dittmar T (2016) Fe- and Cu-Complex Formation with Artificial Ligands Investigated by Ultra-High Resolution Fourier-Transform ion Cyclotron Resonance Mass Spectrometry (FT-ICR-MS): Implications for Natural Metal-Organic Complex Studies. Front. Mar. Sci. 3:119. doi: 10.3389/fmars.2016.00119
Received: 31 March 2016; Accepted: 22 June 2016;
Published: 12 July 2016.
Edited by:
Kristen Nicolle Buck, University of South Florida, USAReviewed by:
Martha Gledhill, GEOMAR Helmholtz Centre for Ocean Research Kiel, GermanyRene Boiteau, Woods Hole Oceanographic Institution, USA
Copyright © 2016 Waska, Koschinsky and Dittmar. This is an open-access article distributed under the terms of the Creative Commons Attribution License (CC BY). The use, distribution or reproduction in other forums is permitted, provided the original author(s) or licensor are credited and that the original publication in this journal is cited, in accordance with accepted academic practice. No use, distribution or reproduction is permitted which does not comply with these terms.
*Correspondence: Hannelore Waska, hannelore.waska@uni-oldenburg.de