Crowdsourcing Modern and Historical Data Identifies Sperm Whale (Physeter macrocephalus) Habitat Offshore of South-Western Australia
 Christopher M. Johnson1,2,3*
  Lynnath E. Beckley1
  Halina Kobryn1
  Genevieve E. Johnson2 Iain Kerr2 Roger Payne2
- 1School of Veterinary and Life Sciences, Murdoch University, Murdoch, WA, Australia
- 2Ocean Alliance, Gloucester, MA, USA
- 3WWF Australia, Carlton, VIC, Australia
The distribution and use of pelagic habitat by sperm whales (Physeter macrocephalus) is poorly understood in the south-eastern Indian Ocean off Western Australia. However, a variety of data are available via online portals where records of historical expeditions, commercial whaling operations, and modern scientific research voyages can now be accessed. Crowdsourcing these online data allows collation of presence-only information of animals and provides a valuable tool to help augment areas of low research effort. Four data sources were examined, the primary one being the Voyage of the Odyssey expedition, a 5-year global study of sperm whales and ocean pollution. From December 2001 to May 2002, acoustic surveys were conducted along 5200 nautical miles of transects off Western Australia including the Perth Canyon and historical whaling grounds off Albany; 60 tissue biopsy samples were also collected. To augment areas not surveyed by the RV Odyssey, historical Yankee whaling data (1712–1920), commercial whaling data (1904–1999), and citizen science reports of sperm whale sightings (1990–2003) were used. Using Maxent, a species distribution modeling tool, we found that the submarine canyons off Albany and Perth provide important habitat for sperm whales. Current technology, along with current understanding of sperm whale bioacoustics and habitat preferences, provides strong motivation for undertaking long-term passive acoustic studies that can monitor the sperm whale population within Australia's EEZ waters (Perth and Albany canyons) as a way of informing future marine management and policy decisions.
Introduction
Sperm whales (Physeter macrocephalus) inhabit and forage in deep offshore areas of the world's oceans and were hunted extensively across all oceans for two centuries (Whitehead, 2002). Off the Western Australian coast, two major historical phases of sperm whaling occurred—the open boat hunt conducted under sail by whalers from the United States, Britain, France and Germany (1712–1920) (Bannister et al., 2008), and the commercial, mechanized hunt (1904–1999), primarly off the continental shelf near Albany and in the New Holland grounds off Carnarvon (Figure 1; Townsend, 1935; Chittleborough, 1956; Bannister, 1968; Bannister et al., 1996; Whitehead, 2003).
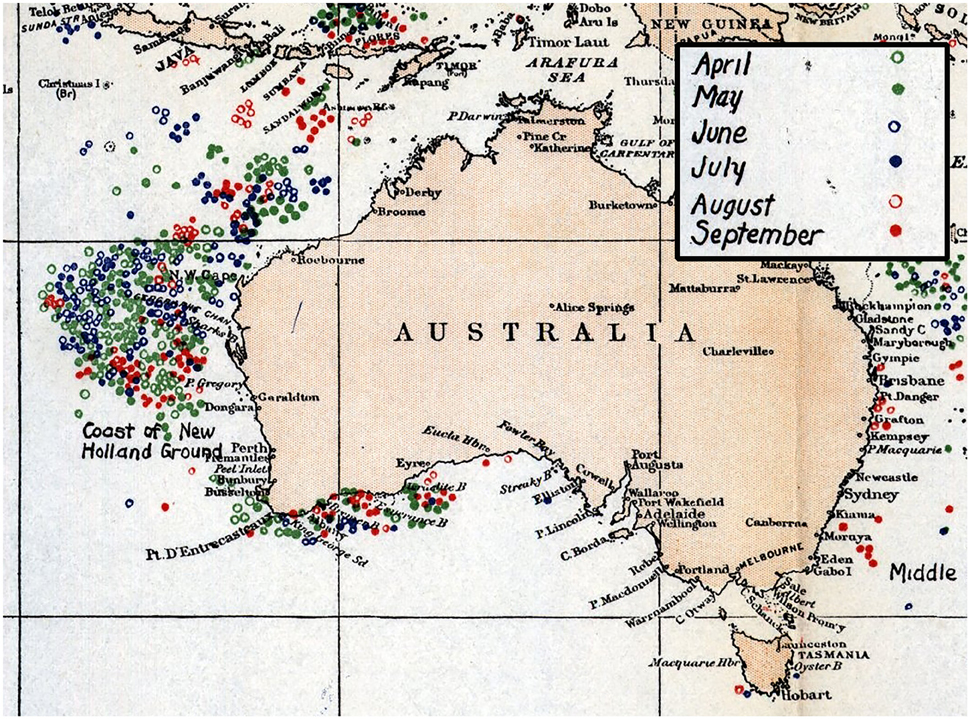
Figure 1. Charts compiled by Charles Townsend details sperm whale kills off Western Australia during Yankee whaling period in months of April–September 1761–1920 (Townsend, 1935).
Offshore distribution of sperm whales and their habitat use worldwide are poorly understood (Whitehead, 2003) and little data exist from Western Australian waters on their abundance and distribution. In the southern hemisphere, females, calves, and young male sperm whales inhabit warmer waters north of 45°S, while adult males travel to and from the colder waters of Antarctica to mate with females. When mature, males then return to the tropics where they encounter and mate with groups of females (Whitehead and Weilgart, 2000).
Currently, sperm whales are listed as “vulnerable” under the World Conservation Union (IUCN) Red List of endangered species (Taylor et al., 2008). This is largely because of the whalers' preference for males owing to their larger body size. The depletion of males in the population off south-western Australia shows this clearly. It has also resulted in a lack of information on possible recovery since then (Bannister et al., 1996; Whitehead, 2002; Carroll et al., 2014).
Critical habitat for cetaceans, such as sperm whales, is those parts of their range that are essential for day-to-day survival as well as maintaining a healthy population growth rate. Such areas are regularly used for feeding, breeding, raising calves and, sometimes as migration routes (Hoyt, 2005).
Globally, typical sperm whale foraging habitat is in water over 400 m deep along continental slopes and ridges including areas of high bottom relief (Jaquet and Whitehead, 1996; Hooker et al., 1999; Pirotta et al., 2011), coastal upwelling of cold, nutrient-rich waters (Rendell et al., 2004), thermal fronts (Griffin, 1999) and areas of high primary productivity (Jaquet and Whitehead, 1996). These features lead to concentrations of prey for sperm whales, mainly meso- and bathypelagic squid (Hooker and Gerber, 2004), though fish are important in their diet in some regions (Clarke, 1996; Whitehead, 2003). In southern Australia, there is evidence that the diet of sperm whales is dominated by oceanic, subtropical cephalopod species (Evans and Hindell, 2004).
The submarine canyons (steep-sided valleys on the continental slope) off south-western Australia have been identified as a key ecological feature as they are linked to localized, periodic upwellings that enhance productivity and attract aggregations of marine life including cetaceans (Rennie et al., 2009). Their higher productivity leads to marine megafauna often inhabiting and/or feeding in them, thereby making them important areas to consider in systematic conservation planning (Hooker et al., 1999; Hooker and Gerber, 2004; Moors-murphy, 2014).
Sperm whales are highly acoustic animals that use echolocation, a process whereby they emit powerful, regular, highly directional clicks of frequencies of 8–26 kHz almost continuously to navigate and find prey (Jaquet et al., 2001; Madsen et al., 2002; Wahlberg, 2002; Møhl et al., 2003). On average, they spend more than 72% of their time in foraging dive cycles with durations that can last up to an hour to depths averaging 400–1200 m and up to 2000 m (Watwood et al., 2006). Sperm whales can maintain and regulate their acoustic output, and the sound-generating mechanism has a bimodal function that allows for the production of clicks suited for biosonar, and clicks more suited for communication (Madsen et al., 2002), an indication of social structure (Whitehead, 2003; Rendell and Whitehead, 2004) across generations (Gero et al., 2015).
Passive acoustic monitoring can be used to identify “presence” and abundance of cetaceans for both scientific research and mitigation activities (Mellinger and Barlow, 2003; Cato et al., 2005; Barlow and Gisiner, 2006; Zimmer et al., 2008; Gavrilov et al., 2011). In particular, sperm whales can be located and tracked using both single hydrophone and acoustic arrays towed behind a boat to listen for their echolocation clicks during foraging dives (Jaquet et al., 1996; Gordon et al., 2000; Barlow and Taylor, 2005; Lewis et al., 2007; Pirotta et al., 2011).
Species distribution models can provide quantitative predictions of geographic distributions and have been used to model historical whaling data (Gregr and Trites, 2001; Elith et al., 2006; Torres et al., 2013). Knowing where the animals are, what characteristics influence their choice of habitat, and how this choice changes with time, is important in understanding the ecology of any species as are: identification of critical habitat, assessment of any overlap with human activities and, ultimately, guiding appropriate conservation and management efforts (Redfern et al., 2006). Species distribution models can be used for conservation, policy and planning as they are useful for predicting, based on environmental and physical variables, where species are likely to occur in areas that have poor or no survey effort.
Presence-only records of animal sightings from sources such as museum collections or online databases are becoming increasingly available and provide valuable resources for modeling efforts (Graham et al., 2004; Pearce and Boyce, 2006; Elith et al., 2011). Maximum entropy modeling (Maxent) is a presence-only modeling technique that has been applied to ecological studies (Phillips et al., 2006; Phillips and Dudík, 2008; Elith et al., 2011) and cetacean studies (Edrén et al., 2010; Thorne et al., 2012; Smith, J. et al., 2012). We found Maxent software suitable for this study as it can model “presence-only” data of various sample sizes, incorporate interactions among environmental variables, account for spatial bias in the presence data, and identify areas that fall beyond the range of environmental conditions (Phillips et al., 2006).
The primary objective of this study was to examine datasets from the RV Odyssey, including biopsy locations and acoustic monitoring, to ascertain the locations of sperm whales off Western Australia. Secondly, we set out to collate these data with historical “presence-only” datasets of Yankee and commercial whaling activities and other data from online portals in order to estimate the abundance and distribution of sperm whales in the south-eastern Indian Ocean. A final objective was to identify critical habitat for sperm whales in the region using Maxent for predictive species distribution modeling.
Methods
The study area was in the south-east Indian Ocean offshore of Western Australia (20°–38°S and 100°–128°E). Four datasets of sperm whale “presence” from 1735 to 2003 were examined (Figure 2).
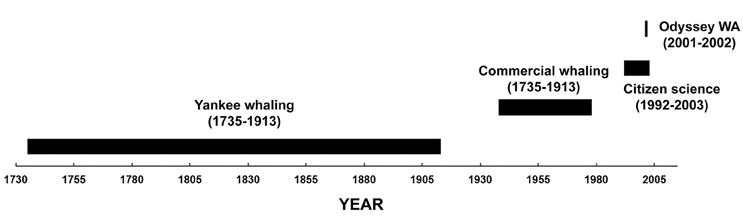
Figure 2. Timeline of the data used in this study of sperm whale distribution off Western Australia.
Voyage of the Odyssey (2001–2002)
The primary dataset in this study is from the Voyage of the Odyssey—a 5-year, global, scientific expedition studying sperm whales and ocean pollution (Bohannon, 2004). From 2000 to 2005, the research vessel Odyssey, a 28 m motor-sailing ketch equipped for open ocean cetacean research, collected tissue biopsies from sperm whales throughout the Pacific, Indian, and Atlantic Oceans and Mediterranean Sea (Wise et al., 2009; Savery et al., 2013a,b, 2014). Although primarily a toxicology voyage, other opportunistic research was conducted and included sightings (Anderson et al., 2006; Clark et al., 2012; De Vos et al., 2012), acoustic studies on sperm whales and other odontocetes (Madsen et al., 2002, 2004) and genetics (Alexander et al., 2016). From December 2001 to May 2002, the RV Odyssey surveyed along 5200 km of ocean transects off the Perth Canyon, Albany Canyon, and offshore in the traditional Yankee whaling area (New Holland Grounds) when in transit to the Cocos Keeling Islands. The primary aim was to locate and track sperm whales using acoustic methods while they vocalized at depth, and, when they returned to the surface, obtain a tissue biopsy to analyse for chemical pollutants (Wise et al., 2009; Savery et al., 2013a,b, 2014).
The vessel crew maintained an acoustic watch 24 h per day when underway. Acoustic detections of marine mammals were made using a 100 m long hydrophone array, consisting of two Benthos AQ4 hydrophone units with Benthos AQ201 pre-amplifiers 2 m apart. Effective listening range was 1–25 km depending on weather conditions, species vocalizing, and whether the vessel was motoring or sailing (Clark et al., 2012; De Vos et al., 2012). The output signal was connected to headphones and a pair of stereo speakers located in the pilothouse. While the vessel was underway, the helmsperson continuously monitored sounds from the array. When not actively tracking or taking biopsies of sperm whales, listening stations using headphones were conducted every half hour. An acoustic stop was made on the top of the hour with the engine turned off for 5 min and then 30 min later, the vessel was brought to a speed of less than one knot for a minimum of 5 min with the autopilot engaged. Acoustic contacts, or detections, with marine mammals were entered in Logger 2000 v 2.05, a computerized database in Microsoft Access 2000 format developed by the International Fund for Animal Welfare (IFAW). The “strength” of “presence” (vocalization) was recorded on a scale of 1–5; 1 was very loud and 5 was listed as no contact.
Incoming acoustic data from the array were automatically scanned and processed in real time by the IFAW software Rainbow Click v. 1.03. Sperm whale echolocation clicks were recorded as a detection (or “presence”) using different algorithms depending on background noise levels. The “automated detections” were recorded every 4 min in Logger 2000 along with the GPS location of the vessel every 10–30 s. Once sperm whales were detected, the helmsperson maneuvered the vessel to determine the bearing of vocalizing animals relative to it. The stereo signal was analyzed in Rainbow Click using time of arrival differences between the same clicks on the two channels to estimate a bearing to each click source (Clark et al., 2012; De Vos et al., 2012).
A visual watch was maintained during daylight hours (~0600–2000) from an observation platform located 4.6 m above water level, with a maximum sighting distance to the horizon of 7.5 km. One or two observers surveyed the area 180° forward of the vessel to the horizon by naked eye and with 7 × 40 binoculars (Clark et al., 2012; De Vos et al., 2012). Observers recorded all marine mammal sightings into Logger 2000 with information on geographic position (from GPS), water depth, species identification, estimated number of animals, behavior, bearing and distance to the vessel. Every 30 min, while searching for animals, environmental data were recorded including sea surface temperature and weather conditions relating to sighting ability (sea state, swell, and meteorological conditions). Visual effort was suspended during times of heavy rain and sea state over Beaufort 6. Animals sighted within 2 km of the vessel's track were approached to obtain species identification, photographs and to estimate group size (Clark et al., 2012; De Vos et al., 2012).
Sperm whales that were observed to be less than half the length of an accompanying animal were classified as calves; animals more than half the length of an accompanying adult, but less than full size, were classified as immature animals; and mature males were determined by their large size (estimated at >12 m; Clark et al., 2012; De Vos et al., 2012). Sexually mature female sperm whales were classified by the presence of callosities on their dorsal fin (Kasuya and Ohsumi, 1966; Whitehead and Gordon, 1986). Biopsies were collected from free-ranging sperm whales with standard methods using a crossbow and a 50 mm stainless steel cylindrical biopsy dart with a floatation tip (Wise et al., 2009). Sample processing, storage, shipping and genetic analysis are explained in full in related toxicology studies (Wise et al., 2009; Savery et al., 2013a,b, 2014).
Dataset Sources and Characteristics (1761–2003)
To examine areas in the study region where the RV Odyssey did not survey, three datasets were sourced from online portals, also referred to as “crowdsourcing,” to augment sperm whale “presence” data. These data are available as downloadable GIS layers that display presence data from museum collections, citizen scientist programs, and “platforms of opportunity” (Williams et al., 2006; Table 1). They include location of a sighting from a ship, a biopsy sample taken from an animal, a location where an animal was heard using underwater hydrophones, or the location of a “take” or kill recorded during whaling operations in the study area (Torres et al., 2013).
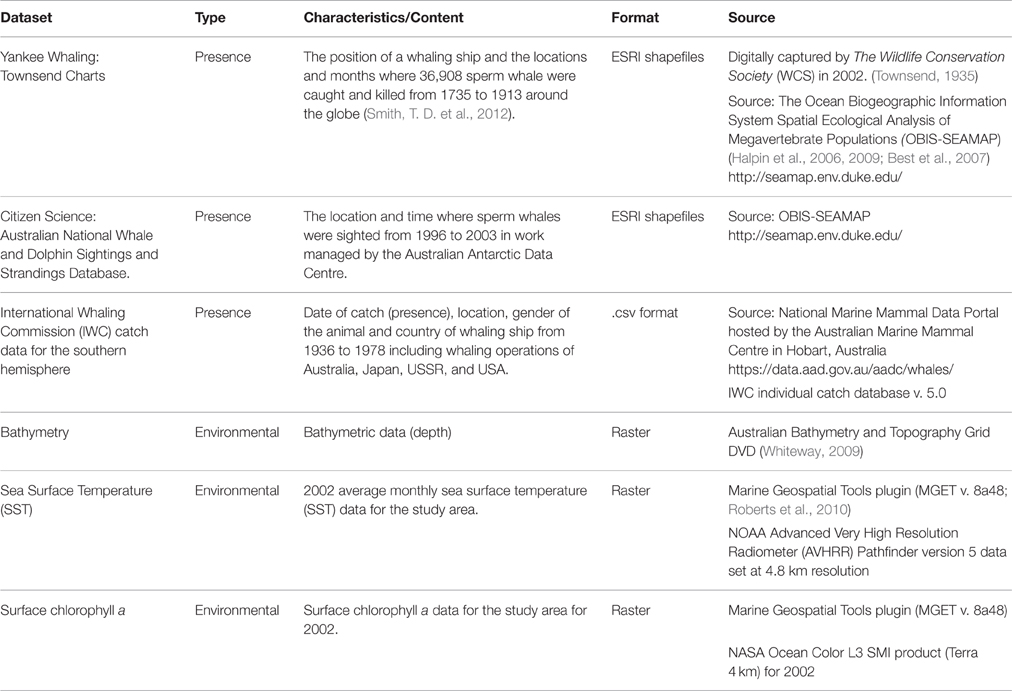
Table 1. Crowdsourced datasets obtained for the study area.
Data Processing
ArcGIS 10 (ESRI) was used to process, visualize, and analyse geographical and temporal data stored in multiple formats. These included position of the research vessel, presence/absence data, acoustic stations and locations, and sex from biopsy samples taken. The data were plotted to display “presence” of historical whaling “takes” and sightings records. All map layers were converted to the WGS 1984 Zone 50S Transverse Mercator projection. A SST layer was generated for the RV Odyssey study period (December 2001–May 2002). Using the Cell Statistic plugin in ArcGIS, the average SST was calculated for the 6 months the RV Odyssey conducted research off Western Australia.
Data of historical whaling and sightings were plotted per season: austral summer (December–February), autumn (March–May), winter (June–August), and spring (September–November). Topographic information, including slope and aspect, were derived from bathymetric data as individual values and applied to new raster layers. Additional software extensions including Geospatial Modeling Environment (GME v. 0.7.2.0 http://www.spatialecology.com/gme) based on the statistical package R (v. 2.15.3 http://www.r-project.org/) and XTools Pro (v.9.1 http://www.xtoolspro.com/) were used for creation of grid cells, and exporting data from shape files to.csv files.
Grid cell size was a consideration in how all data were plotted in ArcGIS and Maxent. To deal with the location bias in the Townsend Yankee whaling data where the mean vessel location error was estimated to be 0.22° latitude (about 24 km) and 0.54° longitude (about 34 km) (Smith, T. D. et al., 2012; Torres et al., 2013) point and kernel density distributions of historical data were computed in 15 nautical mile grid cells over the study area using the Spatial Analyst tool.
The Spatial Analyst tool was used to calculate and create layers including Euclidean distance to the −200, −1000, and −2000 m isobaths. In order to create layers of depth, slope, aspect, SST, and chlorophyll a, grid cells and centroid points were created using the Xtools Pro and values were extracted points in ArcGIS. Spatial data from all thematic layers were exported to ASCII format for use as environmental layers by Maxent.
Sperm Whale Distribution Modeling Using Maxent
Along with density plots of past distribution, maximum entropy modeling using the software Maxent (version 3.3.3 k http://www.cs.princeton.edu/~schapire/maxent/), was used to provide predictions of sperm whale occurrence based on environmental and physical variables in the study area. The general approach of Maxent is to create a probability distribution for a species by contrasting occurrence data with background data (pseudo-absences) rather than true absence data (Smith, J. et al., 2012). Maxent employs a maximum likelihood method that models distributions of species by generating a probability distribution over the pixels in a grid of the study area subject to a set of constraints derived from measurements of assumed suitable habitat values at species presence locations (Thorne et al., 2012). The output of Maxent is a probability distribution of environmental suitability for a species, where higher values correspond to a prediction of better conditions and higher probability of occurrence (Phillips et al., 2006; Phillips and Dudík, 2008; Elith et al., 2011).
The species distribution model was created using a variety of sperm whale “presence” location data over two seasons, summer (December–February) and autumn (March–May) to correspond with the entire effort of the RV Odyssey research survey. These included all RV Odyssey acoustic stations and biopsy data, a random selection of IWC commercial whaling data, Yankee whaling data and citizen science data. In Maxent, 25% of the data were randomly drawn from the dataset for model training over 20 replicate subsample type runs over a maximum of 5000 iterations. Several models were tested in Maxent using a combination of datasets (RV Odyssey only, RV Odyssey and IWC, RV Odyssey and citizen science, and RV Odyssey with all samples) with and without bias files for testing purposes as this is known to influence model output (Phillips et al., 2009).
Maxent provided both threshold-dependent and threshold-independent measures of model outputs using the area under the curve (AUC) of the receiver operator characteristic (ROC), which evaluates how well model predictions discriminate between locations where observations are present and random background data (pseudo-absence points; Thorne et al., 2012). Response curves of the environmental variables were conducted and a jack-knife test was undertaken to evaluate the relative contributions of each environmental variable to the model (Smith, J. et al., 2012). The AUC is one of the most widely used threshold-independent evaluators of model discriminatory power (Fielding and Bell, 1997) and can range from 0 to 1, where an AUC of 0.5 indicates that model performance is equal to that of a random prediction and a value of 1 suggests perfect discrimination between suitable and non-suitable habitat (Smith, J. et al., 2012).
Results
The numbers of sperm whale “presence” locations recorded in this study are provided in Table 2. For the RV Odyssey data, sperm whales were heard before they were seen, so acoustic detections (both automated and manual) took precedence over sightings from the original dataset. Biopsy locations were also included as presence data for this study.
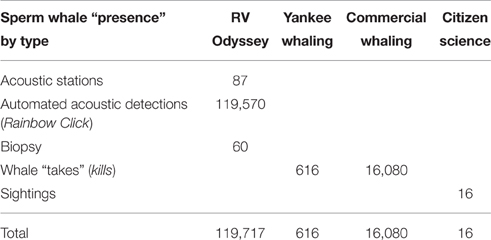
Table 2. Number of sperm whale “presence” data points in the study area off Western Australia.
Voyage of the Odyssey
Fifty days were spent on acoustic transects and visual searches off WA under various weather conditions and the track of the research voyage and the automated acoustic detections of sperm whales are shown in Figure 3. These data are displayed as kernel density plots in 15 nautical mile grid cells in the Perth Canyon area (austral summer), the Albany canyons and offshore in the New Holland historical whaling grounds (austral autumn; Figure 4). Although, research activities were biased toward obtaining sperm whale biopsy samples, these plots can serve as an indicator of presence of sperm whales in these areas.
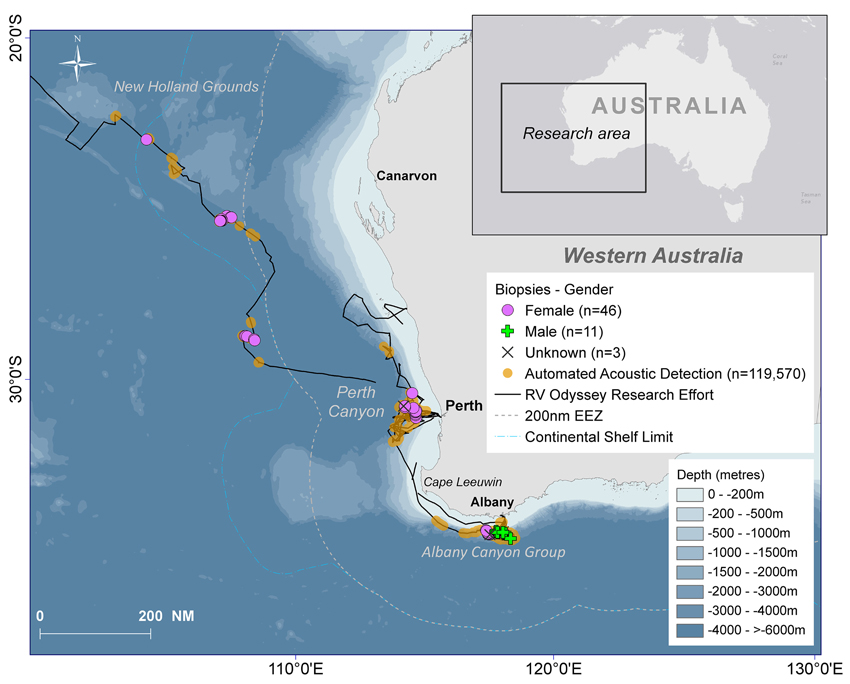
Figure 3. The south-eastern Indian Ocean study area with the track of the RV Odyssey, locations of the biopsy samples and gender of the sampled sperm whales, all automated acoustic detections of sperm whales recorded by Rainbow Click and bathymetry.
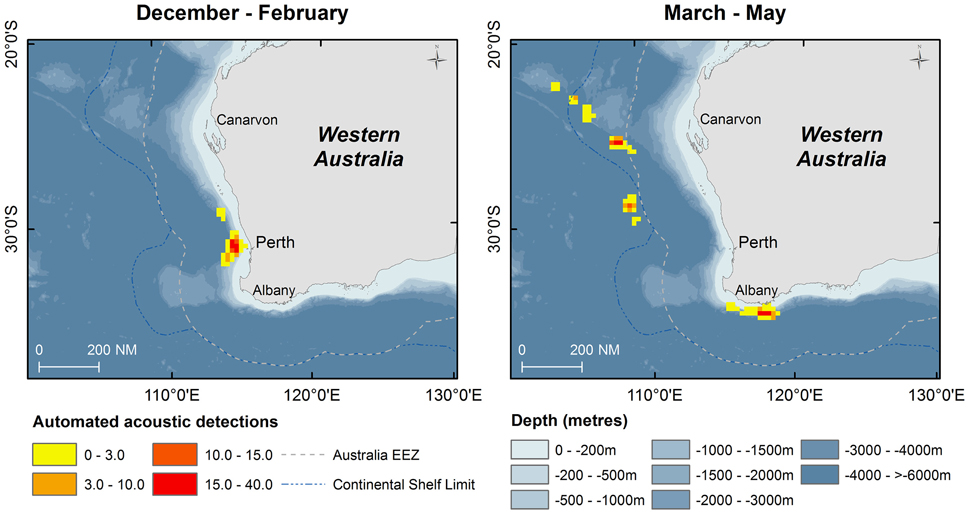
Figure 4. Kernel density of number of automated acoustic detections of sperm whales during the voyage of the RV Odyssey off Western Australia. Data are shown in 15 nautical mile grid cells by season when the vessel was operating in the area.
Sixty biopsies of sperm whales were taken in the study area and source locations and sex of animals are indicated in Figure 3. Twenty-three animals were sampled off the Albany Canyons—11 were males and 12 were females. In the other areas where biopsies were collected, only females were recorded with 12 in the Perth Canyon, the rest offshore and in the old New Holland whaling grounds. Most of the samples were taken along the edge of the continental shelf but the four females sampled in deep waters (−4000 to >−6000 m) were probably “traveling” or migrating due to the depth of location sampled. Additionally, in the Perth Canyon the visual observations indicated that most of the sperm whales were “sub-adult” with seven classified as “immature.”
Historical Data
Results of Yankee whaling sperm whale takes from 1735 to 1920 are displayed in point density maps in 15 nautical mile grid cells by austral season (Figure 5). Overall, 616 animals were killed in all seasons during this time period, primarily offshore in the historical New Holland whaling grounds during autumn, winter and spring. In the summer months, whaling activity occurred primarily offshore of the south-west Australian coast and no activity occurred in the Perth Canyon.
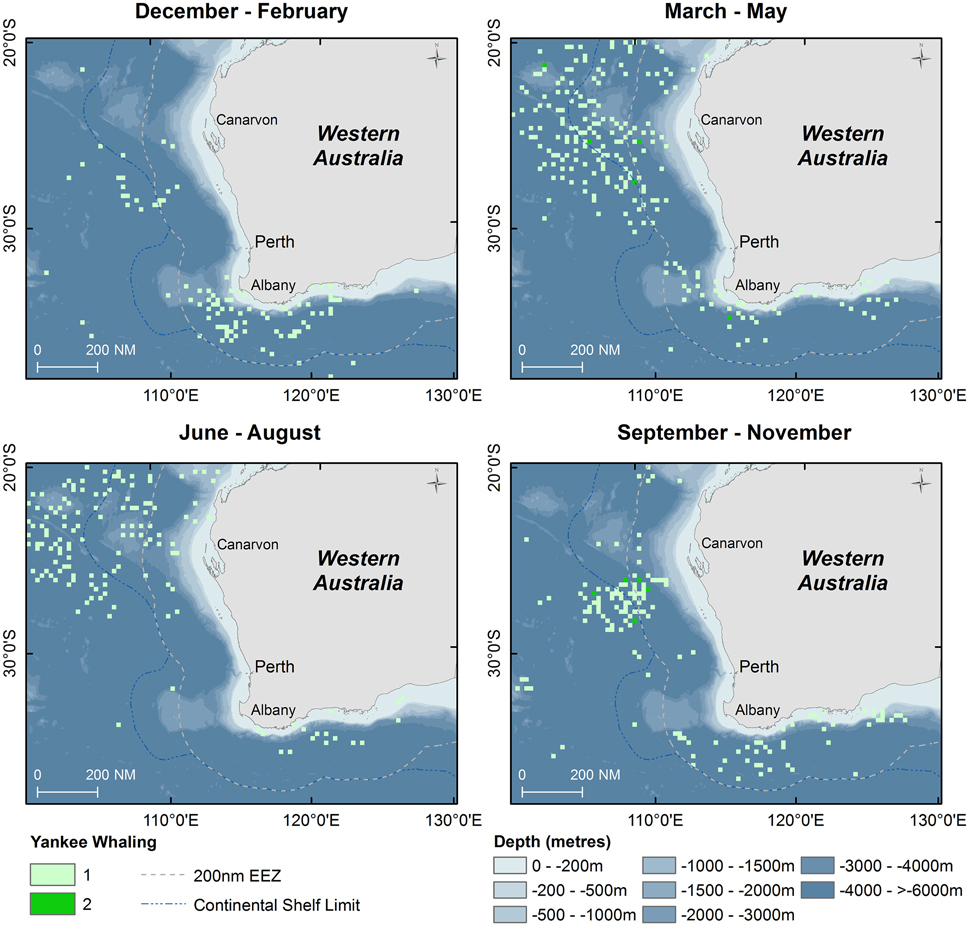
Figure 5. Point density maps displaying seasonal distribution of sperm whales taken during Yankee whaling operations (Townsend, 1935) with shaded symbols indicating number of animals taken in 15 nautical mile grid cells.
From 1936 to 1978, commercial whaling killed 16,080 sperm whales in the study area and this take is displayed in kernel density maps (15 nautical mile grid cells; Figure 6). Most of the commercial whaling occurred from the Cheynes Beach whaling station in Albany with 91% of effort focused in the area of the Albany canyons area. Other countries, including Japan (4%), USSR (5%), and USA (< 1%) took sperm whales in the region though this activity occurred primarily offshore. Results from the IWC data include gender of the animals killed (17% females, 84% males) by season (Figures 7, 8).
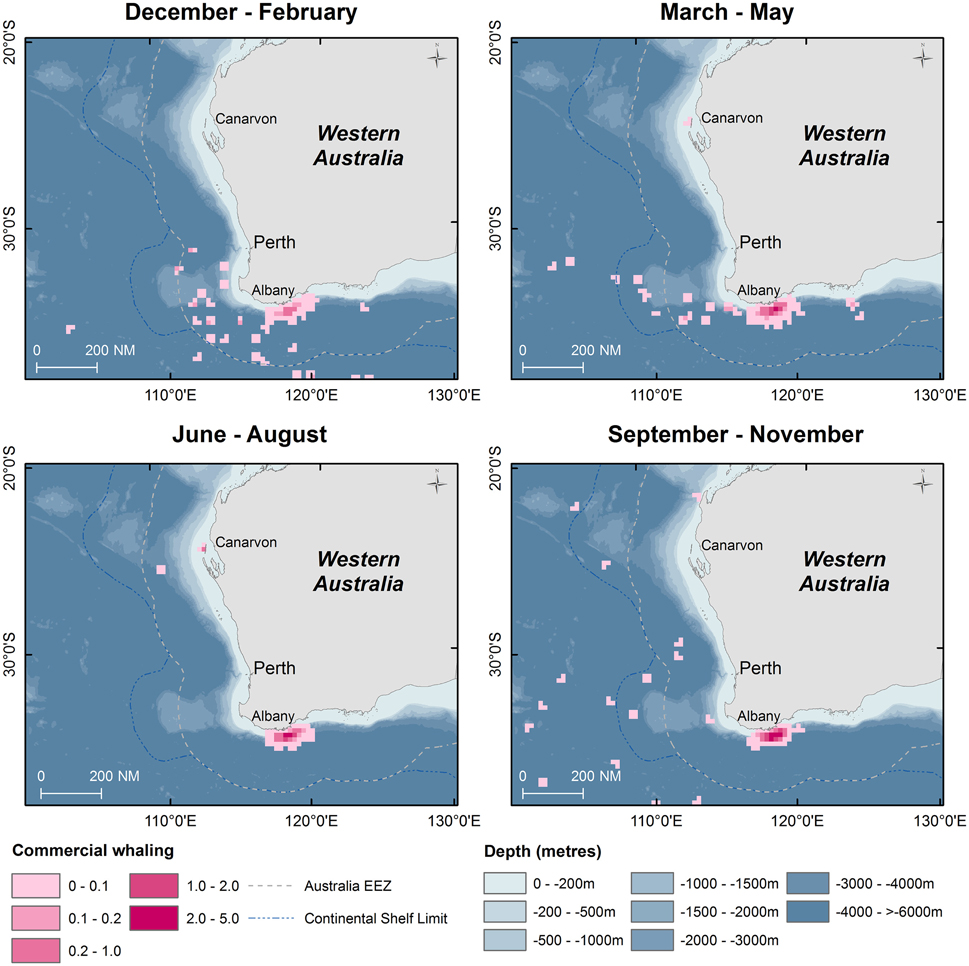
Figure 6. Kernel density maps of seasonal distribution of sperm whale “takes” off Western Australia during the commercial whaling period (1936–1978). Data are shown by season in 15 nautical mile grid cells (Source: IWC).
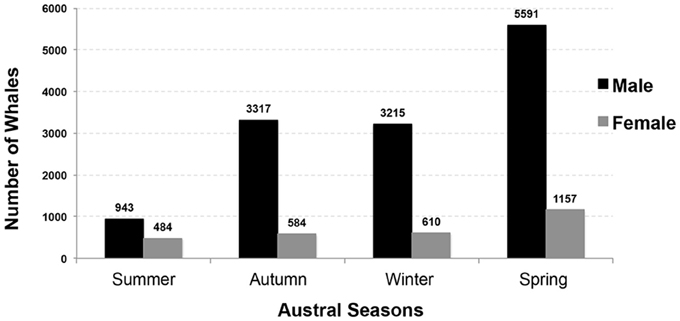
Figure 7. Number of male and female sperm whales taken during commercial whaling operations off Western Australia by season between 1936 and 1978. (n = 16,080; Source: IWC).
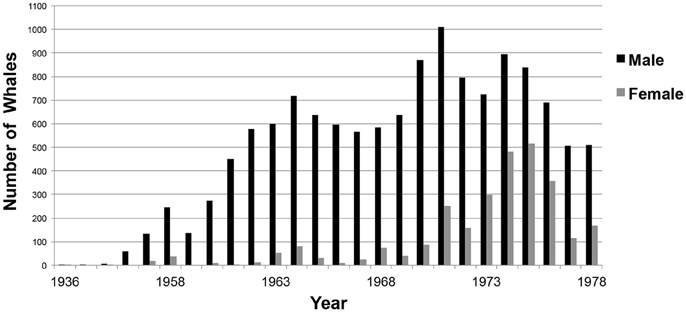
Figure 8. Number of sperm whales by gender taken each year during commercial whaling operations off Western Australia. (n = 16,080; Source: IWC).
Whaling kills increased from 1953. Although, males were the primary targets of whaling activities until the 1970s, thereafter, there was an increased take of females (Figure 8). In 1978, the Australian Commonwealth government banned commercial whaling.
The limited number of sperm whale sightings between 1994 and 2003, sourced from the Australian National Sightings and Stranding database, indicated the presence of sperm whales off the continental shelf near the Perth Canyon in summer and autumn seasons. This is consistent with the findings of the RV Odyssey of presence of sperm whales along the WA continental shelf.
Environmental Variables Influencing Distribution
The results of the species distribution model included the Odyssey, commercial whaling data and citizen science presence data. The Townsend Yankee whaling data was tested but not included in the final model. These were statistically strong with a receiver operating curve (AUC) of 0.827 and standard deviation (SD) of 0.034 (Figure 9).
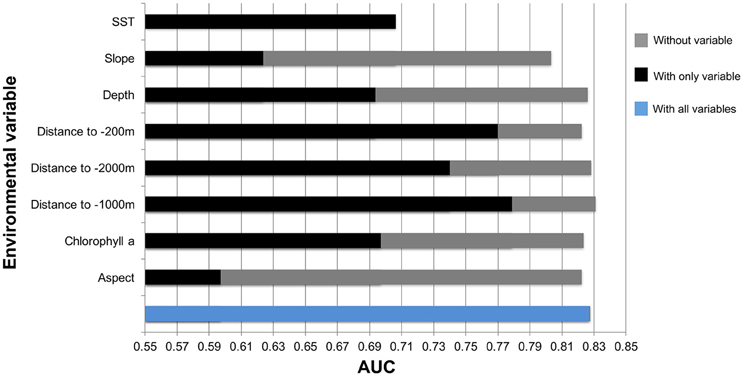
Figure 9. Results from Jackknife tests showing the most influential environmental variables in the model. Values shown are averages over 25 replicate runs in Maxent.
Key environmental and physical factors of this model were distance to the −1000, −200, −2000 m isobaths, and SST. The environmental variable with highest gain when used in isolation was distance to −1000 m isobath.
Based on environmental factors (>0.6), the model predicts that at least 19,442 km2 of ocean offshore of south-west Australia is suitable habitat for sperm whales. Within the study area, predicted distribution occurs within Australia's 200 nautical mile Exclusive Economic Zone in the south-west marine bioregion (Figure 10). It also overlaps with some designated marine protected areas in the Perth Canyon and parts of the Albany Canyon group. Overall, 5.2% of suitable habitat offshore for sperm whales is within marine protected areas with 1.8% of these areas are classified as a marine national park (IUCN II), which strictly regulates and limits most offshore activity (Table 3).
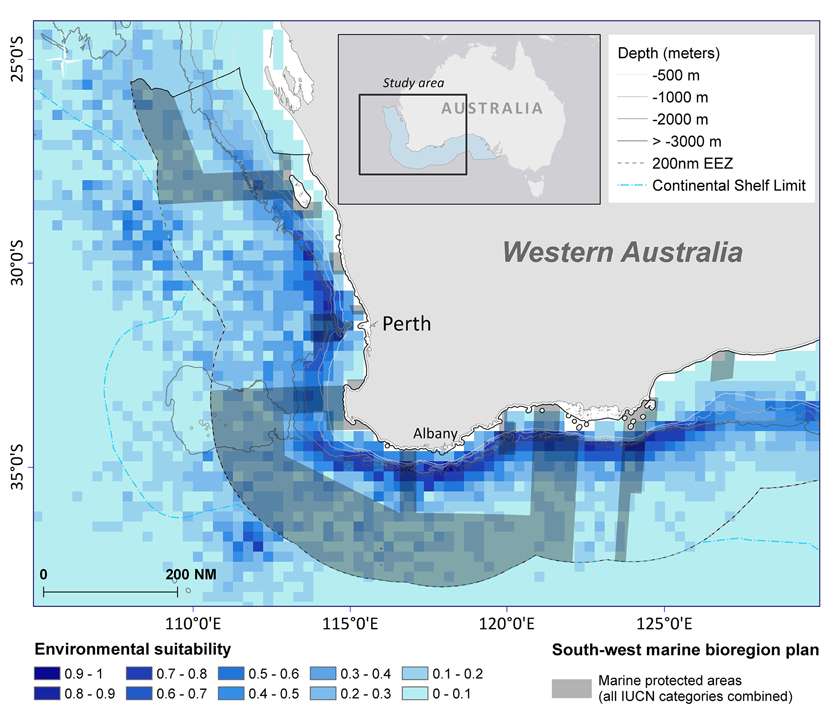
Figure 10. Sperm whale distribution model of suitable habitat displayed in 15 nautical mile grid cells for summer/autumn seasons combined at 95% confidence level. The boundaries of the south-west marine bioregion proposed protected areas (shaded in dark gray) displayed over the species distribution model.
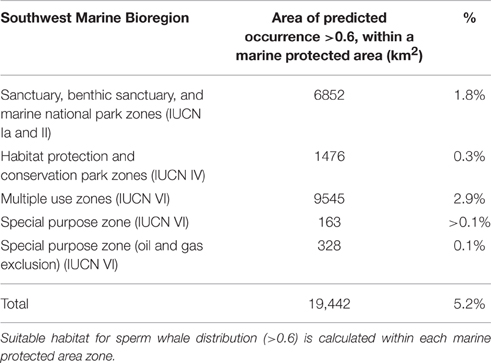
Table 3. South-west marine bioregion protected areas cover 376,137 km2 within the study area.
Discussion
Passive acoustic methods used in the Voyage of the Odyssey expedition were an efficient and effective way to locate and track sperm whales in areas of historical abundance, regions of typical habitat, and in difficult weather conditions. The survey found sperm whales in the Perth Canyon, Albany Canyon group, and the historical New Holland whaling grounds. Previous aerial surveys and passive acoustic studies have identified sperm whales in the Perth Canyon region (Bannister, 1968; Mccauley et al., 2004) and Albany Canyon group (Carroll et al., 2014). However, the RV Odyssey results provide the first detailed acoustic “presence” data of sperm whales primarily distributed along the continental shelf, submarine canyon and ridges.
Of the 60 sperm whale biopsies taken in the study area, results were consistent with historical commercial whaling data demonstrating males and females using the Albany canyons. However, in the other areas surveyed, only females were sampled, 12 in the Perth Canyon, the rest offshore and in the old New Holland whaling grounds. The four females from which biopsies were taken were in deep waters (−4000 to > −6000 m) and were most likely “traveling” or moving between social groups (Whitehead, 2003), possibly indicating that female social units move between all three regions in the study area. Whitehead (2003) described movements in a 24-h period of female and immature animals to be about 79 km when feeding conditions were poor, 25 km when they were good with an estimated overall range for females and immature animals of about 1450 km.
The RV Odyssey observational data indicated that seven of 11 whales in the Perth Canyon were “immature” (meaning they were juvenile females). The Perth Canyon could be both a critical feeding area and nursery for matriarchal family groups. In the summer months, pygmy blue whales feed in the Perth canyon (Rennie et al., 2006, 2009; Double et al., 2014) and other species of cetaceans are present year-round, including true blue whales (Balaenoptera musculus) over the winter and migrating humpback (Megaptera novaeangliae) and southern right whales (Eubalaena australis) (Mccauley et al., 2004).
With regards to the results from the crowdsourced data, there is known location bias for historical Yankee whaling effort in the presence points of the Townsend charts (Smith, T. D. et al., 2012). However, a “crowding effect” of inaccurate point locations may be more of a problem with coastal species such as humpbacks than with offshore species such as sperm whales (Bannister et al., 2008). During this era, most animals were killed offshore in very deep waters with a median depth ~ −5000 m, far away from typical foraging habitat and there were no kills reported in the Perth Canyon. The Townsend Yankee whaling data were removed from the final species distribution model produced with Maxent due to the sparse distribution offshore and inconsistent results of presence over depth (median depth ~ −5000 m). This study concurs with Smith, T. D. et al. (2012) and Torres et al. (2013) that data such as these may be better suited for studies on a global scale, rather than a regional scale. When crowdsourcing a variety of spatial and temporal data, it is critical to consider the suitability of each to include in a species distribution model.
IWC commercial whaling records reveal that more males (82%) were hunted than females (18%) in the study area and this was consistent with commercial efforts worldwide to target larger males (Whitehead, 2002). However, in the latitudes of WA sperm whale groups are matriarchal, only periodically visited by roving mature males (Whitehead, 2003). There was an increased take of females in the 1970s and this may have negatively impacted the population off the coast of Western Australia.
The IWC records indicate that sperm whales use the Albany canyons year-round. With 35% of all males taken during the spring (n = 5591), this season could have been important period for migrations of mature males moving south to Antarctica, a productive time for feeding in submarine canyons, or important for mating with females in the region. Overall, while there may be some seasonal variation in sperm whale abundance in different areas, females do not appear to make pronounced seasonal migrations and their movements are best described by models of nomadic animals moving in response to changes in food abundance (Whitehead, 2003).
In general, mature males move to higher latitudes with age, with periodic migrations between lower-latitude feeding grounds and high-latitude feeding grounds beginning at about an age of 27 years (Best, 1979). With variable patterns of movement at high latitudes, animals stay resident in small areas for long periods. At low latitudes, there appears to be near continuous movement within a breeding area of a few hundred kilometers across, as mature males visit and re-visit resident groups of females (Best, 1979; Whitehead, 2003).
Bannister (1968) conducted aerial surveys from 1963 to 1965, during the commercial whaling era off Albany and incorporated additional sightings data from spotter planes that would regularly assist whaling ships off Carnarvon and the Cheynes Beach whaling station at Albany. Bannister (1968) hypothesized that there may be two distinct stocks of sperm whales off the west coast and speculated that their presence could be related to deep waters in the area adjacent to the steeply sloping continental shelf. He described the steep slope as favoring the production of food and found that a very high proportion of whales (70–80% in 1964–66) off Albany had recent remains of squid in their stomachs (Bannister, 1968). Bannister (1968) found very little direct evidence for seasonal movements but indicated there was latitudinal rather than longitudinal movement off WA. However this hypothesis may be influenced by the difficulty in studying sperm whales in the winter months.
The RV Odyssey genetics data only contained records of the gender of the animals sampled, so Bannister's hypothesis of two separate populations could not be tested. The RV Odyssey acoustic results showed that sperm whales use the continental shelf off WA. Bannister (1968) spotted no animals on flights from Geraldton to Perth and Perth to Cape Leeuwin during the winter months (July–August 1964). This suggests that sperm whales use the Perth canyon region seasonally with animals undertaking latitudinal movement in the autumn to the New Holland grounds or back to the Albany canyons.
Presence-only species distribution modeling using Maxent proved to be a useful method for synthesizing historical and modern “presence only” data to predict critical habitat of sperm whales in the study area. Traditional line-transect surveys estimating abundance would search across depths (Buckland et al., 2001; Mellinger and Barlow, 2003; Barlow and Taylor, 2005; Panigada et al., 2011; Pirotta et al., 2011). However, because the principal goal of the RV Odyssey work was to get biopsy samples, the RV Odyssey surveyed specifically along the −2000 to −3000 m isobaths. Thus, statistical modeling techniques such as generalized linear models (GLMs) and generalized additive models (GAMs) requiring both presence data and research survey effort, from which absence can be inferred, were not suited to the data.
Depth and distance were correlated in the results, specifically distance to the −1000, −200, and −2000 m isobaths, and sea surface temperature. Past studies have indicated that depth and slope are environmental factors influencing sperm whale distribution (Hooker et al., 1999; Pirotta et al., 2011). Commercial whaling locations had a median depth > −1000 m and activity primarily occurred relative close to land off Albany along the continental shelf edge (~25 nautical miles wide). Such depths have been indicated as providing suitable habitat for foraging for sperm whales in other regions (Hooker et al., 1999; Pirotta et al., 2011). In addition, the study area consisted of a large latitudinal range which may account for sea surface temperature being an important influence in the model.
Upwelling in submarine canyons is known to cause productive feeding areas for cetaceans (Hooker et al., 1999; Rennie et al., 2009). Toothed whales, especially sperm whales and beaked whales (family Ziphiidae), appear to exhibit the strongest associations with these features throughout the year (Moors-murphy, 2014). By contrast, a recent review of submarine canyons found baleen whales tend to occur in canyons seasonally (Moors-murphy, 2014). Results show that submarine canyons are preferred habitat for sperm whales in south-west Australia, specifically in the Albany Canyon group and the Perth Canyon. Commercial whaling results indicated that males and females were using the Albany canyon group year-round. Based on the numbers of animals killed during the commercial whaling era and, that the RV Odyssey found animals using the areas, this region could be vital for foraging, breeding, social cohesion, mixing, and mating with males moving to, or from, Antarctic waters. The study identified the critical areas for sperm whales are submarine canyons found offshore of Albany and Perth.
Using ship-based and aerial methods to study and monitor species such as sperm whales is costly, as weather in regions such as WA is variable offshore (Carroll et al., 2014) and because of this and other logistical reasons, monitoring often does not occur for cetaceans in these areas (Donovan, 2005). The dive cycle and vocalizations produced by sperm whales make them a suitable species with which to use passive acoustic techniques for monitoring habitat use. These techniques can also be used to understand their abundance, density and distribution in order to regulate potential impacts of anthropogenic activities. Off WA, Gavrilov et al. (2011) used passive acoustic loggers including the CTBT hydroacoustic station (HA01) off Cape Leeuwin in WA from 2002 to 2007 and the Integrated Marine Observing System (IMOS) in the Perth Canyon from 2009 to 2010 to study pygmy blue whale vocalizations. From 2000 to 2006, McCauley and Jenner (2010) used passive noise loggers connected to hydrophones lying on the seabed floor of the north-west and south-west coasts to record pygmy blue whales vocalizations in order to estimate the abundance of the population off WA. Similar techniques could be used to monitor sperm whales with adjustments to the sampling frequencies of acoustic data loggers used in these studies.
Within the study area, predicted distribution occurs within South-west marine bioregion within the 200 nautical mile EEZ. It also overlaps with some marine protected areas in the Perth Canyon and parts of the Albany Canyon group—areas of historical sperm whale distribution.
Overall, 5.2% of suitable offshore habitat for sperm whales is within IUCN marine protected areas but only 1.8% of these areas are classified as a marine national park (IUCN II) which strictly regulates and limits most offshore activity including oil and gas exploration, mining, and commercial fishing. Cetaceans such as sperm whales occupy an extensive range, so there is a strong potential that by protecting their critical habitat, a wide variety of other species that regularly occur within the area, and ecosystem processes, will be more resilient (Hoyt, 2005).
Conclusion
Sperm whales are found off Western Australia year-round, with critical habitat offshore in the Albany canyons and in the Perth Canyon. Passive acoustic monitoring was an effective means to detect sperm whale presence in variable weather conditions off the coast of Western Australia during the Voyage of the Odyssey expedition (2001–2002). Using Maxent, presence only modeling was used to fill the knowledge gaps for a region with little survey effort to predict species distribution based on environmental factors.
New autonomous technologies such as ocean gliders and wave gliders may be the next step in providing a platform for passive acoustic monitoring of sperm whales as they operate over large distances for days at a time in any sea condition and have the potential to transmit data via satellite (Moore et al., 2007; Dassatti et al., 2011; Bingham et al., 2012). In light of current technology, understanding of sperm whale bioacoustics, and their habitat preferences, there is ample support for undertaking long-term passive acoustic studies to monitor the population within the EEZ waters in the Perth and Albany canyons in order to inform future marine management and policy decisions. Based on the results of the study, it is recommended that a passive acoustic monitoring program for sperm whales be instigated offshore in the Perth and Albany canyon areas to measure and mitigate the effects of anthropogenic activities and their impacts on cetaceans.
Ethics Statement
Data gathered from sperm whales in Western Australia during the Voyage of the Odyssey expedition were collected under the approval of E2001/0027 granted by Environment Australia and conducted under US National Marine Fisheries Services permit #751-1614 (IK, PI).
Authors Contributions
CJ, GJ, IK, and RP conducted field research on the Voyage of the Odyssey expedition. CJ, HK, and LB conceived of this study. CJ carried out data analyses with assistance from HK, LB, and RP. CJ led the writing of this manuscript with input from GJ, HK, LB, IK, and RP. All authors reviewed and edited the manuscript and approved the final version.
Funding
The Voyage was Odyssey expedition was funded via grants made to the Ocean Alliance—a non-for-profit whale research organization based in the United States. The research manuscript production and Master of Science research thesis the manuscript was based upon, was self-funded by CJ.
Conflict of Interest Statement
The authors declare that the research was conducted in the absence of any commercial or financial relationships that could be construed as a potential conflict of interest.
Acknowledgments
We would like to thank the staff of the Ocean Alliance and crew of the Odyssey who sometimes worked in difficult weather conditions during the Western Australia expedition. Special thanks to Dr John Wise Sr. and the Wise Laboratory at the University of Southern Maine, who provided the genetics results from biopsies taken during the Odyssey expedition; to the secretariat of the International Whaling Commission, especially the head of science, Dr Greg Donovan and Dr Mike Double of the Australian Marine Mammal Centre in Hobart, for providing raw data from the commercial whaling era throughout the southern hemisphere. Danielle LaBruna and Gillian Wolmer of the Wildlife Conservation Society provided the original Townsend (1935) Yankee whaling charts in digital format now sourced via OBIS-SEAMAP. Thanks to Dr Lars Bejder of the Murdoch Cetacean Research Unit for financial support to attend modeling workshops. This research was based on a Master of Science thesis (Johnson, 2013).
References
Alexander, A., Steel, D., Hoekzema, K., Mesnick, S., Engelhaupt, D., Kerr, I., et al. (2016). What influences the worldwide genetic structure of sperm whales (Physeter macrocephalus)? Mol. Ecol. 25, 2754–2772. doi: 10.1111/mec.13638
Anderson, R. C., Clark, R., Madsen, P. T., Johnson, C., Kiszka, J., and Breysse, O. (2006). Observations of Longman's Beaked Whale (Indopacetus pacificus) in the Western Indian Ocean. Aquat. Mamm. 32, 223–231. doi: 10.1578/AM.32.2.2006.223
Bannister, J. L. (1968). An aerial survey for sperm whales off the coast of Western Australia 1963-1965. Mar. Freshw. Res. 19, 31–52.
Bannister, J. L., Josephson, E. A., Reeves, R. R., and Smith, T. D. (2008). “There she blew! Yankee sperm whaling grounds, 1760-1920,” in Oceans Past: Management Insights from the History of Marine Animal Populations, eds D. J. Starkey, P. Holm, and M. Barnard (London: Earthscan), 109–132.
Bannister, J. L., Kemper, C. M., and Warneke, R. M. (1996). The Action Plan for Australian Cetaceans. Canberra, ACT: Australian Nature Conservation Agency. Available online at: http://www.environment.gov.au/system/files/resources/2711a6fd-dbf3-4aad-b79b-14ef6ba2687d/files/whaleplan.pdf
Barlow, J., and Gisiner, R. (2006). Mitigating, monitoring and assessing the effects of anthropogenic sound on beaked whales. J. Cetacean Res. Manag. 7, 239–249.
Barlow, J., and Taylor, B. L. (2005). Estimates of sperm whale abundance in the northeastern temperate Pacific from a combined acoustic and visual survey. Mar. Mamm. Sci. 21, 429–445. doi: 10.1111/j.1748-7692.2005.tb01242.x
Best, B. D., Halpin, P. N., Fujioka, E., Read, A. J., Qian, S. S., Hazen, L. J., et al. (2007). Geospatial web services within a scientific workflow: Predicting marine mammal habitats in a dynamic environment. Ecol. Informat. 2, 210–223. doi: 10.1016/j.ecoinf.2007.07.007
Best, P. B. (1979). “Social organization in sperm whales, physeter macrocephalus,” in Behavior of Marine Animals, eds. H. E. Winn and B. L. Olla (New York, NY: Springer US), 227–289. Available online at: http://www.springer.com/gp/book/9781468429879?wt_mc=ThirdParty.SpringerLink.3.EPR653.About_eBook
Bingham, B., Kraus, N., Howe, B., Freitag, L., Ball, K., Koski, P., et al. (2012). Passive and active acoustics using an autonomous wave glider. J. F. Robot. 29, 911–923. doi: 10.1002/rob.21424
Buckland, S. T., Anderson, D. R., Burnham, K. P., Laake, J. L., Borchers, D. L., and Thomas, L. (2001). Introduction to Distance Sampling: Estimating Abundance of Biological Populations. Available online at: http://www.amazon.co.uk/Introduction-Distance-Sampling-Estimating-Populations/dp/0198509278
Carroll, G., Hedley, S., Bannister, J., Ensor, P., and Harcourt, R. (2014). No evidence for recovery in the population of sperm whale bulls off Western Australia, 30 years post-whaling. Endanger. Species Res. 24, 33–43. doi: 10.3354/esr00584
Cato, D. H., Noad, M. J., and McCauley, R. D. (2005). “Passive acoustics as a key to the study of marine animals,” in Sounds in the Sea: From Ocean Acoustics to Acoustical Oceanography, ed H. Medwin (New York, NY: Cambridge University Press), 411–429.
Clark, R. A., Johnson, C. M., Johnson, G., Payne, R., Kerr, I., Anderson, R. C., et al. (2012). Cetacean sightings and acoustic detections in the offshore waters of the Maldives during the northeast monsoon seasons of 2003 and 2004. J. Cetacean Res. Manag. 12, 227–234.
Clarke, M. R. (1996). Cephalopods as Prey. III. Cetaceans. Philos. Trans. R. Soc. B Biol. Sci. 351, 1053–1065. doi: 10.1098/rstb.1996.0093
Dassatti, A., Van der Schaar, M., Guerrini, P., Zaugg, S., Houégnigan, L., Maguer, A., et al. (2011). “On-board underwater glider real-time acoustic environment sensing,” in OCEANS 2011 IEEE—Spain, 1–8. doi: 10.1109/Oceans-Spain.2011.6003482. Available online at: ieeexplore.ieee.org
De Vos, A., Clark, R., Johnson, C., Johnson, G., Kerr, I., Payne, R., et al. (2012). Cetacean sightings and acoustic detections in the offshore waters of Sri Lanka: March–June 2003. J. Cetacean Res. Manag. 12, 185–193.
Donovan, G. P. (2005). “Cetaceans: can we manage to conserve them? The role of long-term monitoring,” in Long-Term Monitoring—Why, What, Where, When and How, ed J. Solbé (Cork: Sherkin Island Marine Station, Sherkin Island, Co.), 161–174.
Double, M. C., Andrews-Goff, V., Jenner, K. C. S., Jenner, M. N., Laverick, S. M., Branch, T. A., et al. (2014). Migratory movements of pygmy blue whales (Balaenoptera musculus brevicauda) between Australia and Indonesia as revealed by satellite telemetry. PLoS ONE 9:e93578. doi: 10.1371/journal.pone.0093578
Edrén, S. M. C., Wisz, M. S., Teilmann, J., Dietz, R., and Söderkvist, J. (2010). Modelling spatial patterns in harbour porpoise satellite telemetry data using maximum entropy. Ecography (Cop.) 33, 698–708. doi: 10.1111/j.1600-0587.2009.05901.x
Elith, J. H, Graham, C. P, Anderson, R., Dudík, M., Ferrier, S., Guisan, A., et al. (2006). Novel methods improve prediction of species' distributions from occurrence data. Ecography (Cop.) 29, 129–151. doi: 10.1111/j.2006.0906-7590.04596.x
Elith, J., Phillips, S. J., Hastie, T., Dudík, M., Chee, Y. E., and Yates, C. J. (2011). A statistical explanation of MaxEnt for ecologists. Divers. Distrib. 17, 43–57. doi: 10.1111/j.1472-4642.2010.00725.x
Evans, K., and Hindell, M. A. (2004). The diet of sperm whales (Physeter macrocephalus) in southern Australian waters. ICES J. Mar. Sci. 61, 1313–1329. doi: 10.1016/j.icesjms.2004.07.026
Fielding, A. H., and Bell, J. F. (1997). A review of methods for the assessment of prediction errors in conservation presence/absence models. Environ. Conserv. 24, 38–49.
Gavrilov, A. N., McCauley, R. D., Salgado-Kent, C., Tripovich, J., and Burton, C. (2011). Vocal characteristics of pygmy blue whales and their change over time. J. Acoust. Soc. Am. 130, 3651–3660. doi: 10.1121/1.3651817
Gero, S., Gordon, J., and Whitehead, H. (2015). Individualized social preferences and long-term social fidelity between social units of sperm whales. Anim. Behav. 102, 15–23. doi: 10.1016/j.anbehav.2015.01.008
Gordon, J., Matthews, J. N., Panigada, S., Gannier, A., Borsani, J. F., and di Sciara, G. (2000). Distribution and relative abundance of striped dolphins in the Ligurian Sea Cetacean Sanctuary: results from an acoustic collaboration. J. Cetacean Res. Manag. 2, 27–36.
Graham, C. H., Ferrier, S., Huettman, F., Moritz, C., and Peterson, A. T. (2004). New developments in museum-based informatics and applications in biodiversity analysis. Trends Ecol. Evol. 19, 497–503. doi: 10.1016/j.tree.2004.07.006
Gregr, E. J., and Trites, A. W. (2001). Predictions of critical habitat for five whale species in the waters of coastal British Columbia. Can. J. Fish. Aquat. Sci. 58, 1265–1285. doi: 10.1139/f01-078
Griffin, R. B. (1999). Sperm whale distributions and community ecology associated with a warm-core ring off georges bank. Mar. Mamm. Sci. 15, 33–51.
Halpin, P. N., Read, A. J., Best, B. D., Hyrenbach, K. D., Fujioka, E., Coyne, M. S., et al. (2006). OBIS-SEAMAP: developing a biogeographic research data commons for the ecological studies of marine mammals, seabirds, and sea turtles. Mar. Ecol. Prog. Ser. 316, 239–246. doi: 10.3354/meps316239
Halpin, P., Read, A., Fujioka, E., Best, B., Donnelly, B., Hazen, L., et al. (2009). OBIS-SEAMAP: The World Data Center for Marine Mammal, Sea Bird, and Sea Turtle Distributions. Oceanography 22, 104–115. doi: 10.5670/oceanog.2009.42
Hooker, S. K., and Gerber, L. R. (2004). Marine reserves as a tool for ecosystem-based management: the potential importance of Megafauna. Bioscience 54, 27. doi: 10.1641/0006-3568(2004)054[0027:MRAATF]2.0.CO;2
Hooker, S. K., Whitehead, H., and Gowans, S. (1999). Marine protected area design and the spatial and temporal distribution of Cetaceans in a Submarine Canyon. Conserv. Biol. 13, 592–602. doi: 10.1046/j.1523-1739.1999.98099.x
Jaquet, N., Dawson, S., and Douglas, L. (2001). Vocal behavior of male sperm whales: why do they click? J. Acoust. Soc. Am. 109, 2254–2259. doi: 10.1121/1.1360718
Jaquet, N., and Whitehead, H. (1996). Scale-dependent correlation of sperm whale distribution with environmental features and productivity in the South Pacific. Mar. Ecol. Prog. Ser. Oldend. 135, 1–9.
Jaquet, N., Whitehead, H., and Lewis, M. (1996). Coherence between 19th century sperm whale distributions and satellite-derived pigments in the tropical Pacific. Mar. Ecol. Prog. Ser. 145, 1–10.
Johnson, C. M. (2013). Crowdsourcing Modern and Historical Data Identifies Sperm Whale (Physeter macrocephalus) Habitat Offshore of South-Western Australia. Masters Thesis, Murdoch University.
Kasuya, T., and Ohsumi, S. (1966). A Secondary Sexual Character of the Sperm Whale, 20. Science Reports Whales Research Institute, Tokyo, 89–94.
Lewis, T., Gillespie, D., Lacey, C., Matthews, J., Danbolt, M., Leaper, R., et al. (2007). Sperm whale abundance estimates from acoustic surveys of the Ionian Sea and Straits of Sicily in 2003. J. Mar. Biol. Assoc. U.K. 87, 353–357. doi: 10.1017/S0025315407054896
Madsen, P. T., Kerr, I., and Payne, R. (2004). Echolocation clicks of two free-ranging, oceanic delphinids with different food preferences: false killer whales Pseudorca crassidens and Risso's dolphins Grampus griseus. J. Exp. Biol. 207, 1811–1823. doi: 10.1242/jeb.00966
Madsen, P. T., Payne, R., Kristiansen, N. U., Wahlberg, M., Kerr, I., and Møhl, B. (2002). Sperm whale sound production studied with ultrasound time/depth-recording tags. J. Exp. Biol. 205, 1899–1906.
McCauley, R., Bannister, J., Burton, C., Jenner, C., Rennie, S., and Salgado Kent, C. (2004). Western Australian Exercise Area Blue Whale Project. Final Summary Report—Milestone 6. Curtin University - Centre for Marine Science & Technology, Report #2004–29. Available online at: http://cmst.curtin.edu.au/wp-content/uploads/sites/4/2016/05/2004-29.pdf (Accessed 01 August 2016).
McCauley, R. D., and Jenner, C. K. (2010). Migratory Patterns and Estimated Population Size of Pygmy Blue Whales (Balaenoptera musculus brevicauda) Traversing the Western Australian Coast Based on Passive Acoustics. Report SC/62/SH26, International Whaling Commission Scientific Committee.
Mellinger, D., and Barlow, J. (2003). Future Directions for Acoustic Marine Mammal Surveys: Stock Assessment and Habitat Use. NOAA OAR Special Report, Contribution No. 2557, NOAA/PMEL, Springfield, VA. Available online at: http://www.pmel.noaa.gov/pubs/PDF/mell2557/mell2557.pdf
Møhl, B., Wahlberg, M., Madsen, P. T., Heerfordt, A., and Lund, A. (2003). The monopulsed nature of sperm whale clicks. J. Acoust. Soc. Am. 114, 1143–1154. doi: 10.1121/1.1586258
Moore, S. E., Howe, B. M., Stafford, K. M., and Boyd, M. L. (2007). Including whale call detection in standard ocean measurements: application of acoustic seagliders. Mar. Technol. Soc. J. 41, 53–57. doi: 10.4031/002533207787442033
Moors-murphy, H. B. (2014). Deep-Sea Research II Submarine canyons as important habitat for cetaceans, with special reference to the Gully : a review. Deep. Res. Part II 104, 6–19. doi: 10.1016/j.dsr2.2013.12.016
Panigada, S., Lauriano, G., Burt, L., Pierantonio, N., and Donovan, G. (2011). Monitoring winter and summer abundance of cetaceans in the Pelagos Sanctuary (Northwestern Mediterranean sea) through aerial surveys. PLoS ONE 6:e22878. doi: 10.1371/journal.pone.0022878
Pearce, J. L., and Boyce, M. S. (2006). Modelling distribution and abundance with presence-only data. J. Appl. Ecol. 43, 405–412. doi: 10.1111/j.1365-2664.2005.01112.x
Phillips, S. J., Anderson, R. P., and Schapire, R. E. (2006). Maximum entropy modeling of species geographic distributions. Ecol. Modell. 190, 231–259. doi: 10.1016/j.ecolmodel.2005.03.026
Phillips, S. J., and Dudík, M. (2008). Modeling of species distributions with Maxent: new extensions and a comprehensive evaluation. Ecography (Cop.) 31, 161–175. doi: 10.1111/j.0906-7590.2008.5203.x
Phillips, S. J., Dudík, M., Elith, J., Graham, C. H., Lehmann, A., Leathwick, J., et al. (2009). Sample selection bias and presence-only distribution models: implications for background and pseudo-absence data. Ecol. Appl. 19, 181–197. doi: 10.1890/07-2153.1
Pirotta, E., Matthiopoulos, J., MacKenzie, M., Scott-Hayward, L., and Rendell, L. (2011). Modelling sperm whale habitat preference: a novel approach combining transect and follow data. Mar. Ecol. Prog. Ser. 436, 257–272. doi: 10.3354/meps09236
Redfern, J. V., Ferguson, M. C., Becker, E. A., Hyrenbach, K. D., Good, C., Barlow, J., et al. (2006). Techniques for cetacean-habitat modeling. Mar. Ecol. Prog. Ser. 310, 271–295. doi: 10.3354/meps310271
Rendell, L., and Whitehead, H. (2004). Do sperm whales share coda vocalizations? Insights into coda usage from acoustic size measurement. Anim. Behav. 67, 865–874. doi: 10.1016/j.anbehav.2003.04.018
Rendell, L., Whitehead, H., and Escribano, R. (2004). Sperm whale habitat use and foraging success off northern Chile: evidence of ecological links between coastal and pelagic systems. Mar. Ecol. Prog. Ser. 275, 289–295. doi: 10.3354/meps275289
Rennie, S., Hanson, C. E., McCauley, R. D., Pattiaratchi, C., Burton, C., Bannister, J., et al. (2009). Physical properties and processes in the Perth Canyon, Western Australia: Links to water column production and seasonal pygmy blue whale abundance. J. Mar. Syst. 77, 21–44. doi: 10.1016/j.jmarsys.2008.11.008
Rennie, S. J., McCauley, R. D., and Pattiaratchi, C. B. (2006). Thermal structure above the Perth Canyon reveals Leeuwin Current, Undercurrent and weather influences and the potential for upwelling. Mar. Freshw. Res. 57, 849–861. doi: 10.1071/MF05247
Roberts, J. J., Best, B. D., Dunn, D. C., Treml, E. A., and Halpin, P. N. (2010). Marine geospatial ecology tools: an integrated framework for ecological geoprocessing with ArcGIS, Python, R, MATLAB, and C++. Environ. Model. Softw. 25, 1197–1207. doi: 10.1016/j.envsoft.2010.03.029
Savery, L. C., Evers, D. C., Wise, S. S., Falank, C., Wise, J., Gianios, C., et al. (2013a). Global mercury and selenium concentrations in skin from free-ranging sperm whales (Physeter macrocephalus). Sci. Total Environ. 450–451, 59–71. doi: 10.1016/j.scitotenv.2013.01.070
Savery, L. C., Wise, J. T. F., Wise, S. S., Falank, C. Jr., C. G Thompson, W. D., Perkins, C., et al. (2014). Global assessment of arsenic pollution using sperm whales (Physeter macrocephalus) as an emerging aquatic model organism. Comp. Biochem. Physiol. C Pharmacol. Toxicol. Endocrinol. 163, 55–63. doi: 10.1016/j.cbpc.2014.01.003
Savery, L. C., Wise, S. S., Falank, C., Wise, J., Gianios, C. Jr., Thompson, W. D., et al. (2013b). Global assessment of silver pollution using sperm whales (Physeter macrocephalus) as an indicator species. J. Env. Anal. Toxicol. 3, 525–2161. doi: 10.4172/2161-0525.1000169
Smith, J., Grantham, H., Gales, N., Double, M., Noad, M., and Paton, D. (2012). Identification of humpback whale breeding and calving habitat in the Great Barrier Reef. Mar. Ecol. Prog. Ser. 447, 259–272. doi: 10.3354/meps09462
Smith, T. D., Reeves, R. R., Josephson, E. A., and Lund, J. N. (2012). Spatial and seasonal distribution of American whaling and whales in the age of sail. PLoS ONE 7:e34905. doi: 10.1371/journal.pone.0034905
Taylor, B. L., Baird, R., Barlow, J., Dawson, S. M., Ford, J., Mead, J. G., et al. (2008). Physeter macrocephalus. The IUCN Red List of Threatened Species 2008: e.T41755A10554884. Available online at: http://dx.doi.org/10.2305/IUCN.UK.2008.RLTS.T41755A10554884.en
Thorne, L. H., Johnston, D. W., Urban, D. L., Tyne, J., Bejder, L., Baird, R. W., et al. (2012). Predictive modeling of spinner dolphin (Stenella longirostris) resting habitat in the main Hawaiian Islands. PLoS ONE 7:e43167. doi: 10.1371/journal.pone.0043167
Torres, L. G., Smith, T. D., Sutton, P., MacDiarmid, A., Bannister, J., and Miyashita, T. (2013). From exploitation to conservation: habitat models using whaling data predict distribution patterns and threat exposure of an endangered whale. Divers. Distrib. 19, 1138–1152. doi: 10.1111/ddi.12069
Townsend, C. H. (1935). The distribution of certain whales as shown by logbook records of American whaleships. Zoologica 19, 1–50.
Wahlberg, M. (2002). The acoustic behaviour of diving sperm whales observed with a hydrophone array. J. Exp. Mar. Bio. Ecol. 281, 53–62. doi: 10.1016/S0022-0981(02)00411-2
Watwood, S. L., Miller, P. J. O., Johnson, M., Madsen, P. T., and Tyack, P. L. (2006). Deep-diving foraging behaviour of sperm whales (Physeter macrocephalus). J. Anim. Ecol. 75, 814–825. doi: 10.1111/j.1365-2656.2006.01101.x
Whitehead, H. (2002). Estimates of the current global population size and historical trajectory for sperm whales. Mar. Ecol. Prog. Ser. 242, 295–304. doi: 10.3354/meps242295
Whitehead, H. (2003). Sperm Whales: Social Evolution in the Ocean. Chicago, IL: University of Chicago Press.
Whitehead, H., and Gordon, J. (1986). Methods of obtaining data for assessing and modeling population of sperm whales which do not depend on catches. Rep. Int. Whaling Comm. (Special Issue 8), 149–166.
Whitehead, H., and Weilgart, L. (2000). “The sperm whale: social females and roving males,” in Cetacean Societies: Field Studies of Dolphins and Whale, eds J. Mann, R. C. Connor, P. L. Tyack, and H. Whitehead (Chicago, IL: The University of Chicago Press), 154–172.
Whiteway, T. G. (2009). Australian Bathymetry and Topography Grid. Canberra, ACT: Geoscience Australia.
Williams, R., Hedley, S. L., and Hammond, P. S. (2006). Modeling distribution and abundance of Antarctic Baleen Whales using ships of opportunity. Ecol. Soc. 11:1. Available online at: http://www.ecologyandsociety.org/vol11/iss1/art1/
Wise, J. P., Payne, R., Wise, S. S., LaCerte, C., Wise, J., Gianios, C., et al. (2009). A global assessment of chromium pollution using sperm whales (Physeter macrocephalus) as an indicator species. Chemosphere 75, 1461–1467. doi: 10.1016/j.chemosphere.2009.02.044
Keywords: sperm whales, Physeter macrocephalus, Voyage of the Odyssey, bioacoustics, species distribution model, Maxent, crowdsourcing, south-western Australia
Citation: Johnson CM, Beckley LE, Kobryn H, Johnson GE, Kerr I and Payne R (2016) Crowdsourcing Modern and Historical Data Identifies Sperm Whale (Physeter macrocephalus) Habitat Offshore of South-Western Australia. Front. Mar. Sci. 3:167. doi: 10.3389/fmars.2016.00167
Received: 30 June 2016; Accepted: 30 August 2016;
Published: 15 September 2016.
Edited by:
Rob Harcourt, Macquarie University, AustraliaReviewed by:
Clive Reginald McMahon, Sydney Institute of Marine Science, AustraliaGail Schofield, Deakin University, Australia
Copyright © 2016 Johnson, Beckley, Kobryn, Johnson, Kerr and Payne. This is an open-access article distributed under the terms of the Creative Commons Attribution License (CC BY). The use, distribution or reproduction in other forums is permitted, provided the original author(s) or licensor are credited and that the original publication in this journal is cited, in accordance with accepted academic practice. No use, distribution or reproduction is permitted which does not comply with these terms.
*Correspondence: Christopher M. Johnson, chris.johnson.au@gmail.com