In situ Measurements and Model Estimates of NO3 and NH4 Uptake by Different Phytoplankton Size Fractions in the Southern Benguela Upwelling System
 J. Ffion Atkins
 Coleen L. Moloney2
 - 1Department of Oceanography, Marine Research Institute, University of Cape Town, Cape Town, South Africa
- 2Department of Biological Sciences, Marine Research Institute, University of Cape Town, Cape Town, South Africa
- 3Department of Agriculture, Forestry and Fisheries, Cape Town, South Africa
- 4Council for Scientific and Industrial Research, Cape Town, South Africa
Bulk measurements can be made of phytoplankton standing stocks on a quasi-synoptic scale but it is more difficult to measure rates of production and nutrient uptake. We present a method to estimate nitrogen uptake rates in productive coastal environments. We use observed phytoplankton cell size distributions and ambient nitrogen concentrations to calculate uptake rates of nitrate, ammonium and total nitrogen by different size fractions of diverse phytoplankton communities in a coastal upwelling system. The data are disaggregated into size categories, uptake rates are calculated and these uptake rates are reaggregated to obtain bulk estimates. The calculations are applied to 72 natural assemblages for which nitrogen uptake rates and particle size distributions were measured in situ. The calculated values of total N uptake integrated across all size classes are similar to those of in situ bulk measurements (N slope = 0.90), (NH4 slope = 0.96) indicating dependence of NH4 and total N uptake on ambient N concentrations and cell size distributions of the phytoplankton assemblages. NO3 uptake was less well explained by cell size and ambient concentrations, but regressions between measured and estimated rates were still significant. The results suggest that net nitrogen dynamics can be quantified at an assemblage scale using size dependencies of Michaelis-Menten uptake parameters. These methods can be applied to particle size distributions that have been routinely measured in eutrophic systems to estimate and subsequently analyse variability in nitrogen uptake.
1. Introduction
The diversity of phytoplankton communities influences the flows of carbon, nitrogen and other important elements through the marine environment. Marine ecosystem models that aim to capture this relationship represent phytoplankton diversity either by different functional groups (Follows and Dutkiewicz, 2011), cell size (e.g., Moloney et al., 1991; Baird and Suthers, 2007; Banas, 2011; Ward et al., 2012) or by both (Le Quéré et al., 2005). Our understanding of the consequences of this diversity on global biogeochemistry is still limited (Lomas et al., 2014). In a broad ecological context, in addition to taxonomic distinction, the term diversity currently includes functionality within an environment (Tilman, 2001; McGill et al., 2006; Westoby and Wright, 2006; Litchman et al., 2007). A challenge in biogeochemical modeling is to try account for diversity among organisms and its role in nutrient flux (Follows and Dutkiewicz, 2011), plasticity in organism traits (Pahlow and Oschlies, 2009), trade-offs in energy expenditure and the relationships between physiological traits and environmental forcing (Aksnes and Cao, 2011). The most commonly used function to model nutrient uptake is the Michaelis-Menten equation and parameter values for maximum uptake rates (Vmax) and half saturation constants (Ks) are widely available in the literature (see Litchman et al., 2015), often resolved at the species level in batch/continuous cultures (e.g., Eppley et al., 1969) and see Edwards et al. (2014) and typically at a genus level from natural populations (see Collos et al., 2005). The variation in Vmax and Ks within phytoplankton groups and in relation to cell size were extensively reviewed by Litchman et al. (2007) and Edwards et al. (2012), where large variation was evident between and within phylogenetic groups. Ks values, for example, were found to vary over two orders of magnitude for a given group (Collos et al., 2005; Franks, 2009; Seeyave et al., 2009; Aksnes and Cao, 2011). Collos et al. (2005) found strong genus-specific differences in Ks between Thalassiosira and Chaetoceros, both diatoms, under similar nutrient levels. Absolute values of Vmax and their range are highest in diatoms, whereas Ks values are highest in dinoflagellates (Litchman et al., 2007; Edwards et al., 2012). The paucity of Ks values to account for all genotypic diversity in natural assemblages, under variable environmental conditions, as well as computational costs, has meant that Ks is often regarded a constant. The assumption that these parameter values are invariant within phylogenetic groups has been highlighted as a potential source of error when parameterizing nutrient uptake by Michaelis-Menten kinetics (Franks, 2009).
Several studies have aimed to quantify the dynamic physiological response of phytoplankton cells to changing environmental conditions (e.g., Smith and Yamanaka, 2007; Pahlow et al., 2008; Bonachela et al., 2011; Smith et al., 2011) and have improved our conceptual understanding of cellular constraints on nutrient uptake and growth. Such dynamic trait-based approaches have been incorporated into large-scale modeling studies (Arteaga et al., 2014), with improved agreement between in situ values and model output (Smith et al., 2015). In many situations, the necessary in situ data are not available to constrain the dynamic response of a diverse, natural assemblage within a realistic, local context. Relatively simple size-based models can adequately replicate large scale dynamics of nitrogen in the marine environment (Ward et al., 2012; Acevedo-Trejos et al., 2014) with the advantage of reducing the number of free parameters, and thus model uncertainty, by using size-scaling exponents (Baird and Suthers, 2007; Banas, 2011; Ward et al., 2012). The size structure of plankton assemblages and the dominant size fraction will dictate, to some degree, the pathways of nutrients and how they are transferred to higher trophic levels (Probyn et al., 1990; Moloney et al., 1991; Chisholm, 1992; van der Lingen et al., 2006). Litchman et al. (2007) found strong empirical relationships between organism size and physiological rates (Vmax and Ks) and considered cell size a master trait. Our understanding of the variability in uptake kinetic parameters in relation to community composition and environmental variability is poor, and there is a need for field-based and laboratory studies of physiological processes of phytoplankton groups (Gregg et al., 2003; Litchman et al., 2007; Allen and Fulton, 2010).
This study hypothesized that some of the variance in Michaelis-Menten parameter values can be accounted for by considering the size spectra of the phytoplankton populations. To test such an hypothesis, we used measured particle size distributions (from Beckman Coulter Counter data) to calculate sets of theoretical, size-based biomass and Michaelis-Menten parameters for different field samples. We applied ambient nitrogen concentrations from each sample to Michaelis-Menten models to estimate size-based nitrogen uptake rates and integrated these across all sizes for the sample. These calculated rates were subsequently compared to measured in situ bulk uptake rates to estimated uptake rates of NO3, NH4 and total N (total N = NO3 + NH4). This research offers a tool to extend the application of pre-existing particle cell size distributions, relying on robust assumptions of the size dependence of nitrogen metabolism.
2. Methods
2.1. In situ Data Collection
Data from three separate case studies were used, data from Lamberts Bay were taken from a fixed station (32°05.020′S, 18°16.010′E) at 0 m, 3.5 km off Lamberts Bay, as daily samples during the periods 25 February–11 March 2004 and 15 March–6 April 2005. In Saldanha Bay, sampling took place at a fixed station (33°01.748′ S, 18°00.888′ E) from 0, 3, 6, and 9 m, every 2 months for a period of 3 days from January 2012 to January 2013. Water samples were collected using a 5 L Niskin water sampler and stored in 20 L black buckets, which were then transported to the laboratory within 1–2 h of collection for the determinations of particle size distributions, nutrient concentrations, 15N uptake and particulate nitrogen calculations. Methods employed in all three case studies were consistent, unless stipulated otherwise. Data from the different systems within the Benguela ecosystem were chosen to try obtain a good spread in biomass and uptake rate values.
2.1.1. Cell Size Distributions and Community Structure
Particle size distributions (PSDs) of samples were measured using a Beckman Multisizer 4 Coulter Counter. A discrete sample volume of 40 mL was used to count particles per size class and was blank corrected by 0.2 μm filtered seawater. An aperture size of 140 μm was used, with a capacity to measure particles from 2 to 86 μm. Confidence in measurements below 5 μm is significantly reduced, and thus such values are omitted from particle size spectra. Dominant species were identified using inverted microscopy following Utermohl (1958).
2.1.2. 15N Uptake
One liter from each sample was spiked with 15N-labeled NH4Cl or NaNO3 (BOC Limited, isotope assay 99%) in acid-cleaned polycarbonate bottles. Spike concentrations were approximately 0.1 μmol 15N L−1 for NH4 and varied between 0.04 and 2 μmol 15N L−1 for NO3, depending on estimations of in situ NO3 concentrations from temperature. Incubations were carried out in situ at the corresponding depth of collection, using a custom-made rig for 4 h in Lamberts Bay and for 24 h in Saldanha Bay. The differences between the two incubation times has been accounted for by scaling the 4 h incubations to 24 h. The assumption was made that daylight was 14 h and that uptake during the night was 55% of daylight rate for NH4 and 12% of daylight rate of NO3 uptake, as measured at in-shore locations in Probyn et al. (1996). Incubations were terminated by filtration onto Whatman GF/F filters approximately 30 min after retrieval. Filters were rinsed with artificial seawater and Milli-Q to flush dissolved isotopes from the filter matrix and dried at 75°C overnight before storage. Nitrogen uptake rates were calculated using post-incubation particulate N concentrations, which accounts for uptake of unlabeled nutrient sources (Dugdale and Wilkerson, 1986). Ammonium uptake rates are not corrected for isotope dilution and thus represent an underestimate. Incubations were terminated by filtration on 47 mm ashed GF/F filters, which were washed with artificial sea water and Milli-Q and then dried at 60°C overnight. Samples were punched out of each filter (disc size depending on organic coverage) and particulate 15N concentrations were measured on a Finnigan MAT mass spectrometer (Department of Archeometry, University of Cape Town). The filtrate was used for nutrient analysis of ambient concentrations at the end of the incubation.
2.1.3. Nutrient Analyses
Nitrogenous nutrient concentrations were measured manually after filtration through Whatman GF/F filters. All nutrient analyses were initiated immediately on return to the shore within 1.5 h of collection. Ammonium (NH4) was analyzed according to the methods described in Koroleff (1983) scaled down to 5 mL samples, and nitrate (NO3) following the procedure of Nydahl (1976).
2.2. Model Setup
Theoretical uptake rates were calculated from measured in situ PSDs and ambient nitrogen concentrations. Details of each step are discussed further below. In brief,
1. Measured PSDs were converted to a biomass per size bin by assuming spherical shapes and a volume to nitrogen conversion (Moloney and Field, 1989; Menden-Deuer and Lessard, 2000). The sum of the estimated biomasses per size bin was compared to a corresponding in situ measurement of particulate nitrogen (PN).
2. Uptake parameters (Vmax and Ks) were calculated per size bin, using published relationships in Ward et al. (2012). A Michaelis-Menten model was used to estimate absolute uptake rates (ρ) of NO3 and NH4 in μ mol L−1 h−1 for each size bin, using ambient nutrient concentrations.
3. The sums of the estimated uptake rates per size bin (ρ NO3 and ρ NH3) were compared to corresponding in situ uptake measurements. The implications of the assumptions of each step are evaluated in the discussion.
2.2.1. Conversions to Biomass
Measured biomass of particulate nitrogen (μmol L−1) includes all particulate matter down to a cut-off nominal size of 0.7 μm (GF filter), whereas Coulter Counter measurements have a lower limit of 3 μm. A comparison between a linear (Moloney and Field, 1989) and non-linear (Menden-Deuer and Lessard, 2000) conversion from cell volume to biomass was carried out. Cellular nitrogen content was calculated per size bin and total biomass per size bin was calculated by multiplying by cell abundance (N) within each size bin. Carbon biomass was also calculated using (Moloney and Field, 1989), as a carbon biomass is required in addition to nitrogen biomass to solve for size-dependent uptake parameters. The non-linear equation follows that of Menden-Deuer and Lessard (2000):
Linear conversion follows (Moloney and Field, 1989) where 1 μm3 = 0.071 pgC (dry) and 1 μm3 = 0.0185 pgN (dry).
2.2.2. Uptake Parameters
Size-dependent uptake parameters, Vmax (μmolN μmolC−1 h−1) and Ks (μmolN L−1), were calculated per size bin using general allometric equations (aVolb) with values a and b from Ward et al. (2012) (Table 1 and Figure 1). Conversions of units were carried out by normalizing to carbon, calculated using the linear conversion to carbon (Moloney and Field, 1989).
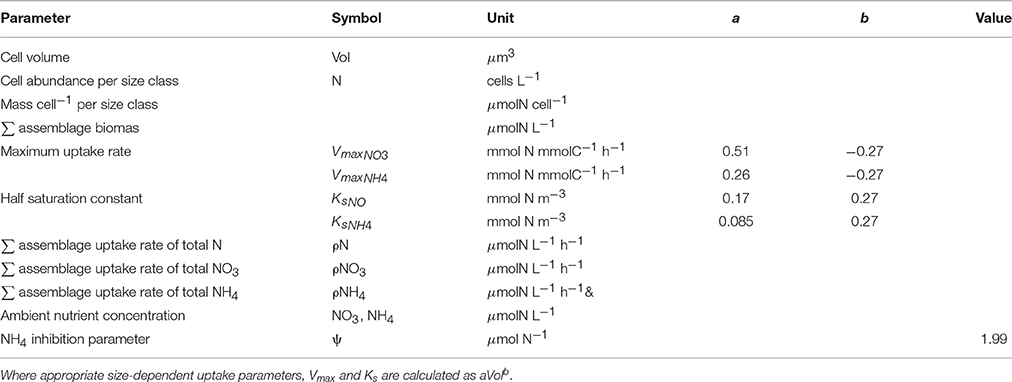
Table 1. Parameters and their units used to estimate biomass and uptake rates from measured particle size distributions.
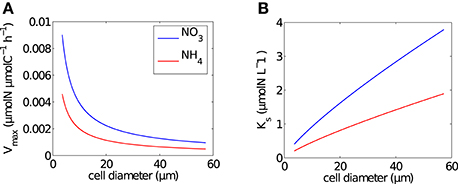
Figure 1. Size dependence of Michaelis-Menten uptake parameters. (A) Mass-specific maximum uptake rate (Vmax) and (B) half saturation constant (Ks), calculated using the formulations of Ward et al. (2012) per cell in each size bin for NO3 (blue line) and NH4 (red line).
2.2.3. Estimating Uptake Rates
The size-dependent parameters were applied to the Michaelis-Menten equation to calculate nitrogen uptake rate for each size bin, using nitrogen biomass per size bin and ambient nitrogen concentrations. The NO3 taken up by the assemblage was calculated by summing across all size bins:
where PN is the nitrogen biomass of the cells per size bin and NO3 to ambient concentration. The corresponding equation was used to calculate NH4 uptake. Estimated uptake rates are compared to the relative measured in situ N uptake. The inhibition of NO3 by ambient NH4 concentrations was also incorporated into separate estimations of ρNO3:
Total nitrogen uptake was calculated both with and without an inhibition term, Equation (4) details total N uptake with inhibition:
Further comparisons were made between measured, mass-specific uptake rates (v) and non-allometric rates. Mass-specific uptake rates were calculated by dividing the bulk absolute rate by the corresponding measured nitrogen biomass (PN). The non-allometric rates were calculated using a fixed Vmax and Ks value for all bins along the size spectrum. Sensitivity of the parameter values was tested by comparing the outcome of 9 combinations of realistic values for NO3: Vmax = [0.1, 0.5, 1], Kmax = [0.5, 2, 15]; and NH4: Vmax = [0.1, 0.5, 1] and Ks = [0.1, 1, 10]. All parameter units and values used are detailed in Table 1. Assessments were made between measured and estimated values of uptake rates of NO3, NH4 and total N by using an absolute percentage difference and bias estimates (Zibordi et al., 2004).
3. Results
3.1. In situ
The range of values for measured particulate nitrogen, ambient nitrogen concentrations and uptake rates vary among the three case studies (Figure 2). This variability reflects distinct assemblages observed in each case study. Highest values of particulate nitrogen (PN) were observed in Lamberts Bay (LB04 and LB05) relative to Saldanha Bay. LB05 was dominated by a dinoflagellate Prorocentrum triestinum with maximum particulate nitrogen reaching 146 μmol N L−1, in association with lowest ambient nitrogen concentrations. SB samples had relatively low biomass (average 10.3 μmol N L−1), almost completely dominated by diatoms. Highest field-measured uptake rates of total nitrogen (Figure 3A) and nitrates (Figure 3B) were seen in LB04, corresponding to an assemblage dominated by a ciliate (Myrionecta rubra) and a diatom (Skeletonema spp.) with a maximum of 0.67 μmol N L−1h−1. Rates of NH4 uptake were lower on average than NO3 uptake in all case studies (Figure 3C). The size spectra measured were highly variable per sample. Figures 4A,C,E show typical size distributions of a low biomass range, and Figures 4B,D,F show samples of high biomass, illustrating distributions of bimodality.
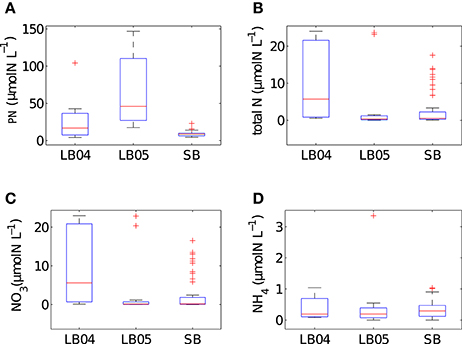
Figure 2. Summary box plots of the in situ data from Lamberts Bay 2004 and 2005 (LB04, LB05) and Saldanha Bay (SB) for (A) particulate nitrogen, (B) total N (NO3 + NH4), (C) NO3 (D) NH4 concentrations. Boxes are medians, 25th and 75th quartiles and whiskers are extreme values not considered outliers, which are shown as crosses. SB (n = 52), LB04 (n = 9), LB05 (n = 11).
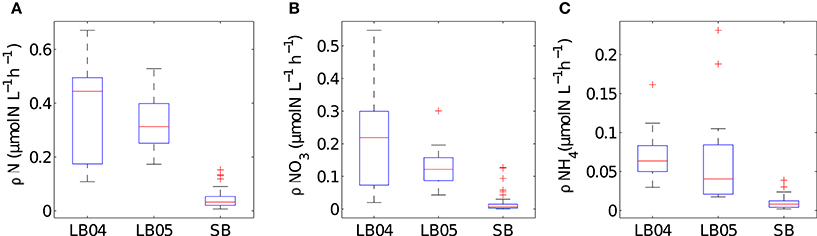
Figure 3. Summary plots of in situ measured uptake rates for (A) total nitrogen (B) NO3 and (C) NH4 for the different case studies (LB04, LB05, SB). Boxes are medians, 25th and 75th quartiles and whiskers are extreme values not considered outliers, which are shown as crosses. SB (n = 52), LB04 (n = 9), LB05 (n = 11).
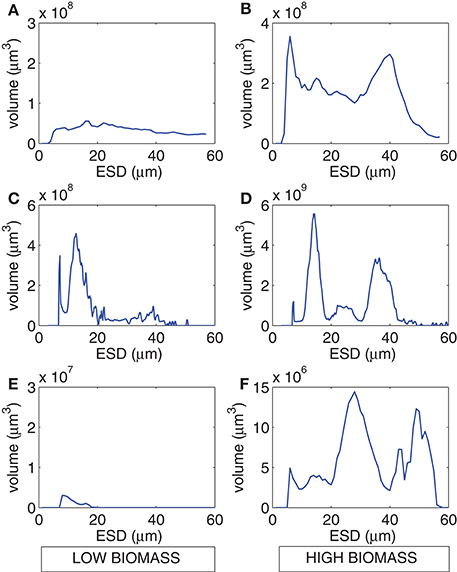
Figure 4. Example size spectra from the Coulter Counter for low biomass (left panels) and high biomass (right panels) for (A,B) LB04, (C,D) LB05, and (E,F) SB sample periods.
3.2. Conversions to Biomass
The two methods of conversion from cell volume to mass gave estimates of particulate nitrogen that were significantly correlated with measured in situ values (Figure 5). For the combined data set (SB and LB), the correlation for the non-linear conversion was r = 0.78, p < 0.005 and for the linear conversion r = 0.76, p < 0.005. The two regressions comparing measured in situ and estimated particulate nitrogen using the linear and non-linear conversion methods were assessed by testing H0: slope = 1 (Table 2). The regression slopes for the linear and non-linear conversions were greater than one, but were not significantly different; linear (t0.05, 72 = 3.65, p = 0.99) and non-linear (t0.05, 72 = 3.33, p = 0.99). Both slopes provided good predictions of biomass from particle size distributions and both conversion methods. The non-linear conversion of Menden-Deuer and Lessard (2000) was used in further estimates of uptake rates.
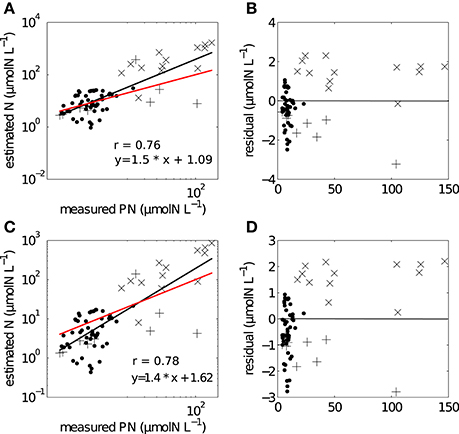
Figure 5. Regression analysis showing the relationships between measured and estimated particulate nitrogen using (A) non-linear conversion, with (B) corresponding log residuals, (C) linear conversion with (D) corresponding log residuals. Black line refers to fitted regression line, red line has a hypothetical slope of 1:1 such that measured = estimated values. (• SB), (+ LB04), (x LB05).
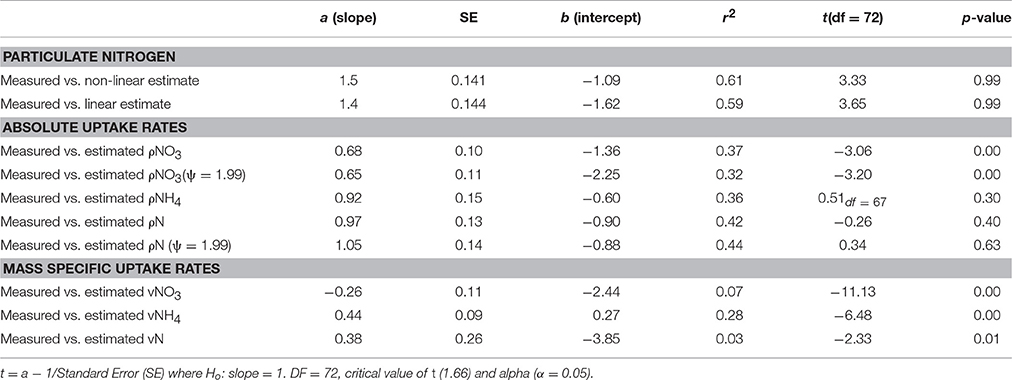
Table 2. Comparison of the strength of the correlation and t-test values between in situ measured and calculated uptake rates of NO3, NH4 and total N.
3.3. Estimating Nitrogen Uptake
The ranges of estimated N uptake rates were similar to those measured in situ (Figure 6). Predictions of nitrogen uptake rates were significantly correlated with respective measured uptake rates: NO3 (r = 0.60, p < 0.005); NH4 (r = 0.61, p < 0.005) and total N (r = 0.67, p < 0.005). The slopes of the relationship between measured and estimated uptake rate values were also assessed testing H0:slope = 1 (Table 2). The regression slopes were not statistically different from 1 for NH4 (t0.05, 67 = −0.26 =, p = 0.30) and total N (t0.05, 72 = −0.26, p = 0.40); this was not the case for NO3(t0.05, 72 = −3.06, p = 0.00). An inhibition term (ψ) of 1.99 μmol N−1 was estimated for NO3 uptake. The resulting predictions for ρNO3 were similar to those of ρNO3 with no inhibition, with a increase in bias when inhibition is included (bias ρNO3 = 0.03, bias ρNO3ψ = −0.72). Predictions of total N uptake do not differ greatly when an inhibition term is applied; ρN (slope = 0.97), ρNψ(slope = 1.05) (Table 2) but more bias is introduce with an inhibition term (ρNψ = −0.89, bias ρN = −1.10). Estimations for ρNO3 (both with and without an inhibition term) did not match those measured in situ (Table 2). The comparisons between measured and calculated mass-specific rates showed poor agreement, and no statistical similarity was observed between the two data sets (Table 2). The relationships between estimated and measured ρNH4, ρN and ρNψ are not statistically different (Table 2) and are thus considered good predictions of the uptake of NH4 and total N. The non-allometric rates were also compared with each other and a hypothetical 1:1 slope (Figure 7). Of the 9 different combinations of uptake parameters tested (H0 slope = 1), one set was close to 1 but not statistically significant (slope = 0.96, p < 0.00) for NO3, and 2 sets for NH4, the closest being significantly similar to 1 (slope = 1.2, p = 0.78) (Table 3).
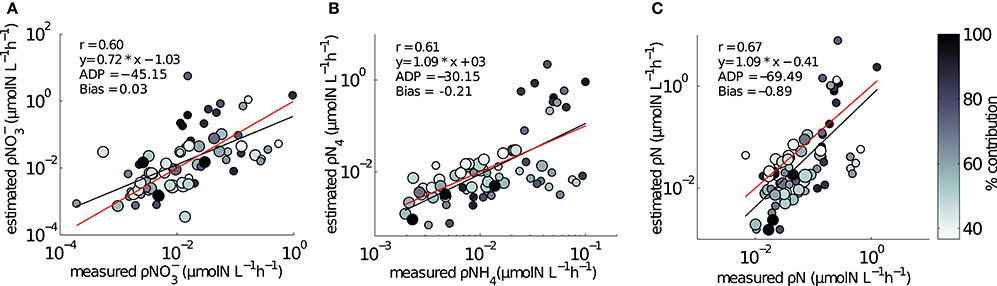
Figure 6. Comparisons between in situ measured and model estimated uptake rates using size dependent Vmax and Ks from Ward et al. (2012). (A) ρNO3 (B) ρNH4, (C) ρN. Symbol size is representative of two size groups: small circle is < 15μm; large circle is 15–30 μm. The third, largest size group of 30–60 μm did not dominate uptake rates in any of the samples. Colorbar represents the percentage contribution to the bulk uptake rate by the dominant size group. Red line is a hypothetical 1:1 slope, black line is the regression between measured and model uptake rates.
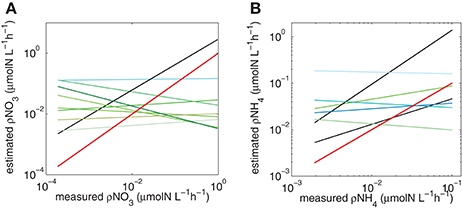
Figure 7. Trendlines for each combination of Vmax and Ks for (A) NO3 and (B) NH4. Red line is the hypothetical 1:1 slope, black lines represent slopes that are closest to 1 (see Table 3).
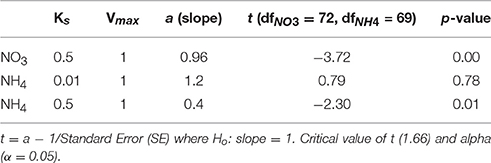
Table 3. The combination of uptake parameters (Vmax and Ks) that resulted in the regression slope closest to 1.
4. Discussion
Predictions of biomass and nitrogen uptake rates were made using measured particle size distributions of natural assemblages, volume to biomass conversions (Menden-Deuer and Lessard, 2000) and size-dependent Michaelis-Menten uptake parameters (Ward et al., 2012). The in situ values used to validate the modeled values had a large range and thus a large spread existed in the data. There were good correlations between estimated and measured particulate N. This strong correlation gave necessary confidence in using particle size distributions derived from the Beckman Coulter Counter to predict the uptake rates of NH4, total N and to a lesser extent NO3. Significant correlations were found between modeled and in situ measured uptake rates and the values predicted for the uptake of NH4 and total N were statistically similar to values measured in situ.
4.1. Conversions to Biomass
Both conversion models used to derive particulate nitrogen from particle size distributions (via non-linear or linear functions) yield similar results with a good correlation between estimated and measured values. The regression equations used to estimate biomass were applied to all assemblages, which were most often mixed assemblages, i.e., containing dinoflagellates (LB05), ciliates (LB04), and diatoms (SB). LB05 had a high percentage of the dinoflagellate Prorocentrum triestinum at very high biomass (max. 146 μmol N L−1), and the correlation coefficients for this particular data set are strongest. Even so, when applied to assemblages containing different taxa (ciliates or diatoms), overall the conversion factors performed well and the regression fit is close to a 1:1 relationship between measured and estimated nitrogen biomass. An even better fit may have resulted if group-specific conversion factors were used, but such empirical relationships for volume:nitrogen of the groups measured in this study were not found in the literature. It is noted that diatoms, for example, contain less carbon per unit volume than other groups, attributed to their significantly higher vacuole volume (Strathmann, 1967; Sicko-Goad et al., 1984). Cellular nitrogen content or nitrogen stores have also been observed to vary considerably between different species of phytoplankton (Parsons et al., 1961; Dortch et al., 1984).
Further errors could have been introduced by the assumptions made in deriving particle size distributions via a Coulter Counter, which assumes sphericity of cells. This could lead to underlying bias because of non-spherical groups (e.g., dinoflagellates) or particles of elongate shape, e.g., chain-forming diatoms, which are known to introduce error and can lead to an under/overestimation of total volume (Boyd and Johnson, 1995). Furthermore, the Coulter Counter measures down to 2 μm diameter (with confidence from 5 μm) and thus omits the submicron range due to limitations in technical capabilities. Nevertheless, the Coulter Counter has been used in several studies to successfully derive volume to carbon ratios (Mullin et al., 1966; Strathmann, 1967; Montagnes et al., 1994) and the presented results provide confidence that such data can adequately represent the particulate biomass of the nitrogen inventory in natural, diverse assemblages in eutrophic systems, characterized by large cells and high biomass.
The data presented here show that particle size distributions convert well to a measure of biomass, despite the broad scale application of a dinoflagellate volume:nitrogen conversion to mixed assemblages, the exclusion of submicron size ranges, and the assumptions of sphericity when using the Coulter counter. It has been noted that quantitative measurements of particulate carbon/nitrogen are in general lacking (Behrenfeld and Boss, 2006), and we suggest tha Coulter Counter derived PSDs can provide adequate measures of nitrogen biomass, most notably, when examining communities in eutrophic systems. Such conversions may not be as successful in oligotrophic areas, where cell size distributions are characteristically dominated by pico/nano plankton (<2 μm), but would need further investigation.
4.2. Estimating Uptake Rates
A significant correlation exists between the estimated and measured uptake rates of NO3, NH4 and total N, for natural assemblages. The slopes of the regressions for the estimated vs. measured values of NH4 and total N uptake were close to 1, indicating statistical similarity to what was measured in situ. The size-dependence of the Michaelis-Menten uptake parameters, Vmax and Ks, used by Ward et al. (2012) proved to be adequate values and yielded comparable results of nitrogen uptake to what had been measured in situ. Several studies have called into question the adequacy of the Michaelis-Menten kinetics equation to describe nutrient uptake in phytoplankton (Droop, 1974; Pasciak and Gavis, 1974; Aksnes and Egge, 1991). These criticisms are based on the premise that the equation does not account for differences in uptake rates in limiting or non-limiting conditions (Rhee, 1974; Grover, 1991), or that internal stores of nutrients can dictate uptake based on simple diffusion limitation (Droop, 1974). Both Michaelis-Menten uptake parameters are subject to variability, not only in different species but due to differences in nutrient availability and varying environmental conditions (Lomas and Glibert, 1999; Collos et al., 2005 and references therein). Smith et al. (2009) suggest that optimal uptake kinetics, which accounts for physiological acclimation to fluctuating environmental conditions, is a superior alternative to standard Michaelis-Menten descriptions of Vmax and Ks. A flexible phytoplankton functional type (FlexPFT) model (Smith et al., 2015), which resolves the dynamic response of phytoplankton communities, which was able to reproduce productivity and chlorophyll values of two contrasting time series better than when no flexible response was included. Thus, the limitations of Michaelis-Menten are recognized, more particularly in its assumption that parameter values are constant during environmental fluctuations. However, its use will most likely remain popular due its simplicity and the availability of parameter values in the literature. The variability of in situ measured uptake rates of NH4 and total N is statistically matched by the variability in what was estimated using size-scaled parameters, which implies that much of the variability in Michaelis-Menten parameters, when applied at an assemblage scale, can be accounted for by simple size scaling of Vmax and Ks. The results also imply that net community rates of NH4 and total nitrogen uptake are driven by ambient concentrations and cell size.
As expected, the case for NO3 was more complex. Although the slope of the estimated ρNO3 was positive and close to 1, statistically it was not significant and reveals the potential importance of other influencing factors, in addition to cell size and ambient concentration. The suppression of NO3 uptake by NH4 may explain some of the variability observed in in situ measured values that is not accounted for in the model estimates. Numerous studies have shown an interaction between NH4 and NO3 uptake (e.g., McCarthy et al., 1975; Muggli and Smith, 1993; Harrison et al., 1996). NH4 is generally considered to suppress the uptake of NO3 (Dortch, 1990) but this is observed to be a highly variable process, where NH4 can have little to no effect on NO3 uptake (Kokkinakis and Wheeler, 1987) or can enhance rather than inhibit NO3 uptake (Dortch, 1990). The extent to which NH4 will affect NO3 uptake is not just species-dependent, but is also affected by physiological state and the preconditioning nutrient concentrations (Varela and Harrison, 1999; L'Helguen et al., 2008). Equally, the concentration of NH4 at which suppression of NO3 uptake occurs varies between systems (Dortch, 1990; Dugdale et al., 2006, 2007; Probyn et al., 2015). The effect of incorporating an inhibition term, in this case, made little difference to the estimates of ρNO3 and ρN. A range of inhibition parameter values used in other studies were also investigated, ranging from 1.5 (Kishi et al., 2007) to 4.6 (Dutkiewicz et al., 2009), with little significant change in statistical comparisons. The value of 1.99, the outcome of a best fit model to the NO3 uptake values for this study, was deemed optimal for the range of values measured. Another suggestion to explain the deviations from Michaelis-Menten kinetics for NO3 uptake, is the potential for “shift-up” kinetics described in Dugdale et al. (1990, 2006). It was observed that NO3 uptake may not follow Michaelis-Menten kinetics consistently along the upwelling timeframe, where initial (highest) concentrations of NO3 will not equate to highest uptake rates, as communities take time to respond to new injections of NO3.
The predictions did not work when measured and calculated biomass-specific rates (h−1) were compared (Table 2). This is not surprising. The measured uptake rates result from an interplay between ambient nitrogen concentrations, total particulate nitrogen and the structure (size and taxa) of the phytoplankton assemblage, which will affect mass-specific rates as well as affinity for nitrogen. Mass-specific values influence physiological efficiency, with small cells having faster mass-specific rates and greater affinity for nitrogen at low concentrations than large cells. These influences of assemblage structure cannot be accounted for when dividing uptake rates by measured particulate nitrogen. Much of the uptake signal is dominated by the small fractions (<15 um) of the size spectra (Figure 6) and highest uptake rates are observed when the small size fractions dominate and thus biomass is low, illustrating that the successful predictions of uptake rates is not driven by high biomass. Absolute uptake rates can be considered an ecosystem metric of nitrogen dynamics, and this study shows that, in a eutrophic environment, size-scaled MM parameters can be used to predict NH4 and total N uptake, keeping the numbers of parameters to a minimum and thus minimizing uncertainty associated with each parameter. Data to constrain added parameters are not available from the in situ experiments. The non-allometric predictions, which use constant Vmax and Ks values across the entire spectrum resulted in a variety of regression slopes, with few matching a 1:1 relationship. The kinetic parameter values used all fall within a realistic range observed in the region, and of the nine combinations tested (Figure 7), no significant prediction was made for NO3 (although the slope was close to 1) and one successful prediction was made for NH4. However, it would be difficult to know in advance which parameter values to use, whereas the allometric calculations produced good matches to the observations.
To conclude, a large proportion of the variability observed in uptake rates of nitrogen measured in situ, in various assemblages, was explained by ambient nutrient concentrations and cell size, in spite of several simplifications and sources of error. The case for NO3 uptake was not as strong as NH4 and is suggested to be due to the complex suppressive behavior of NH4 on NO3 uptake as well potential “shift-up” effects observed in upwelling systems. In addition, accounting for the internal storage of NO3 may have improved estimations of ρNO3, but are beyond the scope of these data. Nevertheless, realistic approximations of nitrogen uptake, and thus new production (Dugdale and Goering, 1967) are achieved when using size-scaled Michaelis-Menten uptake parameters and particle size distributions. The strength of this study lies in its application to in situ measurements of cell size distributions and ambient nutrient concentration, to derive approximations of nitrogen uptake. Further research is recommended to include Dissolved Organic Nitrogen uptake rates into approximations of total N uptake, given its significant contribution to total production (Harrison et al., 1985; Probyn, 1988). This is no menial task however, given its complex kinetic behavior (Eppley et al., 1971; Bronk et al., 2004; Solomon et al., 2010) and current lack of size-scaling relationships in the literature. New production, considered to be the portion of primary production with the highest implications for carbon export or the flow of energy to higher trophic levels (Hutchings, 1992; Probyn, 1992; Dugdale et al., 2006), is a useful measurement in studies of ecosystem dynamics. In the absence of laborious and expensive 15N data, the use of particle size distributions to estimate nitrogen uptake can be a useful tool in assemblage scale studies of nitrogen dynamics in productive coastal upwelling systems.
Author Contributions
2004/2005 in situ data were collected and analyzed by TP (15N, nutrient analyses) and SB (particle size distributions). 2012/2013 data were collected by both TP (15N, nutrient analyses) and FA (15N, nutrient analyses, particle size distributions). FA designed the study, performed analyses, made the figures and wrote the manuscript. CM contributed to model implementation and validating of methods used, discussions of the results and edited the manuscript. TP also contributed to discussions of research and edited the manuscript. SB contributed to discussions of research.
Funding
This work is based on research supported in part by the National Research Foundation of South Africa (Grant Number 98967). Additional funds were from the Ma-Re Institute of the University of Cape Town, 7701, Cape Town, South Africa and the Council for Scientific and Industrial Research (CSIR), Rosebank, 7700, Cape Town, South Africa.
Conflict of Interest Statement
The authors declare that the research was conducted in the absence of any commercial or financial relationships that could be construed as a potential conflict of interest.
Acknowledgments
The authors would like to thank André du Randt and Lisa Mansfield of the Department of Agriculture, Forestry and Fisheries as well Marie Smith from the University of Cape Town for help with data collection during the several sampling periods.
References
Acevedo-Trejos, E., Brandt, G., Steinacher, M., and Merico, A. (2014). A glimpse into the future composition of marine phytoplankton communities. Front. Mar. Sci. 1:15. doi: 10.3389/fmars.2014.00015
Aksnes, D., and Egge, J. (1991). A theoretical model for nutrient uptake in phytoplankton. Mar. Ecol. Prog. Ser. 70, 65–72. doi: 10.3354/meps070065
Aksnes, D. L., and Cao, F. J. (2011). Inherent and apparent traits in microbial nutrient uptake. Mar. Ecol. Prog. Ser. 440, 41–51. doi: 10.3354/meps09355
Allen, J. I., and Fulton, E. (2010). Top-down, bottom-up or middle-out? Avoiding extraneous detail and over-generality in marine ecosystem models. Prog. Oceanogr. 84, 129–133. doi: 10.1016/j.pocean.2009.09.016
Arteaga, L., Pahlow, M., and Oschlies, A. (2014). Global patterns of phytoplankton nutrient and light colimitation inferred from an optimality-based model. Glob. Biogeochem. Cycles 28, 648–661. doi: 10.1002/2013GB004668
Baird, M. E., and Suthers, I. M. (2007). A size-resolved pelagic ecosystem model. Ecol. Model. 203, 185–203. doi: 10.1016/j.ecolmodel.2006.11.025
Banas, N. S. (2011). Adding complex trophic interactions to a size-spectral plankton model: emergent diversity patterns and limits on predictability. Ecol. Model. 222, 2663–2675. doi: 10.1016/j.ecolmodel.2011.05.018
Behrenfeld, M. J., and Boss, E. (2006). Beam attenuation and chlorophyll concentration as alternative optical indices of phytoplankton biomass. J. Mar. Res. 64, 431–451.
Bonachela, J. A., Raghib, M., and Levin, S. A. (2011). Dynamic model of flexible phytoplankton nutrient uptake. Proc. Natl. Acad. Sci. U.S.A. 108, 20633–20638. doi: 10.1073/pnas.1118012108
Boyd, C. M., and Johnson, G. (1995). Precision of size determination of resistive electronic counters. J. Plankt. Res. 17, 41–58. doi: 10.1093/plankt/17.1.41
Bronk, D. A., Sanderson, M. P., Mulholland, M. R., Heil, C. A., and Neil, J. M. (2004). “Organic and inorganic nitrogen uptake kinetics in field populations dominated by Karenia brevis,” in Harmful Algae, Vol. 1, eds K. A. Steidinger, J. J. Landsberg, C. R. Tomas, and G. A. Vargo (Florida Fish and Wildlife Conservation Commission, Florida Institute of Oceanography, and Intergovernmental Oceanographic Commission of UNESCO), 3–5.
Collos, Y., Vaquer, A., and Souchu, P. (2005). Acclimation of nitrate uptake by phytoplankton to high substrate levels. J. Phycol. 41, 466–478. doi: 10.1111/j.1529-8817.2005.00067.x
Dortch, Q. (1990). The interaction between ammonium and nitrate uptake in phytoplankton. Mar. Ecol. Prog. Ser. 61, 183–201. doi: 10.3354/meps061183
Dortch, Q., Clayton, J. R., Thoresen, S. S., and Ahmed, S. I. (1984). Species differences in accumulation of nitrogen pools in phytoplankton. Mar. Biol. 81, 237–250. doi: 10.1007/BF00393218
Droop, M. R. (1974). The nutrient status of algal cells in continuous culture. J. Mar. Biol. Assoc. UK 54, 825–855. doi: 10.1017/S002531540005760X
Dugdale, R. C., and Goering, J. J. (1967). Uptake of new and regenerated forms of nitrogen in primary productivity. Limnol. Oceanogr. 12, 196–206.
Dugdale, R. C., and Wilkerson, F. P. (1986). The use of 15N to measure nitrogen uptake in eutrophic ocean. Experimental considerations. Limnol. Oceanogr. 31, 673–689. doi: 10.4319/lo.1986.31.4.0673
Dugdale, R. C., Wilkerson, F. P., Hogue, V. E., and Marchi, A. (2006). Nutrient controls on new production in the Bodega Bay, California, coastal upwelling plume. Deep Sea Res. II Top. Stud. Oceanogr. 53, 3049–3062. doi: 10.1016/j.dsr2.2006.07.009
Dugdale, R. C., Wilkerson, F. P., Hogue, V. E., and Marchi, A. (2007). The role of ammonium and nitrate in spring bloom development in San Francisco Bay. Estuarine Coast. Shelf Sci. 73, 17–29. doi: 10.1016/j.ecss.2006.12.008
Dugdale, R. C., Wilkerson, F. P., Morel, A., and Physique, L. D. (1990). Realization of new production in coastal upwelling: a means to compare relative performance areas. 35, 822–829. doi: 10.4319/lo.1990.35.4.0822
Dutkiewicz, S., Follows, M. J., and Bragg, J. G. (2009). Modeling the coupling of ocean ecology and biogeochemistry. Global Biogeochem. Cycles 23, 1–15. doi: 10.1029/2008GB003405
Edwards, K. F., Klausmeier, C. A., and Litchman, E. (2014). Evidence for a three-way trade-off between nitrogen and phosphorus competitive abilities and cell size in phytoplankton. Ecol. Soc. Am. 92, 2085–2095. doi: 10.1890/11-0395.1
Edwards, K. F., Thomas, M. K., Klausmeier, C., and Litchman, E. (2012). Allometric scaling and taxonomic variation in nutrient utilization traits and maximum growth rate of phytoplankton. Limnol. Oceanogr. 57, 554–566. doi: 10.4319/lo.2012.57.2.0554
Eppley, R. W., Carlucci, A. F., Kiefer, D., Mccarthy, J. J., Venrick, E., and Williams, P. M. (1971). Phytoplankton growth and composition in shipboard cultures supplied with nitrate, ammonium, or urea as the nitrogen source. Limnol. Oceanogr. 16, 741–751. doi: 10.4319/lo.1971.16.5.0741
Eppley, R. W., Rogers, J. N., and Mccarthy, J. J. (1969). Half-saturation constants for uptake of nitrate and ammonium by marine phytoplankton. Limnol. Oceanogr. 14, 912–920. doi: 10.4319/lo.1969.14.6.0912
Follows, M. J., and Dutkiewicz, S. (2011). Modeling diverse communities of marine microbes. Annu. Rev. Mar. Sci. 3, 427–451. doi: 10.1146/annurev-marine-120709-142848
Franks, P. J. S. (2009). Planktonic ecosystem models: perplexing parameterizations and a failure to fail. J. Plankt. Res. 31, 1299–1306. doi: 10.1093/plankt/fbp069
Gregg, W. W., Ginoux, P., Schopf, P. S., and Casey, N. W. (2003). Phytoplankton and iron: validation of a global three-dimensional ocean biogeochemical model. Deep-Sea Res. Part II Top. Stud. Oceanogr. 50, 3143–3169. doi: 10.1016/j.dsr2.2003.07.013
Grover, J. P. (1991). Resource competition in a variable environment: phytoplankton growing according to the variable-internal-stores model. Am. Nat. 138, 811–835.
Harrison, W. G., Harris, L. R., and Irwin, B. D. (1996). The kinetics of nitrogen utilization in the oceanic mixed layer: nitrate and ammonium interactions at nanomolar concentrations. Limnol. Oceanogr. 41, 16–32. doi: 10.4319/lo.1996.41.1.0016
Harrison, W., Head, E., Conover, R., Longhurst, A., and Sameoto, D. (1985). The distribution and metabolism of urea in the eastern Canadian Arctic. Deep-Sea Res. Part A Oceanogr. Res. Papers 32, 23–42. doi: 10.1016/0198-0149(85)90015-9
Hutchings, L. (1992). Fish harvesting in a variable, productive environment. Searching for rules or searching for exceptions? South African J. Mar. Sci. 12, 297–318. doi: 10.2989/02577619209504708
Kishi, M., Kashiwai, M., Ware, M., Megrey, B. A., Eslinger, D. L., Werner, F. E., et al. (2007). NEMURO a lower trophic level model for the North Pacific marine ecosystem. Ecol. Model. 202, 12–25. doi: 10.1016/j.ecolmodel.2006.08.021
Kokkinakis, S., and Wheeler, P. (1987). Nitrogen uptake and phytoplankton growth in coastal upwelling regions. Limnol. Oceanogr. 32, 1112–1123. doi: 10.4319/lo.1987.32.5.1112
Koroleff, F. (1983). “Determination of ammonia,” in Methods of Seawater Analysis, 2nd Edn., eds K. Grasshoff, E. Ehrhardt, and K. Kremling (Weinheim: Verlag Chemie), 150–157.
Le Quéré, C. L., Harrison, S. P., Colin Prentice, I., Buitenhuis, E. T., Aumont, O., Bopp, L., et al. (2005). Ecosystem dynamics based on plankton functional types for global ocean biogeochemistry models. Global Change Biol. 11, 2016–2040. doi: 10.1111/j.1365-2486.2005.01004.x
L'Helguen, S., Maguer, J. F., and Caradec, J. (2008). Inhibition kinetics of nitrate uptake by ammonium in size-fractionated oceanic phytoplankton communities: implications for new production and f-ratio estimates. J. Plankt. Res. 30, 1179–1188. doi: 10.1093/plankt/fbn072
Litchman, E., Edwards, K. F., and Klausmeier, C. A. (2015). Microbial resource utilization traits and trade-offs: implications for community structure, functioning, and biogeochemical impacts at present and in the future. Front. Microbiol. 6:254. doi: 10.3389/fmicb.2015.00254
Litchman, E., Klausmeier, C. A., Schofield, O. M., and Falkowski, P. G. (2007). The role of functional traits and trade-offs in structuring phytoplankton communities: scaling from cellular to ecosystem level. Ecol. Lett. 10, 1170–1181. doi: 10.1111/j.1461-0248.2007.01117.x
Lomas, M. W., Bonachela, J. A., Levin, S. A., and Martiny, A. C. (2014). Impact of ocean phytoplankton diversity on phosphate uptake. In Review 111, 17540–17545. doi: 10.1073/pnas.1420760111
Lomas, M. W., and Glibert, P. M. (1999). Temperature regulation of nitrate uptake: a novel hypothesis about nitrate uptake and reduction in cool-water diatoms. Limnol. Oceanogr. 44, 556–572. doi: 10.4319/lo.1999.44.3.0556
McCarthy, J. J., Taylor, W. L., and Taft, J. (1975). “The dynamics of nitrogen and phosphorous cycling in the open waters of the chesapeake bay,” in Marine Chemistry in Coastal Environment, ed T. M. Church (American Chemical Society), 664–681.
McGill, B. J., Enquist, B. J., Weiher, E., and Westoby, M. (2006). Rebuilding community ecology from functional traits. Trends Ecol. Evol. 21, 178–185. doi: 10.1016/j.tree.2006.02.002
Menden-Deuer, S., and Lessard, E. J. (2000). Carbon to volume relationships for dinoflagellates, diatoms, and other protist plankton. Limnol. Oceanogr. 45, 569–579. doi: 10.4319/lo.2000.45.3.0569
Moloney, C. L., Field, J., and Lucas, M. (1991). The size-based dynamics of plankton food webs. II. Simulations of three contrasting southern Benguela food webs. J. Plankt. Res. 13, 1039–1092. doi: 10.1093/plankt/13.5.1039
Moloney, C. L., and Field, J. G. (1989). General allometric equations for rates of nutrient uptake, ingestion, and respiration in plankton organisms. Limnol. Oceanogr. 34, 1290–1299. doi: 10.4319/lo.1989.34.7.1290
Montagnes, D., Berges, J., Harrison, P., and Taylor, F. (1994). Estimating carbon, nitrogen, protein and chlorophyll a from volume in marine phytoplankton. Limnol. Oceanogr. 39, 1044–1060. doi: 10.4319/lo.1994.39.5.1044
Muggli, D., and Smith, W. J. (1993). Regulation of nitrate and ammonium uptake in the Greenland Sea. Mar. Biol. 208, 199–208. doi: 10.1007/BF00346336
Mullin, M., Sloan, P., and Eppley, R. (1966). Relationship between carbon content, cell volume and area in phytoplankton. Limnol. Oceanogr. 11, 307–311. doi: 10.4319/lo.1966.11.2.0307
Nydahl, F. (1976). On the optimum conditions for the reduction of nitrate to nitrite by cadmium. Talanta 23, 349–357. doi: 10.1016/0039-9140(76)80047-1
Pahlow, M., and Oschlies, A. (2009). Chain model of phytoplankton P, N and light colimitation. Mar. Ecol. Prog. Ser. 376, 69–83. doi: 10.3354/meps07748
Pahlow, M., Vézina, A. F., Casault, B., Maass, H., Malloch, L., Wright, D. G., et al. (2008). Adaptive model of plankton dynamics for the North Atlantic. Prog. Oceanogr. 76, 151–191. doi: 10.1016/j.pocean.2007.11.001
Parsons, T. R., Stephens, K., and Strickland, J. D. H. (1961). On the Chemical Composition of Eleven Species of Marine Phytoplankters. J. Fish. Res. Board Canada 18, 1001–1016. doi: 10.1139/f61-063
Pasciak, W. J., and Gavis, J. (1974). Transport limitation of nutrient uptake in phytoplankton. Limnol. Oceanogr. 19, 881–888.
Probyn, T. (1988). Nitrogen utilization by phytoplankton in the Namibian upwelling region during an austral spring. Deep-Sea Res. Part A Oceanogr. Res. Papers 35, 1387–1404. doi: 10.1016/0198-0149(88)90090-8
Probyn, T. A. (1992). The inorganic nitrogen nutrition of phytoplankton in the southern Benguela: new production, phytoplankton size and implications for pelagic foodwebs. South Afr. J. Mar. Sci. 12, 411–420. doi: 10.2989/02577619209504715
Probyn, T. A., Atkins, J. F., and Pitcher, G. C. (2015). Saldanha Bay, South Africa III: new production and carrying capacity for bivalve aquaculture. South Afr. J. Mar. Sci. 37, 521–531. doi: 10.2989/1814232X.2015.1113203
Probyn, T. A., Waldron, H. N., and James, A. G. (1990). Size-fractionated measurements of nitrogen uptake in aged upwelled waters: implications for pelagic food webs. Limnol. Oceanogr. 35, 202–210. doi: 10.4319/lo.1990.35.1.0202
Probyn, T. A., Waldron, H. N., Searson, S., and Owens, N. J. P. (1996). Diel variability in nitrogenous nutrient uptake at photic and subphotic depths. J. Plankt. Res. 18, 2063–2079. doi: 10.1093/plankt/18.11.2063
Rhee, G.-Y. (1974). Phosphate uptake under nitrate limitation by Scenedesmus sp. and its ecological implications. J. Phycol. 10, 470–475. doi: 10.1111/j.1529-8817.1974.tb02742.x
Seeyave, S., Probyn, T. A., Pitcher, G. C., Lucas, M. I., and Purdie, D. A. (2009). Nitrogen nutrition in assemblages dominated by Pseudo-nitzschia spp., Alexandrium catenella and Dinophysis acuminata off the west coast of South Africa. Mar. Ecol. Prog. Ser. 379, 91–107. doi: 10.3354/meps07898
Sicko-Goad, L. M., Schelske, C. L., and Stoermer, E. F. (1984). Estimation of intracellular carbon and silica content of diatoms from natural assemblages using morphometric techniques. Limnol. Oceanogr. 29, 1170–1178. doi: 10.4319/lo.1984.29.6.1170
Smith, S. L., Pahlow, M., Merico, A., Acevedo-Trejos, E., Sasai, Y., Yoshikawa, C., et al. (2015). Flexible phytoplankton functional type (FlexPFT) model: size-scaling of traits and optimal growth. J. Plankt. Res. 1–16. doi: 10.1093/plankt/fbv038
Smith, S. L., Pahlow, M., Merico, A., and Wirtz, K. W. (2011). Optimality-based modeling of planktonic organisms. Limnol. Oceanogr. 56, 2080–2094. doi: 10.4319/lo.2011.56.6.2080
Smith, S. L., and Yamanaka, Y. (2007). Optimization-based model of multinutrient uptake kinetics. Limnol. Oceanogr. 52, 1545–1558. doi: 10.4319/lo.2007.52.4.1545
Smith, S. L., Yamanaka, Y., Pahlow, M., and Oschlies, A. (2009). Optimal uptake kinetics: physiological acclimation explains the pattern of nitrate uptake by phytoplankton in the ocean. Mar. Ecol. Prog. Ser. 384, 1–12. doi: 10.3354/meps08022
Solomon, C. M., Collier, J. L., Berg, G. M., and Glibert, P. M. (2010). Role of urea in microbial metabolism in aquatic systems: a biochemical and molecular review. Aquat. Microb. Ecol. 59, 67–88. doi: 10.3354/ame01390
Strathmann, R. R. (1967). Estimating the organic carbon content of phytoplankton from cell volume or plasma volume. Limnol. Oceanogr. 12, 411–418. doi: 10.4319/lo.1967.12.3.0411
Tilman, D. (2001). Functional diversity. Encyclopedia Biodivers. 3, 109–120. doi: 10.1006/rwbd.1999.0154
Utermohl, H. (1958). Zur vervollkommnung der quantitativen Phytoplankton Methodik. Mitt. Int. Ver. Theor. Angew. Limnol. 9, 1–38.
van der Lingen, C., Hutchings, L., and Field, J. (2006). in the southern Benguela: are species alternations between small pelagic fish trophodynamically mediated? Afr. J. Mar. Sci. 28, 465–477. doi: 10.2989/18142320609504199
Varela, D. E., and Harrison, P. J. (1999). Effect of ammonium on nitrate utilization by Emiliania huxleyi, a coccolithophore from the oceanic northeastern Pacific. Mar. Ecol. Prog. Ser. 186, 67–74. doi: 10.3354/meps186067
Ward, B. A., Dutkiewicz, S., Jahn, O., and Follows, M. J. (2012). A size-structured food-web model for the global ocean. Limnol. Oceanogr. 57, 1877–1891. doi: 10.4319/lo.2012.57.6.1877
Westoby, M., and Wright, I. J. (2006). Land-plant ecology on the basis of functional traits. Trends Ecol. Evol. 21, 261–268. doi: 10.1016/j.tree.2006.02.004
Keywords: phytoplankton, diversity, allometry, nitrogen uptake, particle size distributions
Citation: Atkins JF, Moloney CL, Probyn TA and Bernard S (2016) In situ Measurements and Model Estimates of NO3 and NH4 Uptake by Different Phytoplankton Size Fractions in the Southern Benguela Upwelling System Front. Mar. Sci. 3:194. doi: 10.3389/fmars.2016.00194
Received: 30 July 2016; Accepted: 23 September 2016;
Published: 14 October 2016.
Edited by:
Dag Lorents Aksnes, University of Bergen, NorwayReviewed by:
Kyle Edwards, University of Hawaii at Manoa, USAS. Lan Smith, Japan Agency for Marine-Earth Science and Technology, Japan
Copyright © 2016 Atkins, Moloney, Probyn and Bernard. This is an open-access article distributed under the terms of the Creative Commons Attribution License (CC BY). The use, distribution or reproduction in other forums is permitted, provided the original author(s) or licensor are credited and that the original publication in this journal is cited, in accordance with accepted academic practice. No use, distribution or reproduction is permitted which does not comply with these terms.
*Correspondence: Ffion Atkins, ffion.atkins@gmail.com