Breakdown of Hydrostatic Assumption in Tidal Channel with Scour Holes
 Chunyan Li1,2,3*
  Quanan Zheng4
- 1Department of Oceanography, College of Marine Science and Technology, Zhejiang Ocean University, Zhoushan, China
- 2Department of Oceanography and Coastal Sciences, Louisiana State University, Baton Rouge, LA, USA
- 3Zhejiang Marine Development Research Institute, Zhoushan, China
- 4Department of Atmospheric and Oceanic Science, University of Maryland, College Park, MD, USA
Hydrostatic condition is a common assumption in tidal and subtidal motions in oceans and estuaries. Theories with this assumption have been largely successful. However, there is no definite criteria separating the hydrostatic from the non-hydrostatic regimes in real applications because real problems often times have multiple scales. With increased refinement of high resolution numerical models encompassing smaller and smaller spatial scales, the need for non-hydrostatic models is increasing. To evaluate the vertical motion over bathymetric changes in tidal channels and assess the validity of the hydrostatic approximation, we conducted observations using a vessel-based acoustic Doppler current profiler (ADCP). Observations were made along a straight channel 18 times over two scour holes of 25 m deep, separated by 330 m, in and out of an otherwise flat 8 m deep tidal pass leading to the Lake Pontchartrain over a time period of 8 h covering part of the diurnal tidal cycle. Out of the 18 passages over the scour holes, 11 of them showed strong upwelling and downwelling which resulted in the breakdown of hydrostatic condition. The maximum observed vertical velocity was ~ 0.35 m/s, a high value in a tidal channel, and the estimated vertical acceleration reached a high value of 1.76 × 10⁻² m/s2. Analysis demonstrated that the barotropic non-hydrostatic acceleration was dominant. The cause of the non-hydrostatic flow was the steep slopes. This demonstrates that in such a system, the bathymetric variation can lead to the breakdown of hydrostatic conditions. Models with hydrostatic restrictions will not be able to correctly capture the dynamics in such a system with significant bathymetric variations particularly during strong tidal currents.
Introduction
The hydrostatic approximation is almost always assumed applicable in studies of coastal dynamics. For large scale problems with wavelength comparable to those of tides, this does not seem to be questionable. However, real ocean and estuarine problems have multiple scales, which can include both hydrostatic and non-hydrostatic motions. With the development of numerical models and high-tech observational tools, e.g., high resolution acoustic Doppler current profilers (ADCP), we are facing more and more smaller scale flows. Many non-hydrostatic numerical models have been developed (e.g., Stashchuk and Hutter, 2001; Heggelund et al., 2004; Berntsen and Furnes, 2005; Berntsen et al., 2006; Ilıcak et al., 2009; Özgökmen et al., 2012, among many others), mainly for non-hydrostatic internal waves. However, almost all of the currently used coastal ocean models applied to estuaries and coastal waters are hydrostatic. While non-hydrostatic versions of these models have begun to emerge, there is, however, no clear boundary between the two kinds of models for applications. Currently, there is a lack of actual observations and analysis of non-hydrostatic flows in estuaries and coastal environment. The question is therefore: does the non-hydrostatic flow occur in an estuarine environment? If it does exist, where does it occur? In order to address these questions, one must measure vertical velocity and vertical acceleration.
In theory, the vertical velocity and vertical acceleration in a tidal flow are very small. Tidal flows are usually hydrostatic (e.g., Defant, 1961; Gill, 1982; Apel, 1987), and thus the vertical component of velocity and vertical acceleration are supposed to be too small to be observable. ADCPs can provide information about the vertical velocity, which has been recognized to be important since the early days of the technology (e.g., Johns, 1988). However, most vertical velocity measurements are too noisy to provide conclusive results, either because of observational errors or strong turbulent fluctuations. Thus vertical velocities measured using ADCPs, especially vessel-mounted ADCPs, are seldom discussed. With five moored ADCPs deployed at water depth between 300 and 1400 m, Schott et al. (1993) observed thermohaline circulation with vertical convection due to mixed layer deepening associated with cooling events. Gargett (1994) used the vertical velocity from vessel-based ADCP to calculate the turbulent kinetic energy across a tidal front. Using a bottom mounted ADCP, Rippeth and Simpson (1998) found consistent diel vertical migration of zooplankton. In this paper, we analyze and discuss some observations of velocity field, especially vertical velocity field in a narrow tidal passage using a vessel-mounted ADCP. Our main hypothesis is that with strong bathymetric variations, the flow can have a significant vertical component thereby producing a strong vertical acceleration that may breakdown the hydrostatic balance in the vertical. The importance of the vertical acceleration affected by bathymetry in a tidal channel needs to be assessed by direct observations. To this purpose, we use a vessel-mounted ADCP to repeatedly sample the velocity distributions in a tidal channel particularly during strong tidal currents. Data analysis and momentum balance assessment can then allow us to determine the importance of vertical acceleration.
Study Site and Method
The study area is at the mouth of one of the three major tidal inlets of Lake Pontchartrain (Figure 1). The lake is an oval-shaped semi-enclosed body of brackish water located north of New Orleans. The major axis of the oval is in the east-west direction and spans 66 km, while the minor north-south axis is about 40 km. The depth in most part of the lake is shallower than 6 m, and the average depth is 3.7 m. Higher salinity waters from the coastal ocean enter the lake via tidal currents and wind-driven flows through three narrow tidal passages, i.e., the Rigolets (TR), Chef Menteur (CM), and a man-made canal—the Inner Harbor Navigational Canal (Industrial Canal, or IC), which adjoined the Mississippi River Gulf Outlet (MRGO, which was closed later in 2009 due to the concern of its funnel effect of increasing storm surge in New Orleans), and the Gulf Intracoastal Waterway (GIWW) (Figure 1). Circulation in the lake is mostly wind-driven but current velocity through the narrow passages can be quite swift (max. 1.5–2.5 m/s) during the peak tidal flows as well as during severe weather conditions (e.g., during Hurricanes Gustav and Ike in 2008, Li et al., 2009b, 2010) and during winter cold front season when saltwater can intrude into the lake through bottom currents (Li et al., 2008). Tide in this area is mainly diurnal.
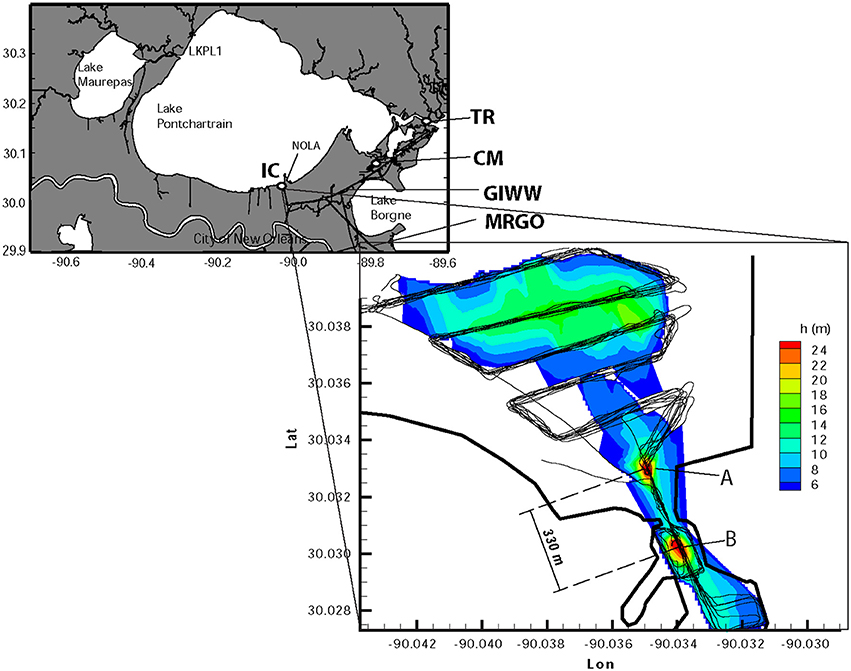
Figure 1. Study area near the southern coast of the Lake Pontchartrain, and ADCP survey tracks (black lines) and bathymetry contours measured from the ADCP. The two scour holes, (A,B), are shown by the red color deep waters, which separated by 330 m. The thick black lines are the coastlines. The Rigolets, Chef Menteur, Industrial Canal, the Mississippi River Gulf Outlet, and the Gulf Intracoastal Waterway are indicated by TR, CM, IC, MRGO, and GIWW, respectively.
The field measurements were conducted on Nov. 23, 2005, using an RDI 1200 kHz Workhorse Monitor ADCP mounted on a 26-ft Catamaran research vessel. The vessel was driven along a predefined route nine times (Figure 1) at a constant speed of ~ 2 m/s. The ADCP was attached on the port side of the vessel with its transducers located at a depth of about 0.35 m. The ADCP sampled velocity profiles at 2 Hz frequency with a vertical bin size of 0.25 m. A Furuno GPS (GP 37) was used with differential GPS enabled (~ 3–6 m accuracy) to record the location and Coordinated Universal Time (UTC), which were integrated with the ADCP data. The bottom-tracking mode was used in calculating the velocity in Earth coordinate system. Velocity components in the east, north, and vertical directions were recorded. The ADCP data were QA/QCed first and the compass calibration and flow magnitude scaling factor determination were done following Joyce (1989) and similar to previous studies (e.g., Li and Valle-Levinson, 1999; Li et al., 2000, 2004). The accuracy of velocity is on the order of 0.3% of the relative velocity between the transducers and the water which is on the order of 2.5 m/s, which yields an accuracy of 0.75 cm/s. The ADCP transducers measured the water depth continuously. The water depth was 8 m or less in most places except for two 25-m deep elliptical scour holes (Figures 1A,B), which were separated by 330 m. These holes were located inside and outside of the Industrial Canal, respectively, most likely caused by erosion of the fast flow. The current speed was high in the channel, with a maximum horizontal velocity of close to 2.5 m/s. The strong flow was largely going northward in a jet-like pattern into the lake during the flood tide along the axis of the two scour holes. The speed decreased dramatically away from the inlet, as a result of the rapid expansion of its cross sectional area as the water entered into the lake. Numerous eddies were visually observed over the two bathymetric holes. Surface waves and turbulence were evident as well. A total of nine repetitions were made through a pre-defined sampling route which were well-repeated for the most time (Figure 1). These repetitions provided velocity profiles eighteen times through the bathymetric holes (Table 1).
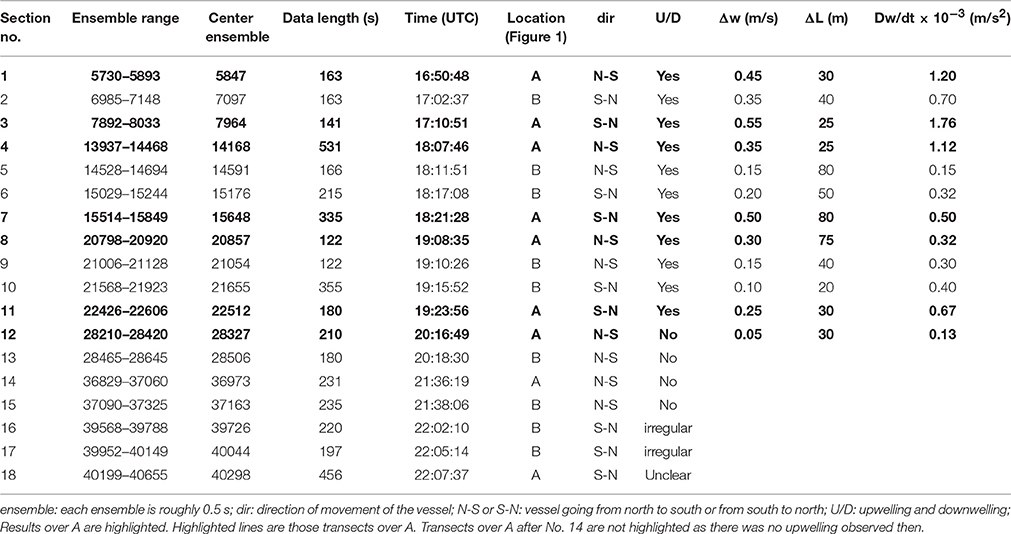
Table 1. Crossing of the Scour holes.
Results
The vertical velocity component along portions of the survey transects 1 and 2 indicated by the section number in the first column of Table 1 (passing through the scour holes A and B, respectively, Figures 2A,B) shows a clear separation of regimes over the downhill and uphill regions. In the downhill region in the southern portion of the transect over either hole, the vertical velocity is negative (downwelling) while in the uphill region in the northern portion of the transect, the vertical velocity is positive (upwelling). Both have a magnitude of ~ 0.35 m/s. Away from the holes, the vertical velocity is negligible. Data also show eastward velocity component alternating between positive and negative over the holes in the direction of the main channel (i.e., north-south direction) for most transect with a magnitude of ~ 0.5 m/ss. The north component of the velocity also shows alternation between positive and negative values in the cross channel direction (i.e., the east-west direction) but with a three times larger magnitude (~1.5 m/s). These velocity shears indicate eddies in the study area confirming what was observed visually when the survey was being conducted.
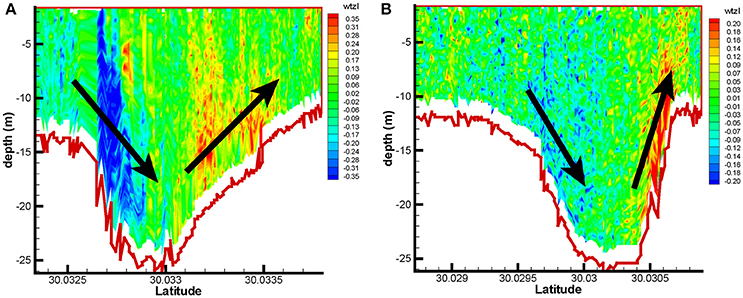
Figure 2. Profiles of vertical velocity over the scour hole A (a) and B (b) for the first two transects (No. 1,2 in Table 1). A and B are shown in Figure 1.
Overall, in the first 11 of the 18 passages over the scour holes, we observed strong vertical velocities with opposing signs across each of the holes (Table 1). In general, downward vertical velocities were recorded along the axis of the Industrial Canal in the upstream half of each of the scour holes. Upward vertical velocities were recorded along the axis of the Industrial Canal in the downstream half of the same scour hole. Vertical velocity has no obvious structure away from the holes, probably due to strong velocity shear, turbulence and eddies visible on site. The latter portion of observations occurred during slack tide and partly during a weak ebb, and no obvious upwelling or downwelling was observed.
Where upwelling was recorded by the ADCP, there was visible evidence in the form of divergent flows on the surface that resembled “boiling water” with visible upward motion but with a relatively smooth surface and fewer ripples and waves; where downwelling was recorded, surface convergences were apparent, with a much rougher surface and more ripples and waves. The contrast was quite remarkable to the naked eyes. The maximum horizontal flow was at the constriction between A and B (Figure 1), where the bottom was flat and where there was no obvious vertical motion. Turbulence and vertical flow were more intense over the northern hole (Figure 1A) than the southern hole (Figure 1B). This was representative of all the 11 Sections over the holes. The magnitudes of both horizontal and vertical velocities gradually decreased throughout the observations as the tidal currents changed their phase from flood to ebb.
Figures 3A–H, 4A–H show some examples of the 12 transects over the scour holes with the depth-averaged eastward (upper panels, u), northward (second panels, v), and upward velocities (third panels, w), and the depth profiles (lower panels, h) along the south-north directions, two of which for the scour hole A and two for the scour hole B. The lower middle of each of the four subfigures shows a letter indicating whether it is from the northern hole A or the southern hole B. A and B both spanned about 100 m in the flow direction, with B being slightly larger. The error bars indicate one standard deviation and demonstrate the variability of the flow velocity in the vertical. Note that the results are presented by analyzing the 2 Hz raw data without averaging, thus the apparent noisy nature. The trends that the depth-averaged vertical velocity followed the slope of the bottom along the transects however are quite persistent. The depth-averaged eastward velocity could be either positive or negative and was stronger at the beginning of the survey. The depth-averaged northward velocity was mostly positive. This was particularly true for that over the southern hole which had a fairly constant depth-averaged northward velocity along the transect most of the time. In contrast, the depth-averaged northward velocity over the northern hole A had a much larger variability. The northward velocity over the southern half of hole A was much larger than that over its northern half. The rapid decrease of the northward velocity was a result of the expansion of the cross sectional area as the water flowed into the wide lake.
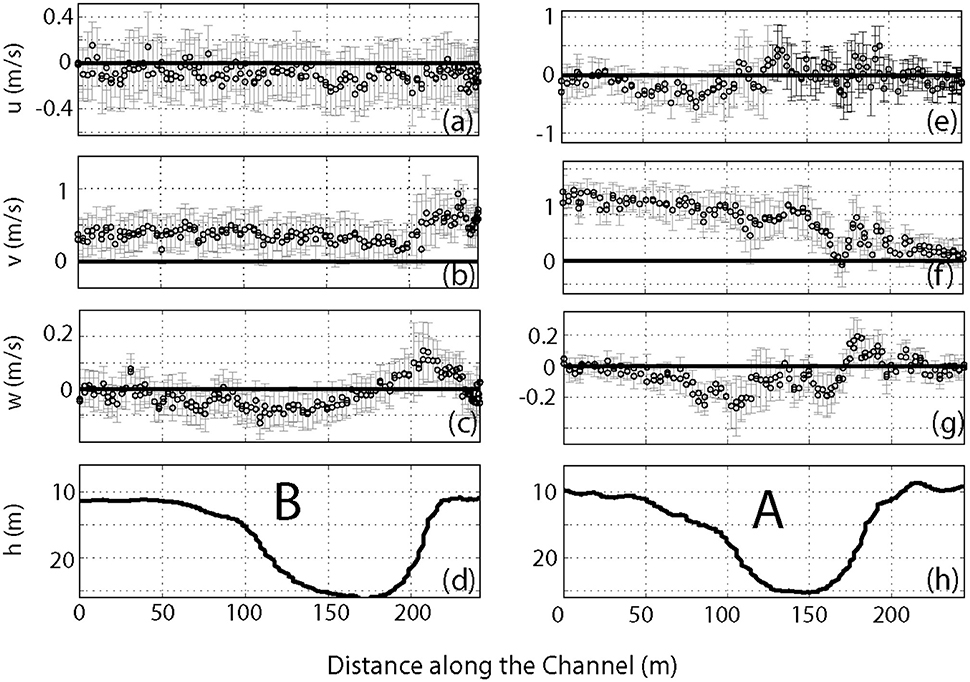
Figure 3. Depth-averaged velocity for two of the first 6 transects, one over the northern scour hole. (A–D) Are the eastward, northward, and upward velocity components and water depth profile, respectively, for the second transects (No. 2 in Table 1). (E–H) Are the eastward, northward, and upward velocity components and water depth profile, respectively, for the third transects (No. 3 in Table 1).
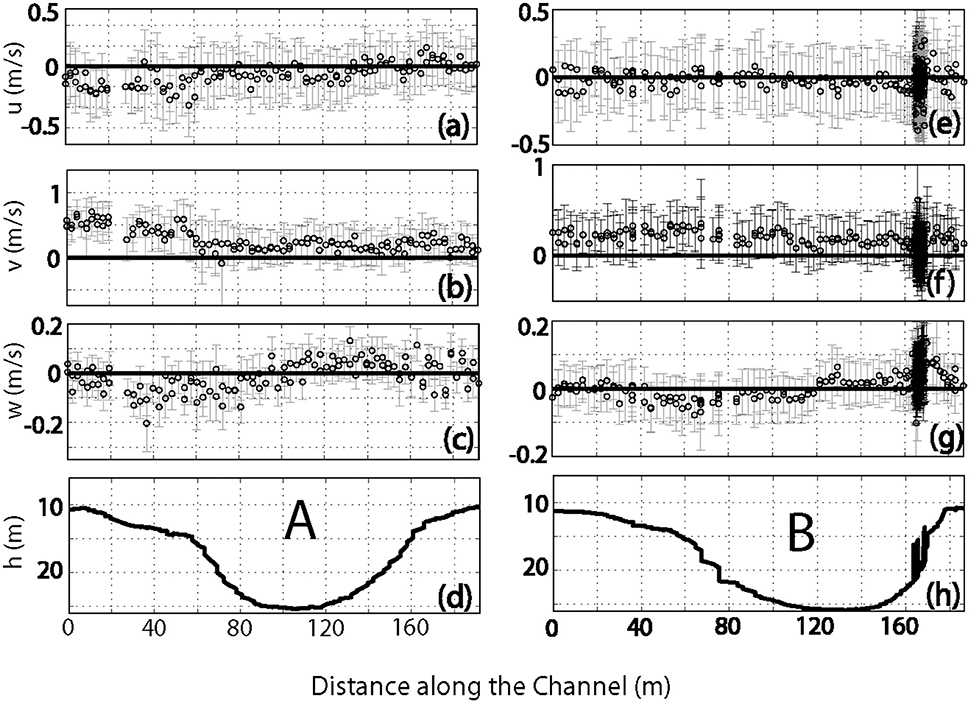
Figure 4. Depth-averaged velocity for two of the second 6 transects, one over the northern scour hole. (A–D) are the eastward, northward, and upward velocity components and water depth profile, respectively, for the eighth transects (No. 8 in Table 1). (E–H) are the eastward, northward, and upward velocity components and water depth profile, respectively, for the tenth transects (No. 10 in Table 1).
While Figure 2 gives examples of the vertical profiles of upwelling and downwelling over the scour holes, all the third panels of each of the subplot of Figures 3, 4 show the depth-averaged vertical velocity along the Industrial Canal at the inlet of the lake. Almost all of the depth-averaged vertical velocity demonstrated downwelling as the water flowed into the holes and upwelling as the water flowed out of the holes.
The strong vertical velocity and variation over a short distance imply a large vertical acceleration, which suggests that the motion may be non-hydrostatic. The vertical velocity was 0.2–0.35 m/s in magnitude, and it changed from its maximum (positive) to minimum (negative) value over a distance of ~100 m. The average horizontal velocity U was ~ 0.8–1.5 m/s. Defining L to be the distance over which the vertical velocity changed from 0 to its maximum value, the associated time scale over L is Δt = L/u = 50/ U = ~ 30–60 s. The vertical acceleration can thus be estimated to be Δw/Δt ~ (0.35-0) / Δt = 0.6–1.2 × 10⁻² m/s2. This is a very large value, especially considering the fact that during flood tide, tidal straining makes the vertical water column almost uniform in salinity and density, and no internal waves are possible.
The maximum vertical accelerations for the first 12 transects were estimated from the horizontal variations in vertical velocity, the average horizontal velocity, and L (dw/dt ~ Δw/ (L/ U)). Large vertical accelerations were consistently associated with the upwelling and downwelling (Table 1). The values over A were generally larger than those over B.
The vertical salinity and temperature structures were measured by a YSI CTD. The finding was that during the first 11 transects over the scour holes A and B, there was essentially no stratification in the holes: the salinity varied over time between 9 and 11 PSU but without a vertical structure in the holes. In some studies, e.g., de Vries et al. (2014), the tidal straining is more complicated than the conventional views (Simpson et al., 1990, 2005) such that during flood the water column is not well-mixed. Li et al. (2009a) showed asymmetric features of stratification across a tidal pass with increased stratification during flood on the eastern side of a channel. These characteristics differ from the conventional view and were caused either by the system being open through multiple inlets (in the case of de Vries et al., 2014) or freshwater source outside of the estuary (in the case of Li et al., 2009a). Our system (Industrial Canal of Lake Pontchartrain) has a narrow and straight channel connecting to the vast estuarine lake and the flood tide has well-mixed condition (Simpson et al., 1990).
Discussion and Conclusions
Topographic Upwelling and Downwelling
For flows along the bottom, the velocity vector (v) must be perpendicular to the normal vector (N) of the bottom, i.e., v ·N = 0. Since the tangent (or slope) of the bottom is along the direction of (cos(α), sin(α)), given that α is the angle of the bottom with the horizontal, the normal direction is then (−sin α, cos α) – i.e., the unit vector N is the negative reciprocal of the bottom. Therefore, v ·N = 0 becomes –sin α u + cos α w = 0, in which u and w are the horizontal and vertical velocities, respectively. This leads to w/u = tan α. Comparison of the bottom slope and the ratio of the depth averaged vertical and horizontal velocities for the first 12 transects (Table 1) are shown in Figure 5. Despite the noisy nature, the two are quite well matched, which indicates that the flow is basically following the bottom topography and not caused by internal waves. The averaged R2 value of a linear regression between the slope and velocity ratio is ~ 0.69. The strong vertical acceleration was thus mainly caused by the bottom topography. Strong topographic changes in tidal inlets are very common, which suggests that the hydrostatic assumption may be broken even for tidal flows in this type of environment. A non-hydrostatic model is required for a correct representation of the dynamics.
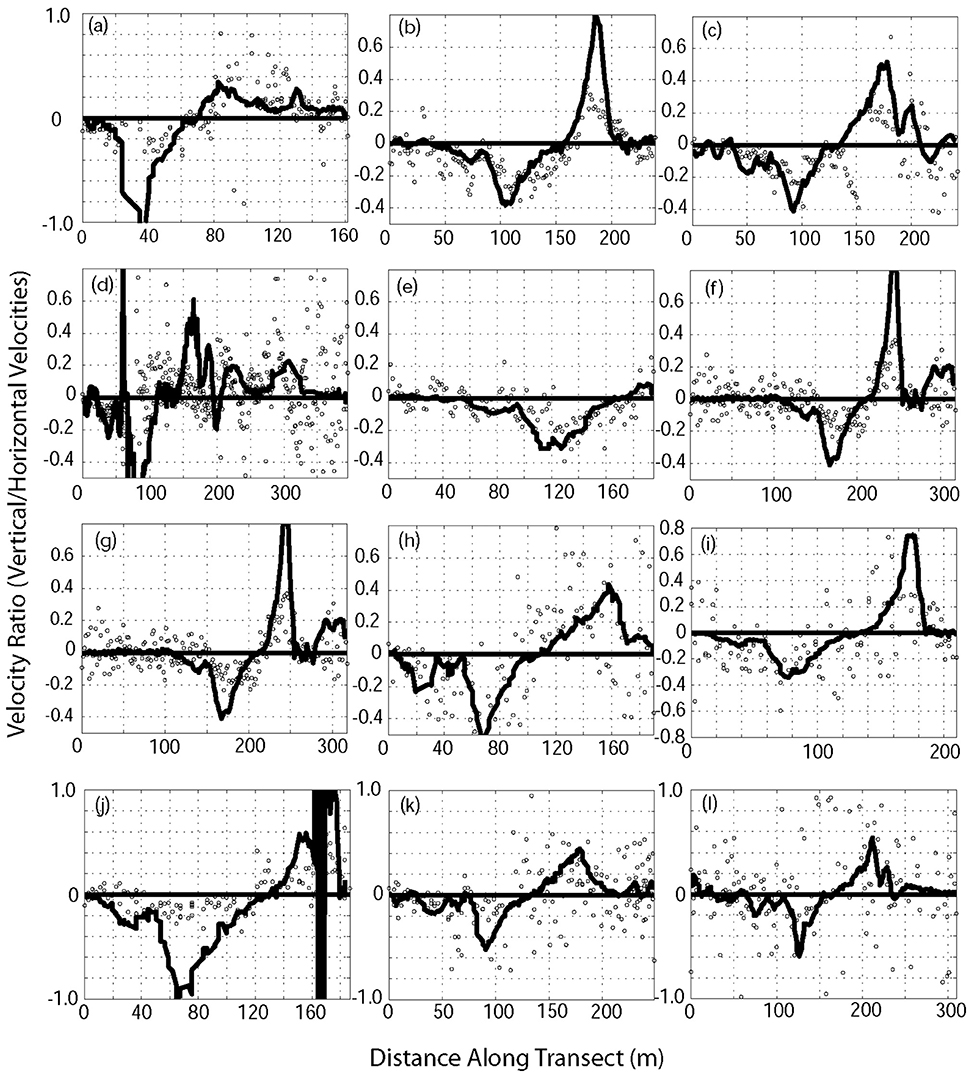
Figure 5. Ratio of depth averaged vertical and north velocities (circles) and bottom slope (lines) for the 12 transects (A–L, No. 1–12 in Table 1). An averaged R2 values of 0.60 was calculated with a linear regression between the slope and velocity ratios.
Assessment of Hydrostatic Condition
The observations showed strong upwelling and downwelling. The strong vertical motion is related to the bottom slope. The vertical velocity may break down the hydrostatic condition and introduce a non-hydrostatic flow. With an order of magnitude estimate, here we evaluate the effect of the bottom slope on the vertical velocity induced non-hydrostatic flow. Since the focus is only on the uphill and downhill flows caused by the depth variations, we only discuss the barotropic vertical momentum equation:
in which p′ is the non-hydrostatic pressure component contributed by barotropic motion only. If we use U, W, L, H, δp′, and T to denote the scales for horizontal velocity, vertical velocity, horizontal length, depth, pressure variations, and time scale, respectively, we can non-dimensionalize equation (1):
in which the tildes indicate non-dimensional variables defined by the ratios of the original variables and their corresponding scales. From the horizontal momentum balance, it is easy to show that the pressure change is related to the horizontal velocity scale by the following relationship:
If we further define the aspect ratio to be:
As the problem in a narrow channel is mainly in the longitudinal direction, we only consider the variations in that direction (x-direction) and in the vertical. Thus we have the continuity equation
gives the following aspect ratio relation
From (3) to (6), equation (2) is reduced to:
This result demonstrates that the barotropic non-hydrostatic acceleration is proportional to the square of the aspect ratio. Here the aspect ratio is also the slope of the bottom if we take H as the change of depth over a horizontal distance of L. As shown in Figure 5, the slope of the bottom is between 0 and 1 and with large values (~ 0.8–1) over the slopes of the scour holes and therefore non-negligible. This means that the non-hydrostatic flows caused by the uphill and downhill flows can affect the vertical momentum balance by close to 60–100%. Therefore, the vertical acceleration caused by the flow over the scour holes can be significant and a hydrostatic model will not be able to capture the dynamics in this area over the two scour holes.
This study provides an observational evidence of barotropic non-hydrostatic tidal currents in a tidal pass. It has demonstrated, through field measurements, that the flood tidal currents at the Industrial Canal, a tidal passage of Lake Pontchartrain, is highly non-hydrostatic. Strong upwelling and downwelling are present during the flood tide over two scour holes with horizontal dimensions of ~100 m, separated by about 330 m along the channel. This clearly indicates that hydrostatic models cannot be used in these types of systems for proper modeling of current, transport, mixing, and dispersion. Numerical models for Lake Pontchartrain (Signell and List, 1997; Georgiou and McCorquodale, 2000, 2002; Georgiou, 2002) are all hydrostatic. As recognized by more and more modelers (e.g., Heggelund et al., 2004; Berntsen and Furnes, 2005; Berntsen et al., 2006), non-hydrostatic models are needed for problems with significant vertical motion and for small scale problems. Despite the increased effort associated with non-hydrostatic modeling, with very few exceptions (Stashchuk and Hutter, 2001) validation of such models using observations are rare. Observations should be used to validate non-hydrostatic models before applying them to systems that require their use. Since tidal passes are common in coastal waters, where the terrestrial water and coastal water mix, the present results thus are useful for numerical model development and validations. Non-hydrostatic models may be mandated even if only occasionally the flow is non-hydrostatic. The model must also be validated by observations of non-hydrostatic flows. The work presented here suggests that examining the bottom slope over the horizontal distance of interest is a reliable approach to identify areas where non-hydrostatic flows may exist.
Author Contributions
CL: Contributed to the initialization of the project, design of survey, data collection, analysis, and drafting of the manuscript; QZ: Contributed to the project with extensive discussion with CL in theoretical consideration, data interpretation, and manuscript revision; For the first author CL: He initiated the work of conducting a continuous survey in a tidal channel with significant bathymetry and the test of hydrostatic approximation. He organized the survey and conducted the survey, collected valid data, provided data analysis and drafting the paper; For the co-author QZ: He contributed to the work significantly by several discussions of ideas and physics with the first and corresponding author CL. He contributed significantly to data interpretation and worked with CL on the manuscript as well; Overall, this work is a collaborative study that involves the discussion of ideas, design of experiments, data collection in the field, data processing and analysis, results interpretation, and the writing. The authors shared much of the work and contributed significantly.
Funding
This project is supported by the NSF Grant# OCE-0554674, OCE-1140307, DEB-0833225.
Conflict of Interest Statement
The authors declare that the research was conducted in the absence of any commercial or financial relationships that could be construed as a potential conflict of interest.
Acknowledgments
Field work was assisted by the Field Support Group of the Coastal Studies Institute, Louisiana State University. The processed data are summarized in Table 1 while the raw data can be obtained from the corresponding author and later through our web pages after the publication of the paper (http://oceandynamics.lsu.edu). Two anonymous reviews provided thoughtful and useful reviews that helped the improvement of the manuscript. We are thankful for their efforts and contributions.
References
Apel, J. (1987). Principles of Ocean Physics, Vol. 38. International Geophysics. New York, NY: Academic Press.
Berntsen, J., and Furnes, G. (2005). Internal pressure errors in sigma-coordinate ocean models—sensitivity of the growth of the flow to the time stepping method and possible non-hydrostatic effects. Cont. Shelf Res. 25, 829–848. doi: 10.1016/j.csr.2004.09.025
Berntsen, J., Xing, J., and Alendal, G. (2006). Assessment of non-hydrostatic ocean models using laboratory scale problems. Cont. Shelf Res. 26, 1433–1447. doi: 10.1016/j.csr.2006.02.014
de Vries, J. J., Nauw, J. J., Ridderinkhof, H., and van Aken, H. M. (2014). An exploratory study of the variability of currents and density in the Marsdiep. Cont. Shelf Res. 84, 70–83. doi: 10.1016/j.csr.2014.05.003
Gargett, A. E. (1994). Observing turbulence with a modified acoustic doppler current profiler. J. Atmosph. Oceanic Tech. 11, 1592–1610. doi: 10.1175/1520-0426(1994)011<1592:OTWAMA>2.0.CO;2
Georgiou, I., and McCorquodale, J. A. (2002). “Stratification and circulation in Lake Pontchartrain,” in Estuarine and Coastal Modeling, eds. L. Malcom Spaulding and H. Butler Lee (New York, NY: ASCE), 875–887.
Georgiou, I. Y., and McCorquodale, J. A. (2000). “Salinity stratification from a navigation Canal in a shallow Lake,” in Stratified Flows, Vol. 2, eds G. A. Laurence, R. Pieters, and N. Yonemitsu (Vancouver: IAHR), 859–864.
Georgiou, Y. G. (2002). Three-Dimensional Hydrodynamic Modeling of Saltwater Intrusion and Circulation in Lake Pontchartrain, Ph.D. dissertation, Univ. of New Orleans, 171.
Heggelund, Y., Vikebø, F., Berntsen, J., and Furnes, G. (2004). Hydrostatic and non-hydrostatic studies of gravitational adjustment over a slope. Cont. Shelf Res. 24, 2133–2148. doi: 10.1016/j.csr.2004.07.005
Ilıcak, M., Ozgokmen, T. M., Ozsoy, E., and Fischer, P. F. (2009). Non-hydrostatic modeling of exchange flows across complex geometries. Ocean Model. 29, 159–175. doi: 10.1016/j.ocemod.2009.04.002
Johns, W. E. (1988). Near-surface current measurements in the Gulf Stream using an upward-looking acoustic Doppler current profiler. J. Atmos. Oceanic Technol. 5, 602–613. doi: 10.1175/1520-0426(1988)005<0602:NSCMIT>2.0.CO;2
Joyce, T. M. (1989). On in situ “calibration” of shipboard ADCPs. J. Atmos. Oceanic Technol. 6, 169–172. doi: 10.1175/1520-0426(1989)006<0169:oisosa>2.0.co;2
Li, C., Blanton, J. O., and Chen, C. (2004). Mapping of tide and tidal flows using vessel towed ADCP. J. Geophys. Res. 109, C04002. doi: 10.1029/2003JC001992.
Li, C., Swenson, E., Weeks, E., and White, J. (2009a). Asymmetric tidal straining across an inlet: lateral inversion and variability over a tidal cycle. Estuarine Coast. Shelf Sci. 85, 651–660. doi: 10.1016/j.ecss.2009.09.015
Li, C., and Valle-Levinson, A. (1999). A two-dimensional analytic tidal model for a narrow estuary of arbitrary lateral depth variation: the intratidal motion. J. Geophys. Res. 104, 23,525–23,543. doi: 10.1029/1999JC900172
Li, C., Valle-Levinson, A., Atkinson, L., and Royer, T. C. (2000). Inference of tidal elevation in shallow water using a vessel-towed ADCP. J. Geophys. Res. 105, 26,225–26,236. doi: 10.1029/1999JC000191
Li, C., Walker, N., Hou, A., Georgiou, I., Roberts, H., Laws, E., et al. (2008). Circular plumes in lake pontchartrain estuary under wind straining. Estuarine Coast. Shelf Sci. 80, 161–172. doi: 10.1016/j.ecss.2008.07.020
Li, C., Weeks, E., and Blanchard, B. W. (2010). Storm surge induced flux through multiple tidal passes of Lake Pontchartrain estuary during Hurricanes Gustav and Ike. Estuarine Coast. Shelf Sci. 87, 517–525. doi: 10.1016/j.ecss.2010.02.003
Li, C., Weeks, E., and Rego, J. (2009b). In situ Measurements of Saltwater Flux through Tidal Passes of Lake Pontchartrain Estuary by Hurricanes Gustav and Ike in September 2008. Geophys. Res. Lett. 36, L19609. doi: 10.1029/2009GL039802
Özgökmen, T. M., Poje, A. C., Fischer, P. F., Childs, H., Krishnan, H., and Garth, C. (2012). On multi-scale dispersion under the influence of surface mixed layer instabilities and deep flows. Ocean Model. 56, 16–30. doi: 10.1016/j.ocemod.2012.07.004
Rippeth, T. P., and Simpson, J. H. (1998). Diurnal signals in vertical motions on the Hebridean Shelf. Limnol. Oceanogr. 43, 1690–1696. doi: 10.4319/lo.1998.43.7.1690
Schott, F., Visbeck, M., and Fischer, J. (1993). Observations of vertical currents and convection in the central Greenland Sea during the winter of 1988–1989. J. Geophys. Res. 98, 14401–14422. doi: 10.1029/93JC00658
Signell, R. P., and List, J. H. (1997). Modeling waves and circulation in Lake Pontchartrain. Gulf Coast Assoc. Geol. Soc. Trans. 47, 529–532.
Simpson, J. H., Brown, J., Matthews, J., and Allen, G. (1990). Tidal straining, density currents, and stirring in the control of estuarine stratification. Estuaries13, 125–132. doi: 10.2307/1351581
Simpson, J. H., Williams, E., Brasseur, L. H., and Brubaker, J. M. (2005). The impact of tidal straining on the cycle of turbulence in a partially stratified estuary. Cont. Shelf Res. 25, 51–64. doi: 10.1016/j.csr.2004.08.003
Keywords: hydrostatic assumption, tidal channel, observations using ADCP, scour hole, vertical velocity, vertical acceleration
Citation: Li C and Zheng Q (2016) Breakdown of Hydrostatic Assumption in Tidal Channel with Scour Holes. Front. Mar. Sci. 3:199. doi: 10.3389/fmars.2016.00199
Received: 03 May 2016; Accepted: 26 September 2016;
Published: 25 October 2016.
Edited by:
Isabel Iglesias, Interdisciplinary Centre of Marine and Environmental Research, PortugalReviewed by:
Jesus Dubert, University of Aveiro, PortugalJanine Nauw, Royal Netherlands Institute for Sea Research, Netherlands
Copyright © 2016 Li and Zheng. This is an open-access article distributed under the terms of the Creative Commons Attribution License (CC BY). The use, distribution or reproduction in other forums is permitted, provided the original author(s) or licensor are credited and that the original publication in this journal is cited, in accordance with accepted academic practice. No use, distribution or reproduction is permitted which does not comply with these terms.
*Correspondence: Chunyan Li, cli@lsu.edu