Price vs. Value of Marine Monitoring
 Henrik Nygård
 Soile Oinonen
 Heidi A. Hällfors
 Maiju Lehtiniemi
 Eija Rantajärvi
 Laura Uusitalo
- Finnish Environment Institute (SYKE), Marine Research Centre, Helsinki, Finland
Monitoring data facilitate the basic understanding of changes taking place in nature and provide information for making management decisions, but environmental monitoring is often considered expensive. Here, we apply the concept of value of information to evaluate the value of marine monitoring in the EU Marine Strategy Framework Directive context. We estimated the costs of the Finnish marine monitoring program and used the costs and economic benefits estimates of the Finnish marine strategy to assess the value of environmental monitoring. The numbers were applied to scenarios with different levels of information available prior to management decision-making. Monitoring costs were related to the value of perfect information prior to the management decision, assuming that managers will choose the management option that maximizes the benefits. The underlying assumptions of the conceptual model are that more accurate information about the status facilitates the selection of an optimal set of measures to achieve the environmental objectives and the related welfare gains from the improved environmental status. Our results emphasize the fact that monitoring is an essential part of effective marine management. Importantly, our study show that the value of marine monitoring data is an order of magnitude greater than the resources currently spent on monitoring and that an improved knowledge base can facilitate the planning of more cost-effective measures.
Introduction
In environmental management, monitoring activities constitute the foundation for understanding changes taking place in nature and provide information essential for decision making. However, monitoring is often looked upon as an expensive activity creating only costs, not considering the wide use of the data and the value of more informed decisions (Caughlan and Oakley, 2001). Considering environmental management, from monitoring to management programs, monitoring costs constitute only a small proportion (of the total costs) that becomes even smaller when adding the benefits achieved from efficient management (see Lovett et al., 2007 and references therein). Value of information (VoI) analysis is a tool for evaluating how much a rational decision-maker would be willing to pay for a new piece of information prior to making a decision (Stigler, 1961). Colyvan (2016) provides an overview of the concept and its application in conservation biology and Keisler et al. (2014) reviews the peer-reviewed literature from the years 1990–2011. Characteristic for the VoI analysis is that the value of information is in relation to the decision context. For example, Runting et al. (2013) found that when making decisions about where to locate a reserve system to preserve coastal biodiversity it is optimal to allocate a substantial proportion of the conservation budget in better data and models. In the fisheries management literature, VoI analysis has been recognized as a valuable tool in advising on the optimal fishing effort or quotas (Hilborn and Walters, 1992; Mäntyniemi et al., 2009). In this paper we apply the VoI concept to study marine environmental management and the optimal allocation of resources between monitoring and measures to improve the status of the marine ecosystem.
The EU Marine Strategy Framework Directive (MSFD; European Union, 2008) requires that Member States strive to obtain or maintain good environmental status (GES) in their marine waters by 2020. For management to be effective, in-depth knowledge about the functioning of the marine ecosystem, changes in the system as well as the ability of monitoring to detect these changes is needed.
At the start of each MSFD cycle of 6 years the status of the environment is assessed and indicators and their relation to GES are set. Monitoring programs to ensure the collection of data needed for the indicators are then developed. Based on the status assessment, the distance from GES is evaluated and the descriptors not achieving GES are identified. To reduce the distance from GES and to remain in GES for descriptors already in GES, the program of measures (PoM) is set up where corrective measures need to be planned and implemented. Once the 6-year cycle is completed, the effect of the PoM is evaluated by a new status assessment, which starts the new MSFD cycle. Thus, assessment of GES is in the core of the MSFD and the assessment results will largely rely on the set of indicators used and their performance (Uusitalo et al., 2016a). In addition to fulfilling the quality requirements of an indicator (e.g., Queirós et al., 2016), indicator performance depends on the quality of the data used for calculating the indicator value as well as for setting the indicator GES boundary. Inadequate and/or insufficient monitoring will decrease the precision of the indicators, which can lead to erroneous assessment results; GES can be adjudged on false premises and needed corrective measures are omitted risking further degradation, or the indicators are unable to show a correct positive response leading to undertaking unnecessary measures.
The MSFD requires social and economic analysis when assessing the status of the marine ecosystem and when developing the PoM (e.g., Oinonen et al., 2016a), but cost-effectiveness analysis is not required for the monitoring programs. In this paper, our aim is to show the value of data and information produced by monitoring programs and how that value relates to the costs of the monitoring programs. We discuss how well-designed monitoring programs can lead to cost savings in the marine management. As an example case, we illustrate the VoI concept with a hypothetical example and with data from the Finnish Marine Strategy.
Materials and Methods
Data
In this study we used information from the Finnish national marine biodiversity monitoring program (Korpinen et al., 2014). The biodiversity monitoring program is divided into five monitoring themes (marine mammals, birds, fish, benthic habitats, and water column habitats), which are further divided into 19 sub-programs. For example, the water column habitat monitoring theme is split into phytoplankton and zooplankton sub-programs, among others. Data on the costs (year 2013) were collected from the institutes responsible for the monitoring and by interviewing involved experts. The cost data are based on Finnish prices. Flow charts were prepared to identify the different steps causing costs in monitoring (see Figure 1 for an example). The biodiversity monitoring sub-programs are diverse and use multiple approaches and methodologies, but as a general frame the monitoring cost data were split into the following categories: research vessel, equipment, supplies, personnel, fixed costs, and other costs (following Veidemane and Pakalniete, 2015). Research vessel costs were based on the daily price for running the vessel (including crew, fuel and maintenance costs). When samples for several monitoring sub-programs were collected during the same monitoring cruise (e.g., phytoplankton, zooplankton and benthos), the research vessel costs were divided with the total number of samples collected during the monitoring cruises to allocate specific research vessel costs per monitoring sub-program. Equipment costs (e.g., sampling gear, microscopes etc.) were calculated as the list price taking into account the expected lifetime of the equipment and a yearly discount rate. The costs of supplies (e.g., sample bottles, preservatives, petri dishes etc.) were calculated based on the yearly usage. The costs of both equipment and supplies were classified into sampling, analysis or data management expenses, to facilitate distinguishing the categories when adding up the costs. Personnel costs were likewise categorized into field, laboratory and data management expenses, and estimated based on the level of expertise and number of person-months needed per year for the various tasks. Overheads were applied to the personnel costs and included as fixed costs. Other costs included transport of equipment and personnel from the institute to the research vessel, costs for maintaining necessary professional skills, accreditations, participation in proficiency tests and sustaining continuity of expertise at the institute. The cost data were transformed to cost per sample, in order to facilitate estimating indicator costs and evaluations of cost-effectiveness with respect to the quality of data (e.g., how the number of samples or the spatial and temporal coverage of sampling affect the uncertainty of the indicator result).
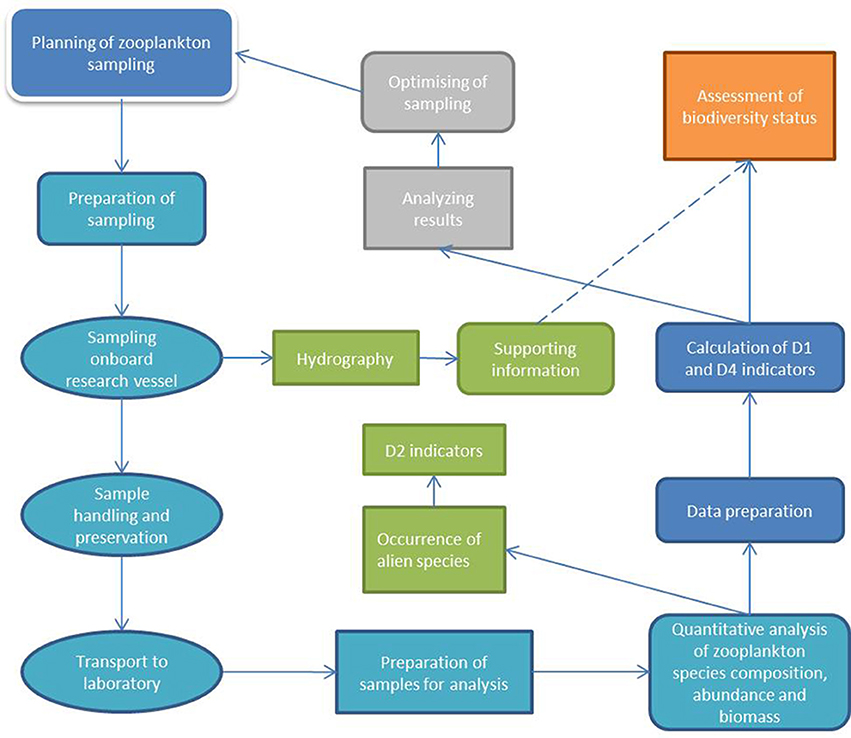
Figure 1. Flow chart describing the work steps in the Finnish zooplankton monitoring sub-program. D1, D2, and D4 stands for the EU Marine Strategy Framework Directive descriptors Biodiversity, Non-indigenous species and Food webs, respectively.
For the costs of different management options we followed Oinonen et al. (2016b) who assessed the costs of the Finnish PoM (Laamanen, 2016), which were expected to be 136.2 million €. The economic benefit estimates are taken from the cost-benefit analysis of the Finnish PoM (Oinonen et al., 2015). Oinonen et al. (2015) followed Hasler et al. (2016) and linked existing valuation studies of Ahtiainen et al. (2014a) and Kosenius and Ollikainen (2015) with the GES descriptors and used a benefit transfer method (e.g., Richardson et al., 2015) to estimate the non-market value of reaching GES. As the management aim is to improve the environmental status, economic benefits arising only from an improvement in the environmental status are considered. The economic benefits of achieving GES for D1, D4, and D5 in 2020 were estimated to be around 2090 million € (Oinonen et al., 2015). The cost-effectiveness analysis of the Finnish PoM also provided knowledge on the probability of achieving GES with different sets of measures; the probability of reaching GES by 2020 is 0.77 for biodiversity (D1) and food webs (D4), and 0.02 for eutrophication (D5) (Oinonen et al., 2016b). To obtain the expected benefits from the PoM, the benefits of reaching GES were multiplied with the probability of reaching GES. Thus, the economic benefits of the Finnish PoM were estimated to be 894 million € (Oinonen et al., 2015).
Conceptual Model
To construct a model to evaluate the VoI gained through monitoring, the following components are needed (Figure 2):
1. The best available assessment of the state of the system—based on the information that is available to the manager before any additional monitoring is carried out.
2. The alternative monitoring activities that could be carried out to gain more information (possibly including the “no monitoring” option).
3. The costs of these monitoring alternatives.
4. The status assessment after the selected monitoring activity has been carried out—improved understanding of the ecosystem state if additional monitoring has been carried out.
5. The alternative management actions, depending on the status of the system. This list could also include “no action” if that is the best alternative under certain environmental states.
6. The costs of implementing the said management actions.
7. The change in the environmental status if the management options are implemented. This should be evaluated for all management actions and all environmental states that are considered possible.
8. The benefits associated to various states of nature—e.g., the benefit of reaching GES.
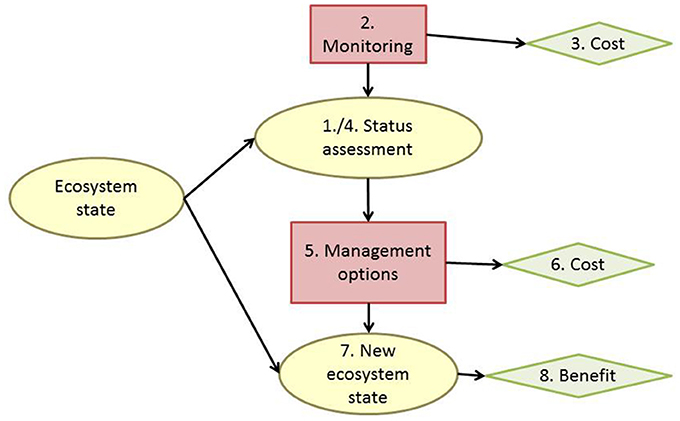
Figure 2. A conceptual model of the value of information analysis. The ovals denote uncertain, random variables, the boxes denote decisions that managers make, and the diamonds denote the costs and benefits associated to the parts of the model. Numbers refer to the components listed in the text. Note that the true ecosystem state, unknown to us but which we aim to evaluate through the assessments, affects both the assessment results and the ecosystem status after the management measures have been applied. The numbering refers to the steps described in the text.
For the computation of VoI, probabilities of the alternative possible states of the system (components 1, 4, and 7) are needed; for example, the status assessment in component 1 could be, simply, “based on what we know now (e.g., precision of the indicator value or confidence of the indicator with regard to spatial and temporal coverage), we estimate that the probability of being in GES is 30% and the probability of not attaining GES is 70%.” The classes (in the example, GES/sub-GES) can be defined according to the question at hand.
The VoI concept can be illustrated by a simple example (Table 1). In this example, the ecosystem status is divided into three classes (poor, moderate, and good), where the classes poor and moderate denote sub-GES (far from and close to the GES boundary, respectively) and good represents GES. Three management alternatives (do nothing, intermediate management, strict management) with different direct costs, and different benefits that they provide under the different environmental states, are applied. For illustration purposes, assume that good environmental status will bring benefits worth 1000 units and these benefits will not increase any further by added management. However, the net benefit will actually decrease because of the costs of the unnecessary management. The example shows that given the uncertainty about the environmental state, the optimal decision is to employ the intermediate management option, as it has the highest expected benefit. However, the best management action differs for between the three environmental states. This means that the decision maker might make different decisions if they knew the true state of the environment, and therefore, information about the true state has value. The value can be calculated by multiplying the maximum economic benefit that can be gained from each environmental state with the probability of each state, and summing up these figures. This number can be compared with the benefit that can be gained if the management scenario yielding the highest expected benefit is implemented. The difference between these figures is the value of information. In the example (Table 1), this value is 20. It must be noted that the value of information about the true state increases as the current uncertainty increases; and if the existing knowledge is already very certain, the value of perfect information may be very low.
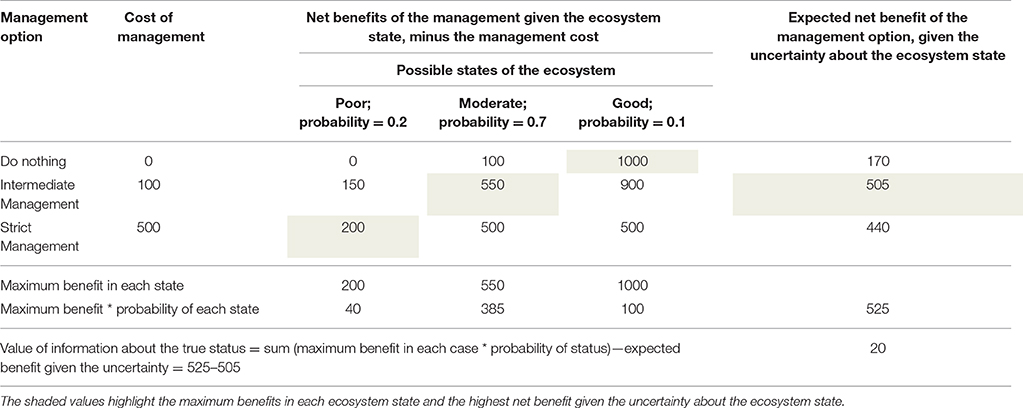
Table 1. An example calculation of the value of information, based on hypothetical figures; for explanations and references to actual data see text.
The example in Table 1 computes the value of perfect information, i.e., the value of knowing precisely the status of the ecosystem. In reality, perfect information is often unattainable. The value of imperfect information can, however, be estimated by comparing scenarios with different levels of knowledge. We illustrate this with an example of evaluating the expected value of biodiversity monitoring in the Finnish marine monitoring program in the Baltic Sea, using the best available estimates of monitoring costs, PoM, their effectiveness and costs.
Scenarios to Assess Value of Information
Applying the VoI concept (Table 1), scenarios in which varying levels of knowledge were available for the status assessment were constructed in order to optimize the benefits of defined management options to achieve GES and estimate the value of perfect information. Perfect information is here defined as 100% certainty of the environmental status when choosing the management option. In the scenarios we applied three possibilities of initial environmental status: poor, moderate and good (as defined above).
Three hypothetical scenarios for monitoring were tested: (1) No prior knowledge of the environmental status, i.e., no monitoring takes place. In this situation the status assessment result was based on chance and all three status categories were equally probable (0.33). (2) Monitoring takes place, but it is insufficient to give a confident status assessment. In this scenario, the probability of the status to be correctly assessed was set to 0.5, with 0.25 and 0.25 probabilities for poor or good status when the true status is moderate. When the true status was poor or good, the probability for the status to be assessed as moderate was set to 0.3 with a 0.2 probability for assessing good or poor status, respectively. (3) Good monitoring, with a 0.8 probability of being correct in the status assessment. When the true status was moderate, 0.1 and 0.1 probabilities were set for assessing poor or good status. If the true status was poor or good, the probability for the status to be assessed as moderate was set to 0.15 with a 0.05 probability for assessing good or poor status, respectively. These probabilities are illustrative estimates based on the expected performance of ecological indicators. In ecological studies, indicators are often considered acceptable if they predict the status correctly more than 70% of the time, and excellent if more than 80% of the time (Hale and Heltshe, 2008).
Given the scenarios, three management options were applied: (1) no management, (2) intermediate management and (3) strict management. The “no management” option did not induce any costs and no change in the environmental status was expected. The “intermediate management” option was based on the current management scheme (Finnish PoM; Laamanen, 2016), which has been estimated to cost 136.2 million € (Oinonen et al., 2016b). Based on this management option, improvement from an initial poor status to moderate status was expected. However, if the initial status was moderate, this management option was not considered to reach GES within the management cycle (Oinonen et al., 2015). In the “strict management” option, we expected that the environmental status would improve from poor to moderate and from moderate to good, respectively, depending on the initial status. The costs for the “strict management” option were set to 500 million € (roughly the double of the expected maximum costs of the Finnish PoM Oinonen et al., 2015).
Since the benefits were considered as non-market benefits arising from improved environmental status, poor environmental status was not considered to yield any benefits in the scenarios. Moderate environmental status would bring 894 million € (the benefits achieved with the current Finnish PoM by 2020) and good environmental status was set to yield 2090 million € in benefits (Oinonen et al., 2015). The “no management” option would not bring any additional benefits. In the “intermediate management” option, the improvement from poor to moderate would yield 894 million €. Also, if the initial status was moderate, intermediate management was set to bring 894 million €, thus the benefits would be 1788 million €. Also in the “strict management” option and poor initial status, benefits were considered to be 1788 million €. If the initial status was moderate, the benefits with strict management would be 2090 million €.
Results
Monitoring Costs
The yearly costs for the Finnish national marine biodiversity monitoring program were around 5.9 million € (Table 2). The largest costs were generated by the fish monitoring (2.58 million €), where the gathering of information for the Common Fisheries Policy accounted for 2.21 million €, as well as by the off-shore pelagic and benthic monitoring (2.20 million €), where running the research vessel constituted a major expense. The seal monitoring received administrative assistance from the Finnish Border Guard and thus all surveillance flights were not accounted for since the Border Guard would have flown anyway. The bird monitoring was partly based on voluntary work by ornithologists, thus reducing the costs.
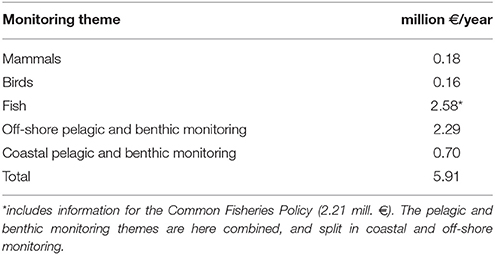
Table 2. Yearly costs of the five marine biodiversity monitoring themes in Finland.
Dividing the monitoring costs into the type of work and the categories from where the costs originated (see Table 3 for an example of the zooplankton monitoring) allowed for a more critical evaluation of the monitoring expenses. Field work and laboratory work cost approximately the same, summing up to constitute almost 50% of the total expenses of the zooplankton monitoring sub-program. Although zooplankton monitoring takes place off-shore and using a large research vessel, the research vessel cost was only 18% of the total costs when using the cost allocation of ship time per number of samples.
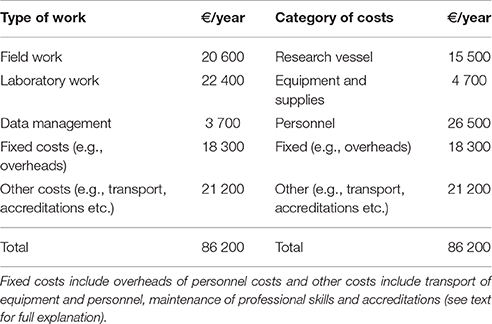
Table 3. Costs of the Finnish zooplankton monitoring sub-program itemized by the type of work and the categories from which the costs originate.
Value of Information
The scenarios showed that making the management decision based on better knowledge of the environmental status increased the expected net benefits (Table 4), with the exception of poor environmental status. In this case, strict management always brought the most benefits, regardless of the probability of correct status assessment. When no information was available for the environmental status assessment, the highest expected net benefits were achieved with strict management. If indicative information was available, strict management was the most beneficial option when the environmental status was poor or moderate, whereas intermediate management would yield the highest net benefits if the state was good. With good information available for the status assessment, the risk of making an erroneous management decision was smaller. In this case, strict management would be preferable if the environmental status was poor, and the intermediate management option would be the best choice if the initial status was moderate or good. Even in this case, the value of perfect information was 34–135 million € (Table 4).
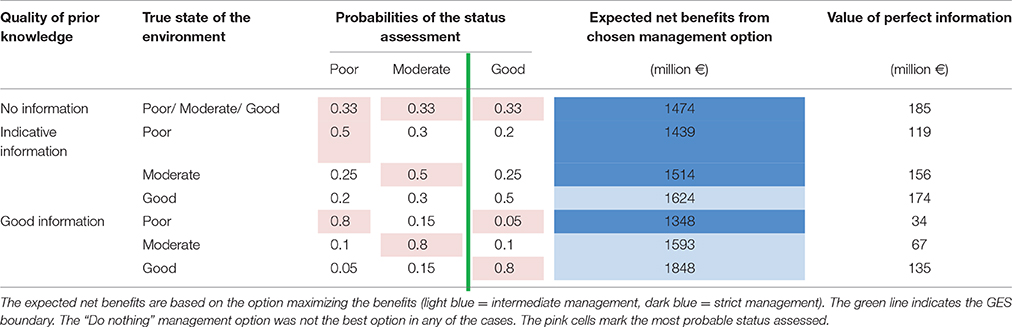
Table 4. The results from the value of information analysis based on the three scenarios with varying amount of prior knowledge.
The value of perfect information was the highest when no prior knowledge of the environmental status was available. In the scenarios where information was available for the status assessment (indicative or good information), the value of perfect information was highest when the state of the environment was good (Table 4). In these cases, the acquisition of additional information would help to distinguish between the possibility that the status is good and no management needs to be undertaken, and the possibility that the status is moderate or poor, and management measures are needed. Perfect information has the least value when the state is known (even with some uncertainty) to be poor, since strict management will be clearly the best option in that case.
Increasing the amount of knowledge available for making management decisions from no information to good information is worth 50–151 million € (the difference in the value of perfect information), depending on the environmental state. Thus, this sum could be invested in monitoring activities to increase the knowledge base and reduce the uncertainty of the made decisions. Given the assumptions, the net cost of this investment is zero, since the investment costs are covered by the increased benefits of the better decisions.
Discussion
The example presented in this paper shows that the value of improved information concerning the status of the sea can be an order of magnitude greater than the monitoring costs; in the case example up to more than a hundred million euros. While these numbers are indicative due to the simplified setup of the model, the calculation still illustrates the high value and tremendous significance of monitoring data and puts its costs into the perspective of the costs of the entire marine management framework (Figure 3).
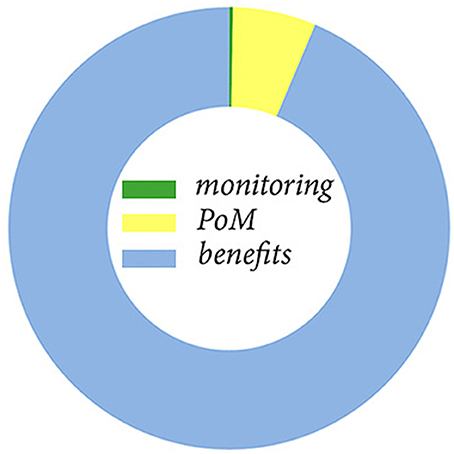
Figure 3. Relative proportions of the resources spent on the Finnish marine monitoring and the program of measures (PoM), as well as the expected benefits of the environment reaching good environmental status.
Monitoring improves the quality and reliability of the environmental status assessment, but does not directly affect the environmental status. For effective management well-planned and effective measures are the key, and sufficient monitoring provides information to aid in the required decision-making. Because of this, monitoring can in many cases actually be the most efficient way to improve the status of the seas, since it facilitates targeting and scaling the management measures more accurately. For monitoring to be effective, links to the decision-making system and management strategies need to be clear. In the MSFD, monitoring data are used not only in the status assessment, but they also provide the fundamental understanding for linking pressures from human activities to changes in environmental status (Figure 4). Thus, monitoring data are utilized also to identify measures and scaling them properly to ensure an improved environmental status after their implementation.
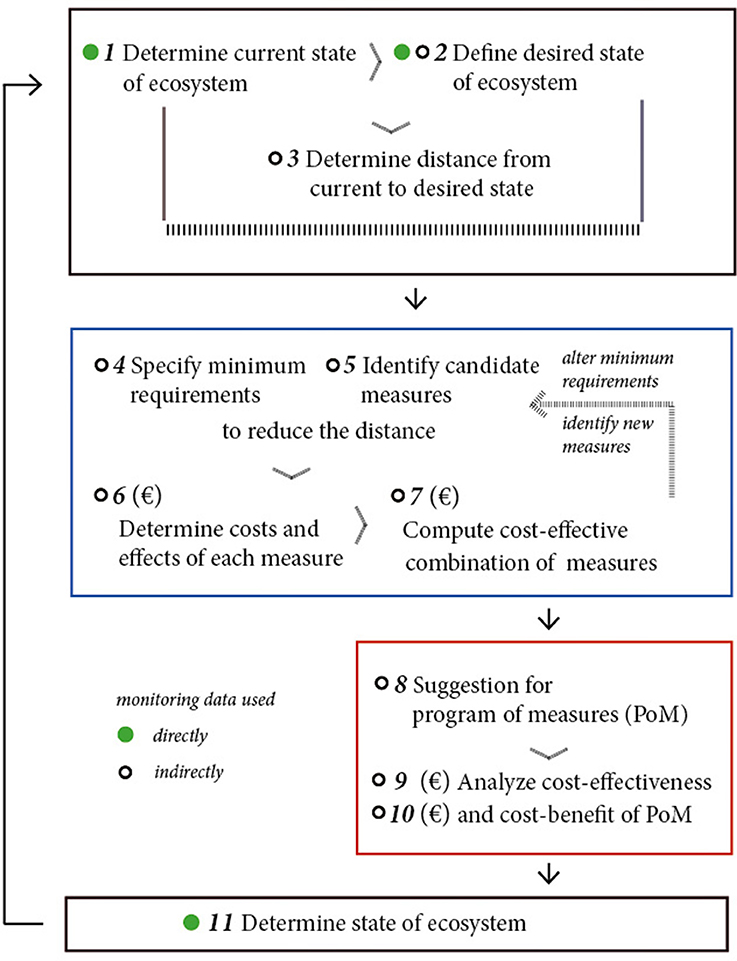
Figure 4. Conceptual figure of the MSFD management cycle (modified from Oinonen et al., 2016b). The black box indicates the steps in assessing the status and identifying the distance to the desired state (GES). The blue box includes the steps in developing the program of measures (PoM), whereas the red box indicates the implementation and effectiveness of the PoM. The steps where monitoring information is required directly (green filled circles) and indirectly (open black circles) are indicated. € indicate the steps where economic analyzes are needed.
If the environmental status is far from the GES boundary (the environmental status is either poor or excellent), this can usually be verified with less monitoring effort (e.g., with decreased frequency in monitoring): the whole confidence interval of the assessed indicator will be below/above the GES border even if the uncertainty is high. Moving closer to the GES border, the indicator confidence interval needs to be narrower in order to correctly assess the status, meaning that a higher monitoring effort is required to attain a more precise estimate of the status. However, should the sampling frequency be reduced due to a high certainty of the current environmental status, the additional benefits obtained from monitoring data (scientific, educational, and cultural) may be compromised in a way that the net savings from the reduced monitoring will be dwarfed (Lovett et al., 2007). Monitoring data are also important for development and validation of ecological models. Ecological models have capabilities to evaluate ecosystem structure and function, involving impacts of human activities, and are potentially valuable aids in environmental management (Piroddi et al., 2015; Lynam et al., 2016; Tedesco et al., 2016). Moreover, in our scenarios, even good knowledge prior to the management decision indicated that additional information would be beneficial. Interestingly, additional information had the highest value when the environmental status was good, showing the savings made by avoiding unnecessary measures.
Status assessments indicate the situation of the state of the environment at a given moment. Although the MSFD integrates an assessment period of 6 years and thus incorporates natural variability to some extent, continuous monitoring is essential to place the assessed status in a long-term context. Long-term monitoring and data series provide baselines to detect changes in ecosystem structure and function, offer empirical data for mining when exploring new questions and for developing models, as well as identify ecological surprises (Lindenmayer and Likens, 2010). Continuous monitoring also allows for timely reactions when identifying changes. Such early-warning signals allow for less costly measures compared to reacting only at a more deteriorated stage and for avoiding a total ecosystem collapse (Hutchings and Myers, 1994).
As environmental status and biodiversity are by definition multifaceted concepts (e.g., Cochrane et al., 2010) often affected by a multitude of pressures acting through multiple pathways (Korpinen et al., 2012; Andersen et al., 2015; Uusitalo et al., 2016b), the information on numerous ecosystem components provided by monitoring is essential for informed decision-making. As a consequence, the link from any single monitoring sub-program to the management measures is less straightforward than with some other management targets. However, this is not taken into account in our model, where we assume that the pressure-status relationships are known and the uncertainty in the status assessment stem only from the quality (precision, temporal and spatial coverage etc.) of monitoring data feeding into the indicators. A well-known challenge in environmental management is that the pressure-state relationships of indicators are not always clear and that several pressures impact the environment simultaneously. Consequently, a careful development and selection of indicators is needed to reduce the uncertainty of the environmental assessment.
Here, our main focus was the value of monitoring for management needs. When estimating the value of environmental monitoring, it is also important to consider benefits not directly associated with management. This aspect is seldom highlighted although monitoring is recognized as also contributing to science and to protecting resources (Griffith, 1998; Lovett et al., 2007). The scientific benefits, such as essential basic understanding of the natural processes and variability in the marine environment, are difficult to value in economic terms. The acquired scientific knowledge has uncertain, but potentially considerable, effects on the planning of future environmental management and use in ecological modeling, as well as on other parts of society such as education, culture, and other fields of science. The use of monitoring data to inform the public about changes in the environment can increase their interest for sustainable sea use and increased awareness can strengthen the commitment of citizens to facilitate and speed up the reaching of GES. Motivation of people to participate on marine protection in the Baltic Sea area has been studied for example by Söderqvist (1998) and Ahtiainen et al. (2014b).
An interesting observation and challenge was that the data on monitoring costs were not easily available. The information on costs usually consisted of lump sums from the monitoring program's accounting, and allocating them to indicator level to inform management decisions in the MSFD context was not trivial. As most monitoring sub-programs have been in place before MSFD coming into force and also before the development of indicators (which furthermore is still ongoing), none of the monitoring programs are aimed at producing only data for indicators. Thus, exact calculations of the cost of an indicator are complicated to perform. The biodiversity indicators are based on monitored parameters measured from samples. Often also other parameters are measured from the same sample and thus, not all information collected in the monitoring programs is used directly for indicators and management purposes, but this data contribute to the scientific understanding of processes taking place in nature. Additionally, an indicator may require data collected in other monitoring programs, if not for direct calculation, then at least for the interpretation of the indicator results. Since the use of research vessels, required for off-shore monitoring is expensive, ship time is used efficiently and the costs are shared by several monitoring programs and research projects. It was thus necessary to split the research vessel expenditures between the monitoring programs in order to allocate costs correctly. As the grounds for this division, we here used the number of samples collected for each monitoring program. This approach resulted in relatively low ship costs for monitoring programs relying on a low number of samples, e.g., zooplankton monitoring, compared to monitoring programs with more samples, e.g., physical and chemical monitoring of the water column, even though the data were collected during the same monitoring cruise and hence the days at sea and sea area covered were the same. The principles of gathering monitoring cost information and splitting it between indicators and/or monitoring programs need to be elaborated in order to better facilitate the use of this information for optimizing monitoring programs. Our approach, i.e., to estimate the cost per sample in the monitoring programs, is a useful approach when planning monitoring campaigns e.g., during revision of the spatial and temporal coverage of sampling.
In this study, we did not address the question of how much additional monitoring is needed in order to increase the precision of the environmental status assessment and how much resources this would require. Factors affecting the quality of the assessment are measurement accuracy as well as the spatial and temporal scales of sampling. For example, Klais et al. (2016) showed that catching the population dynamics of zooplankton communities in the Baltic Sea requires sampling every 2 weeks. Compared to the present temporal resolution of the Finnish national zooplankton monitoring (sampling twice a year), a monitoring scheme fully covering the population dynamics of zooplankton would require considerably increased resources. However, the status assessment uses one zooplankton indicator (mean size versus total stock) and the twice a year sampling during the productive season fulfills the data requirements for this indicator (Gorokhova et al., 2016). Optimizing the sampling program needs to be considered carefully taking into account what the requirements for the indicator are and what would be gained by adding spatial or temporal coverage. The monitoring cost data collected in this study allow for such evaluations, since the data provide information on costs per sample.
The VoI concept has here been illustrated with an example that can be calculated easily on any spreadsheet program. The steps needed for a VoI analysis are summarized in Table 5 with links to steps in the MSFD work. The same concept could be implemented as a Bayesian Network based influence diagram (e.g., Uusitalo, 2007) in a more refined form that would allow the direct comparison of different monitoring programs, their costs and the expected improvement in the level of knowledge about the ecosystem status.
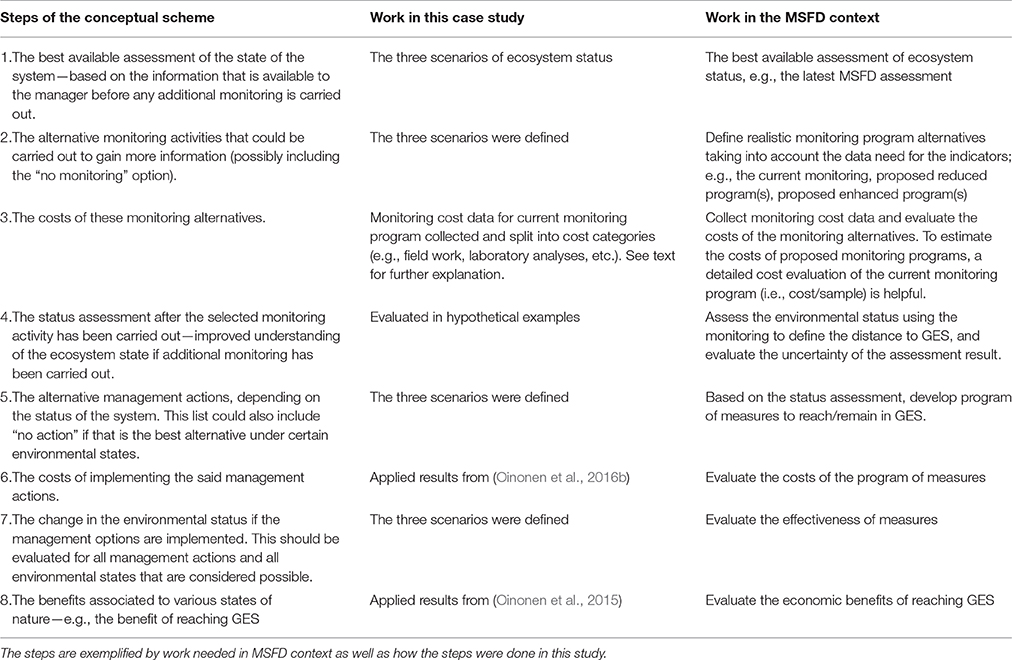
Table 5. Steps for analyzing the value of information.
Comparing the costs of the current monitoring with the value of making well-informed decisions highlights the unbalance in the present interpretation of monitoring expenses. Whereas, monitoring causes concrete costs for managers, the benefits of reliable information to more accurately scale measures are hard to trace and thus usually not considered. Further, the benefits achieved by an improved environmental status needs to be determined using economic valuation methods. Valuation of monitoring needs to have a broad approach that takes into account not only the immediate minimum knowledge needs but also the benefits gained through more efficient management and the scientific, cultural and societal value of the knowledge that is produced. Thus, the monitoring should not be priced according to its costs but according to the value it is creating to the society.
Author Contributions
HN, LU, and SO: Conceived the paper; HN, HH, and ML: Collected data on monitoring costs; LU, SO, and HN: Developed the model and scenarios; All authors contributed to the interpretation of the results. ER: Made the figures; HN: Wrote the first draft; All authors contributed to and approved the final draft
Funding
This study was supported by the DEVOTES (DEVelopment Of innovative Tools for understanding marine biodiversity and assessing Good Environmental Status) project funded by the European Union under the 7th Framework Programme, “The Ocean of Tomorrow” Theme (Grant Agreement No. 308392), http://www.devotes-project.eu, the MARMONI (Innovative approaches for marine biodiversity monitoring and assessment of conservation status of nature values in the Baltic Sea) project funded by the European Union LIFE+ Nature and Biodiversity program (Project Nr. LIFE09 NAT/LV/000238), http://marmoni.balticseaportal.net and the BONUS BIO-C3 project that was supported by BONUS (Art 185), funded jointly by the EU, and Academy of Finland.
Conflict of Interest Statement
The authors declare that the research was conducted in the absence of any commercial or financial relationships that could be construed as a potential conflict of interest.
Acknowledgments
We would like to acknowledge Joona Salojärvi for help collecting the monitoring cost data.
References
Ahtiainen, H., Artell, J., Czajkowski, M., Hasler, B., Hasselström, L., Huhtala, A., et al. (2014a). Benefits of meeting nutrient reduction targets for the Baltic Sea – a contingent valuation study in the nine coastal states. J. Environ. Econ. Policy 3, 278–305. doi: 10.1080/21606544.2014.901923
Ahtiainen, H., Artell, J., Elmgren, R., Hasselström, L., and Håkansson, C. (2014b). Baltic Sea nutrient reductions – What should we aim for? J. Environ. Manage. 145, 9–23. doi: 10.1016/j.jenvman.2014.05.016
Andersen, J. H., Halpern, B. S., Korpinen, S., Murray, C., and Reker, J. (2015). Baltic Sea biodiversity vs. cumulative human pressures. Estuarine Coast. Shelf Sci. 161, 88–92. doi: 10.1016/j.ecss.2015.05.002
Caughlan, L., and Oakley, K. L. (2001). Cost considerations for long-term ecological monitoring. Ecol. Indic. 1, 123–134. doi: 10.1016/S1470-160X(01)00015-2
Cochrane, S. K. J., Connor, D. W., Nilsson, P., Mitchell, I., Reker, J., Franco, J., et al. (2010). Marine Strategy Framework Directive – Task Group 1 Report Biological Diversity. EUR 24337 EN – Joint Research Centre. Luxembourg: Office for Official Publications of the European Communities.
Colyvan, M. (2016). Value of information and monitoring in conservation biology. Environ. Syst. Decis. 36, 302–309. doi: 10.1007/s10669-016-9603-8
European Union (2008). Directive 2008/56/EC of the European Parliament and of the Council of 17 June 2008 Establishing a Framework for Community Actions in the Field of Marine Environmental Policy (Marine Strategy Framework Directive). Available online at: http://eur-lex.europa.eu/legal-content/EN/TXT/PDF/?uri=CELEX:32008L0056&from=en
Gorokhova, E., Lehtiniemi, M., Postel, L., Rubene, G., Amid, C., Lesutiene, J., et al. (2016). Indicator properties of Baltic Zooplankton for classification of environmental status within Marine Strategy Framework Directive. PLoS ONE 11:e0158326. doi: 10.1371/journal.pone.0158326
Griffith, J. A. (1998). Connecting ecological monitoring and ecological indicators: a review of the literature. J. Environ. Syst. 26, 325–363. doi: 10.2190/VGH1-186E-JTD6-KK2N
Hale, S. S., and Heltshe, J. F. (2008). Signals from the benthos: development and evaluation of a benthic index for the nearshore Gulf of Maine. Ecol. Indic. 8, 338–350. doi: 10.1016/j.ecolind.2007.04.004
Hasler, B., Ahtiainen, H., Hasselström, L., Heiskanen, A.-S., Soutukorva, Å., and Martinsen, L. (2016). Marine Ecosystem Services: Marine Ecosystem Services in Nordic Marine Waters and the Baltic Sea – Possibilities for Valuation. TemaNord 2016:501. Copenhagen: Nordic Council of Ministers.
Hilborn, R., and Walters, C. J. (1992). Quantitative Fisheries Stock Assessment. Choice, Dynamics, and Uncertainty. Dordrecht: Kluwer Academic Publishers.
Hutchings, J. A., and Myers, R. A. (1994). What can be learned from the collapse of a renewable resource? Atlantic Cod, Gadus morhua, of Newfoundland and Labrador. Can. J. Fish. Aquat. Sci. 51, 2126–2146. doi: 10.1139/f94-214
Keisler, J. M., Collier, Z. A., Chu, E., Sinatra, N., and Linkov, I. (2014). Value of information analysis: the state of application. Environ. Syst. Decis. 34, 3–23. doi: 10.1007/s10669-013-9439-4
Klais, R., Lehtiniemi, M., Rubene, G., Semenova, A., Margonski, P., Ikauniece, A., et al. (2016). Spatial and temporal variability of zooplankton in a temperate semi-enclosed sea: implications for monitoring design and long-term studies. J. Plankton Res. 38, 652–661. doi: 10.1093/plankt/fbw022
Korpinen, S., Laamanen, M., Heiskanen, A.-S., Ahola, M., Alenius, P., Attila, J., et al. (2014). Suomen Merenhoidon Seurantakäsikirja. Ministry of the Environment, 160 (in Finnish). Available online at: http://www.ymparisto.fi/download/noname/%7BECF9A983-AC50-4DAB-B237-D7EA3A09664B%7D/103978 (Accessed June 15, 2016).
Korpinen, S., Meski, L., Andersen, J. H., and Laamanen, M. (2012). Human pressures and their potential impact on the Baltic Sea ecosystem. Ecol. Indic. 15:105–114. doi: 10.1016/j.ecolind.2011.09.023
Kosenius, A.-K., and Ollikainen, M. (2015). Ecosystem benefits from coastal habitats—A three-country choice experiment. Mar. Policy 58, 15–27. doi: 10.1016/j.marpol.2015.03.032
Laamanen, M. (ed.). (2016). Suomen Merenhoitosuunnitelman Toimenpideohjelma 2016–2021 (Programme of Measures for the Development and Implementation of the Marine Strategy in Finland 2016–2021). Reports of the Ministry of the Environment 5/2016, Helsinki.
Lindenmayer, D. B., and Likens, G. E. (2010). The science and application of ecological monitoring. Biol. Conserv. 143, 1317–1328. doi: 10.1016/j.biocon.2010.02.013
Lovett, G. M., Burns, D. A., Driscoll, C. T., Jenkins, J. C., Mitchell, M. J., Rustad, L., et al. (2007). Who needs environmental monitoring? Front. Ecol. Environ. 5:253–260. doi: 10.1890/1540-9295(2007)5[253:WNEM]2.0.CO;2
Lynam, C. P., Uusitalo, L., Patrício, J., Piroddi, C., Queiros, A. M., Teixeira, H., et al. (2016). Uses of innovative modelling tools within the implementation of the marine strategy framework directive. Front. Mar. Sci. 3:182. doi: 10.3389/fmars.2016.00182
Mäntyniemi, S., Kuikka, S., Rahikainen, M., Kell, L. T., and Kaitala, V. (2009). The value of information in fisheries management: North Sea herring as an example. ICES J. Mar. Sci. 66, 2278–2283. doi: 10.1093/icesjms/fsp206
Oinonen, S., Börger, T., Hynes, S., Buchs, A. K., Heiskanen, A.-S., Hyytiäinen, K., et al. (2016a). The role of economics in ecosystem based management: the case of the EU Marine Strategy Framework Directive; First lessons learnt and way forward. J. Ocean Coast. Econ. 2:3. doi: 10.15351/2373-8456.1038
Oinonen, S., Hyytiäinen, K., Ahlvik, L., Laamanen, M., Lehtoranta, V., Salojärvi, J., et al. (2016b). Cost-effective Marine protection - A pragmatic approach. PLoS ONE 11:e0147085. doi: 10.1371/journal.pone.0147085
Oinonen, S., Hyytiäinen, K., Ahlvik, L., Salojärvi, J., Ahtiainen, H., Lehtoranta, V., et al. (2015). Merenhoitosuunnitelman Toimenpideohjelman Valmistelun Tueksi Laaditut Taloustieteelliset Analyysit. Merenhoitosuunnitelman Toimenpideohjelman Taustaraportti, 36 (in Finnish). Available online at: http://www.ymparisto.fi/download/noname/%7B9DCCEE21-43EC-4B55-9765-1854B7CF9140%7D/113764 (Accessed June15, 2016).
Piroddi, C., Teixeira, H., Lynam, C. P., Smith, C., Alvarez, M. C., Mazik, K., et al. (2015). Using ecological models to assess ecosystem status in support of the European Marine Strategy Framework Directive. Ecol. Indic. 58, 175–191. doi: 10.1016/j.ecolind.2015.05.037
Queirós, A. M., Strong, J. A., Mazik, K., Carstensen, J., Bruun, J., Somerfield, P. J., et al. (2016). An objective framework to test the quality of candidate indicators of good environmental status. Front. Mar. Sci. 3:73. doi: 10.3389/fmars.2016.00073
Richardson, L., Loomis, J., Kroeger, T., and Casey, F. (2015). The role of benefit transfer in ecosystem service valuation. Ecol. Econ. 115, 51–58. doi: 10.1016/j.ecolecon.2014.02.018
Runting, R. K., Wilson, K. A., and Rhodes, J. R. (2013). Does more mean less? The value of information for conservation planning under sea level rise. Glob. Change Biol. 19, 352–363. doi: 10.1111/gcb.12064
Söderqvist, T. (1998). Why Give up Money for the Baltic Sea? – Motives for people's willingness (or Reluctance) to pay. Environ. Resour. Econ. 12, 249–254. doi: 10.1023/A:1008261509412
Stigler, G. J. (1961). The economics of information. J. Polit. Econ. 69, 213–225. doi: 10.1086/258464
Tedesco, L., Piroddi, C., Kämäri, M., and Lynam, C. (2016). Capabilities of Baltic Sea models to assess environmental status for marine biodiversity. Mar. Policy 70, 1–12. doi: 10.1016/j.marpol.2016.04.021
Uusitalo, L. (2007). Advantages and challenges of Bayesian networks in environmental modelling. Ecol. Modell. 203, 312–318. doi: 10.1016/j.ecolmodel.2006.11.033
Uusitalo, L., Blanchet, H., Andersen, J. H., Beauchard, O., Berg, T., Bianchelli, S., et al. (2016a). Indicator-based assessment of Marine biological diversity – Lessons from 10 Case Studies across the European Seas. Front. Mar. Sci. 3:159. doi: 10.3389/fmars.2016.00159
Keywords: environmental management, value of information, monitoring, MSFD, Marine biodiversity
Citation: Nygård H, Oinonen S, Hällfors HA, Lehtiniemi M, Rantajärvi E and Uusitalo L (2016) Price vs. Value of Marine Monitoring. Front. Mar. Sci. 3:205. doi: 10.3389/fmars.2016.00205
Received: 15 June 2016; Accepted: 03 October 2016;
Published: 20 October 2016.
Edited by:
Maria C. Uyarra, AZTI Tecnalia, SpainReviewed by:
Joana Patrício, Executive Agency for Small and Medium-sized Enterprises, BelgiumSuzanne Jane Painting, Centre for Environment, Fisheries and Aquaculture Science, UK
Copyright © 2016 Nygård, Oinonen, Hällfors, Lehtiniemi, Rantajärvi and Uusitalo. This is an open-access article distributed under the terms of the Creative Commons Attribution License (CC BY). The use, distribution or reproduction in other forums is permitted, provided the original author(s) or licensor are credited and that the original publication in this journal is cited, in accordance with accepted academic practice. No use, distribution or reproduction is permitted which does not comply with these terms.
*Correspondence: Henrik Nygård, henrik.nygard@ymparisto.fi