Implementing and Innovating Marine Monitoring Approaches for Assessing Marine Environmental Status
 Roberto Danovaro1,2*†
  Laura Carugati1*†
  Marco Berzano1
  Abigail E. Cahill3,4
  Susana Carvalho5
  Anne Chenuil3
  Cinzia Corinaldesi1
  Sonia Cristina6,7
  Romain David3
  Antonio Dell'Anno1
  Nina Dzhembekova8
  Esther Garcés9
  Joseph M. Gasol9
  Priscila Goela6,7
  Jean-Pierre Féral3
  Isabel Ferrera9
  Rodney M. Forster10 Andrey A. Kurekin11
  Eugenio Rastelli1,2
  Veselka Marinova8
  Peter I. Miller11
  Snejana Moncheva8 Alice Newton6
  John K. Pearman5
  Sophie G. Pitois12
  Albert Reñé9
  Naiara Rodríguez-Ezpeleta13 Vincenzo Saggiomo2
  Stefan G. H. Simis11,14
  Kremena Stefanova8
  Christian Wilson15 Marco Lo Martire16,17
  Silvestro Greco18 Sabine K. J. Cochrane19 Olga Mangoni20
  Angel Borja13
- 1Dipartimento di Scienze della Vita e dell'Ambiente, Università Politecnica delle Marche, Ancona, Italy
- 2Stazione Zoologica “A. Dohrn”, Napoli, Italy
- 3Centre National de la Recherche Scientifique, Institut Méditerranéen de Biodiversité et d'Ecologie Marine et Continentale, Aix Marseille Université, IRD, Avignon Université, Marseille, France
- 4Biology Department, Albion College, Albion, MI, USA
- 5King Abdullah University of Science and Technology, Red Sea Research Center, Thuwal, Saudi Arabia
- 6Centre for Marine and Environmental Research (CIMA), FCT, University of Algarve, Faro, Portugal
- 7Sagremarisco Lda, Vila do Bispo, Portugal
- 8Institute of Oceanology, Bulgarian Academy of Sciences, Varna, Bulgaria
- 9Institut de Ciències del Mar-CSIC, ICM-CSIC, Pg Maritim de la Barceloneta, Barcelona, Spain
- 10Institute of Estuarine and Coastal Studies, University of Hull, Hull, UK
- 11Plymouth Marine Laboratory, Prospect Place, The Hoe, Plymouth, UK
- 12Fish Behaviour Team, CEFAS Laboratory, Suffolk, UK
- 13AZTI, Marine Research Division, Pasaia, Spain
- 14Finnish Environment Institute (SYKE), Marine Research Centre, Helsinki, Finland
- 15OceanDTM, Riverside Business Centre, Suffolk, UK
- 16Consorzio Nazionale Interuniversitario per le Scienze del Mare (CoNISMa), Ancona, Italy
- 17EcoReach SRL, Ancona, Italy
- 18Istituto Superiore per la Protezione e la Ricerca Ambientale, Roma, Italy
- 19Akvaplan-niva AS, Fram Centre, Tromsø, Norway
- 20Dipartimento di Biologia, Università degli Studi di Napoli Federico II, Napoli, Italy
Marine environmental monitoring has tended to focus on site-specific methods of investigation. These traditional methods have low spatial and temporal resolution and are relatively labor intensive per unit area/time that they cover. To implement the Marine Strategy Framework Directive (MSFD), European Member States are required to improve marine monitoring and design monitoring networks. This can be achieved by developing and testing innovative and cost-effective monitoring systems, as well as indicators of environmental status. Here, we present several recently developed methodologies and technologies to improve marine biodiversity indicators and monitoring methods. The innovative tools are discussed concerning the technologies presently utilized as well as the advantages and disadvantages of their use in routine monitoring. In particular, the present analysis focuses on: (i) molecular approaches, including microarray, Real Time quantitative PCR (qPCR), and metagenetic (metabarcoding) tools; (ii) optical (remote) sensing and acoustic methods; and (iii) in situ monitoring instruments. We also discuss their applications in marine monitoring within the MSFD through the analysis of case studies in order to evaluate their potential utilization in future routine marine monitoring. We show that these recently-developed technologies can present clear advantages in accuracy, efficiency and cost.
Introduction
Marine ecosystems are subject to a multitude of direct human pressures, such as overexploitation, eutrophication, pollution and species introductions (Halpern et al., 2008; Hoegh-Guldberg and Bruno, 2010; Burrows et al., 2011), including the effects of global impacts, namely ocean acidification and climate change (Doney et al., 2012). These stressors can have synergistic effects on marine ecosystems (Mora et al., 2013; Griffen et al., 2016), altering their functioning and ability to provide goods and services (Worm et al., 2006; Crain et al., 2008). Their impact is expected to be even stronger in enclosed and semi-enclosed basins with high population density, tourism flow and maritime activities (Danovaro, 2003). Improved knowledge on the consequences of the effects of multiple stressors on marine biodiversity and ecosystem functioning is urgently required (Danovaro and Pusceddu, 2007; Zeidberg and Robison, 2007; Danovaro et al., 2008; Nõges et al., 2016; Zeppilli et al., 2016). In 2008, the European Commission enacted the Marine Strategy Framework Directive (MSFD; 2008/56/EC), which aims to manage the European seas by using an ecosystem-based approach in order to gain a healthy and productive state (so called good environmental status; GES; see Box 1 for the list of acronyms) (Borja et al., 2013).
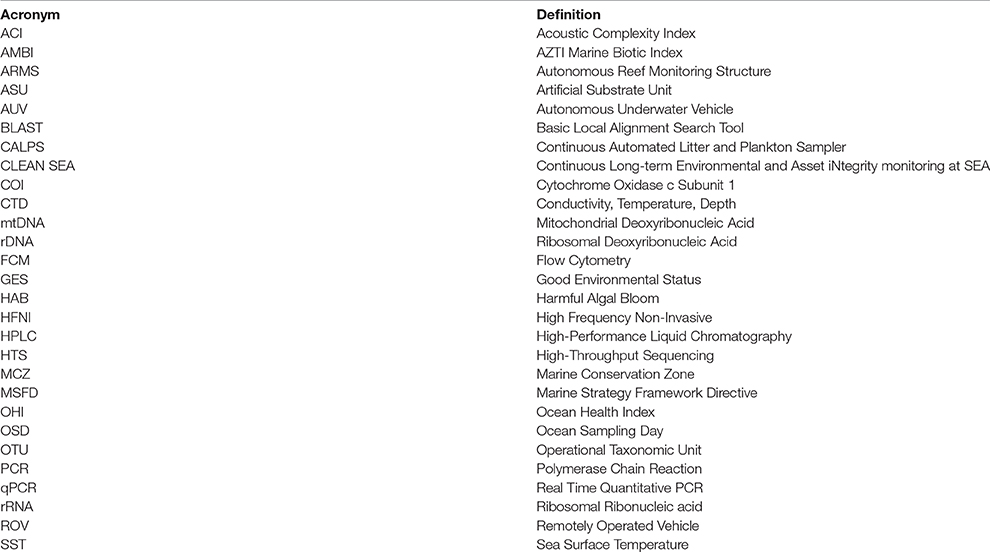
Box 1. List of the acronyms used.
The MSFD particularly aims at investigating the functioning of ecosystems (Cardoso et al., 2010; Borja et al., 2011), making a shift from structural, site-specific approaches to a functional, whole-sea system of monitoring (Borja and Elliott, 2013). An overarching aim is to promote regional harmonization of monitoring methods, used to assess marine environmental health and to obtain complete and long-term datasets from multiple ecosystem components, ranging from microbes to large marine mammals (Caruso et al., 2015).
Traditional methods applied to analyse marine biodiversity (e.g., morphological species identification, laboratory culture, toxicological analyses) are based on morphological identification and observational surveys, which are costly, time consuming and characterized by low upscaling potential to resolve change. One of the most evident limitations of traditional approaches is the identification and quantification of rare species and the ability to distinguish morphologically close or identical species (i.e., cryptic species), or poorly characterized juvenile stages of known species. Recently developed technologies present a wide variety of advantages including a higher taxonomic resolution and the capability to rapidly provide, often in near real time, information regarding wide geographic areas (remote sensing) or large temporal scales (e.g., autonomous observation platforms—buoys, moorings, ships-of-opportunity). As a result, the technological advancement is evolving in two main directions: (i) innovative molecular approaches for rapid biodiversity assessment (Bourlat et al., 2013); and (ii) autonomous and sensitive (optical) sensor systems, which allow us to operate and collect data in situ over wide spatial and temporal scales (She et al., 2016). Methods able to combine both requirements are thus highly desirable.
Innovative molecular technologies have fundamentally changed our understanding of biodiversity, particularly for microbes, rare species, “soft-species” or extremely small specimens, which are difficult to identify and cryptic species (to be studied combining molecular and morphological information; e.g., Derycke et al., 2005; Sogin et al., 2006) and new sensors and in situ technologies have already been applied to identify new forms of life in remote deep-sea habitats (Danovaro et al., 2014). However, most of the approaches/tools still need to be tested prior to their application in routine marine monitoring (e.g., EU project DEVOTES DEVelopment Of innovative Tools for understanding marine biodiversity and assessing good Environmental Status). In this overview, we investigate the potential applications of various innovative tools and approaches in order to evaluate their applicability to routine marine monitoring, with a special focus on three main categories, which seem to be the most promising: (i) molecular approaches; (ii) innovative systems for in situ analysis; and (iii) remote sensing.
Molecular Approaches to Assess Marine Biodiversity: from Microbes to Macrofauna
Morphological identification of species is heavily dependent on taxonomic experts, who are generally specialized on some specific groups of organisms (McManus and Katz, 2009; Bacher, 2012), and in some cases, the identification is impossible (e.g., cryptic and microbial species). Moreover, traditional taxonomy is generally time-consuming (Bourlat et al., 2013; Carugati et al., 2015), making large-scale and intense monitoring programs difficult to be undertaken. Molecular techniques are more universal (e.g., can target a broader range of taxa in a single analysis) and are less influenced by taxonomic expertise. Hence, molecular approaches have the potential to contribute to a large number of MSFD Descriptors (Table 1) and are promising tools to analyse the biodiversity of different biotic components (e.g., from prokaryotes, micro-eukaryotes to metazoans; Table 2), to identify species with different phenotypes or through the different stages of the life cycles (still unknown for the majority of marine species).
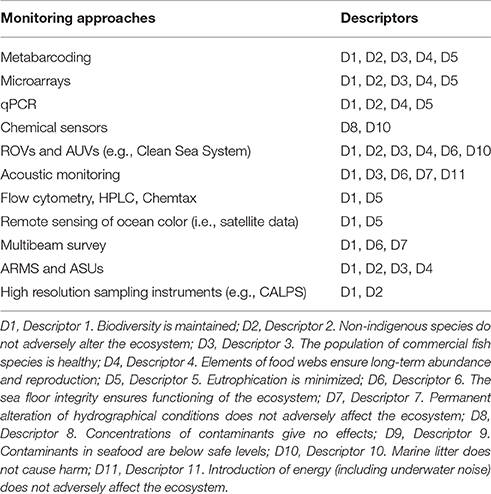
Table 1. List of monitoring tools and MSFD Descriptors covered in this review.
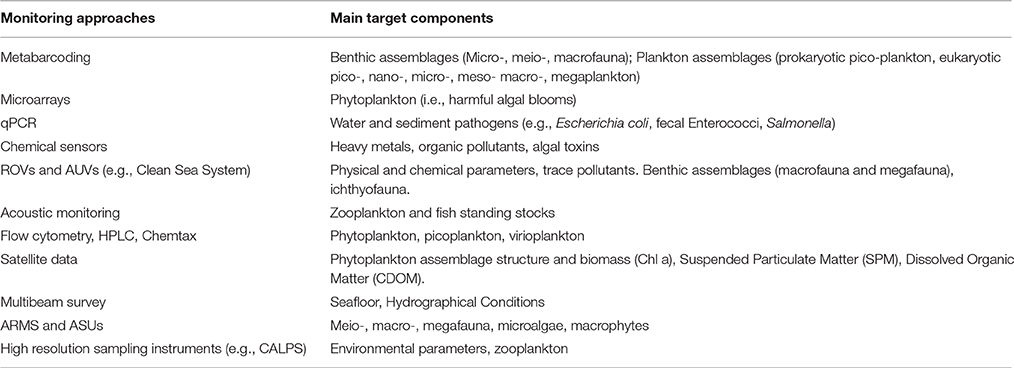
Table 2. List of monitoring tools and ecosystem (abiotic and biotic) components to be used for.
Use of Metabarcoding to Study Marine Biodiversity
The term “metabarcoding” refers to large-scale analyses of biodiversity through the amplification and sequencing of marker genes (e.g., 18S and 16S rDNA, Creer et al., 2010) and may also apply to capture-enrichment approach (Taberlet et al., 2012). Originally, most of the studies based on metabarcoding focused on prokaryotes (e.g., Sogin et al., 2006; Gilbert et al., 2009; Brazelton et al., 2010; Salazar et al., 2016), but, more recently, eukaryotes have also been investigated, including marine protists (e.g., Amaral-Zettler et al., 2009; Stoeck et al., 2010; Logares et al., 2014a; de Vargas et al., 2015; Massana et al., 2015) and metazoans (Thomsen et al., 2012; Lindeque et al., 2013; Hirai et al., 2015; Pearman and Irigoien, 2015). The development of high-throughput sequencing (HTS) technologies and of standardized procedures could allow metabarcoding analyses to be included in routine monitoring programmes (Visco et al., 2015; Zaiko et al., 2015a,b).
Morphology-based studies target a limited range of taxa (e.g., meiofauna or macrofauna). These biotic components host a potentially large number of cryptic and rare species (Ainsworth et al., 2010), which could be contextually detected using universal primers, targeting a broad range of taxa at the same time. This could lead to the incorporation of novel candidates for indicator species. For example, Chariton et al. (2010) suggested that phyla such as Kinorhyncha could be sensitive to contamination and used as an indicator. Metabarcoding could also be applied to assess changes in community structure along a disturbance gradient (Hewitt et al., 2005), or to detect non-native transient species (Jerde et al., 2011; Dejean et al., 2012; Cowart et al., 2015; Viard et al., 2016), allowing for better planning and implementation of conservation approaches. An interesting potential development of molecular techniques is the detection of sequences of eukaryotes from ancient DNA, or from the extracellular DNA pools, which enable the comparison between living species and species that were present in the same area in the (even recent) past (Corinaldesi et al., 2008, 2011, 2014; Pearman et al., 2016b). In addition, the progressive reduction of the costs of sequencing over time makes large-scale metabarcoding more feasible (e.g., de Vargas et al., 2015; Salazar et al., 2016).
Although metabarcoding can represent a useful tool for the census of marine biodiversity, there are still different shortcomings and pitfalls that prevent its extensive use in marine monitoring programmes. Metabarcoding can indeed provide an inaccurate or wrong estimation (under/over estimation) of the actual biodiversity of the sample due to variability in primers, PCR conditions, sequencing technology and bioinformatics pathways used.
The use of different marker genes could give different results in terms of taxonomic composition. Different gene regions vary in both taxonomic coverage and species-resolving power, leading to the introduction of errors in the identification and estimates of taxon relative abundance (Bik et al., 2013). The mitochondrial gene encoding for the cytochrome oxidase c subunit 1 (COI), is one of the preferred candidate loci for standard DNA barcoding projects (e.g., the International Barcode of Life, http://ibol.org). However, alternative genomic regions (e.g., nuclear 16S/18S rRNA genes, 12S mtDNA) characterized by more conserved priming sites have been identified as more appropriate for “metabarcoding” studies allowing to broader scale amplification of biodiversity across the eukaryotic taxa (Deagle et al., 2014). Nevertheless, for some taxa, these markers provide little resolving power at the species level. A possible alternative is represented by D2–D3 “diversity loop” region of 28S rRNA. A possible way forward to address this issue is represented by the multi-barcode approach (i.e., using a cocktail of gene markers for the same sample), which could help to improve taxonomic coverage and resolution.
Setting the best PCR conditions to recover the organisms present in an environmental sample is crucial for a successful application of metabarcoding to routine marine monitoring. A recent study demonstrated that different PCR conditions could affect the final taxonomic assignment in metabarcoding studies. A constant low annealing temperature (46 or 50°C) provides more accurate taxonomic inferences compared to the touch down profile (Aylagas et al., 2016). Conversely, increasing the number of PCR cycles leads to the increase in the number of spurious sequences and chimeras formed (Haas et al., 2011). Chimeras can inflate the overall biodiversity estimates and be eliminated by comparing the length of matched bases from the top hit in a MEGABLAST search to the length of the query sequence. As long as the database sequence is longer than the query sequence and a portion of the 3′ end does not match, it is likely that the query is a recombinant. Chimeras can be removed also by using other algorithms, including Perseus (Quince et al., 2011), UCHIME (Edgar et al., 2011) and USEARCH (Edgar, 2010).
The choice of the sequencing platform is strictly linked to the aim of the research (Carugati et al., 2015). Recently Illumina platforms have become more appealing than the Roche 454 to assess metazoan biodiversity, because of their increasing read lengths, lower per base cost, production of tens to thousands times more sequences, and lower error rates (0.1% vs. 1%, Glenn, 2011).
Metabarcoding is not exempt from errors: i) during the processing of the samples (e.g., DNA amplification steps producing “chimeras,” see above; Cline et al., 1996; Smyth et al., 2010), (ii) during sequencing (Glenn, 2011), and/or (iii) presence of multi-copy genes within a single species (e.g., Telford and Holland, 1997; Alverson and Kolnick, 2005; Bik et al., 2012). Metabarcoding based on PCR cannot yet provide reliable biodiversity indices since, especially for eukaryotes, it does not supply information on the abundance of every single species detected (Lindeque et al., 2013; Hirai et al., 2015). Most of the studies aimed at evaluating the relationships between species abundance and metabarcoding data obtained looser associations (Carew et al., 2013; Zhou et al., 2013; Hirai et al., 2015). Conversely, stronger relationships have been reported between biomass and read proportions (Elbrecht and Leese, 2015). Measure of relative abundance within metabarcoding samples need to be carefully considered. Nevertheless, in the absence of primer bias, a species characterized by larger biomass should be reflected by a greater proportion of sequence reads. Conversely, if the species is smaller or rarer, then fewer reads are likely to be obtained (Creer et al., 2016).
We are at the very beginning of applying this approach to analyse marine eukaryotic biodiversity. Further studies associated with the recent progress made in DNA sequencing technologies will allow elimination of DNA amplification steps and could open new perspectives to use metabarcoding in marine monitoring programmes. A recently developed approach, which could avoid PCR biases is based on the Illumina-sequencing of environmental metagenomes (mitags) (Logares et al., 2014b). We suggest that this method could represent, in the future, a powerful alternative to 18S rDNA amplicon sequencing and a useful tool to obtain simultaneously information on taxonomic and functional diversity.
An additional limitation of metabarcoding is that it does not differentiate between life stages, and thus juvenile stages and adults are pooled together. Further, species lists produced through metabarcoding currently are presence-absence based, and lack relative abundance data. Thus, traditional community analyses used for impact detection cannot be applied in the traditional manner, and instead the focus will be on overall species richness and presence of indicator species.
Another issue is represented by the still limited availability of sequences in public databases (Carugati et al., 2015). In some cases, operational taxonomic units (OTUs) can not be taxonomically assigned to a species, or even to a genus, due to the paucity of data in reference databases and the lack of taxonomic resolution at the species level of the marker gene (Dell'Anno et al., 2015; Leray and Knowlton, 2016). Thus, exploiting the data will require the continued refinement of database resources and bioinformatic pipelines (Minster and Connolly, 2006; Hajibabaei et al., 2011; Bik et al., 2012; Radom et al., 2012).
Consequently, the collaboration between molecular ecologists and taxonomists is required for the accurate characterization of species and for the deposition of quality assured barcode sequences in public databases (Jenner, 2004). The improvement of reference databases and thus the ability to assign OTUs to known species will enable metabarcoding techniques to be more reliably used in monitoring surveys, with high potential for the detection of non-indigenous species. It is also important to underline that relating sequences to taxonomically described species is not a necessity for many applications since in monitoring the focus is in pattern changes, not on taxonomic composition per se. We suggest that, in order to apply metabarcoding for the purposes of the MSFD (e.g., Descriptor 1), an attempt could be made using the overall species richness. For instance, significant changes in the species richness of the community can be a useful warning indicator and assessing such changes does not require that each molecular OTU is assigned to a precise taxon. The Biodiversity Descriptor of the MSFD does not explicitly require that species are all taxonomically identified. Furthermore, molecular barcodes of a species, even when the species is not in the reference database, generally allow identification at the genus or family level if other species of the same genus or family are present in the reference database.
Case study 1. Microbes
HTS approaches have been recently applied to study the biodiversity of marine viruses (Tangherlini et al., 2012), bacterioplankton (Bacteria and Archaea) (e.g., Sogin et al., 2006; Gilbert et al., 2009; Brazelton et al., 2010), eukaryotic pico- (0.2–3 μm) (e.g., Shi et al., 2009; Massana et al., 2015), nano- (3–20 μm) (e.g., de Vargas et al., 2015; Massana et al., 2015), and microplankton (20–200 μm) (e.g., de Vargas et al., 2015). Data on their abundance and diversity may provide useful information on the impact of human pressures. Protists have been recurrently proposed as bioindicators (Payne, 2013). Nevertheless, the bacterioplankton component is still neglected by the MSFD (Caruso et al., 2015). The use of HTS allows the analysis of microbial biodiversity at an unprecedented scale, greatly expanding our knowledge on the microbiomes of marine ecosystems (Caporaso et al., 2011). These approaches provide relatively fast and cost efficient observations of the microbial component, and thus, may be suitable tools in biodiversity monitoring programs (Bourlat et al., 2013). Application of recently developed sequencing methodologies (e.g., Illumina technologies) to the analysis of the 16S rRNA gene for bacteria and of the 18S rRNA gene for eukaryotes in samples taken along the Barcelona coast (NW Mediterranean Sea) suggests that certain taxa (i.e., members of the Gammaproteobacteria) as well as the ratio between some phylogenetic groups may be good indicators of ecosystem health status. However, the robustness of these indicators needs to be explored by gathering data on plankton diversity in coastal areas subjected to different degrees of anthropogenic pressure over various temporal and spatial scales. Seasonality seems to play a major role in shaping bacterioplankton biodiversity and community structure (Gilbert et al., 2012; Cram et al., 2015) which could overwhelm the effects of human-induced pressures. Thus, despite being extremely promising, the suitability of incorporating prokaryotic/eukaryotic biodiversity into MSFD descriptors needs to be further explored in order to discriminate between changes resulting from human activities and the natural variability of the marine environment (Ferrera et al., 2016).
Case Study 2. Meiofauna
Small metazoans belonging to the meiofauna are sensitive to environmental changes and are increasingly used in monitoring studies for the assessment of environmental quality (Moreno et al., 2011; Pusceddu et al., 2011). However, meiofaunal diversity is so large that the analysis of a single phylum, such as Nematoda, requires huge investments of time from highly specialized taxonomists. Metabarcoding could facilitate the census of biodiversity, especially for meiofauna, for which morphological identification is difficult. The typical metabarcoding workflow used to study meiofaunal biodiversity in marine benthic ecosystems is reported in Figure 1. Recent investigations of shallow and deep-sea nematodes based on 454 sequencing and classical morphological identification revealed that, at the order-family level, metabarcoding assignments matched the results obtained by morphological techniques, but some OTU's remained unassigned (Dell'Anno et al., 2015). Although metabarcoding is a useful tool to explore the diversity of marine meiofaunal organisms, it still presents some gaps. Indeed, not all species in a sample are detected and a certain percentage remains unidentified due to the limited coverage of public sequence repositories for meiofaunal taxa (Carugati et al., 2015). This applies particularly to the deep sea, where most of the taxa are still unknown (Appeltans et al., 2012). Thus, we suggest to continue combining morphological identification performed though light microscopy with molecular analyses, in order to feed or even create local database, at least for marine protected area or high priority areas. To more accurately delineate species in metabarcoding datasets major efforts should be devoted to understanding the actual variability of the 18S rRNA gene amongst individuals of the same species and amongst different species taking into account the contribution of potential biases due to PCR and sequencing steps in such variability. There is also the urgent need to identify alternative single copy markers, nuclear or mitochondrial, less subjected to such intra-specific variability. Finally, alternative solutions can be the use of non-PCR-based metabarcoding approaches, using capture probes, which are much less sensitive to mismatches between probe/primer and target and may replace PCR-metabarcoding. Future investigations are needed to address these issues in order to facilitate the inclusion of meiofaunal diversity in marine monitoring programs.
Figure 1. Standardized workflow to study meiofaunal biodiversity in marine benthic ecosystems using high-throughput sequencing. Sediment samples (from shallow to deep-sea environments) are collected and subsequently frozen (−20°C or −80°C). In the laboratory, meiofaunal organisms are recovered from the sediments and their DNA extracted and purified. Following the PCR amplification of marker genes (e.g., 18S rRNA), high-throughput sequencing can be conducted on Roche 454 or Illumina platforms. Raw reads are processed and then clustered into operational taxonomic units (OTUs) under a range of pairwise identity cutoffs. After the BLAST-match of the obtained OTUs against public nucleotide databases, analysis of α- and β-diversity and phylogeography are performed. Image of Illumina MiSeq platform: Source: Wikipedia, Author: Konrad Förstner (Carugati et al., 2015).
Case Study 3. Macrofauna
Marine benthic macroinvertebrates are commonly used as indicators of ecosystem health; yet, calculation of biotic indices based on macro-invertebrate taxonomic composition (e.g., AMBI) requires each sample to be sorted and each specimen to be taxonomically identified by an expert taxonomist. This is a tedious, expensive and time-consuming process, which has limitations, particularly when cryptic species, damaged specimens or immature life stages are present (Ranasinghe et al., 2012). Metabarcoding is a promising alternative to overcome the limitations of traditional taxonomy and can help in ensuring the accomplishment of temporarily and spatially comprehensive monitoring. However, before routine implementation of this approach, the development of standardized practices at each step of the procedure (Aylagas and Rodríguez-Ezpeleta, 2016) and the increase of the reference libraries for taxonomic assignment are required (Aylagas et al., 2014). Additionally, in order to ensure accurate biotic indices derived from metabarcoding, the ability to detect the majority of organisms representing the full gradient of tolerance to pollution is necessary. With the aim of benchmarking metabarcoding against traditional taxonomy in the context of biotic index calculation, Aylagas et al. (2016) performed a thorough experiment comparing taxonomic inferences and biotic indices derived from samples of known species composition analyzed using alternative metabarcoding protocols. The work resulted in a series of guidelines for the application of metabarcoding for macroinvertebrate monitoring.
The Application of Microarrays for the Detection of Harmful Algal Blooms
Microarrays have been applied for in situ detection of harmful algal bloom (HAB) species (Descriptors D1, D2, D5 in the MSFD; see Table 1 for more details). This method is especially useful for the rapid identification of toxic algae (Table 2) that can have serious consequences on human health (Bricker et al., 2007). The European project MIDTAL (Microarrays for the detection of toxic algae) has developed a microarray to target major HAB species including toxic dinoflagellates, raphidophytes, prymnesiophytes, Dichtyocophyceae and the diatom Pseudonitzschia (Lewis et al., 2012). Microarrays are made of coated solid surfaces onto which a large number of selected DNA probes (specific for a taxon) can be spotted. Each probe is fluorescently labeled and when the probe hybridizes with a sample, the sample/probe complex fluoresces in UV light. An advantage of this approach is that no PCR step is required when total RNA is selected and this reduces the bias of any unknown inhibitors in the sample. Because microarrays rely on DNA probes for detection of HAB species, the potential for new indicators could be nearly unlimited. This chip has been tested on selected seawater samples previously morphologically identified. Microarrays have shown high sensitivity and several species not identified under light microscope have been recognized by the probes on board the microarray. Thus, microarray could be a potentially useful tool to provide quick evaluation on the presence of toxic algae. However, the use of microarray presents a series of limits. Some of the algal species morphologically identified in a sample could not be detected by the molecular probes. Moreover, the sensitivity of selected probes was confirmed at genus level, but at species level the results were less satisfactory. The costs of the MIDTAL microarray chip plus reagents and consumables is still high. Thus, further attempts are needed to make convenient and accurate the results provided by the use of the microarray approach and we recommend the use of the microarray in monitoring programs only if combined with microscopy analyses. The combined approach between current monitoring practices and microarrays could be applied in the MSFD (e.g., Descriptor 5) in order to provide quick and reliable information on the presence of algae potentially toxic for human health.
Quantification of Pathogens by Means of Real Time quantitative PCR (qPCR)
Real-time polymerase chain reaction (qPCR) consists of the amplification and quantification of a gene sequence specific to the organism(s) of interest. The correlation of the amount of DNA obtained with the number of individuals allows the quantification of the investigated organisms in a given sample. This procedure could be applied only to unicellular organisms that contain a known number of copies of the gene under study. Exponential amplification of the target sequence is followed in real-time by means of a fluorescent dye or a fluorescently labeled DNA probe. Quantification is performed by comparison to a standard curve, which is run concurrently with samples using reference material consisting of pre-enumerated cells or DNA. qPCR has been recently tested to evaluate the quality of the freshwater and marine environment (Descriptors D1, D2, D5 in the MSFD, Table 1; Newton et al., 2011; Harwood et al., 2014; Lu et al., 2015). Traditionally, the classical microbiological analyses include the investigation, by using cultivation techniques, of the abundance of fecal indicator bacteria such as Escherichia coli and Enterococci in water samples, and E. coli, Enterococci and Salmonella in sediment samples (Table 2). The determination of total prokaryotic abundances could be also performed through epifluorescence microscopy. Such a technique allows the determination of the whole quantitative relevance of marine microbes contrary to the cultural techniques, which can only detect less than 1% of the actual abundance of prokaryotes (Staley and Konopka, 1985). Epifluorescence microscopy could be utilized in combination with qPCR of the prokaryotic 16S rRNA genes. The combined use of qPCR and metabarcoding could open new perspectives to investigate the biodiversity of the microbial community in seawater and sediment samples and in particular the relevance of human pathogens, going beyond the limits of the traditional approaches.
In situ instruments to Monitor Marine Abiotic and Biotic Variables
Some of the best approaches to meet current demands in marine monitoring are represented by novel in situ technologies, which provide high-frequency (continuous or semi-continuous) observations. So far, most of in situ instruments have been developed to monitor marine hydrological and physico- chemical variables, whereas the monitoring of the biotic variables is still mostly dependent on non-remote or automatic devices. An example is the system of SmartBuoys, which house a range of instruments for measuring salinity, temperature, turbidity, chlorophyll fluorescence, oxygen saturation and nitrate concentration. Such instruments enable the creation of wide-scale international networks of environmental data acquisition and sharing, as implemented in the framework of the ongoing S&T Med European project (http://stmedproject.eu/). Nonetheless, technological limitations are at the base of the presently scarce modeling capacity regarding population/stock and biodiversity assessments as well as ecosystem functioning.
Chemical Sensors
There are few sensors currently in use for monitoring concentrations of heavy metals, organic pollutants and algal toxins. An in situ analyzer has been developed to measure nitrate plus nitrite and total sulfide in deep-sea areas close to hydrothermal vents (Le Bris et al., 2000). More recently, Vuillemin et al. (2009) developed an in situ analyzer (the CHEMINI system) which measures analytes at even greater depths. However, as for any instrument deployed at sea, especially in nutrient rich environments, it is subjected by a rapid biological colonization (biofouling), which can limit overall deployment times (Mills and Fones, 2012).
Seabed Observatories
Marine observatories allow the collection of long-term time series of environmental parameters, but have yet not been commonly used. It is widely recognized that underwater technology could open new and interesting opportunities to ensure continuous, long-term, execution of monitoring. In particular, during the last decades, underwater video technologies have gained considerable importance in all fields of marine science. They represent a powerful, non-destructive and useful tool to study the dynamics and the interactions between benthic organisms, especially on hard-bottom sediments where traditional grab methods are ineffective. The use of underwater visual surveillance is becoming increasingly accessible for monitoring activities since it is versatile, serving as an “underwater eye” for researchers. Video cameras can be mounted on various vehicles ranging from simple towed platforms, Remotely Operated Towed Vehicles (ROTVs), to more advanced systems such as Remotely Operated Vehicles (ROVs) or Autonomous Underwater Vehicles (AUVs). Stills photos can be acquired using drop cameras, mounted on ROVs or by diver at shallow depths, and long-term data series can be used to study the links between biodiversity and climatic variations, for example correlating changes in biodiversity related to the North Atlantic Oscillation (NAO) index (Beuchel et al., 2006). In coastal benthic and pelagic systems at shallow depth, SmartBuoys equipped with underwater cameras can enable such time-series studies, contextually monitoring multiple environmental parameters to complement visual information. In general, video surveys produce indicators of overall sediment conditions and frequency of occurrence of the most visible taxa. Indicators from stills images focus on small-scale observations and automated image recognition techniques can be employed to quantify both presence and abundance of organisms but also extent of coverage or various proxies for biomass (Beuchel et al., 2006).
The increasing use of ROVs, AUVs and non-permanent camera stations have provided new insights on the biodiversity and ecosystem functioning of continental margin and deep-sea ecosystems (Solan et al., 2003; Stoner et al., 2008). However, challenges emerge in that inherently qualitative information needs to be converted into quantitative data from which indicators can be developed. ROV technology is available at all offshore petroleum installations, and biological visual seabed surveys frequently are carried out in potentially sensitive habitats both before and after the drilling event. Using a set of customized visual indicators, the extent of seabed smothering can be quantified and appropriate mitigation measurements planned based on the information collected during these surveys. Autonomous and cabled observatories are receiving increasing attention in marine science and have been demonstrated as capable platforms for collecting data remotely, and increasing insight into the functioning of remote marine ecosystems (Taylor, 2009; Best et al., 2013). Such cabled systems are expected to become an important tool in marine monitoring and management (Aguzzi et al., 2012a).
A possible limit of the use of video-imaging systems is that the lights necessary to acquire the images may influence the behavior of the organisms being observed. Operational lifetimes of remotely deployed instruments are often limited by the available power supplies. Cabled observatories can provide the power to operate for long-term periods. However, the establishment of the infrastructure is still expensive and therefore limited in scope. Many in situ instruments still rely on commercially available batteries, which could limit they autonomy. Small wireless autonomous devices, such as remote marine sensors can be less energy consuming thus allowing longer deployments (Mills and Fones, 2012). Another challenge is represented by the large amount of data generated, which need to be stored and processed. Cabled multiparametric seafloor observatories are usually connected to the shore to transmit data in real-time. Data could be delivered via cable, automatically streamed to an internet socket, uploaded onto the website and automatically processed (Aguzzi et al., 2012b).
Underwater Autonomous and Integrated Monitoring
An interesting, recently developed technology is the CLEAN SEA (Continuous Long-term Environmental and Asset iNtegrity monitoring at SEA; Figure 2), which uses a commercially available AUV, upgraded with technologies enabling off shore monitoring of seafloor integrity and pollution (Table 1). This vehicle is characterized by a set of sensors able to measure both physical and chemical parameters and carry out in situ analysis of trace pollutants (Table 2). The CLEAN SEA system can also collect discrete water samples in situ. It is developed to perform acoustic surveys of the seabed and pipelines/flowlines as well as to detect hydrocarbon leakage. The CLEAN SEA system can also perform benthic community survey with detailed photographic/video coverage of the investigated area in order to determine the abundance and biodiversity of benthic assemblages and their temporal variations (Table 2). CLEAN SEA is characterized by wireless underwater communication for mission data downloading and wireless power recharge for increased autonomy. This may enable a “permanent” operation subsea independently of support from surface. CLEAN SEA seems to be a powerful technology for future environmental monitoring around oil and gas infrastructures and to gain long-term data on abiotic and biotic variables.
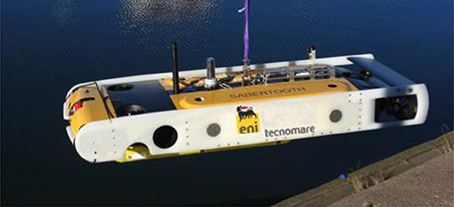
Figure 2. The CLEAN SEA (Continuous Long-term Environmental and Asset iNtegrity monitoring at SEA). The Clean Sea system, launched by Eni E&P and its subsidiary Eni Norge, in cooperation with Tecnomare, is a commercially available AUV, properly upgraded with key enabling technologies, for the execution of environmental monitoring and asset integrity in offshore fields.
Biosensors
High frequency non-invasive (HFNI) valvometers have been utilized as a potential tool for long-term marine monitoring and assessments (Andrade et al., 2016). The principle of the method is based on the regular gaping behavior (closing and opening of the valves) of bivalve molluscs and the fact that physical or chemical stressors disrupt that gaping reference pattern. Bivalve gaping behavior is monitored in the natural environment, remotely, continuously over a long-time period (e.g., years), requirements that must be fulfilled if bivalve behavior is to be a useful biomonitoring tool. We here suggest the potential application of the HFNI valvometry as a biosensor to monitor and provide early-warning alerts of changes in water quality, such as temperature increase, releases of contaminants and toxic algal blooms. Finally, HFNI valvometry could be used in the MSFD for routine monitoring of areas impacted by anthropogenic activities such as bathing beaches and harbors, oil platforms and aquaculture installations.
Acoustic Monitoring
An alternative method for studying marine organisms is a non-invasive acoustic approach. Active and passive hydroacoustics have explored a wide range of ecological subjects, such as pelagic communities, behavior, predator–prey interactions, and fish standing stock. The use of passive acoustic technologies (e.g., hydrophones) may solve problems of photic disturbance or limitation and provide useful results for the Descriptor 11 of the MSFD (Table 1). Most marine organisms produce sounds (marine mammals, fishes, invertebrates) to accomplish important ecological processes (e.g., communication, reproduction, foraging, predation, detection of predators and habitat selection; Van Opzeeland and Slabbekoorn, 2012). Understanding normal levels of variations in acoustic complexity is crucial for conservation efforts, enabling managers to decide whether changes in acoustic dynamics need further investigation. However, quantifying and characterizing the acoustic production of animals in marine soundscapes can sometimes be a challenging task to address. Active acoustic scattering techniques have potential to study the zooplankton and fish distributions, as they provide remote and non-intrusive samples at high resolution over large ranges (Figure 3), which is difficult to achieve using traditional net or other underwater systems alone. Multiple frequency scientific echosounders with split-beams and resulting echo-trace analysis (using frequency responses) can provide information on the sizes of animals, thus allowing some distinctions to be made. Despite the fact that the underwater acoustic instruments do not allow species classification (Knudsen and Larsson, 2009), they could be useful to gain information on pelagic and semi-demersal species as well as on zooplankton assemblages (Trenkel et al., 2011; Table 2). The Acoustic Complexity Index (ACI) (Pieretti et al., 2011) coupled with a software dedicated to soundscape analysis (Farina et al., 2011) can be used to elaborate collected acoustic files, in order to track the various biological signals, their daily and nightly dynamics and distinguish them from noise pollution. Anthropogenic noise usually has specific frequency ranges (typically <1 kHz) which overlaps with the frequencies used by fishes for communication and other processes. We suggest that the ACI seems to be a promising tool to analyse marine soundscape filtering out noises and biological sounds.
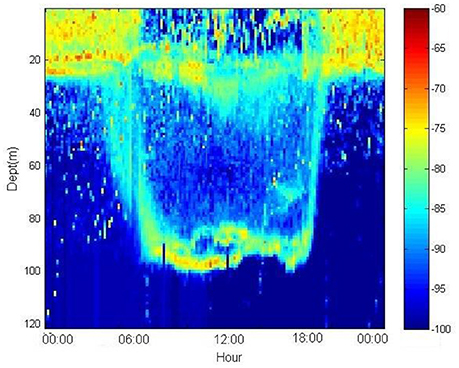
Figure 3. Echogram of diel vertical migration of a deep sound scattering layer impacted by small pelagic fish (Sprattus sprattus) and zooplankton (Calanus euxinus), Western Black Sea (Source: Institute of Oceanology, IO-BAS).
New Methodologies for Marine Monitoring
Comparison of Methods for Identifying Phytoplankton Diversity
Considering the objectives of the MSFD, it becomes important to evaluate emerging methods to enhance the efficacy and cost-efficiency of monitoring approaches, in particular non-intrusive, relatively low-cost methods based on optics. The optical metrics of phytoplankton include the size, shape, dimensions and complexity of the phytoplankton cell, as well as its light absorption, scattering and fluorescence characteristics, which are influenced by cell size, material and pigmentation. Each optical method shows some degree of selectivity or bias, either for a cell size range, pigment concentration range, or the ability to discern individual cell characteristics vs. a population of cells in a volume as a whole. Furthermore, it is recognized that the optical attributes of phytoplankton taxa are subject to natural variability regarding pigmentation, cell size, and colony formation within species.
Light microscopy is precise with regard to taxonomic determination, but less sensitive to rare species and practically limited to cells larger than 1–2 μm. Both fresh and stored samples can be analyzed, even if for some protists, fixatives deform the cells, making difficult their identification. The main limitation of this method is the time spent by an expert analysing a single sample, which is in the order of 1/day.
Flow cytometry analysis can be considered a combination of particle based and pigment analysis methods. The taxonomic distinction of each investigated particle is dependent on the number of lasers (usually 1 or 2 in benchtop instruments), detectors (4–8 in modern configurations) and is limited to those pigments that exhibit autofluorescence (chlorophylls and phycobilipigments). Besides fluorescence, flow-cytometers record forward- and side-scattering parameters, allowing basic size and shape characterization. Direct comparison of phytoplankton biodiversity obtained by using light microscopy, HPLC pigment and flow cytometry resulting from a multi-year sampling campaign in the productive season in the Baltic Sea revealed no meaningful correlation between the three methods (Figure 4). In this case, the lack of correspondence between the three methods can be explained by different lag times in the response of pigmentation, particle size distribution, or species composition to environmental changes. In other two studies a relatively good correspondence has been observed between the various methods (Casamayor et al., 2007; Christaki et al., 2011).
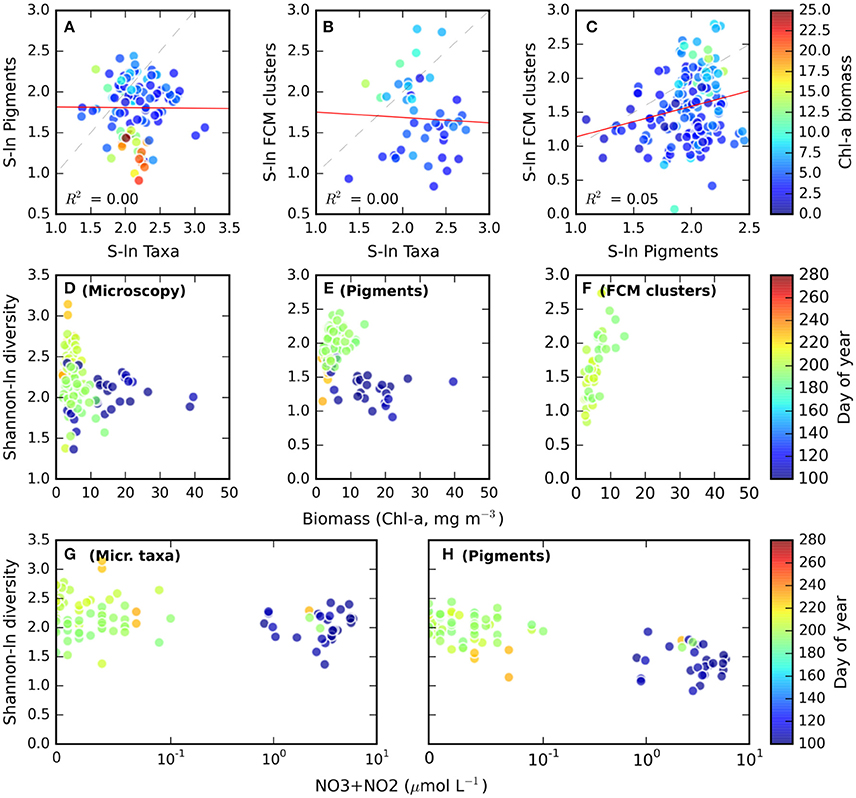
Figure 4. (A–C) Scatter plots comparing the Shannon diversity metrics obtained with HPLC Pigments (Pigments), Flow Cytometry cluster analysis (FCM clusters), and light microscopy determined to the most detailed taxonomic level (Taxa) from samples collected in the productive season in the Baltic Sea. Linear least-squares regression lines are drawn in red, dashed lines indicate unity. The color scale applied to each data point indicates the chlorophyll-a biomass of the sample (units mg m−3). (D–F) Shannon diversity derived from Microscopy, Pigments, or Flow cytometry cluster analysis, as a function of biomass and sampling time (color scale). (G–H) Shannon diversity derived from Microscopy and Pigments as a function of inorganic nitrogen concentration and sampling time (color scale) (Source: Plymouth Marine Laboratory, Finnish Environment Institute).
Pigment high-performance liquid chromatography (HPLC), has been for a long time a useful tool for obtaining information on taxonomic composition of phytoplankton, based on presence/absence of diagnostic pigments (Smith et al., 2010; Roy et al., 2011). Computational approaches, such as the statistical fitting tool CHEMTAX, have been used to determine phytoplankton biodiversity by estimating the relative contribution of different taxa to the total chlorophyll a (TChla) concentration in a sample (Mackey et al., 1996; Gibb et al., 2001; Goela et al., 2015). Although the software is fully developed, an a priori knowledge of the classes existent in the samples is required, as well as an appropriate choice of the ratios of pigment:Chla, considering the characteristics of the investigated geographical region (i.e., light availability; Higgins et al., 2011). As the inferences of this technique are based on the chemical composition of a sample and not on the direct observation of the phytoplankton cells, it has an improved capability to differentiate among organisms in smaller size classes, which in traditional methods such as microscopy fall into the category of unidentified flagellates (Goela et al., 2014). A recent application of this approach to oceanic regions, where populations of small organisms can be dominant, has proven to be particularly useful to distinguish the contribution of cryptophytes, prymnesiophytes, and prasinophytes to TChla concentration (Goela et al., 2014). Thus, the use of chemotaxonomic methods in combination with the classical methods (e.g., microscope enumeration, phytoplankton size-structure) would be useful to evaluate and characterize Descriptor 5 of the MSFD (Mangoni et al., 2013; Cristina et al., 2015; Goela et al., 2015; Table 1). Once the HPLC methodology is implemented and running, CHEMTAX offers a rapid and cost-effective way to assess the taxonomic composition of a sample, used as a first assessment of the phytoplankton assemblage. It might provide valuable insights on the potential presence of specific groups (e.g., harmful species), especially when there is previous knowledge of the classes that are likely to contain HAB species (Mangoni et al., 2011; Liu et al., 2014).
The major caveats applied to the use of the method are often observed in phytoplankton classes which contains no diagnostic pigments or in which the diagnostic pigment is not present in all the species of the class. That is the case, for example, of dinoflagellates. Often, the marker pigment used in CHEMTAX for dinoflagellates class is peridinin, which is only present in some of the auto- or mixotrophic species of dinoflagellates (Throndsen, 1997). This might lead to the underestimation in areas where most of the dinoflagellates are heterotrophic (e.g., Goela et al., 2014). In those cases, a more reliable CHEMTAX analysis would involve a careful examination of the typical pigment profiling of the local dinoflagellates community, namely the combinations between different diagnostic pigments, or the search for species specific diagnostic pigments (e.g., Örnólfsdóttir et al., 2003; Smith et al., 2010; Roy et al., 2011). The versatility of the method, that is, the possibility to run the software with different combinations and values of pigment:Chla ratios is, in fact, one of the major advantages of the method, allowing easily to locally adapted pigment profile schemes. Recently, several studies have focused on the effective and successful use of CHEMTAX to detect HABs (e.g., Örnólfsdóttir et al., 2003), although pigment profiling studies, such as Liu et al. (2014), in other areas of the globe would be beneficial to the fulfillment of this objective.
Analysis of Planktonic Microbial Diversity by Flow Cytometry
In plankton microbial flow cytometry, small sample volumes are circulated in front of a laser with a fluidics system that forces each cell to pass in front of the laser, which is typically blue, red or UV. The instruments can observe thousands of cells per second, so a few minutes of operation enables inspection of several hundred thousand cells. Both the cells and the abiotic particles disperse the laser light and generate fluorescence after the excitation. Since scattered light is proportional to cell size (and cell internal rugosity) and fluorescence is proportional to pigment content, it is possible to differentiate various groups of phototrophic oxic (Marie et al., 2005) and anoxic (Casamayor et al., 2007) microorganisms according to their average cell size, types of pigments and pigment ratios. In addition, it is possible to stain the nucleic acids of heterotrophic prokaryotes (Gasol and del Giorgio, 2000), heterotrophic eukaryotes (Christaki et al., 2011) and viruses (Brussaard et al., 2000) and simple activity probes can be used to obtain indication of the relative physiological state of prokaryotes and phytoplankton (del Giorgio and Gasol, 2008). This method allows easy fingerprinting of the microbial assemblages and a fast indication of how they respond to disturbances.
Besides the cost of instrumentation, which is progressively decreasing in recent years, the total cost is on the order of a few euros per analysis and can be done and processed in less than an hour. Moreover, sample collecting, processing, flow cytometry and data analysis can be automated (Besmer et al., 2014) and even commercial (Dubelaar et al., 1999) and non-commercial (Olson and Sosik, 2007; Swalwell et al., 2011) instruments can be submerged and send the data via cabling or radio. This allows their inclusion in environmental monitoring systems such as SmartBuoys, whose multiple sensors provide complementary information of the environmental settings in which cytometry data are acquired.
There are at least four different ways in which flow cytometric data can be used to infer ecosystem properties or environmental status (Gasol and Morán, 2015): (i) Presence/absence of specific microbial assemblages (e.g., presence of red-fluorescing cyanobacteria is generally associated with turbid low-light environments, whereas high abundances of Prochlorococcus or dominance of pico-eukaryotes with nutrient-rich environments; Stomp et al., 2007); (ii) Estimates of cytometric diversity (Li, 1997) of either pico-phytoplankton and heterotrophic prokaryotes; (iii) Population size and pigment content (e.g., temperatures lead to total phytoplankton and bacterioplankton decreases in cell size; Morán et al., 2010, 2015); and (iv) Ratios between populations abundance (e.g., the ratio between picocyanobacteria and eukaryotic picophytoplankters has been used to indicate nutrient levels as cyanobacteria are more likely to be abundant in low nutrient oligotrophic environments while eukaryotes tend to dominate in high nutrient conditions; Calvo-Díaz et al., 2008).
While the potential for these methods to work exists and a cost-savings potential is clearly demonstrated, additional testing is needed to determine how robust the methods are to detect physiological changes, such as those caused by nutrient and light availability. Sensitivity of these methods to cell physiological constrains may for example introduce undesirable seasonal or geographical bias which traditional (e.g., microscopy) methods would not show. Further studies are therefore needed to derive robust indicators of environmental status, preferably based on a multitude of complementary methods. Gathering data over various temporal and spatial scales in order to distinguish natural variability from that resulting from anthropogenic pressures will help validate these indicators, in order to subsequently develop highly automated tools for rapid assessment of marine environmental status.
Remote Sensing
Remote sensing of optical, thermal and radar images from airborne and satellite sensors offers many new opportunities for the direct monitoring of biodiversity, for observing patterns in the land and sea which relate directly to biodiversity, or for the provision of environmental data layers which are needed in order to build predictive models of species and habitat distributions (Turner et al., 2003; Pettorelli et al., 2014). A new impetus has been given to the field of satellite remote sensing by the European Union's Copernicus programme in which the first of a series of Earth-observing sensors on the Sentinel satellites have been successfully launched. Sentinel 1 is a radar satellite with cloud-penetrating ability, in orbit since April 2014, and now delivering images that relate to marine and maritime needs, such as sea-ice extent, oil-spill monitoring and ship detection for maritime security. Radar images are very useful for determining the extent and composition of intertidal and salt-marsh habitats (Van Der Wal and Herman, 2007). Sentinel-2 for high resolution optical images of the coastal zone, as with Sentinel-1, will greatly enhance our ability to detect changes in intertidal and shallow subtidal habitats (Van der Wal et al., 2008). The final recent launch was that of Sentinel-3 for wide-field ocean color viewing, altimetry and sea surface temperature on 16th February 2016. Sentinel-3 will continue the progress made by other ocean-viewing satellites such as SEAWIFS, MERIS and MODIS and ensure continuity of ocean color measurements (Le Traon et al., 2015). The use of remote sensing represents a cost-effective tool supplementing conventional in situ sampling. The in situ measurements are typically based on oceanographic cruises that provide discrete data sets with often spatial and temporal coverage, which could limit the analysis of the dynamics of the phytoplankton in relation to human activities (Rivas et al., 2006). Remote sensing can provide highly valuable data bridging the spatial and temporal gaps in observations complementing the in situ measurements. These are the major advantages of remote sensing as compared to in situ observation systems (Blondeau-Patissier et al., 2004). However, ocean color remote sensing also present some limitations as: (i) satellite-derived Chla concentrations estimates of phytoplankton biomass content are based on conversion factors (Rivas et al., 2006); (ii) information about the surface parameters can be obtained only during cloud free conditions, limiting spatial and temporal coverage, especially in high latitudes and the tropics (Blondeau-Patissier et al., 2004; Peters et al., 2005); (iii) the confidence of the estimated values based on global algorithms has to be validated with in situ observations, which are essential to ensure the optimal quality of the data retrieved by satellite remote sensing, in particular in coastal and estuarine systems due to the optical complexity of such waters (Aurin and Dierssen, 2012).
Selected uses of satellite Earth observation in the field of marine biodiversity are presented in the sections below.
Satellite Data for the Implementation of MSFD with Respect to Eutrophication (D5)
The use of remote sensing allows a cost-effective and synoptic monitoring of extensive oceanic and coastal areas (IOCCG, 2009). The products acquired by ocean color remote sensing can be quantified by bio-optical algorithms that retrieve the concentration of Chlorophyll a (Chla), Suspended Particulate Matter (SPM) and the absorption of the Colored Dissolved Organic Matter (CDOM). These indicators of the status of the marine ecosystems give information about the phytoplankton biomass (Chla), the water transparency or turbidity (SPM) and about the terrestrial inputs of freshwater (CDOM) (Vantrepotte and Mélin, 2010; Table 2).
Several studies have been carried out in European waters for the validation of remote sensing satellite products in a wide range of geographical areas (Sørensen et al., 2007; Antoine et al., 2008; Kratzer et al., 2008; Petersen et al., 2008; Cristina et al., 2009, 2014; Zibordi et al., 2013). These studies demonstrate the accuracy and the precision of the technique to provide good quality data and to identify what are the main sources that influence the complexity of these waters.
The advantages of this tool are evident for countries that have limited resources to monitor one of the largest marine zones of regional seas (Cristina et al., 2015). An ocean color remote sensing product (Chla) can be used to detect and track the development of algal blooms in coastal and marine waters. Thus, this tool can support the implementation of the MSFD with respect to Descriptor 5: eutrophication, as demonstrated in Sagres, southwest Iberia (Cristina et al., 2015, Table 1). Furthermore, it allows distinguishing whether the eutrophication is natural, driven by upwelling, or due to land-based inputs. The implementation of a regional algorithm increases the accuracy of the remote sensing data produced to retrieve the Chla, particularly during upwelling events when the highest concentrations of Chla occur (Cristina et al., 2016). This is supported by studies in the Baltic Sea (Harvey et al., 2015), also showing the advantages of using satellite remote sensing for monitoring and eutrophication assessment and for the status classifications of water basins. These studies show that this tool can be applied for both national, European and Regional Seas monitoring plans as well as the implementation of the MSFD and the Water Framework Directive (Gohin et al., 2008; Novoa et al., 2012). In summary, the use of remote sensing can be an efficient tool providing a synoptic view of the products (e.g., phytoplankton biomass), showing their distribution over an extended period, identifying seasonal patterns and showing the effect of changes in marine ecosystems promoted by human pressures and by environmental changes.
However, the eutrophication of the benthic compartment and its effects on the biota, which have been investigated repeatedly in the last decade (Danovaro et al., 2000, 2004; Danovaro and Gambi, 2002; Dell'Anno et al., 2002; Pusceddu et al., 2007, 2009) cannot be assessed through remote sensing.
Satellite Imaging of Harmful Algal Blooms
Harmful algal blooms (HABs) adversely affect the marine environments by releasing toxins, decreasing food availability for higher trophic levels, and reducing oxygen levels in water, potentially causing mass mortality of marine organisms (Silke et al., 2005). HAB species may dominate the phytoplankton community, with very high chlorophyll concentration that can be detected from satellite sensors (Miller et al., 2006). Hence satellite monitoring of HABs is a novel method to detect undesirable (reduced biodiversity) water quality events, which may sometimes be related to eutrophication as described above. The remote sensing of chlorophyll concentration product has been successfully used to identify algal bloom events in the marine and coastal waters (Babin et al., 2008). However, the algal bloom of potentially harmful species could not be identified from analysis of chlorophyll concentration (Babin et al., 2008).
The method developed at Plymouth Marine Laboratory (PML), UK, uses measurements of water reflectance and inherent properties (IOPS) for automatic detection of HABs in satellite optical images (Kurekin et al., 2014). It is based on the relationships between water absorption properties and algal pigment composition, and between water backscatter and phytoplankton cell size, as features for HAB discrimination. The features were classified by Linear Discriminant Analysis (LDA) technique to produce HAB risk maps, as shown in Figure 5.
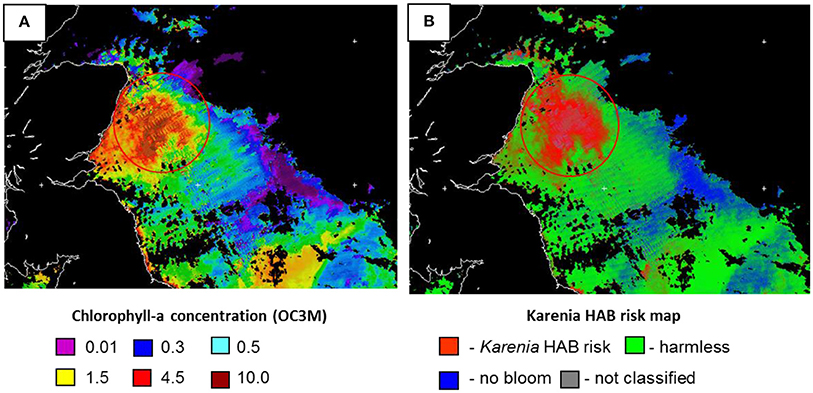
Figure 5. Karenia mikimotoi harmful algal bloom off the North East of Scotland in Sept. 2013 detected by MODIS AQUA sensor. (A) Chlorophyll-a concentration map, OC3M algorithm; (B) Karenia HAB risk map. High-risk areas are given in red, harmless areas—in green and no bloom areas—in blue (Source: Plymouth Marine Laboratory).
The method has been trained to discriminate Karenia mikimotoi and Pseudo-nitzschia sp. in the UK coastal waters, as well as Phaeocistis globosa algal blooms in the Southern North Sea. Measurements on board the RV Cefas Endeavor, provided by CEFAS, were integrated in the assessment of HAB risk. Joint analysis of satellite ocean color and Ferrybox data has been successfully applied for detection of a Karenia mikimotoi bloom off the North East of Scotland in August-September in 2013 and in 2014. The experiment has confirmed a strong correlation between satellite observations of HAB risk (Kurekin et al., 2014) with measurements of CTD profiles (including fluorescence and oxygen profiles) and in-situ samples (algal pigments, chlorophyll-a, cell count by microscopy and flow cytometry).
This method allows daily estimation of certain HABs over a wide area, depending on cloud cover. However, it is limited to phytoplankton species that produce high biomass blooms with a characteristic surface water coloring, whereas many toxin-producing algae are harmful in low concentrations. HAB risk maps are already operational for early warning of blooms affecting Scottish salmon farms, so it would be practical to extend the method toward further monitoring programs. The method is dependent upon the quality training data available for each HAB type, and so this aspect requires ongoing development.
Remote Sensing of Shelf-Sea Fronts for Estimating Pelagic Biodiversity
A novel approach to the mapping of pelagic diversity has been implemented for the UK continental shelf, using a long time-series of remotely-sensed SST data to automatically detect thermal ocean fronts and then aggregating observations into climatological seasonal metrics (Miller and Christodoulou, 2014). These metrics have characterized the spatial, seasonal and interannual variability of fronts observed in 30,000 satellite passes over a 10-year period. Many researchers have determined that fronts are related to the abundance and diversity of pelagic vertebrates such as seabirds and cetaceans (reviewed by Scales et al., 2014). The resulting front maps were successfully applied as a proxy of pelagic diversity to the UK Marine Conservation Zone (MCZ) project—a key element of efforts to improve environmental status of European seas, and this influenced the designation of 11 of the recommended MCZs (Miller and Christodoulou, 2014) (Figure 6).
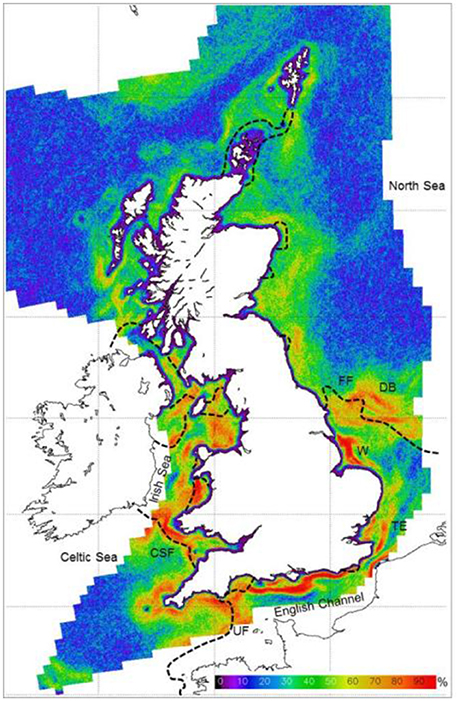
Figure 6. Summer frequent front map based on a 10-year time-series of satellite SST data, compared with fronts predicted by a numerical model based on tidal currents and bathymetry (dashed lines where Simpson-Hunter stratification parameter S = 1.5). FF, Flamborough front; UF, Ushant front; CF, Celtic Sea front; DB, Dogger Bank; W, Wash; TE, Thames Estuary. (From Miller and Christodoulou, 2014, UKCS region, 1.2 km resolution, 1999–2008 data).
Although seasonal locations of frequent fronts were found to be fairly consistent, there are considerable interannual and week-to-week variations in the location and frequency of fronts, with consequential changes in the water column likely to affect species distributions. Hence satellite monitoring of shelf-sea fronts can serve as a proxy for certain mobile pelagic animals and as a physical boundary that structures other components such as zooplankton. Real-time front maps can be compared and integrated with other tools such as Ferrybox to assess aspects of the ecosystem and its biodiversity. Real-time satellite front maps have been applied to a UK project to optimize the MCZ/MSFD monitoring strategy using sea gliders and autonomous underwater vehicles across frontal biodiversity gradients (Suberg et al., 2014).
Hence the key benefits of this technique for marine monitoring are to assist the optimization of sampling strategies and to inform predictions of the abundance of fish and other pelagic animals that are difficult to measure directly.
Broadscale Seabed Mapping Using Opportunistic, High-Resolution Seafloor Acoustic Data
One of the core requirements of the MSFD is the use of habitat maps at the regional or sub-regional scale (Annex III, Table 1). In addition, there is an expectation that the assessment takes account of environmental conditions when deciding assessment boundaries [Article 3(2)] and this involves an understanding of predominant habitat types, including the structure and substrata composition of the seabed. The importance of knowing the changes in seabed conditions in detail are particularly relevant for the directives Habitats (D1), Seabed Integrity (D6), and changes to Hydrographical Conditions (D7) (Tables 1, 2). So whilst assessments must be reported on at the regional level the actual scale of assessment is on subdivisions of the subregions (European Commission, 2014). Determining the relevant scale for assessment is especially important when we consider that these must be aggregated and reported at a higher level, so that errors and uncertainties will propagate up from the minimum assessment areas (Dong et al., 2015). So whilst identifying the most appropriate assessment method for indicators is a challenge in itself (Berg et al., 2015), the spatial component fundamentally affects our ability to accurately assess ecosystem components.
For the benthic environment we are severely restricted as to the amount of existing data we have to define ecologically relevant areas. The failure of market-value to adequately represent the societal importance of the marine environment has been widely recognized (Brouwer et al., 2016) and the practical reality is that there is less short-term economic incentive to collect seabed information (compared to terrestrial remote sensing), as a result little of the European seabed has been mapped using modern methods. A direct consequence of such data deficiency is that 76% of seabed habitats are in unknown status (EEA, 2015) and there are no systematic habitat mapping programmes in place at national or pan-European scales.
In the absence of adequate seabed data, the urgent need to define seabed habitats for management has resulted in the construction of modeled seabed data such as UKSeaMap (Connor et al., 2006). These existing broadscale maps will inevitably contain errors due to data deficiencies and generalizations. However, the alternative of using the scattering of existing high-resolution maps, does not address our needs to define biogeographical limits of species or overall habitat distribution at a regional scale. To overcome this difficulty (of high resolution data only existing as a localized patchwork) and make best use of existing resources, the novel strategy of continuously logging high-resolution multibeam data during existing monitoring cruises has been adopted on the RV Cefas Endeavor using the Olex software programme. This allows non-hydrographers to automatically mosaic and navigate around the seafloor data in real time through a simple graphical interface. It is then possible to use the data operationally rather than waiting for it to be processed and made available in an accessible format. As there are no dedicated personnel required and the system has no adverse effect on existing operations, large amounts of high-resolution data are collected with negligible additional cost (continuous operation is not expected to reduce its serviceable life expectancy of sonar systems).
Integrating the high resolution bathymetry and backscatter data with existing broadscale environmental data (such as modeled currents and seabed morphology) using random-forest models (e.g., Hengl et al., 2015), it is then possible to create a complete coverage map of the seabed conditions (Figure 7). By using only acoustic data in our study the modeled variables produced (whilst not ground-truthed) are repeatable, provide outputs at a uniform resolution, and allow a consistent assessment of uncertainty to be made across the area (Mascaro et al., 2014). These properties are valuable when addressing questions of map interpretation (Steiniger and Weibel, 2005) and ecosystem status at regional scale (Walz and Syrbe, 2013; Galparsoro et al., 2015a). It is possible to use these data to produce categorical maps. However, there are concerns as to the validity of categorizing continuous environmental variables for habitat delimitation (Wilson et al., 1999; Orpin and Kostylev, 2006; Galparsoro et al., 2015b). Defining a fixed set of conditions which delimit the extent of a single species is conceptually problematic (Randin et al., 2006; Heads, 2015), and, as habitats are taxon and scale-specific (Mairota et al., 2015; Mathewson and Morrison, 2015), the use of existing, readily available, categorical GIS habitat maps for biotope assessments should not be considered as scientifically defensible.
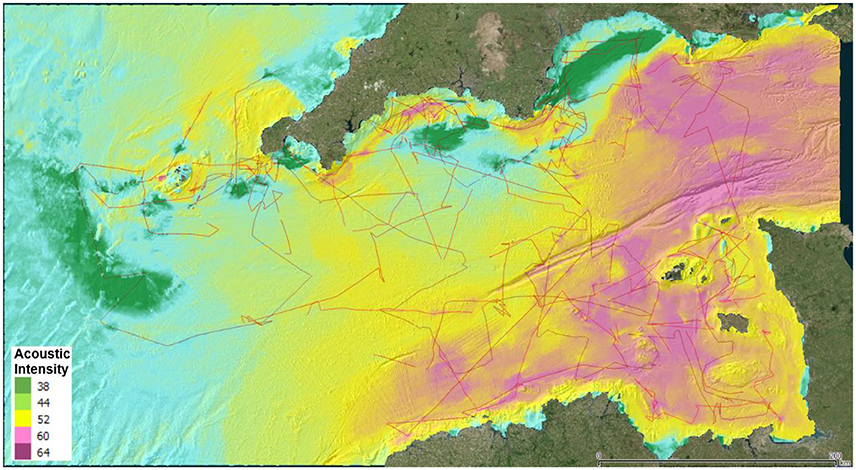
Figure 7. Random forest model of seabed acoustic intensity, extrapolated from high-resolution multibeam data collected opportunistically during fisheries research cruises (ships tracks as red lines; Source: OceanDTM).
Using the method outlined above to collect large quantities of high-resolution data over a broad extent, we can also directly map highly localized features and impacts, such as the direct mapping of species distribution and condition of biogenic reefs. In this way we have a direct relationship between sonar image and species distribution without the need to go through the process of inferring their distribution from correlations. Models can be used to identify areas where the feature is likely to be present and additional monitoring effort can be deployed as necessary, both to monitor condition, as well as to better define their extent (as required by the relevant indicators).
There is no practical hindrance to the collection of spatially-extensive, high-resolution data from a wide range of platforms already conducting regular monitoring activities. The challenge is in recognizing the benefits of such data in supporting the spatial assessment of multiple indicators, implementing the necessary routines and then incorporating the outputs into monitoring, assessment, and management strategies.
Innovative Sampling Methods
Here we summarized the experience made on innovative sampling methods, some of which have been applied for the first time in European seas. These include methods to monitor hard-bottom substrata, but also the use of citizen science to obtain massive information.
Artificial Structures to Monitor Hard-Bottom Benthic Biodiversity
ARMS
Small invertebrates, including sessile and encrusting organisms as well as mobile specimens inhabiting ecological niches in hidden spaces, represent most of the benthic biodiversity in rocky areas. Despite its importance for ecosystem functioning, a considerable percentage of benthic biodiversity is untargeted during traditional surveys and thus likely to be unreported (Pearman et al., 2016a). In the current scenario of global change, caused by natural and anthropogenic pressures, species may be pushed to extinction even before their identities and roles in ecosystem functioning can be understood (Costello and Wilson, 2011).
To overcome the difficulty in obtaining standardized and comparable information on benthic biodiversity from different habitats and regions, the Coral Reef Ecosystem Division (CRED) of the United States National Oceanic and Atmospheric Administration (NOAA) developed a standardized biodiversity assessment tool called an “Autonomous Reef Monitoring Structure” (ARMS; Figure 8A). This device consists of nine 23 × 23 cm gray, Type I PVC plates stacked in an alternating series of layers that are either open to the current or obstructed, which are intended to mimic the three-dimensional structure of the reef environment. They should be deployed for 1–3 years and colonized by bacteria, algae and sessile and mobile fauna, including cryptic species, of different size ranges (meiofauna, 20–500 μm; macrofauna, >500 μm; large macrofauna, >2000 μm). After recovery, both sides of each plate are photographed, and then surfaces are scraped, homogenized and analyzed using barcoding and metabarcoding techniques. The ARMS processing protocol applies a combination of morphology (for organisms >2000 μm) and molecular-based (all components) identification approaches to assess species richness (Leray and Knowlton, 2015).
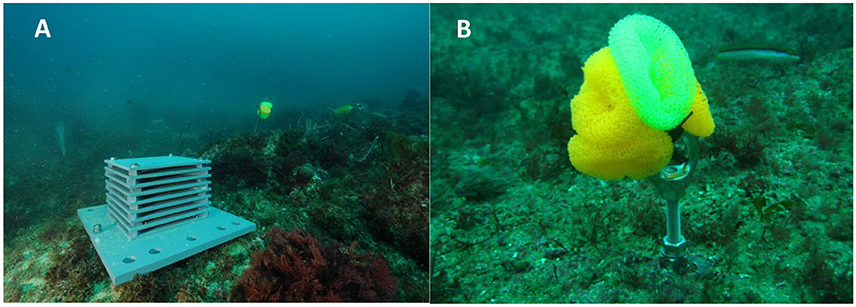
Figure 8. Standardized sampling devices to monitor hard-bottom benthic biodiversity. (A) Autonomous Reef Monitoring Structure (ARMS), which recreate the 3D structure of a natural reef environment. (B) Artificial Substrate Unit (ASU) developed to mimic the filamentous algae or kelp holdfasts.
The use of a standard sampling unit and the application of homogeneous protocols for morphological and molecular identifications can produce comparable datasets over different geographical areas. Despite some limitations of the metabarcoding technique (Carugati et al., 2015; see metabarcoding section), such as the incompleteness of reference databases, the sequence inventory obtained is already valuable for biodiversity assessment that be further improved in the future without additional laboratory work by rerunning the bioinformatics analyses on updated reference databases. Over a deployment of 1–3 years, colonization and succession patterns could be affected by changes in environmental conditions, making ARMS proper tools for marine monitoring of coastal areas. ARMS can be also re-deployed in the same locations and used to assess biodiversity changes over time. The characterization of the surrounding environment where ARMS units are deployed should be carried out for a comparison with natural assemblages. Temporal variability in key environmental variables, such as temperature, nutrients and chlorophyll a, should be investigated during the deployment period. Combining the use of ARMS with standard surveys, generally targeting fish and conspicuous invertebrates (Table 2), it is possible to obtain a comprehensive picture of the biodiversity and more accurate information on the health status of the system.
The use of ARMS for routine marine monitoring presents some problems that need to be addressed. Although the costs of sequencing are dropping, and even if the ARMS-based approach is more cost effective than morphological-based one (Hayes et al., 2005), overall costs may still be high. Moreover, protocols for the assessment of biodiversity associated to ARMS rely upon the use of molecular approaches and thus the use of such devices present the same problems described above for metabarcoding. The ARMS protocol of Leray and Knowlton (2015) proposed the use of the mt COI gene. However, the database for this gene is highly biased toward metazoans and may thus be limited in the detection of other groups (such as algae and unicellular eukaryotes). Other genes have been targeted for ecological studies (e.g., 18S rDNA, Logares et al., 2014a, 28S rDNA, Hirai et al., 2015, and the ITS region Tonge et al., 2014) and a combination of these genes and COI may give a more comprehensive assessment of diversity. In the future, molecular studies using ARMS may also investigate the functional ability of the assemblage using shotgun metagenomic techniques.
ASUs
Another example of standardized sampling devices for marine biodiversity assessment is represented by Artificial Substrate Units (ASUs; Figure 8B). ASUs are nylon pot scrubbers, which have been used to study recruitment and taxonomic composition for over 20 years (Menge et al., 1994, 2002, 2009; Gobin and Warwick, 2006; Underwood and Chapman, 2006; Hale et al., 2011). They are particularly used to mimic filamentous algae or kelp holdfasts (Menge et al., 1994), a preferred habitat for recruits of many species (e.g., mussels, Paine, 1974).
After their recovery, ASUs are traditionally processed to identify species by using their morphological characters (Menge et al., 2002; Underwood and Chapman, 2006; Hale et al., 2011). With the advent of metabarcoding, the diversity associated with ASUs has been assessed by combining morphological and molecular methods.
The advantages and disadvantages of ASUs are similar to those of the ARMS, which are detailed above. Comparing the two structures, ASUs are easier to deploy than ARMS and the materials needed to construct an ASU are less expensive than those used to build ARMS. Moreover, the processing of an ASU takes fewer person-hours per unit (18 person-hours per ARMS vs. 6 per ASU). This makes ASUs more amenable to fine-scale sampling, for instance to measure temporal changes in biodiversity. They would be a valuable contribution to current monitoring programs, which require intensive samplings. The use of ASUs in monitoring programs can be relatively simple (e.g., Hale et al., 2011). Another consequence of simpler processing is that there are fewer risks of deviation from standardized procedures for ASUs than for ARMS during the processing of samples. However, they do not sample the same ecosystem component as the ARMS, since the two devices mimic different habitats. The small size of the ASUs relative to the ARMS imposes a selection for smaller organisms and species, such that large-bodied organisms cannot be collected by using the ASUs.
High Resolution Sampling
Recent advances in robotic technologies provide new opportunities to conduct high-resolution sampling of patchily distributed organisms (such as zooplankton), by using AUV, carrying bottles for collecting discrete seawater samples and a sensor for gathering contextual environmental data. Environmental Sample Processors have been developed as stationary (moored) devices able to conduct in situ molecular assays (sandwich hybridization assay) by using 18S ribosomal RNA oligonucleotide probes, in order to detect actual plankton diversity (from calanoid and podoplean copepods, to larvae of barnacles, mussels, polychaete worms, brachyuran crabs, and invasive green crabs; Carcinus maenas; Harvey et al., 2012).
The Continuous Automated Litter and Plankton Sampler (CALPS) is a custom-made semiautomatic sampler which collects water using a pump system at a single depth along a predetermined transect as the ship sails. The system consists of a pump system and additional elements fitted onto the research vessel. The additional elements include a water inlet of 20 cm diameter, a flowmeter, 6 cylinder traps and associated valves and level detectors to prevent overflowing and the system is controlled by computer (Figure 9). When activated, the system pumps sea water from a depth of 4 m at rates of between 35 and 45 L per minute, and distributes the water into one or more of the 6 possible traps. Each trap consists of a PVC cylinder (height: 73.3 cm, diameter: 28.0 cm) containing a plankton net (length 66.0 cm and diameter 26.5 cm) of chosen mesh-size. The volume of water filtered is measured with an electronic flowmeter. The performance of the CALPS against traditional vertical net sampling was evaluated in a study by Pitois et al. (2016). The authors concluded that the CALPS is suited to describe broad geographic patterns in zooplankton biodiversity and taxonomic composition; its particular advantage over more traditional vertical sampling methods is that it can be integrated within existing multidisciplinary surveys at little extra cost and without requiring additional survey time. These features make the CALPS a particularly useful tool as part of integrated monitoring of environmental status to underpin policy areas such as the MSFD.
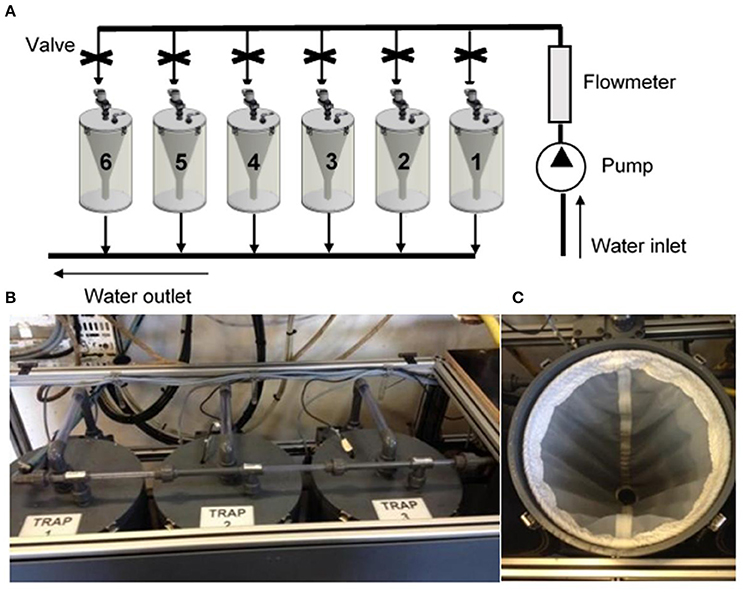
Figure 9. CALPS system. (A) Schematic illustration of the CALPS system. (B,C) are photographs of the Trap system and inside plankton net (Pitois et al., 2016).
Ocean Sampling Day
The Ocean Sampling Day (OSD) is a simultaneous sampling campaign of the world's coastal oceans which took place for the first time on the summer solstice (June 21st) in the year 2014 and was repeated in 2015 and 2016 (Kopf et al., 2015). In this way, the collected samples related in time, space and environmental parameters, will provide new insights regarding microbial diversity and function and contribute to the blue economy through the identification of novel, ocean-derived biotechnologies. Micro B3's OSD project aims to generate, in a single day and in a cost-effective way, the largest standardized marine microbial data set, complementary to what obtained by other large-scale sequencing projects. The standardized procedure including a centralized hub for laboratory work and data processing via the Micro B3 Information System, ensures the collection and the processing of sea water samples with a high level of interoperability and consistency between data points worldwide. All OSD data (i.e., sequences and contextual data) are archived and immediately made openly accessible without an embargo period (Ten Hoopen and Cochrane, 2014). OSD sampling sites are typically located in coastal regions within exclusive economic zones (EEZ) and thus the OSD data set provides a unique opportunity to test anthropogenic influences on microbial assemblages. The final aim is to create an OSD time-series indicators to assess environmental vulnerability and resilience of ecosystems and climatic impacts. In the long term such indicators may be incorporated into the Ocean Health Index (OHI) (Halpern et al., 2012), which currently does not include microorganisms due to the lack of reliable data. OSD has the potential to close that gap expanding oceanic monitoring toward microbes. This could lead to a global system of harmonized observations to inform scientists and policy-makers, but also to raise public awareness for the major, unseen component of world's oceans.
Conclusions
There is an urgent need to improve our knowledge of the spatio-temporal variations of marine biodiversity and of the consequences of global changes on marine ecosystems. This should be done quickly, in real time, using harmonized, standardized and low-cost tools (Borja and Elliott, 2013), and extending our ability to monitor the deep-sea ecosystems (Danovaro et al., 2014; Corinaldesi, 2015). Recently developed technologies and instruments should help to determine not only the biodiversity but also the functioning of ecosystems, feeding the needs of the recently enacted Marine Strategy Framework Directive (Cardoso et al., 2010).
Some of the innovative methodologies and technologies described here (e.g., AUVs, high-resolution sampling instruments) are tested and validated in different geographical areas and they can help to achieve in real time information on different ecosystem components (from microbes to megafauna), rapidly and in a rigorous way, at a lower cost than traditional ones. Other tools, especially molecular ones, e.g., metabarcoding, need further evaluation (Bourlat et al., 2013).
In this context, such innovative approaches for marine monitoring need to be further implemented through: (i) defining standardized manuals and protocols for sampling and sample processing; (ii) developing new indicator metrics and indices fitting the new approaches and also useful for policy and decision-making; (iii) integrating, in monitoring surveys, information on biodiversity with other data sources (CTD, remote sensing, multibeam, taxonomy databases) for an holistic marine ecosystem assessment.
Innovative methods can improve monitoring and contribute to the definition of criteria for better conservation of marine biodiversity. While the potential of these approaches to work exists, further studies are needed before their complete implementation application in routine marine monitoring programmes.
Author Contributions
RD and LC conceived the paper. All authors have contributed equally to the Introduction. RDan, LC, MB, SCar, AC, CC, AD, EG, JG, JF, IF, JP, AR, NR, and AB contributed to the section of molecular approaches. RDan, LC, ND, VM, SM, KS, ER, SCon, SG, SS contributed to the section of in situ instruments. RDan, LC, SCri, RDav, PG, RF, AK, PM, AN, EG, JG, IF, AR, CW, VS, OM contributed to the section of remote sensing. RDan, LC, SCar, JP, ML, AEC, SP, SG, SC, and AB contributed to the section of innovative sampling methods. All authors have contributed equally to the discussion and conclusions. All authors reviewed the manuscript.
Conflict of Interest Statement
The authors declare that the research was conducted in the absence of any commercial or financial relationships that could be construed as a potential conflict of interest.
The handling Editor declared a collaboration with all the authors and states that the process nevertheless met the standards of a fair and objective review.
Acknowledgments
This manuscript is a result of DEVOTES (DEVelopment Of innovative Tools for understanding marine biodiversity and assessing good Environmental Status) project, funded by the European Union under the 7th Framework Programme, “The Ocean of Tomorrow” Theme (grant agreement no. 308392) (http://www.devotes-project.eu). Further financial assistance was provided to VS and ER by the European Union under the ENPI CBC Mediterranean Sea Basin Programme (Sustainability and Tourism in the Mediterranean—S&T Med Strategic Project). The contents of this article are the sole responsibility of the authors and can under no circumstances be regarded as reflecting the position of the European Union or of the Programme's management structures.
References
Aguzzi, J., Company, J. B., Costa, C., Matabos, M., Azzurro, E., Mànuel, A., et al. (2012a). Biorhythms challenge to stock and biodiversity assessments: cabled observatories video-solutions. Oceanogr. Mar. Biol. Ann. Rev. 50, 233–284.
Aguzzi, J., Company, J. B., Costa, C., Matabos, M., Azzurro, E., Mànuel, A., et al. (2012b). Challenges to the assessment of benthic populations and biodiversity as a result of rhythmic behaviour: video solutions from cabled observatories. Oceanogr. Mar. Biol. Ann. Rev. 50, 235. doi: 10.1201/b12157-6
Ainsworth, T. D., Thurber, R. V., and Gates, R. D. (2010). The future of coral reefs: a microbial perspective. Trends Ecol. Evol. 25, 233–240. doi: 10.1016/j.tree.2009.11.001
Alverson, A. J., and Kolnick, L. (2005). Intragenomic nucleotide polymorphism among small subunit (18s) rdna paralogs in the diatom genus Skeletonema (Bacillariophyta). J. Phycol. 41, 1248–1257. doi: 10.1111/j.1529-8817.2005.00136.x
Amaral-Zettler, L. A., McCliment, E. A., Ducklow, H. W., and Huse, S. M. (2009). A method for studying protistan diversity using massively parallel sequencing of V9 hypervariable regions of small-subunit ribosomal RNA genes. PLoS ONE 4:e6372. doi: 10.1371/journal.pone.0006372
Andrade, H., Massabuau, J.-C., Cochrane, S., Ciret, P., Tran, D., Sow, M., et al. (2016). High frequency non-invasive (HFNI) bio-sensors as a potential tool for marine monitoring and assessments. Front. Mar. Sci. 3:187. doi: 10.3389/fmars.2016.00187
Antoine, D., d'Ortenzio, F., Hooker, S. B., Bcu, G., Gentili, B., Tailliez, D., et al. (2008). Assessment of uncertainty in the ocean reflectance determined by three satellite ocean color sensors (MERIS, SeaWiFS and MODIS-A) at an offshore site in the Mediterranean Sea (BOUSSOLE project). J. Geophys. Res. Oceans. 113:C07013. doi: 10.1029/2007JC004472
Appeltans, W., Ahyong, S. T., Anderson, G., Angel, M. V., Artois, T., Bailly, N., et al. (2012). The magnitude of global marine species diversity. Curr. Biol. 22, 2189–2202. doi: 10.1016/j.cub.2012.09.036
Aurin, D. A., and Dierssen, H. M. (2012). Advantages and limitations of ocean color remote sensing in CDOM-dominated, mineral-rich coastal and estuarine waters. Remote Sens. Environ. 125, 181–197. doi: 10.1016/j.rse.2012.07.001
Aylagas, E., Borja, A., Irigoien, X., and Rodriguez-Ezpeleta, N. (2016). Benchmarking DNA metabarcoding for biodiversity-based monitoring and assessment. Front. Mar. Sci. 3:96. doi: 10.3389/fmars.2016.00096
Aylagas, E., Borja, Á., and Rodríguez-Ezpeleta, N. (2014). Environmental status assessment using DNA metabarcoding: towards a genetics based marine biotic index (gAMBI). PLoS ONE 9:e90529. doi: 10.1371/journal.pone.0090529
Aylagas, E., and Rodríguez-Ezpeleta, N. (2016). “Analysis of Illumina MiSeq amplicon reads: application to benthic indices for environmental monitoring,” in Methods in Molecular Biology: Marine Genomics Methods and Protocols, ed S. Bourlat (New York, NY: Springer), 237–249. doi: 10.1007/978-1-4939-3774-5_16
Babin, M., Roesler, C. S., and Cullen, J. J. (2008). Real-time Coastal Observing Systems for Marine Ecosystem Dynamics and Harmful Algal Blooms: Theory, Instrumentation and Modelling. Paris: UNESCO.
Bacher, S. (2012). Still not enough taxonomists: reply to Joppa et al. Trends Ecol. Evol. 27, 65–66. doi: 10.1016/j.tree.2011.11.003
Berg, T., Fürhaupter, K., Teixeira, H., Uusitalo, L., and Zampoukas, N. (2015). The Marine Strategy Framework Directive and the ecosystem-based approach–pitfalls and solutions. Mar. Pollut. Bull. 96, 18–28. doi: 10.1016/j.marpolbul.2015.04.050
Besmer, M. D., Weissbrodt, D. G., Kratochvil, B. E., Sigrist, J. A., Weyland, M. S., and Hammes, F. (2014). The feasibility of automated online flow cytometry for in-situ monitoring of microbial dynamics in aquatic ecosystems. Front. Microbiol. 5:265. doi: 10.3389/fmicb.2014.00265
Best, M. M. R., Barnes, C. R., Bornhold, B., and Juniper, S. K. (2013). “Integrating continuousobservatory data from the coast to the abyss: a multidisciplinary view of theocean in four dimensions,” in Sea floorobservatories: A New Vision of the Earth from the Abyss, eds P. Favali, A. D. Santis, and L. Beranzoli (Berlin, Heidelberg: Springer), 500.
Beuchel, F., Gulliksen, B., and Carroll, M. L. (2006). Long-term patterns of rocky bottom macrobenthic community structure in an Arctic fjord (Kongsfjorden, Svalbard) in relation to climate variability (1980–2003). J. Mar. Syst. 63, 35–48. doi: 10.1016/j.jmarsys.2006.05.002
Bik, H. M., Fournier, D., Sung, W., Bergeron, R. D., and Thomas, W. K. (2013). Intra-Genomic variation in the ribosomal repeats of nematodes. PLoS ONE 8:e78230. doi: 10.1371/journal.pone.0078230
Bik, H. M., Porazinska, D. L., Creer, S., Caporaso, J. G., Knight, R., and Thomas, W. K. (2012). Sequencing our way towards understanding global eukaryotic biodiversity. Trends Ecol. Evol. 27, 233–243. doi: 10.1016/j.tree.2011.11.010
Blondeau-Patissier, D., Tilstone, G. H., Martinez-Vicente, V., and Moore, G. F. (2004). Comparison of bio-optical marine products from SeaWifs, MODIS and a bio-optical model with in situ measurements from Northern European waters. J. Opt. A Pure Appl. Opt. 6, 875–889. doi: 10.1088/1464-4258/6/9/010
Borja, A., and Elliott, M. (2013). Marine monitoring during an economic crisis: the cure is worse than the disease. Mar. Pollut. Bull. 68, 1–3. doi: 10.1016/j.marpolbul.2013.01.041
Borja, A., Elliott, M., Andersen, J. H., Cardoso, A. C., Carstensen, J., Ferreira, J. G., et al. (2013). Good Environmental Status of marine ecosystems: what is it and how do we know when we have attained it? Mar. Pollut. Bull. 76, 16–27. doi: 10.1016/j.marpolbul.2013.08.042
Borja, Á., Galparsoro, I., Irigoien, X., Iriondo, A., Menchaca, I., Muxika, I., et al. (2011). Implementation of the European Marine Strategy Framework Directive: a methodological approach for the assessment of environmental status, from the Basque Country (Bay of Biscay). Mar. Pollut. Bull. 62, 889–904. doi: 10.1016/j.marpolbul.2011.03.031
Bourlat, S. J., Borja, A., Gilbert, J., Taylor, M. I., Davies, N., Weisberg, S. B., et al. (2013). Genomics in marine monitoring: new opportunities for assessing marine health status. Mar. Pollut. Bull. 74, 19–31. doi: 10.1016/j.marpolbul.2013.05.042
Brazelton, W. J., Ludwig, K. A., Sogin, M. L., Andreishcheva, E. N., Kelley, D. S., Shen, C.-C., et al. (2010). Archaea and bacteria with surprising microdiversity show shifts in dominance over 1,000-year time scales in hydrothermal chimneys. Proc. Natl. Acad. Sci. U.S.A. 107, 1612–1617. doi: 10.1073/pnas.0905369107
Bricker, S., Longstaff, B., Dennison, W., Jones, A., Boicourt, K., Wicks, C., et al. (2007). Effects of Nutrient Enrichment in the Nation's Estuaries: A Decade of Change NOAA Coastal ocean Program Decision Analysis, series No. 26. Silver Spring, MD: National Centers for Coastal Ocean Science.
Brouwer, R., Brouwer, S., Eleveld, M. A., Verbraak, M., Wagtendonk, A. J., and van der Woerd, H. J. (2016). Public willingness to pay for alternative management regimes of remote marine protected areas in the North Sea. Marine Policy 68, 195–204. doi: 10.1016/j.marpol.2016.03.001
Brussaard, C. P. D., Marie, D., and Bratbak, G. (2000). Flow cytometric detection of viruses. J. Virol. Methods 85, 175–182. doi: 10.1016/S0166-0934(99)00167-6
Burrows, M. T., Schoeman, D. S., Buckley, L. B., Moore, P., Poloczanska, E. S., Brander, K. M., et al. (2011). The pace of shifting climate in marine and terrestrial ecosystems. Science 334, 652–655. doi: 10.1126/science.1210288
Calvo-Díaz, A., Morán, X. A. G., and Suárez, L. A. (2008). Seasonality of picophytoplankton chlorophyll a and biomass in the central Cantabrian Sea, southern Bay of Biscay. J. Mar. Syst. 72, 271–281. doi: 10.1016/j.jmarsys.2007.03.008
Caporaso, J. G., Lauber, C. L., Walters, W. A., Berg-Lyons, D., Lozupone, C. A., Turnbaugh, P. J., et al. (2011). Global patterns of 16S rRNA diversity at a depth of millions of sequences per sample. Proc. Natl. Acad. Sci. U.S.A. 108(Suppl.), 4516–4522. doi: 10.1073/pnas.1000080107
Cardoso, A. C., Cochrane, S., Doerner, H., Ferreira, J. G., Galgani, F., Hagebro, C., et al. (2010). Scientific Support to the European Commission on the Marine Strategy Framework Directive. Management Group Report. Office for Official Publications of the European Communities. Luxembourg: EUR 24336 EN, Joint Research Centre.
Carew, M. E., Pettigrove, V. J., Metzeling, L., and Hoffmann, A. A. (2013). Environmental monitoring using next generation sequencing: rapid identification of macroinvertebrate bioindicator species. Front. Zool. 10:45. doi: 10.1186/1742-9994-10-45
Carugati, L., Corinaldesi, C., Dell'Anno, A., and Danovaro, R. (2015). Metagenetic tools for the census of marine meiofaunal biodiversity: an overview. Mar. Genomics 24(Pt 1), 11–20. doi: 10.1016/j.margen.2015.04.010
Caruso, G., La Ferla, R., Azzaro, M., Zoppini, A., Marino, G., Petochi, T., et al. (2015). Microbial assemblages for environmental quality assessment: knowledge, gaps and usefulness in the European Marine Strategy Framework Directive. Crit. Rev. Microbiol. 42, 883–904. doi: 10.3109/1040841X.2015.1087380
Casamayor, E. O., Ferrera, I., Cristina, X., Borrego, C. M., and Gasol, J. M. (2007). Flow cytometric identification and enumeration of photosynthetic sulfur bacteria and potential for ecophysiological studies at the single-cell level. Environ. Microbiol. 9, 1969–1985. doi: 10.1111/j.1462-2920.2007.01313.x
Chariton, A. A., Court, L. N., Hartley, D. M., Colloff, M. J., and Hardy, C. M. (2010). Ecological assessment of estuarine sediments by pyrosequencing eukaryotic ribosomal DNA. Front. Ecol. Environ. 8, 233–238. doi: 10.1890/090115
Christaki, U., Courties, C., Massana, R., Catala, P., Lebaron, P., Gasol, J. M., et al. (2011). Optimized routine flow cytometric enumeration of heterotrophic flagellates using SYBR Green, I. Limnol. Oceanogr. Methods 9, 329–339. doi: 10.4319/lom.2011.9.329
Cline, J., Braman, J. C., and Hogrefe, H. H. (1996). PCR fidelity of Pfu DNA polymerase and other thermostable DNA polymerases. Nucleic Acids Res. 24, 3546–3551. doi: 10.1093/nar/24.18.3546
Connor, D. W., Gilliland, P. M., Golding, N., Robinson, P., Todd, D., and Verling, E. (2006). UKSeaMap: The Mapping of Seabed and Water Column Features of UK Seas. Peterborough, ON: Joint Nature Conservation Committee.
Corinaldesi, C. (2015). New perspectives in benthic deep-sea microbial ecology. Front. Mar. Sci. 2:17. doi: 10.3389/fmars.2015.00017
Corinaldesi, C., Barucca, M., Luna, G. M., and Dell'Anno, A. (2011). Preservation, origin and genetic imprint of extracellular DNA in permanently anoxic deep-sea sediments. Mol. Ecol. 20, 642–654. doi: 10.1111/j.1365-294X.2010.04958.x
Corinaldesi, C., Beolchini, F., and Dell'Anno, A. (2008). Damage and degradation rates of extracellular DNA in marine sediments: implications for the preservation of gene sequences. Mol. Ecol. 17, 3939–3951. doi: 10.1111/j.1365-294X.2008.03880.x
Corinaldesi, C., Tangherlini, M., Luna, G. M., and Dell'anno, A. (2014). Extracellular DNA can preserve the genetic signatures of present and past viral infection events in deep hypersaline anoxic basins. Proc. R. Soc. B Biol. Sci. 281:20133299. doi: 10.1098/rspb.2013.3299
Costello, M. J., and Wilson, S. P. (2011). Predicting the number of known and unknown species in European seas using rates of description. Global Ecol. Biogeogr. 20, 319–330. doi: 10.1111/j.1466-8238.2010.00603.x
Cowart, D. A., Pinheiro, M., Mouchel, O., Maguer, M., Grall, J., Miné, J., et al. (2015). Metabarcoding is powerful yet still blind: a comparative analysis of morphological and molecular surveys of seagrass communities. PLoS ONE 10:e0117562. doi: 10.1371/journal.pone.0117562
Crain, C. M., Kroeker, K., and Halpern, B. S. (2008). Interactive and cumulative effects of multiple human stressors in marine systems. Ecol. Lett. 11, 1304–1315. doi: 10.1111/j.1461-0248.2008.01253.x
Cram, J. A., Chow, C.-E. T., Sachdeva, R., Needham, D. M., Parada, A. E., Steele, J. A., et al. (2015). Seasonal and interannual variability of the marine bacterioplankton community throughout the water column over ten years. ISME J. 9, 563–580. doi: 10.1038/ismej.2014.153
Creer, S., Deiner, K., Frey, S., Porazinska, D., Taberlet, P., Thomas, W. K., et al. (2016). The ecologist's field guide to sequence-based identification of biodiversity. Methods Ecol. Evol. 7, 1008–1018. doi: 10.1111/2041-210X.12574
Creer, S., Fonseca, V. G., Porazinska, D. L., Giblin-Davis, R. M., Sung, W., Power, D. M., et al. (2010). Ultrasequencing of the meiofaunal biosphere: practice, pitfalls and promises. Mol. Ecol. 19, 4–20. doi: 10.1111/j.1365-294X.2009.04473.x
Cristina, S., D'Alimonte, D., Goela, P. C., Kajiyama, T., Icely, J., Moore, G., et al. (2016). Standard and regional bio-optical algorithms for chlorophyll a estimates in the atlantic off the southwestern iberian peninsula. IEEE Geosci. Remote Sens. Lett. 13, 757–761. doi: 10.1109/LGRS.2016.2529182
Cristina, S., Goela, P., Icely, J. D., Newton, A., and Fragoso, B. (2009). Assessment of water-leaving reflectances of oceanic and coastal waters using MERIS satellite products off the southwest coast of Portugal. J. Coast. Res. 56, 1479–1483.
Cristina, S., Icely, J., Goela, P. C., DelValls, T. A., and Newton, A. (2015). Using remote sensing as a support to the implementation of the European Marine Strategy Framework Directive in SW Portugal. Cont. Shelf Res. 108, 169–177. doi: 10.1016/j.csr.2015.03.011
Cristina, S., Moore, G. F., Goela, P. C., Icely, J. D., and Newton, A. (2014). In situ validation of MERIS marine reflectance off the southwest Iberian Peninsula: assessment of vicarious adjustment and corrections for near-land adjacency. Int. J. Remote Sens. 35, 2347–2377. doi: 10.1080/01431161.2014.894657
Danovaro, R. (2003). Pollution threats in the Mediterranean Sea: an overview. Chem. Ecol. 19, 15–32. doi: 10.1080/0275754031000081467
Danovaro, R., and Gambi, C. (2002). Biodiversity and trophic structure of nematode assemblages in seagrass systems: evidence for a coupling with changes in food availability. Mar. Biol. 141, 667–677. doi: 10.1007/s00227-002-0857-y
Danovaro, R., Gambi, C., Dell'Anno, A., Corinaldesi, C., Fraschetti, S., Vanreusel, A., et al. (2008). Exponential decline of deep-sea ecosystem functioning linked to benthic biodiversity loss. Curr. Biol. 18, 1–8. doi: 10.1016/j.cub.2007.11.056
Danovaro, R., Gambi, C., Luna, G. M., and Mirto, S. (2004). Sustainable impact of mussel farming in the Adriatic Sea (Mediterranean Sea): evidence from biochemical, microbial and meiofaunal indicators. Mar. Pollut. Bull. 49, 325–333. doi: 10.1016/j.marpolbul.2004.02.038
Danovaro, R., Gambi, C., Manini, E., and Fabiano, M. (2000). Meiofauna response to a dynamic river plume front. Mar. Biol. 137, 359–370. doi: 10.1007/s002270000353
Danovaro, R., and Pusceddu, A. (2007). Biodiversity and ecosystem functioning in coastal lagoons: does microbial diversity play any role? Estuar. Coast. Shelf Sci. 75, 4–12. doi: 10.1016/j.ecss.2007.02.030
Danovaro, R., Snelgrove, P. V. R., and Tyler, P. (2014). Challenging the paradigms of deep-sea ecology. Trends Ecol. Evol. 29, 465–475. doi: 10.1016/j.tree.2014.06.002
Deagle, B. E., Jarman, S. N., Coissac, E., Pompanon, F., and Taberlet, P. (2014). DNA metabarcoding and the cytochrome c oxidase subunit I marker: not a perfect match. Biol. Lett. 10:20140562. doi: 10.1098/rsbl.2014.0562
Dejean, T., Valentini, A., Miquel, C., Taberlet, P., Bellemain, E., and Miaud, C. (2012). Improved detection of an alien invasive species through environmental DNA barcoding: the example of the American bullfrogLithobates catesbeianus. J. Appl. Ecol. 49, 953–959. doi: 10.1111/j.1365-2664.2012.02171.x
del Giorgio, P. A., and Gasol, J. M. (2008). “Physiological structure and single-cell activity in marine bacterioplankton,” in Microbial Ecology of the Oceans, 2nd Edn., ed D. L. Kirchman (Hoboken, NJ: John Wiley & Sons, Inc.), 243–298.
Dell'Anno, A., Carugati, L., Corinaldesi, C., Riccioni, G., and Danovaro, R. (2015). Unveiling the biodiversity of deep-sea nematodes through metabarcoding: are we ready to bypass the classical taxonomy? PLoS ONE 10:e0144928. doi: 10.1371/journal.pone.0144928
Dell'Anno, A., Mei, M. L., Pusceddu, A., and Danovaro, R. (2002). Assessing the trophic state and eutrophication of coastal marine systems: a new approach based on the biochemical composition of sediment organic matter. Mar. Pollut. Bull. 44, 611–622. doi: 10.1016/S0025-326X(01)00302-2
Derycke, S., Remerie, T., Vierstraete, B. A. T., Vanfleteren, J., Vincx, M., and Moens, T. (2005). Mitochondrial DNA variation and cryptic speciation within the free-living marine nematode Pellioditis marina. Mar. Ecol. Progr. Ser. 300, 91–103. doi: 10.3354/meps300091
de Vargas, C., Audic, S., Henry, N., Decelle, J., Mahé, F., Logares, R., et al. (2015). Eukaryotic plankton diversity in the sunlit ocean. Science 348:1261605. doi: 10.1126/science.1261605
Doney, S. C., Ruckelshaus, M., Duffy, J. E., Barry, J. P., Chan, F., English, C. A., et al. (2012). Climate change impacts on marine ecosystems. Mar. Sci. 4, 11–37. doi: 10.1146/annurev-marine-041911-111611
Dong, M., Bryan, B. A., Connor, J. D., Nolan, M., and Gao, L. (2015). Land use mapping error introduces strongly-localised, scale-dependent uncertainty into land use and ecosystem services modelling. Ecosyst. Serv. 15, 63–74. doi: 10.1016/j.ecoser.2015.07.006
Dubelaar, G. B. J., Gerritzen, P. L., Beeker, A. E. R., Jonker, R. R., and Tangen, K. (1999). Design and first results of the cytobuoy: an autonomous flow cytometer with wireless datatransfer for in situ analysis of marine and fresh waters. Cytometry 37, 247–254.
Edgar, R. C. (2010). Search and clustering orders of magnitude faster than BLAST, Bioinformatics 26, 2460–2461. doi: 10.1093/bioinformatics/btq461
Edgar, R. C., Haas, B. J., Clemente, J. C., Quince, C., and Knight, R. (2011). UCHIME improves sensitivity and speed of chimera detection. Bioinformatics 27, 2194–2200. doi: 10.1093/bioinformatics/btr381
Elbrecht, V., and Leese, F. (2015). Can DNA-based ecosystem assessments quantify species abundance? Testing primer bias and biomass—sequence relationships with an innovative metabarcoding protocol. PLoS ONE 10:e0130324. doi: 10.1371/journal.pone.0130324
European Commission (2014). Commission Report to the Council and the European Parliament. The First Phase of Implementation of the Marine Strategy Framework Directive (2008/56/EC). The European Commission's Assessment and Guidance. Brussels.
Farina, A., Pieretti, N., and Piccioli, L. (2011). The soundscape methodology for long-term bird monitoring: a Mediterranean Europe case-study. Ecol. Inform. 6, 354–363. doi: 10.1016/j.ecoinf.2011.07.004
Ferrera, I., Giner, C. R., Reñé, A., Camp, J., Massana, R., Gasol, J. M., et al. (2016). Evaluation of alternative high-throughput sequencing methodologies for the monitoring of marine picoplanktonic biodiversity based on rRNA gene amplicons. Front. Mar. Sci. 3:147. doi: 10.3389/fmars.2016.00147
Galparsoro, I., Agrafojo, X., Roche, M., and Degrendele, K. (2015b). Comparison of supervised and unsupervised automatic classification methods for sediment types mapping using multibeam echosounder and grab sampling. Ital. J. Geosci. 134, 41–49. doi: 10.3301/IJG.2014.19
Galparsoro, I., Rodríguez, J. G., Menchaca, I., Quincoces, I., Garmendia, J. M., and Borja, Á. (2015a). Benthic habitat mapping on the Basque continental shelf (SE Bay of Biscay) and its application to the European Marine Strategy Framework Directive. J. Sea Res. 100, 70–76. doi: 10.1016/j.seares.2014.09.013
Gasol, J. M., and del Giorgio, P. A. (2000). Using flow cytometry for counting natural planktonic bacteria and understanding the structure of planktonic bacterial communities. Sci. Mar. 64, 197–224. doi: 10.3989/scimar.2000.64n2197
Gasol, J. M., and Morán, X. A. G. (2015). “Flow cytometric determination of microbial abundances and its use to obtain indices of community structure and relative activity,” in Hydrocarbon and Lipid Microbiology Protocols, eds T. J. McGenity, K. N. Timmis, and B. Nogales (Berlin, Heidelberg: Springer), 159–187.
Gibb, S. W., Cummings, D. G., Irigoien, X., Barlow, R. G., Fauzi, R., and Mantoura, C. (2001). Phytoplankton pigment chemotaxonomy of the northeastern Atlantic. Deep Sea Res. II Top. Stud. Oceanogr. 48, 795–823. doi: 10.1016/S0967-0645(00)00098-9
Gilbert, J. A., Field, D., Swift, P., Newbold, L., Oliver, A., Smyth, T., et al. (2009). The seasonal structure of microbial communities in the Western English Channel. Environ. Microbiol. 11, 3132–3139. doi: 10.1111/j.1462-2920.2009.02017.x
Gilbert, J. A., Steele, J. A., Caporaso, J. G., Steinbruck, L., Reeder, J., Temperton, B., et al. (2012). Defining seasonal marine microbial community dynamics. ISME J. 6, 298–308. doi: 10.1038/ismej.2011.107
Glenn, T. C. (2011). Field guide to next-generation DNA sequencers. Mol. Ecol. Resour. 11, 759–769. doi: 10.1111/j.1755-0998.2011.03024.x
Gobin, J. F., and Warwick, R. M. (2006). Geographical variation in species diversity: a comparison of marine polychaetes and nematodes. J. Exp. Mar. Biol. Ecol. 330, 234–244. doi: 10.1016/j.jembe.2005.12.030
Goela, P. C., Icely, J., Cristina, S. C. V., Danchenko, S., DelValls, T. A., and Newton, A. (2015). Using bio-optical parameters as a tool for detecting changes in the phytoplankton community (SW Portugal). Estuar. Coast. Shelf Sci. 167, 125–137. doi: 10.1016/j.ecss.2015.07.037
Goela, P., Danchenko, S., Icely, J., Lubian, L., Cristina, S., and Newton, A. (2014). Using CHEMTAX to evaluate seasonal and interannual dynamics of the phytoplankton community off the South-west coast of Portugal. Estuar. Coast. Shelf Sci. 151, 112–123. doi: 10.1016/j.ecss.2014.10.001
Gohin, F., Saulquin, B., Oger-Jeanneret, H., Lozac'h, L., Lampert, L., Lefebvre, A., et al. (2008). Towards a better assessment of the ecological status of coastal waters using satellite-derived chlorophyll-a concentrations. Remote Sens. Environ. 112, 3329–3340. doi: 10.1016/j.rse.2008.02.014
Griffen, B. D., Belgrad, B. A., Cannizzo, Z. J., Knotts, E. R., and Hancock, E. R. (2016). Rethinking our approach to multiple stressor studies in marine environments. Mar. Ecol. Prog. Ser. 543, 273–281. doi: 10.3354/meps11595
Haas, B. J., Gevers, D., Earl, A. M., Feldgarden, M., Ward, D. V., Giannoukos, G., et al. (2011). Chimeric 16S rRNA sequence formation and detection in Sanger and 454-pyrosequenced PCR amplicons. Genome Res. 21, 494–504. doi: 10.1101/gr.112730.110
Hajibabaei, M., Shokralla, S., Zhou, X., Singer, G. A. C., and Baird, D. J. (2011). Environmental barcoding: a next-generation sequencing approach for biomonitoring applications using river benthos. PLoS ONE 6:e17497. doi: 10.1371/journal.pone.0017497
Hale, R., Calosi, P., McNeill, L., Mieszkowska, N., and Widdicombe, S. (2011). Predicted levels of future ocean acidification and temperature rise could alter community structure and biodiversity in marine benthic communities. Oikos 120, 661–674. doi: 10.1111/j.1600-0706.2010.19469.x
Halpern, B. S., Longo, C., Hardy, D., McLeod, K. L., Samhouri, J. F., Katona, S. K., et al. (2012). An index to assess the health and benefits of the global ocean. Nature 488, 615–620. doi: 10.1038/nature11397
Halpern, B. S., Walbridge, S., Selkoe, K. A., Kappel, C. V., Micheli, F., D'Agrosa, C., et al. (2008). A global map of human impact on marine ecosystems. Science 319, 948–952. doi: 10.1126/science.1149345
Harvey, E. T., Kratzer, S., and Philipson, P. (2015). Satellite-based water quality monitoring for improved spatial and temporal retrieval of chlorophyll-a in coastal waters. Remote Sens. Environ. 158, 417–430. doi: 10.1016/j.rse.2014.11.017
Harvey, J. B., Ryan, J. P., Marin, R., Preston, C. M., Alvarado, N., Scholin, C. A., et al. (2012). Robotic sampling, in situ monitoring and molecular detection of marine zooplankton. J. Exp. Mar. Biol. Ecol. 413, 60–70. doi: 10.1016/j.jembe.2011.11.022
Harwood, V. J., Staley, C., Badgley, B. D., Borges, K., and Korajkic, A. (2014). Microbial source tracking markers for detection of fecal contamination in environmental waters: relationships between pathogens and human health outcomes. FEMS Microbiol. Rev. 38, 1–40. doi: 10.1111/1574-6976.12031
Hayes, K. R., Cannon, R., Neil, K., and Inglis, G. (2005). Sensitivity and cost considerations for the detection and eradication of marine pests in ports. Mar. Pollut. Bull. 50, 823–834. doi: 10.1016/j.marpolbul.2005.02.032
Heads, M. (2015). The relationship between biogeography and ecology: envelopes, models, predictions. Biol. J. Linn. Soc. 115, 456–468. doi: 10.1111/bij.12486
Hengl, T., Heuvelink, G. B., Kempen, B., Leenaars, J. G., Walsh, M. G., and Shepherd, K. D. (2015). Mapping soil properties of Africa at 250 m resolution: random forests significantly improve current predictions. PLoS ONE 10:e0125814. doi: 10.1371/journal.pone.0125814
Hewitt, J. E., Anderson, M. J., and Thrush, S. F. (2005). Assessing and monitoring ecological community health in marine systems. Ecol. Appl. 15, 942–953. doi: 10.1890/04-0732
Higgins, H. W., Wright, S. W., and Schlüter, L. (2011). “Quantitative interpretation of chemotaxonomic pigment data,” in Phytoplankton Pigments: Characterization, Chemotaxonomy and Applications in Oceanography, eds S. Roy, C. A. Llewellyn, E. S. Egeland, and G. Johnsen (Cambridge; New York, NY: Cambridge University Press), 257–313. doi: 10.1017/cbo9780511732263.010
Hirai, J., Kuriyama, M., Ichikawa, T., Hidaka, K., and Tsuda, A. (2015). A metagenetic approach for revealing community structure of marine planktonic copepods. Mol. Ecol. Resour. 15, 68–80. doi: 10.1111/1755-0998.12294
Hoegh-Guldberg, O., and Bruno, J. F. (2010). The impact of climate change on the World's marine ecosystems. Science 328, 1523–1528. doi: 10.1126/science.1189930
IOCCG (2009). Partition of the Ocean into Ecological Provinces: Role of Ocean-Colour Radiometry, volume No. 9 of Reports of the International Ocean Colour Coordinating Group. Dartmouth, NS: IOCCG.
Jenner, R. A. (2004). Accepting partnership by submission? Morphological phylogenetics in a molecular millennium. Syst. Biol. 53, 333–342. doi: 10.1080/10635150490423962
Jerde, C. L., Mahon, A. R., Chadderton, W. L., and Lodge, D. M. (2011). “Sight-unseen” detection of rare aquatic species using environmental DNA. Conserv. Lett. 4, 150–157. doi: 10.1111/j.1755-263X.2010.00158.x
Knudsen, F. R., and Larsson, P. (2009). Discriminating the diel vertical migration of fish and Chaoborus flavicans larvae in a lake using a dual-frequency echo sounder. Aquat. Living Resour. 22, 273–280. doi: 10.1051/alr/2009029
Kopf, A., Bicak, M., Kottmann, R., Schnetzer, J., Kostadinov, I., Lehmann, K., et al. (2015). The ocean sampling day consortium. Gigascience 4, 1–5. doi: 10.1186/s13742-015-0066-5
Kratzer, S., Brockmann, C., and Moore, G. (2008). Using MERIS full resolution data to monitor coastal waters - A case study from Himmerfjarden, a fjord-like bay in the northwestern Baltic Sea. Remote Sens. Environ. 112, 2284–2300. doi: 10.1016/j.rse.2007.10.006
Kurekin, A. A., Miller, P. I., and Van der Woerd, H. J. (2014). Satellite discrimination of Karenia mikimotoi and Phaeocystis harmful algal blooms in European coastal waters: merged classification of ocean colour data. Harmful Algae 31, 163–176. doi: 10.1016/j.hal.2013.11.003
Le Bris, N., Sarradin, P. M., Birot, D., and Alayse-Danet, A. M. (2000). A new chemical analyzer for in situ measurement of nitrate and total sulfide over hydrothermal vent biological communities. Mar. Chem. 72, 1–15. doi: 10.1016/S0304-4203(00)00057-8
Leray, M., and Knowlton, N. (2015). DNA barcoding and metabarcoding of standardized samples reveal patterns of marine benthic diversity. Proc. Natl. Acad. Sci. U.S.A. 112, 2076–2081. doi: 10.1073/pnas.1424997112
Leray, M., and Knowlton, N. (2016). Censusing marine eukaryotic diversity in the twenty-first century. Philos. Trans. R. Soc. B. 371:20150331. doi: 10.1098/rstb.2015.0331
Le Traon, P. Y., Antoine, D., Bentamy, A., Bonekamp, H., Breivik, L. A., Chapron, B., et al. (2015). Use of satellite observations for operational oceanography: recent achievements and future prospects. J. Oper. Oceanogr. 8, s12–s27. doi: 10.1080/1755876x.2015.1022050
Lewis, J. M., Medlin, L. K., and Raine, R. (Eds.). (2012). MIDTAL (Microarrays for the Detection of Toxic Algae): A Protocol for a Successful Microarray Hybridisation and Analysis. Koenigstein: ARG Gantner Verlag KG.
Li, W. K. W. (1997). Cytometric diversity in marine ultraphytoplankton. Limnol. Oceanogr. 42, 874–880. doi: 10.4319/lo.1997.42.5.0874
Lindeque, P. K., Parry, H. E., Harmer, R. A., Somerfield, P. J., and Atkinson, A. (2013). Next generation sequencing reveals the hidden diversity of zooplankton assemblages. PLoS ONE 8:e81327. doi: 10.1371/journal.pone.0081327
Liu, S., Yao, P., Yu, Z., Li, D., Deng, C., and Zhen, Y. (2014). HPLC pigment profiles of 31 harmful algal bloom species isolated from the coastal sea areas of China. J. Ocean Univ. China 13, 941–950. doi: 10.1007/s11802-014-2448-1
Logares, R., Audic, S., Bass, D., Bittner, L., Boutte, C., Christen, R., et al. (2014a). Patterns of rare and abundant marine microbial eukaryotes. Curr. Biol. 24, 813–821. doi: 10.1016/j.cub.2014.02.050
Logares, R., Sunagawa, S., Salazar, G., Cornejo-Castillo, F. M., Ferrera, I., Sarmento, H., et al. (2014b). Metagenomic 16S rDNA Illumina tags are a powerful alternative to amplicon sequencing to explore diversity and structure of microbial communities. Environ. Microbiol. 16, 2659–2671. doi: 10.1111/1462-2920.12250
Lu, X., Zhang, X.-X., Wang, Z., Huang, K., Wang, Y., Liang, W., et al. (2015). Bacterial pathogens and community composition in advanced sewage treatment systems revealed by metagenomics analysis based on high-throughput sequencing. PLoS ONE 10:e0125549. doi: 10.1371/journal.pone.0125549
Mackey, M., Mackey, D., Higgins, H., and Wright, S. (1996). CHEMTAX - a program for estimating class abundances from chemical markers: application to HPLC measurements of phytoplankton. Mar. Ecol. Prog. Ser. 114, 265–283. doi: 10.3354/meps144265
Mairota, P., Cafarelli, B., Didham, R. K., Lovergine, F. P., Lucas, R. M., and Nagendra, H. (2015). Challenges and opportunities in harnessing satellite remote-sensing for biodiversity monitoring. Ecol. Inform. 30, 207–214. doi: 10.1016/j.ecoinf.2015.08.006
Mangoni, O., Basset, A., Bergamasco, A., Carrada, G. C., Margiotta, F., Passarelli, A., et al. (2013). A case study on the application of the MSFD to Mediterranean coastal systems: the Po plume, as a transitional water system in the Northern Adriatic basin. Trans. Waters Bull. 7, 175–201. doi: 10.1285/i1825229Xv7n2p175
Mangoni, O., Imperatore, C., Tomas, C. R., Costantino, V., Saggiomo, V., and Mangoni, A. (2011). The new carotenoid pigment moraxanthin associated with a toxic microalgae. Mar. Drugs 9, 242–255. doi: 10.3390/md9020242
Marie, D., Simon, N., and Vaulot, D. (2005). “Phytoplankton cell counting by flow cytometry,” in Algal Culturing Techniques, ed R. A. Andersen (Burlington, MA: Academic Press), 1–17. doi: 10.1016/b978-012088426-1/50018-4
Marine Strategy Framework Directive (2008). Directive 2008/56/EC of the European Parliament and of the Council of 17 June 2008 Establishing a Framework for Community Action in the Field of Marine Environmental Policy. Official Journal of European Union, L 164/19.
Mascaro, J., Asner, G. P., Knapp, D. E., Kennedy-Bowdoin, T., Martin, R. E., Anderson, C., et al. (2014). A tale of two “forests”: Random Forest machine learning aids tropical forest carbon mapping. PLoS ONE 9:e85993. doi: 10.1371/journal.pone.0085993
Massana, R., Gobet, A., Audic, S., Bass, D., Bittner, L., Boutte, C., et al. (2015). Marine protist diversity in European coastal waters and sediments as revealed by high-throughput sequencing. Environ. Microbiol. 17, 4035–4049. doi: 10.1111/1462-2920.12955
Mathewson, H. A., and Morrison, M. L. (2015). “The misunderstanding of habitat,” in Wildlife Habitat Conservation: Concepts, Challenges, and Solutions, eds M. L. Morrison and H. A. Mathewson (Baltimore, MD: JHU Press), 3–8.
McManus, G. B., and Katz, L. A. (2009). Molecular and morphological methods for identifying plankton: what makes a successful marriage? J. Plankton Res. 31, 1119–1129. doi: 10.1093/plankt/fbp061
Menge, B. A., Berlow, E. L., Blanchette, C. A., Navarrete, S. A., and Yamada, S. B. (1994). The keystone species concept: variation in interaction strength in a rocky intertidal habitat. Ecol. Monogr. 64, 249–286. doi: 10.2307/2937163
Menge, B. A., Chan, F., Nielsen, K. J., Di Lorenzo, E., and Lubchenco, J. (2009). Climatic variation alters supply-side ecology: impact of climate patterns on phytoplankton and mussel recruitment. Ecol. Monogr. 79, 379–395. doi: 10.1890/08-2086.1
Menge, B. A., Sanford, E., Daley, B. A., Freidenburg, T. L., Hudson, G., and Lubchenco, J. (2002). Inter-hemispheric comparison of bottom-up effects on community structure: insights revealed using the comparative-experimental approach. Ecol. Res. 17, 1–16. doi: 10.1046/j.1440-1703.2002.00458.x
Miller, P. I., and Christodoulou, S. (2014). Frequent locations of ocean fronts as an indicator of pelagic diversity: application to marine protected areas and renewables. Marine Policy 45, 318–329. doi: 10.1016/j.marpol.2013.09.009
Miller, P. I., Shutler, J. D., Moore, G. F., and Groom, S. B. (2006). SeaWiFS discrimination of harmful algal bloom evolution. Int. J. Remote Sens. 27, 2287–2301. doi: 10.1080/01431160500396816
Mills, G., and Fones, G. (2012). A review of in situ methods and sensors for monitoring the marine environment. Sens. Rev. 32, 17–28. doi: 10.1108/02602281211197116
Minster, J. F., and Connolly, N. (2006). Navigating the Future – III Updated Synthesis of Perspectives on Marine Science and Technology in Europe. European Science Foundation, Position Paper 8, 71.
Mora, C., Wei, C. L., Rollo, A., Amaro, T., Baco, A. R., Billett, D., et al. (2013). Biotic and human vulnerability to projected changes in ocean biogeochemistry over the 21st century. PLoS Biol. 11:e1001682. doi: 10.1371/journal.pbio.1001682
Morán, X. A. G., Alonso-Sáez, L., Nogueira, E., Ducklow, H. W., González, N., López-Urrutia, Á., et al. (2015). More, smaller bacteria in response to ocean's warming? Proc. R. Soc. B 282:20150371. doi: 10.1098/rspb.2015.0371
Morán, X. A. G., López-Urrutia, A., Calvo-Díaz, A., and Li, W. K. W. (2010). Increasing importance of small phytoplankton in a warmer ocean. Glob. Chang. Biol. 16, 1137–1144. doi: 10.1111/j.1365-2486.2009.01960.x
Moreno, M., Semprucci, F., Vezzulli, L., Balsamo, M., and Fabiano, M. (2011). The use of nematodes in assessing ecological quality status in the Mediterranean coastal ecosystems. Ecol. Indic. 11, 328–336. doi: 10.1016/j.ecolind.2010.05.011
Newton, R. J., Vandewalle, J. L., Borchardt, M. A., Gorelick, M. H., and McLellan, S. L. (2011). Lachnospiraceae and Bacteroidales alternative fecal indicators reveal chronic human sewage contamination in an urban harbor. Appl. Environ. Microbiol. 77, 6972–6981. doi: 10.1128/AEM.05480-11
Nõges, P., Argillier, C., Borja, Á., Garmendia, J. M., Hanganu, J., Kodeš, V., et al. (2016). Quantified biotic and abiotic responses to multiple stress in freshwater, marine and ground waters. Sci. Total Environ. 540, 43–52. doi: 10.1016/j.scitotenv.2015.06.045
Novoa, S., Chust, G., Sagarminaga, Y., Revilla, M., Borja, A., and Franco, J. (2012). Water quality assessment using satellite-derived chlorophyll-a within the European directives, in the southeastern Bay of Biscay. Mar. Pollut. Bull. 64, 739–750. doi: 10.1016/j.marpolbul.2012.01.020
Olson, R. J., and Sosik, H. M. (2007). A submersible imaging-in-flow instrument to analyze nano- and microplankton: imaging flowCytobot. Limnol. Oceanogr. Methods 5, 195–203. doi: 10.4319/lom.2007.5.195
Örnólfsdóttir, E. B., Pinckney, J. L., and Tester, P. A. (2003). Quantification of the relative abundance of the toxic dinoflagellate Karenia brevis (Dynophyta), using unique phytopigments. J. Phycol. 39, 449–457. doi: 10.1046/j.1529-8817.2003.01219.x
Orpin, A. R., and Kostylev, V. E. (2006). Towards a statistically valid method of textural sea floor characterization of benthic habitats. Mar. Geol. 225, 209–222. doi: 10.1016/j.margeo.2005.09.002
Paine, R. T. (1974). Intertidal community structure. Experimental studies on the relationship between a dominant competitor and its principal predator. Oecologia 15, 93–120. doi: 10.1007/BF00345739
Payne, R. J. (2013). Seven reasons why protists make useful bioindicators. Acta Protozool. 52, 105. doi: 10.4467/16890027AP.13.0011.1108
Pearman, J. K., Anlauf, H., Irigoien, X., and Carvalho, S. (2016a). Please mind the gap–Visual census and cryptic biodiversity assessment at central Red Sea coral reefs. Mar. Environ. Res. 118, 20–30. doi: 10.1016/j.marenvres.2016.04.011
Pearman, J. K., and Irigoien, X. (2015). Assessment of zooplankton community composition along a depth profile in the Central Red Sea. PLoS ONE 10:e0133487. doi: 10.1371/journal.pone.0133487
Pearman, J. K., Irigoien, X., and Carvalho, S. (2016b). Extracellular DNA amplicon sequencing reveals high levels of benthic eukaryotic diversity in the central Red Sea. Mar. Genomics 26, 29–39. doi: 10.1016/j.margen.2015.10.008
Peters, S., Brockmann, C., Eleveld, M., Pasterkamp, R. H., Van der Woerd Ruddick, K., et al. (2005). “Regional chlorophyll retrieval algorithms for North Sea waters: intercomparison and validation,” in Proceedings of the MERIS (A) ATSR Workshop 2005 (ESA SP-597), ed H. Lacoste (Frascati: CDROM), 19.1.
Petersen, W., Wehde, H., Krasemann, H., Colijn, F., and Schroeder, F. (2008). FerryBox and MERIS - Assessment of coastal and shelf sea ecosystems by combining in situ and remotely sensed data. Estuarine Coast. Shelf Sci. 77, 296–307. doi: 10.1016/j.ecss.2007.09.023
Pettorelli, N., Safi, K., and Turner, W. (2014). Satellite remote sensing, biodiversity research and conservation of the future. Philos. Trans. R. Soc. Lond. B Biol. Sci. 369:20130190. doi: 10.1098/rstb.2013.0190
Pieretti, N., Farina, A., and Morri, D. (2011). A new methodology to infer the singing activity of an avian community: the Acoustic Complexity Index (ACI). Ecol. Indic. 11, 868–873. doi: 10.1016/j.ecolind.2010.11.005
Pitois, S. G., Bouch, P., Creach, V., and van der Kooij, J. (2016). Comparison of zooplankton data collected by a continuous semi-automatic sampler (CALPS) and a traditional vertical ring net. J. Plank. Res. 38, 931–943. doi: 10.1093/plankt/fbw044
Pusceddu, A., Bianchelli, S., Gambi, C., and Danovaro, R. (2011). Assessment of benthic trophic status of marine coastal ecosystems: significance of meiofaunal rare taxa. Estuar. Coast. Shelf Sci. 93, 420–430. doi: 10.1016/j.ecss.2011.05.012
Pusceddu, A., Dell'Anno, A., Fabiano, M., and Danovaro, R. (2009). Quantity and bioavailability of sediment organic matter as signatures of benthic trophic status. Mar. Ecol. Prog. Ser. 375, 41–52. doi: 10.3354/meps07735
Pusceddu, A., Fraschetti, S., Mirto, S., Holmer, M., and Danovaro, R. (2007). Effects of intensive mariculture on sediment biochemistry. Ecol. Appl. 17, 1366–1378. doi: 10.1890/06-2028.1
Quince, C., Lanzen, A., Davenport, R. J., and Turnbaugh, P. J. (2011). Removing noise from pyrosequenced amplicons. BMC Bioinformatics 12:38. doi: 10.1186/1471-2105-12-38
Radom, M., Rybarczyk, A., Kottmann, R., Formanowicz, P., Szachniuk, M., Glöckner, F. O., et al. (2012). Poseidon: an information retrieval and extraction system for metagenomic marine science. Ecol. Inform. 12, 10–15. doi: 10.1016/j.ecoinf.2012.07.003
Ranasinghe, J. A., Stein, E. D., Miller, P. E., and Weisberg, S. B. (2012). Performance of two southern california benthic community condition indices using species abundance and presence-only data: relevance to DNA barcoding. PLoS ONE 7:e40875. doi: 10.1371/journal.pone.0040875
Randin, C. F., Dirnböck, T., Dullinger, S., Zimmermann, N. E., Zappa, M., and Guisan, A. (2006). Are niche-based species distribution models transferable in space? J. Biogeogr. 33, 1689–1703. doi: 10.1111/j.1365-2699.2006.01466.x
Rivas, A. L., Dogliotti, A. I., and Gagliardini, D. A. (2006). Seasonal variability in satellite-measured surface chlorophyll in the Patagonian Shelf. Cont. Shelf Res. 26, 703–720. doi: 10.1016/j.csr.2006.01.013
Roy, S., Llewellyn, C. A., Egeland, E. S., and Johnsen, G. (2011). Phytoplankton Pigments-Characterization, Chemotaxonomy and Applications in Oceanography. Cambridge: Cambridge University Press.
Salazar, G., Cornejo-Castillo, F. M., Benítez-Barrios, V., Fraile-Nuez, E., Álvarez-Salgado, X. A., Duarte, C. M., et al. (2016). Global diversity and biogeography of deep-sea pelagic prokaryotes. ISME J. 10, 596–608. doi: 10.1038/ismej.2015.137
Scales, K. L., Miller, P. I., Hawkes, L. A., Ingram, S. N., Sims, D. W., and Votier, S. C. (2014). On the Front Line: frontal zones as priority at-sea conservation areas for mobile marine vertebrates. J. Appl. Ecol. 51, 1575–1583. doi: 10.1111/1365-2664.12330
She, J., Allen, I., Buch, E., Crise, A., Johannessen, J. A., Le Traon, P. Y., et al. (2016). Developing European operational oceanography for Blue Growth, climate change adaptation and mitigation and ecosystem-based management. Ocean Sci. Discuss. 2016, 1–59. doi: 10.5194/os-2015-103
Shi, X. L., Marie, D., Jardillier, L., Scanlan, D. J., and Vaulot, D. (2009). Groups without cultured representatives dominate eukaryotic picophytoplankton in the oligotrophic south east Pacific Ocean. PLoS ONE 4:e7657. doi: 10.1371/journal.pone.0007657
Silke, J., O'Beirn, F., and Cronin, M. (2005). Karenia Mikimotoi: An Exceptional Dinoflagellate Bloom in Western Irish Waters, Summer. Marine Environment and Health Series 21. Galway: Marine Institute, 48. Available online at: http://hdl.handle.net/10793/240
Smith, W. O. Jr., Tozzi, S., DiTullio, G. R., Dinnimand, M., Mangoni, O., Modigh, M., and Saggiomo, V. (2010). Phytoplankton photosynthetic pigments in the Ross Sea: patterns and relationships among functional groups. J. Mar. Syst. 82, 177–185. doi: 10.1016/j.jmarsys.2010.04.014
Smyth, R. P., Schlub, T. E., Grimm, A., Venturi, V., Chopra, A., Mallal, S., et al. (2010). Reducing chimera formation during PCR amplification to ensure accurate genotyping. Gene 469, 45–51. doi: 10.1016/j.gene.2010.08.009
Sogin, M. L., Morrison, H. G., Huber, J. A., Mark Welch, D., Huse, S. M., Neal, P. R., et al. (2006). Microbial diversity in the deep sea and the underexplored “rare biosphere”. Proc. Natl. Acad. Sci. U.S.A. 103, 12115–12120. doi: 10.1073/pnas.0605127103
Solan, M., Germano, J. D., Rhoads, D. C., Smith, C., Michaud, E., Parry, D., et al. (2003). Towards a greater understanding of pattern, scale and process in marine benthic systems: a picture is worth a thousand worms. J. Exp. Mar. Biol. Ecol. 285, 313–338. doi: 10.1016/S0022-0981(02)00535-X
Sørensen, K., Aas, E., and Hokedal, J. (2007). Validation of MERIS water products and bio-optical relationships in the Skagerrak. Int. J. Remote Sens. 28, 555–568. doi: 10.1080/01431160600815566
Staley, J. T., and Konopka, A. (1985). Measurement of in situ activities of nonphotosynthetic microorganisms in aquatic and terrestrial habitats. Annu. Rev. Microbiol. 39, 321–346. doi: 10.1146/annurev.mi.39.100185.001541
Steiniger, S., and Weibel, R. (2005). “Relations and structures in categorical maps,” in The 8th ICA Workshop on Generalisation and Multiple Representation (A Coruña).
Stoeck, T., Bass, D., Nebel, M., Christen, R., Jones, M. D., Breiner, H. W., et al. (2010). Multiple marker parallel tag environmental DNA sequencing reveals a highly complex eukaryotic community in marine anoxic water. Mol. Ecol. 19(Suppl. 1), 21–31. doi: 10.1111/j.1365-294X.2009.04480.x
Stomp, M., Huisman, J., Vörös, L., Pick, F. R., Laamanen, M., Haverkamp, T., et al. (2007). Colourful coexistence of red and green picocyanobacteria in lakes and seas. Ecol. Lett. 10, 290–298. doi: 10.1111/j.1461-0248.2007.01026.x
Stoner, A. W., Ryer, C. H., Parker, S. J., Auster, P. J., and Wakefield, W. W. (2008). Evaluating the role of fish behavior in surveys conducted with underwater vehicles. Can. J. Fish. Aquat. Sci. 65, 1230–1243. doi: 10.1139/F08-032
Suberg, L., Wynn, R. B., Kooij, J., Fernand, L., Fielding, S., Guihen, D., et al. (2014). Assessing the potential of autonomous submarine gliders for ecosystem monitoring across multiple trophic levels (plankton to cetaceans) and pollutants in shallow shelf seas. Methods Oceanogr. 10, 70–89. doi: 10.1016/j.mio.2014.06.002
Swalwell, J. E., Ribalet, F., and Armbrust, E. V. (2011). SeaFlow: A novel underway flow-cytometer for continuous observations of phytoplankton in the ocean. Limnol. Oceanogr. Methods 9, 466–477. doi: 10.4319/lom.2011.9.466
Taberlet, P., Coissac, E., Pompanon, F., Brochmann, C., and Willerslev, E. (2012). Towards next-generation biodiversity assessment using DNA metabarcoding. Mol. Ecol. 21, 2045–2050. doi: 10.1111/j.1365-294X.2012.05470.x
Tangherlini, M., Corinaldesi, C., and Dell'Anno, A. (2012). Viral metagenomics: a new and complementary tool for environmental quality assessment. Chem. Ecol. 28, 497–501. doi: 10.1080/02757540.2012.716045
Taylor, S. M. (2009). Transformative ocean science through the VENUS and NEPTUNE Canada ocean observing systems. Nucl. Instrum. Methods Phys. Res. Sect. A 602, 63–67. doi: 10.1016/j.nima.2008.12.019
Telford, M. J., and Holland, P. W. H. (1997). Evolution of 28S Ribosomal DNA in Chaetognaths: duplicate genes and molecular phylogeny. J. Mol. Evol. 44, 134–144. doi: 10.1007/PL00006130
Ten Hoopen, P., and Cochrane, G. (2014). Micro B3 Consortium Ocean Sampling Day Handbook - Version of June 2014. Available online at: http://www.microb3.eu/sites/default/files/osd/OSD_Handbook_v2.0.pdf
Thomsen, P. F., Kielgast, J., Iversen, L. L., Møller, P. R., Rasmussen, M., and Willerslev, E. (2012). Detection of a diverse marine fish fauna using environmental DNA from seawater samples. PLoS ONE 7:e41732. doi: 10.1371/journal.pone.0041732
Throndsen, J. (1997). “The planktonic marine flagellates,” in Identifying Marine Phytoplankton, ed C. R. Tomas (San Diego, CA: Academic Press), 591–729. doi: 10.1016/b978-012693018-4/50007-0
Tonge, D. P., Pashley, C. H., and Gant, T. W. (2014). Amplicon-based metagenomic analysis of mixed fungal samples using proton release amplicon sequencing. PLoS ONE 9:e93849. doi: 10.1371/journal.pone.0093849
Trenkel, V., Ressler, P. H., Jech, M., Giannoulaki, M., and Taylor, C. (2011). Underwater acoustics for ecosystem-based management: state of the science and proposals for ecosystem indicators. Mar. Ecol. 442, 285–301. doi: 10.3354/meps09425
Turner, W., Spector, S., Gardiner, N., Fladeland, M., Sterling, E., and Steininger, M. (2003). Remote sensing for biodiversity science and conservation. Trends Ecol. Evol. 18, 306–314. doi: 10.1016/S0169-5347(03)00070-3
Underwood, A. J., and Chapman, M. G. (2006). Early development of subtidal macrofaunal assemblages: relationships to period and timing of colonization. J. Exp. Mar. Biol. Ecol. 330, 221–233. doi: 10.1016/j.jembe.2005.12.029
Van Der Wal, D., and Herman, P. M. (2007). Regression-based synergy of optical, shortwave infrared and microwave remote sensing for monitoring the grain-size of intertidal sediments. Remote Sens. Environ. 111, 89–106. doi: 10.1016/j.rse.2007.03.019
Van der Wal, D., Herman, P. M. J., Forster, R., Ysebaert, T., Rossi, F., Knaeps, E., et al. (2008). Distribution and dynamics of intertidal macrobenthos predicted from remote sensing: response to microphytobenthos and environment. Mar. Ecol. Prog. Ser. 367, 57–72. doi: 10.3354/meps07535
Van Opzeeland, I., and Slabbekoorn, H. (2012). “Importance of underwater sounds for migration of fish and aquatic mammals,” in Effects of Noise on Aquatic Life, eds A.N. Popper and A. Hawkins (New York, NY: Springer Science + Business Media, LLC), 357–359. doi: 10.1007/978-1-4419-7311-5_80
Vantrepotte, V., and Mélin, M., F. (2010). Temporal variability in SeaWiFS derived apparent optical properties in European seas. Continental Shelf Res. 30, 319–334. doi: 10.1016/j.csr.2009.11.012
Viard, F., David, P., and Darling, J. (2016). Marine invasions enter the genomic era: three lessons from the past and the way forward. Curr. Zool. 1–14. doi: 10.1093/cz/zow053
Visco, J. A., Apothéloz-Perret-Gentil, L., Cordonier, A., Esling, P., Pillet, L., and Pawlowski, J. (2015). Environmental monitoring: inferring the diatom index from next-generation sequencing data. Environ. Sci. Technol. 49, 7597–7605. doi: 10.1021/es506158m
Vuillemin, R., LeRoux, D., Dorval, P., Bucas, K., Sudreau, J. P., Hamon, M., et al. (2009). CHEMINI: a new in situ CHEmical MINIaturized analyzer. Deep Sea Res. I Oceanogr. Res. 56, 1391–1399. doi: 10.1016/j.dsr.2009.02.002
Walz, U., and Syrbe, R. U. (2013). Linking landscape structure and biodiversity. Ecol. Indic. 31, 1–5. doi: 10.1016/j.ecolind.2013.01.032
Wilson, J., Low, B., Costanza, R., and Ostrom, E. (1999). Scale misperceptions and the spatial dynamics of a social–ecological system. Ecol. Econ. 31, 243–257. doi: 10.1016/S0921-8009(99)00082-8
Worm, B., Barbier, E. B., Beaumont, N., Duffy, J. E., Folke, C., Halpern, B. S., et al. (2006). Impacts of biodiversity loss on ocean ecosystem services. Science 314, 787–790. doi: 10.1126/science.1132294
Zaiko, A., Martinez, J. L., Schmidt-Petersen, J., Ribicic, D., Samuiloviene, A., and Garcia-Vazquez, E. (2015a). Metabarcoding approach for the ballast water surveillance - An advantageous solution or an awkward challenge? Mar. Pollut. Bull. 92, 25–34. doi: 10.1016/j.marpolbul.2015.01.008
Zaiko, A., Samuiloviene, A., Ardura, A., and Garcia-Vazquez, E. (2015b). Metabarcoding approach for nonindigenous species surveillance in marine coastal waters. Mar. Pollut. Bull. 100, 53–59. doi: 10.1016/j.marpolbul.2015.09.030
Zeidberg, L. D., and Robison, B. H. (2007). Invasive range expansion by the Humboldt squid, Dosidicus gigas, in the eastern North Pacific. Proc. Natl Acad. Sci. U.S.A. 104, 12946–12948. doi: 10.1073/pnas.0702043104
Zeppilli, D., Pusceddu, A., Trincardi, F., and Danovaro, R. (2016). Seafloor heterogeneity influences the biodiversity–ecosystem functioning relationships in the deep sea. Sci. Rep. 6:26352. doi: 10.1038/srep26352
Zhou, X., Li, Y., Liu, S., Yang, Q., Su, X., Zhou, L., et al. (2013). Ultra-deep sequencing enables high-fidelity recovery of biodiversity for bulk arthropod samples without PCR amplification. Gigascience 2:4. doi: 10.1186/2047-217X-2-4
Keywords: marine monitoring, marine strategy framework directive, marine biodiversity, molecular approaches, in situ monitoring
Citation: Danovaro R, Carugati L, Berzano M, Cahill AE, Carvalho S, Chenuil A, Corinaldesi C, Cristina S, David R, Dell'Anno A, Dzhembekova N, Garcés E, Gasol JM, Goela P, Féral J-P, Ferrera I, Forster RM, Kurekin AA, Rastelli E, Marinova V, Miller PI, Moncheva S, Newton A, Pearman JK, Pitois SG, Reñé A, Rodríguez-Ezpeleta N, Saggiomo V, Simis SGH, Stefanova K, Wilson C, Lo Martire M, Greco S, Cochrane SKJ, Mangoni O and Borja A (2016) Implementing and Innovating Marine Monitoring Approaches for Assessing Marine Environmental Status. Front. Mar. Sci. 3:213. doi: 10.3389/fmars.2016.00213
Received: 14 June 2016; Accepted: 14 October 2016;
Published: 23 November 2016.
Edited by:
Jacob Carstensen, Aarhus University, DenmarkReviewed by:
Matthias Obst, University of Gothenburg, SwedenJo Høkedal, Østfold University College, Norway
Copyright © 2016 Danovaro, Carugati, Berzano, Cahill, Carvalho, Chenuil, Corinaldesi, Cristina, David, Dell'Anno, Dzhembekova, Garcés, Gasol, Goela, Féral, Ferrera, Forster, Kurekin, Rastelli, Marinova, Miller, Moncheva, Newton, Pearman, Pitois, Reñé, Rodríguez-Ezpeleta, Saggiomo, Simis, Stefanova, Wilson, Lo Martire, Greco, Cochrane, Mangoni and Borja. This is an open-access article distributed under the terms of the Creative Commons Attribution License (CC BY). The use, distribution or reproduction in other forums is permitted, provided the original author(s) or licensor are credited and that the original publication in this journal is cited, in accordance with accepted academic practice. No use, distribution or reproduction is permitted which does not comply with these terms.
*Correspondence: Roberto Danovaro, r.danovaro@univpm.it
Laura Carugati, l.carugati@univpm.it
†These authors have contributed equally to this work.