Decadal Trends in Polycyclic Aromatic Hydrocarbon (PAH) Contamination Assessed by 1-Hydroxypyrene in Fish Bile Fluid in the Netherlands: Declining in Marine Waters but Still a Concern in Estuaries
 A. Dick Vethaak
 Paul K. Baggelaar3
 - 1Deltares, Marine and Coastal Systems, Delft, Netherlands
- 2Department of Chemistry and Biology, Institute for Environmental Studies, VU University Amsterdam, Amsterdam, Netherlands
- 3Icastat, Amstelveen, Netherlands
- 4Viaeterna, Rosmalen, Netherlands
- 5LaserLaB, Faculty of Sciences, VU University Amsterdam, Amsterdam, Netherlands
Long-term monitoring data on the concentrations of biliary 1-hydroxypyrene (1-OHPyr) in flatfish, as a biomarker for polycyclic aromatic hydrocarbon (PAH) exposure, were analyzed and evaluated to elucidate spatial differences and temporal trends in marine and estuarine PAH contamination in the Netherlands. Dab (Limanda limanda) and flounder (Platichthys flesus) with partly overlapping distributions were used as target species. In total 1831 bile samples were analyzed individually: 417 dab in 1998–2005 and 1438 flounder in 1996–2012. The sampling procedure for flatfish and the PAH metabolites determination by means of high performance liquid chromatography (HPLC) with fluorescence (FL) detection were based on international guidelines. Measuring the absorbance at 380 nm was tested to correct for possible differences in feeding status, but this turned out not to be a suitable parameter for the standardization of PAH metabolite concentrations. Both fish species showed statistically significant differences in biliary 1-OHPyr concentrations between various locations. The highest level of PAH contamination was found in flounder from the estuarine Western Scheldt, which might be partly due to local dredging activities. Dab from the central North Sea (Dogger Bank) showed the lowest level of PAH contamination. Analysis of all the data indicated mainly downward trends in PAH contamination, most clearly pronounced in the Dutch Wadden Sea. PAH exposure levels in the Dutch coastal waters including the Eastern Scheldt and the Wadden Sea, and also at the offshore North Sea monitoring sites represent levels of response that are not indicative of significant harm. In contrast, PAH contamination in the more industrialized Dutch estuaries (Western Scheldt and Ems-Dollard) is still a cause for concern. Future monitoring should register the total bile volume, the sex of the fish and the method of fishing to improve the interpretation of the data. In addition, the biliary absorbance at 380 nm should be registered as it may help the interpretation of outliers in the data.
Introduction
Polycyclic aromatic hydrocarbons (PAHs) comprise a large and heterogeneous group of organic contaminants that are formed and emitted as a result of the incomplete combustion of organic material such as coal, oil, and wood (OSPAR, 2001). Oil spills are another possible source of PAH contamination. PAHs represent a widespread class of environmental chemical pollutants and are ubiquitous in rivers, estuaries, and the marine environment. PAHs are hydrocarbons composed of two or more fused aromatic (benzene-like) rings. The toxicological significance of PAHs depends on their bioavailability and metabolic fate. Many PAH compounds and the intermediates that emerge during metabolic degradation exhibit toxic properties (e.g., narcosis, phototoxicity, immunotoxicity, teratogenicity, and carcinogenicity) and can cause a wide range of adverse health effects in fish, invertebrates, and other marine life (e.g., Peterson et al., 2003). Adverse effects on these organisms include the formation of liver tumors (e.g., in North Sea flatfish flounder and dab; Vethaak et al., 1996, 2009; Myers et al., 2003), impairment of reproduction (reviewed by Nicolas, 1999; Rocha Monteiro et al., 2000), embryonic deformities (Carls et al., 2008), and immune modulation (e.g., Reynaud and Deschaux, 2006). Consequently, PAHs constitute a major threat to marine life and are therefore included in the list of chemicals for priority action by the Oslo Paris Convention for the protection of the marine environment of the NorthEast Atlantic (OSPAR, 2001).
For monitoring purposes, the analysis of PAH accumulation levels in vertebrate tissues, such as fish is usually not appropriate due to rapid transformation (hydroxylation and subsequent conjugation) into more polar and excretable forms that can be eliminated from the organism, predominantly via the bile (Meador et al., 1995). However, the concentration of PAH metabolites in the bile fluid of fish can be used as an indirect indicator of recent exposure to PAH contamination. The analysis of this PAH exposure biomarker has several advantages compared to the analysis of body burdens of (unmetabolized) parent PAHs or determining environmental PAH levels in the water or sediment: Firstly, the analysis of only parent compounds might result in underestimation of total PAH exposure (Jørgensen et al., 2008). Secondly, PAH metabolite detection represents a quantification of the flux of PAHs through the fish's body. Fish generally show very efficient metabolic excretion of most PAHs, and it has been demonstrated that most of the PAHs will be excreted 2–8 d following exposure. This means that the PAH metabolites determined in the bile will represent exposures on the scale of days and in the region where the fish were caught (Ariese et al., 1993; Hylland et al., 2012). Thirdly, bile analysis of PAH metabolites provides insight into the actual absorption, integrated over all uptake routes, and taking into account bioavailability (Ariese et al., 1993; Hylland et al., 2012). From a toxicological point of view, this information is more relevant for estimating the actual chemical stress due to PAH exposure than the body burdens in tissues.
PAHs can enter the body of the fish via various routes: gastro-intestinal uptake from water, suspended particulate matter or food, uptake through the gills, or probably dermal contact with sediment (see Ariese et al., 1997; Beyer et al., 2010). Upon uptake, these PAHs will enter the bloodstream, and the largest fraction will be metabolized by the liver and temporarily stored in the gall bladder. Over time, metabolite concentrations in bile will increase. Upon feeding, the gall bladder will be emptied into the gut and fills up again with clear liquid, which means that shortly after feeding the bile fluid will be less concentrated and metabolite measurements will yield very low readings. As long as the fish does not feed and the PAH uptake continues the metabolite content in the bile fluid will increase (Collier and Varanasi, 1991; Ariese et al., 1993). Fish bile typically shows a deep green color, due to the accumulation in time of biliverdin (biliary pigment formed by catabolism of hemoglobin; e.g., Ariese et al., 1997). Hence, the feeding status of fish has been shown to influence both the volume and the density of the bile (Collier and Varanasi, 1991). This effect may lead to a strong bias, for instance when comparing fish caught with fyke nets (starved for some days) with fish caught with a trawl net (which may have fed just recently). Therefore, we have tested whether it would be useful to standardize the metabolite concentrations of PAH by using the biliverdin content, indicated by the bile absorbance at 380 nm (Ariese et al., 1997).
Since its first application in the 1980s (Krahn et al., 1987), the analysis of PAH metabolites in fish bile, as a biomarker for PAH exposure, has become increasingly popular for use in field studies and environmental monitoring. PAH metabolites as biomarker has been determined in a variety of marine, estuarine and fresh water fish species, such as English sole (Collier and Varanasi, 1991), plaice (Richardson et al., 2004), flounder (Ariese et al., 1993; Beyer et al., 1996; Eggens et al., 1996; Kopecka et al., 2006; Vethaak et al., 2011), dab (Kammann, 2007; Vethaak et al., 2009), Atlantic cod (Beyer et al., 1996; Aas et al., 2000), Atlantic hagfish (Sundt et al., 2011), feral finfish (Hellou et al., 2006), eelpout (Tairova et al., 2012), brown bullhead (Yang and Baumann, 2006), trout (Escartín and Porte, 1999a), eel (Van der Oost et al., 1994; Ruddock et al., 2003; Gorbi and Regoli, 2004; Nagel et al., 2012; Kammann et al., 2014), and red mullet (Escartin and Porte, 1999b; Martínez-Gómez et al., 2013). The concentration of PAH metabolites in the bile fluid with dab and flounder as target species has become part of international monitoring programmes, such as the OSPAR Joint Assessment and Monitoring Programme (JAMP) (OSPAR Agreement 2008–09; Technical Annex 2: PAH-specific biological effects monitoring; OSPAR, 2008). In the Dutch JAMP monitoring programme, the concentration of PAH metabolites in the bile of flatfish is monitored since the late 1990s, together with residue-contaminant measurements, the registration of fish diseases (regularly) and supporting biological and hydrographical data (Bovenlander and Langenberg, 2006). The marker metabolite 1-hydroxypyrene (1-OHPyr), the major metabolite of the PAH compound pyrene, has commonly been used as a relative measure of total PAH uptake because of its relatively high concentration and prevalence in bile and its relative ease of measurement (Ariese et al., 1993, 2005; Beyer et al., 2010).
The aim of the present study was (1) to assess the data on biliary 1-OHPyr in fish collected from 1998 to 2012 in the frame work of the Dutch MWTL (Monitoring Waterstaatkundige Toestand des Lands) monitoring programme; (2) to test the suitability of using the bile pigment biliverdin (measurement of the absorbance at 380 nm) for standardizing metabolite concentrations to feeding status; and (3) to elucidate spatial differences and temporal trends. Pre-monitoring data of biliary PAH concentrations in flounder from the Dutch coast and polluted harbors collected in 1996 are also included for comparison.
Methods
Target Species and Sampling Sites
Bile samples from dab (Limanda limanda) were collected at five offshore and coastal sites and from flounder (Platichthys flesus) at five coastal and estuarine sites (Figure 1). The two fish species are complementary in their distribution: flounder is a common species in coastal waters and estuaries (Vethaak and Jol, 1996), whereas dab is a major species widely distributed in the North Sea (Rijnsdorp et al., 1992). Fish may migrate at the time scale of PAH uptake and metabolism (days), so the 1-OHPyr levels will reflect an average for fish in the area where they were caught.
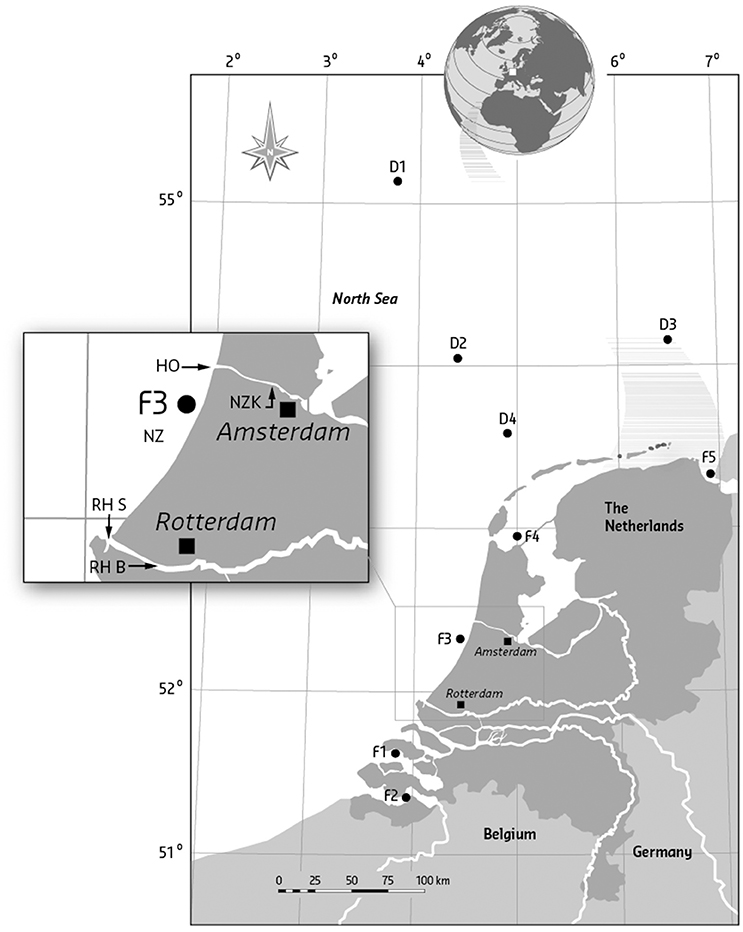
Figure 1. Codes and geographical positions of sampling locations of flounder (F) and dab (D). F1, Eastern Scheldt, Hammen; F2, Western Scheldt, Middelgat/Molenplaat/ Bath/Saaftinge; F3, North Sea coast, between IJmuiden and Scheveningen; F4, Waddenzee, between Wierbalg and Breezanddijk; F5, Ems-Dollard, Bocht van Watum; Dab were sampled at the open North Sea: D1, Doggerbank; D2, ca. 150 km NW of Terschelling; D3, ca. 70 km N of Borkum; D4, ca. 60 km NW of Terschelling; D5, ca. 90 km W. of Callantsoog. The box shows the position of the additional sampling sites from the 1996 survey: RHS, Rotterdam harbor Splitsingsdam; RHB, Rotterdam harbor Botlek; HO, IJmuiden, near Hoogovens steel factory outside the sluices; and NZK, North Sea Canal, Amerika harbor.
Fishing Operation and Sampling Procedure
Annual surveys were carried out from 1998 to 2006. In the period 2006 to 2012, the sampling of dab ceased and the number of sampling sites and sampling rate for flounder was reduced, essentially because of financial constraints. The sampling procedure for dab and flounder was largely based on guidelines by the International Council for Exploration of the Sea (ICES) and OSPAR (Ariese et al., 2005; Davies and Vethaak, 2012). Some variation in PAH metabolites in bile appears to be related to sex and size (Kammann, 2007; Hylland et al., 2012). Therefore, these factors were accounted for in the sampling design.
Dab were caught in March, during their spawning migration period (January–April; Rijnsdorp et al., 1992) and flounder in September, at the end of their non-migratory pre-spawning phase (Vethaak and Jol, 1996). Dab were caught by the research vessel RV Tridens by means of a 6-m beam trawl. Two or more 15-min hauls were made along different trajectories through the center of the fixed coordinates of each station. After each haul, the fish were sorted into three length classes (15–19, 20–24, and >25 cm). Flounder were caught by use of smaller research vessels and occasionally commercial trawlers. An exception is the Western Scheldt (F2) where standing nets were used in 2005, 2006, 2007, and 2008. Sampling procedures were the same as those for dab, the only difference being that different target length groups were used (20–24, 25–29, and >30 cm). Bile was collected from the same 15 female fish used for chemical analysis, and from an additional 15 males from the middle length class sampled in 1998–2012.
Fish were killed with an overdose of MS222 (ethyl 3-amino benzoate methanesulfonate, Sigma-Aldrich, Steinheim, Germany). Bile samples were collected by piercing the exposed gall bladder with a 1-ml syringe and emptying it in microcentrifuge tubes. Bile samples of typically 0.1–1 ml were immediately frozen and stored at −80°C until analysis in the laboratory. Samples from different individuals were analyzed separately.
Additional data on bile metabolites in flounder in 1996 were obtained from Ariese et al. (1997) and Vethaak et al. (2002). These flounders were caught in 1996 along the Dutch coast using a commercial fish trawler, or in polluted harbor areas of the port of Amsterdam [IJmuiden near an industrial steel works site (HO) and Amerikahaven in the North Sea Canal (NZK)], and in the harbor of Rotterdam (RHS, RHB) using fyke nets. Samples collected in 1996 from the Wadden Sea (F4), Eastern Scheldt (F1), and Ems-Dollard (F5) were collected by means of a beam trawl and each sample relates to pooled bile samples of 3 individual fish (see also Table S1).
The data used in this study derived from a data bank for which fish samples were collected in framework of a national monitoring program as part of a larger integrated program. The fish sampling procedures and protocols have been approved since 2003 by the ethical committee for animal welfare in experiments of the National Institute for Coastal and Marine Management (RIKZ) and comply with Dutch laws.
Determination of 1-OH Pyrene
To assess the PAH exposure of fish, 1-OHPyr was determined in bile samples after enzymatic hydrolysis by means of high performance liquid chromatography (HPLC) with fluorescence (FL) detection (as described in detail in RWS protocol Code: A5.217; see also Ariese et al., 1997, 2005 and for review, Beyer et al., 2010). Bile samples were thawed and two subsamples were taken. For the determination of 1-OHPyr under standard conditions a minimum of 20 μL bile volume is required. One sub-sample was incubated with β-glucuronidase/arylsulfatase, then the reaction was stopped with ethanol and the sample centrifuged. The levels of 1-OHPyr in the supernatant was directly analyzed by means of reversed-phase HPLC-FL using a standard solution for external calibration. The second sub-sample of bile, diluted 1:100 with demineralized water/ethanol 50:50, was used for the measurement of the absorbance at 380 nm (mostly due to biliverdin). The HPLC-FL method showed excellent sensitivity: 1-OHPyr could be detected at the 0.4 ng/ml level, which will be amply sufficient for monitoring studies in the Dutch marine environment. In 9% of the cases, there was insufficient volume of bile to perform the analysis or the analysis of the bile sample did not perform well with HPLC. These measurements were indicated as “missing values.”
Originally a different technique, synchronous fluorescence spectrometry (SFS) was used to determine the concentrations of PAH metabolites in the bile samples of flounder from 1996 to 1999 (historical data used for comparison, see Table S1). The SFS method is a more rapid and simple method for the determination of 1-OHPyr in non-hydrolyzed fish bile samples but produces similar results as the HPLC/FL method; the numbers may be compared directly provided the differences in detection sensitivity between 1-OHPyr and conjugated 1-OHPyr (predominantly pyrene-1-glucuronide) are properly corrected for (Ariese et al., 1993, 1997, 2005; Beyer et al., 2010).
Statistical Methods
Data Sources
In this study, we analyzed and evaluated the available monitoring data of 1-OHPyr in flounder and dab from Dutch estuarine, coastal, and offshore marine waters from 1998 to 2012 contained in the DONAR data base. In addition, we used historical data from various field surveys carried out in 1996 and 1999 as tabulated in Ariese et al. (1997) and Vethaak et al. (2002), respectively.
Statistical Implications of the Sampling Design
For each combination of location and year about 30 (15 males and 15 females) fish were sampled, at each site on 1 day only. This is a two-stage sampling design at each location. The variation in the results of 1 day sampling can underestimate the variation over a longer time period, because it does not contain any information about the within-year temporal variation. For flounder in the Dutch Wadden Sea, a seasonal variation of the concentration of 1-OHPyr in the bile has been reported (Eggens et al., 1996), and significant differences in the 1-OHPyr levels were found between summer and winter for dab and flounder caught in the North Sea and Baltic Sea (Kammann, 2007). Because of this within-year temporal variation, the 30 results of the same day should be regarded as pseudo-replicates if used to estimate the situation over longer periods. They will probably all show the same bias and therefore will not be independent results. If such results are used in a statistical analysis as if they were true replicates, the analysis will lead to underestimation of the variation and therefore underestimation of the p-value. This will result in confidence intervals that are too narrow and an inflated risk of a Type I error (falsely rejecting a true null hypothesis). Given these data limitations, the conclusions of our statistical analyses must be restricted to the specific sampling month (March for dab and September for flounder) and cannot be extended toward the rest of the year. Furthermore, we statistically analyzed the data with the following two approaches: (1) using only the median result for each combination of location and sampled year and (2) using all results for each combination of location and sampling year. The first approach (using the median) prevents inflation of the risk of a Type I error, but in doing so considerable statistical power is lost. No power is lost with the second approach (using all results), but it will result in inflation of the risk of a Type I error if the variation between days in the specific sampling month is larger than the variation within days. As no information is available on the variation between days in the sampling month, we will consider the results of both approaches, bearing in mind their limitations.
Standardization with Absorbance at 380 nm
In order to correct for the differences in bile accumulation levels due to feeding status, standardization of the 1-OHPyr concentrations with biliary absorbance at 380 nm (as a measure of biliverdin) was evaluated. When Abs 380 is a missing value (3% of the cases), 1-OHPyr concentrations in the bile cannot be standardized (i.e., divided by Abs380) and are left out of the analysis of standardized data.
Outliers
The existence of extreme values in the data limits the possibilities of detecting differences between sampling locations and trends on these locations. Standardization by dividing the 1-OHPyr by the Abs380 of the bile could adjust for the age of the bile. However, standardization with very low Abs380 levels, measured in bile from bladders that were emptied shortly before, results in extremely high 1-OHPyr concentrations that are not representative of the pollution of the marine environment. The effect is that the evaluation of actual differences between sampling locations and trends on these locations is affected by the sensitivity of the measurements to the age of the bile. When this leads to data sets that do not follow a normal distribution, not even after transformation, parametric tests, such as analysis of variance or regression analysis cannot be applied. However, in these cases non-parametric tests can be used, because they are less affected by outliers and have more power than parametric tests in case of non-normality.
Statistical Testing on Differences between Locations
It is not useful to combine the data from dab and flounder locations because of possible seasonal variation in the concentration of biliary 1-OHPyr of dab (caught in March) and flounder (caught in September) as reported by Eggens et al. (1996) and Kammann (2007). The data sets for flounder and dab were therefore analyzed separately. To test on a difference in the concentrations of 1-OHPyr in fish bile between locations, two-way analysis of variance (ANOVA) was applied, with location and year as factors. As explained above, the testing was first done with the annual medians of the results and then with all the results. In this second ANOVA also the interaction between location and year could be tested, as replicates were available for each combination of location and year. To reduce the skewness, the input was rank transformed before analysis. An important advantage of this non-parametric approach is that it is robust against outliers, without much loss of power (Helsel and Hirsch, 1991). And in case of non-normality it will provide more power than an analysis of variance on the untransformed data. Testing was performed with a confidence level of 95% (significance level of 5%). However, for none of the applied ANOVAs the assumption of homogeneity of variances of groups was met (according to Levene's test). Combined with the fact that all analyzed designs were more or less unbalanced, this may have compromised the type I error level. Therefore, test results were also compared to those of testing with a confidence level of 99% (significance level of 1%). If the effect of location was statistically significant according to the ANOVA F-test, multiple comparisons with Tukey's correction were applied to assess which locations differed. Only locations with data from at least three sampled years were included in this analysis, because if group sizes differ too much, the Type I error level is less guaranteed. Care should be taken in interpreting the ANOVA results, because not all the underlying assumptions were met and this may affect the extent to which they may be generalized. The ANOVA was performed with the GLM function of IBM SPSS Statistics 21.
Temporal Trend Analysis
Trend analysis consists of trend detection and trend estimation. The trend analysis was applied using non-parametric methods, because in general the distributions of 1-OHPyr showed positive skewness and also various outliers occurred. Different studies have shown that non-parametric tests have substantially more power than parametric tests if the distributional assumptions of the parametric test are not valid (Bradley, 1968; Helsel and Hirsch, 1988, 1991). Even with small deviations from normality, non-parametric tests outperform parametric tests (Hirsch et al., 1991; Önöz and Bayazit, 2003), so their use in environmental studies is highly recommended (Gilbert, 1987). Trends were tested with the Mann–Kendall test (Kendall, 1938, 1975; Mann, 1945), with a two-sided confidence level of 95%. The trend slope was estimated as the Theil–Sen slope (Theil, 1950; Sen, 1968). This is a non-parametric slope estimator that is unbiased and has more precision than the linear regression slope if the values come from a skewed distribution. Only locations with data from at least five sampled years were included in this analysis. The trend analyses were performed with R, version 2.15.3, using the packages Kendall and zyp (R Core Team, 2013).
Results and Discussion
Data Summary and General Observations
A summary of numbers of fish (dab and flounder) caught and bile samples analyzed per sampling location per year is given in Table S1. In total 1855 bile samples were analyzed for 1-OHPyr levels: 417 bile samples of dab caught from 1998 to 2005 and 1438 bile samples of flounder caught from 1996 to 2012. The influence of the size of the fish within the selected length class is negligible: larger specimens would ingest and metabolize more PAH molecules from water, ingested sediment particles and food, but they would also have larger gall bladders, so the metabolite concentrations are not expected to be different. In the Dutch monitoring programme 15 males: 15 females were sampled at each site in order to minimize the effect of sex, if any, on the PAH metabolite concentrations. Unfortunately, the sex data of the fish was not included in the data set; and thus did not allow us to test the influence of this factor on our results. The sex of flounders (35 males and 37 females) from a subset of monitoring sampling sites in 2006 (the data were published in Schipper et al., 2009) did not significantly influence the concentration of 1-OHPyr in bile (t-test, n = 72, p = 0.25). Other studies also found no significant influence of sex on PAH metabolite concentrations in both dab (Dévier et al., 2013) and flounder (Kammann, 2007). However, the variability within the dataset may increase by combining male and female data, because some authors reported higher PAH metabolite concentrations in males than in females from several fish species including flounder (Vuorinen et al., 2006; Kammann, 2007). The possible influence of fish sex is probably minor if any compared to that of feeding status.
Mean 1-OHPyr concentrations per location per year (raw data, that is, without standardization to Abs380) are listed in Table S2. In order to shed light on the spatial distribution and to allow comparison with historic data, all data have been presented including those from several locations were fish were sampled at only few time points.
Lowest mean concentrations per location were determined in dab caught off-shore the Dutch coast (D1 in 2001; 17 ng/ml). The concentration of 1-OHPyr in dab decreases with increasing distance from the shore with lowest concentrations at locations D1, D5. Among the regular monitoring sites, the highest mean concentrations were determined in flounder from the Western Scheldt (F2 in 2007; 2416 ng/ml), with clearly lower levels at the four other flounder locations. However, by far the highest 1-OHPyr concentrations were found at the four industrialized locations that were sampled in 1996 and 1999.
The main statistics of the 10log transformed 1-OHPyr data per location are shown in Figure 2 (for data per year see Figure S1, upper graph). As is common for positively skewed data, after log-transformation the mean in most cases approaches the median, except for location HO (most likely due to the low number of samples on this location).
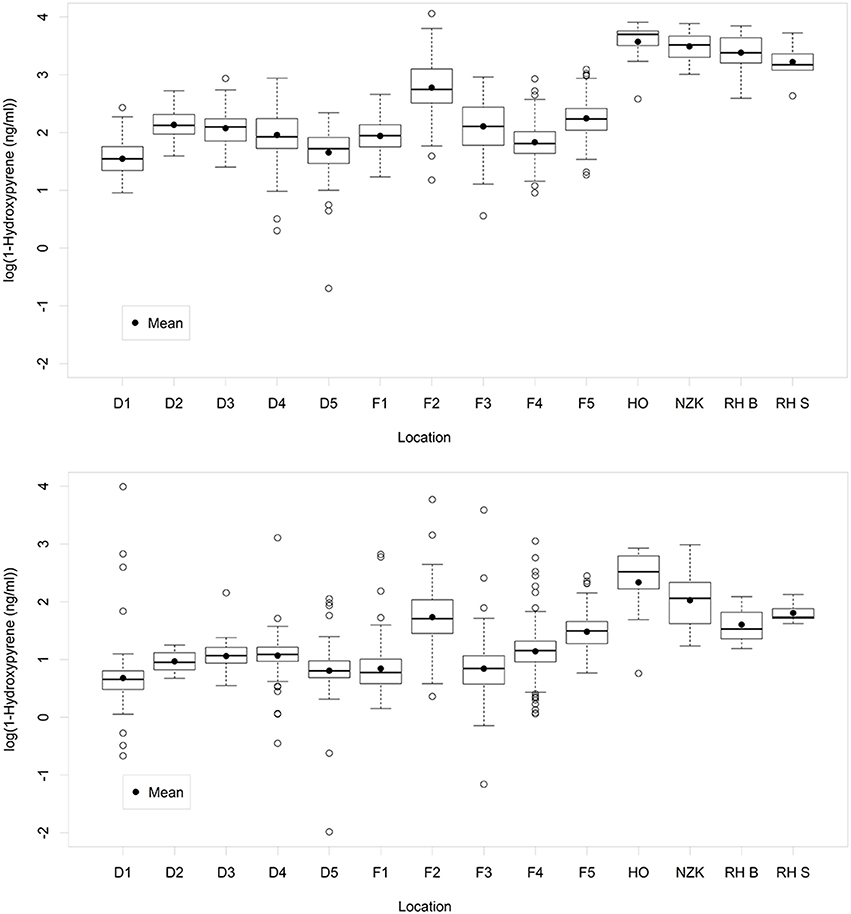
Figure 2. Boxplots of the variation of 1-OH-pyrene (log transformed concentration) per sampling location: Upper graph: original data. Lower graph: standardized data. A box represents the IQR-range between the 25th and the 75th percentile, with the median as a line in the box. The vertical lines represent data within the ±1.58 IQR/sqrt(n), where n = number of data. Open circles outside the range of the whiskers represent individual data.
Effect of Standardization of the Data with Absorbance at 380 nm
The general effect of standardization on the data is a lowering of the 1-OHPyr concentration (when Abs380 ≥ 1) and in only a few cases (2%) the effect is an increase in the numerical values (Figure S2). These increases are limited to a 10-fold increase (when Abs380 = 0.1) in the majority of cases. More importantly, however, standardization would be expected to reduce the variability within each location and sampling year, and therefore the spread in the y-dimension should be narrower than that in the x-dimension (see Figure S2). However, visual inspection shows that that is not the case for the date grouped per location, and also not per location per sampling year (not shown). In fact, standardization increases the number of high extremes by means of over-correction.
Moreover, the absorption spectra of the bile samples suggest that the Abs380 levels may not always act as a reliable measure for total bile pigment. The mean Abs380 values are much higher in the more PAH polluted sites than in the less polluted ones, which would not be expected if the Abs380 reading would only measure endogenous breakdown products. In principle, this could point at a starvation effect in fish caught by standing net in the Western Scheldt from 2005 to 2008 or fyke nets in the industrialized sites in 1996 and 1998, which would justify standardization of the raw data. However, it could also indicate that in such highly turbid waters the fish might have absorbed much more suspended organic materials that will contribute to the bile density and color. This would lead to an overcorrection of the data, resulting in dampening of differences, as indicated by the statistical analysis (Figure 2). In addition, the relative ratio of Abs380/455/655 should be approximately constant if they represent the main degradation products of heme. However, in the more polluted areas such as the Western Scheldt the ratio is different, with the Abs380 being extra high as compared to the other wavelengths (data not shown).
Previous studies advocated the use of the bile pigment biliverdin (indicated by Abs380) or biliary protein as a means of normalizing biliary OH-PAH metabolite concentrations to feeding status (Aas et al., 2000; Ruddock et al., 2003). For example, biliverdin was identified as a suitable parameter for the standardization of 1-OH pyrene and other PAH metabolites (measured by HPLC-FL) in bile samples from flounder and dab from the North Sea and Baltic Sea (Kammann, 2007). However, several authors have reported that when the concentrations of proteins were used to normalize residues of OH-PAH metabolites, the observed variability in the concentrations did not differ strongly from data expressed without normalization (Escartin and Porte, 1999b; Richardson et al., 2004; Vuorinen et al., 2006). Experimental work has confirmed that changes in feeding status over a 24-h period did not appear to be a significant confounding factor in PAH bile concentrations (Richardson et al., 2004).
In the Dutch monitoring programme, fish samples were in almost all cases obtained from beam trawling. Exceptions were the Western Scheldt (F2) in the period 2005–2008 where standing nets were used due to lack of commercial trawling activities at this site, and the industrialized sites (HO, NZK, RHS, RHB) where catches (in 1996 and 1999) could only be obtained from fyke fisheries (see Table S1). Fish derived from standing nets may have been starved for maximal 12 h and for fish from fyke nets this may be extended to several days. Considering the analysis of the data, a possible confounding effect on bile concentrations cannot be fully explained by the use of a different fishery gear. Flounder from the Western Scheldt exhibited also high 1-OHPyr concentrations in 2009 and 2010 when a beam trawl (instead of a standing net) was used (Tables S1, S2). However, a confounding effect of starvation on the results cannot be completely ruled out. Caution is advised when comparing the results from location F2 from 2005 to 2008 and from the historical sites with other years at this site and with the other flounder sampling locations.
The present study provides a number of arguments why Abs380 is not a suitable parameter for the standardization of 1-OHPyr levels in the bile of fish, and in this work we will therefore focus on the raw, non-standardized data. However, it still can be helpful in the interpretation of the results, for example to determine the lightest and darkest (non-representative) outliers and should therefore be reported as supporting data.
Results of Testing Differences between Locations
ANOVA Using Annual Medians
For the flounder locations, the analysis of variance of the rank transformed annual medians of 1-OHPyr in fish bile resulted in a statistically significant effect of sampling location (locations with small numbers of sampling years and samples are left out of the comparison; Table S3). For the dab locations however, the effect of location was not statistically significant for the raw data in the analysis of variance, so no multiple comparisons were performed for these data (Table S3).
The flounder location F2 (Western Scheldt) is statistically significantly different from the other four flounder locations and has the highest concentration of 1-OHPyr among all sampling locations used in this analysis. However, its concentration is still lower than at the four industrialized locations that were sampled in 1996 and 1999.
ANOVA Using All the Data
In both species the analysis of variance of the rank transformed results of 1-OHPyr in fish bile resulted in statistically significant effects of location and year and also of their interaction (Table S4).
It was found that when all the data are used, all comparisons indicate statistically significant differences between locations, with a p < 1% (Table S4). D4 has statistically significant higher concentrations than the other two dab locations. And D1 has statistically significant lower concentrations than the other two. Flounder location F2 has statistically significant higher concentrations than the other flounder locations. Location F4 has statistically significant lower concentrations than the other four. However, as explained above, some care should be taken when interpreting the results of the analyses of variance that use all the data.
Results of Trend Analysis
The results of the trend analysis are summarized in Table 1. The trend analysis of the annual medians resulted in only one statistically significant trends: a downward trend at location F4.
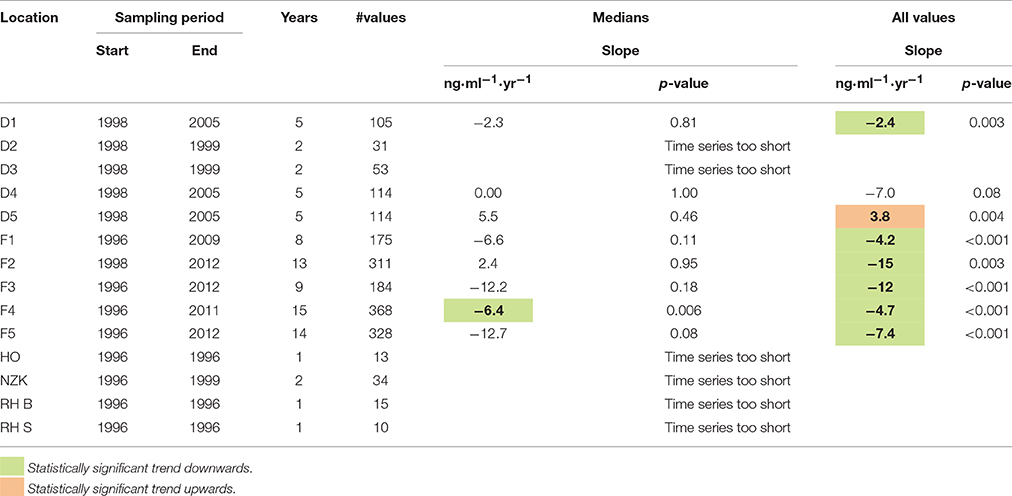
Table 1. Estimated trend slopes of 1-OH-pyrene in fish bile (ng.ml−1.yr−1) and corresponding p-values.
The trend analysis of all data mainly shows downward trends, as illustrated for dab in Figure 3 and for flounder in Figure 4. As explained before, some care should be taken using and interpreting the results of the trend analyses that use all the data.
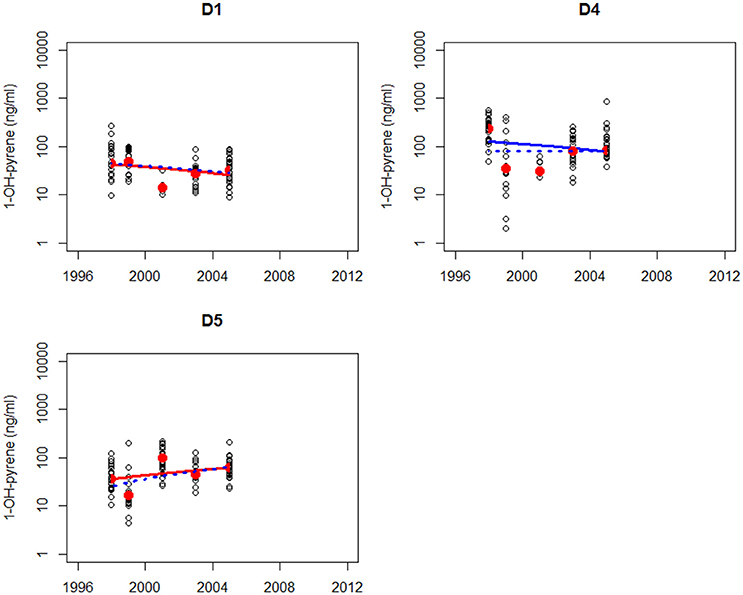
Figure 3. Non-parametric trend analysis of annual medians (red dots) of 1-OH-pyrene in bile fluid of dab on site D1, D4, and D5 (off-shore in the North Sea). Trend line shown is the Theil-Sen slope (solid line is based on all results and dotted line is based on annual medians). A statistically significant trend is indicated with a red line, otherwise the line is blue.
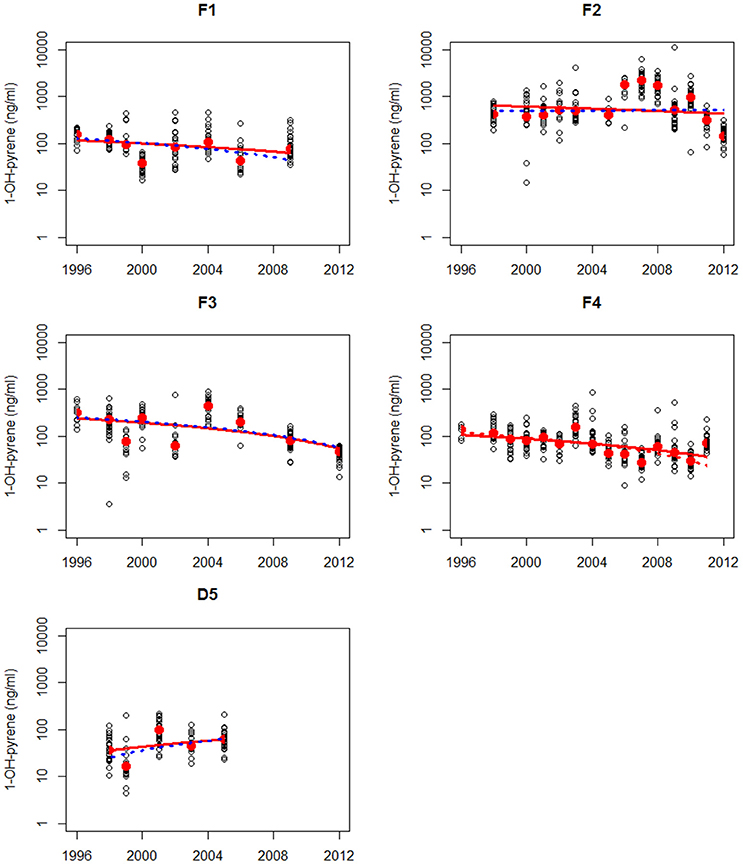
Figure 4. Non-parametric trend analysis of annual medians (red dots) of 1-OH-pyrene in bile fluid of flounder on site F1 (Eastern Scheldt), F2 (Western Scheldt), F3 NZ (North Sea coast), F4 (Wadden Sea), and F5 (Ems-Dollard). Trend line shown is the Theil-Sen slope (solid line is based on all results and dotted line is based on annual medians). A statistically significant trend is indicated with a red line, otherwise the line is blue.
Maintenance and deepening dredging works regularly occur in the Western Scheldt (F2) and this could have influenced the high levels of PAH contamination levels at the sampling site in this estuary. There is evidence that dredging processes might lead to PAH mobilization into the water column and hence significantly increase the bioavailability of PAH to organisms such as fish (Eggleton and Thomas, 2004). Therefore, release of historical PAH contamination from buried sediment through (upstream) dredging operations may also have contributed to the observed high levels without a clear downward trend at the sampling site in the Western Scheldt in 2006–2010. Much higher mud disposal volumes near this site (F2) and upstream in the lower Scheldt River were reported for this period (Depreiter et al., 2015).
Assessment of Monitoring Data for PAH Impact
The data on 1-OHPyr concentrations in flounder and dab can be interpreted against assessment thresholds for biological effects measurements, recommended by ICES and OSPAR: thresholds between background and elevated but acceptable levels (background assessment concentration, BAC), and between acceptable and unacceptable levels (environmental assessment concentration, EAC; Davies and Vethaak, 2012). Threshold values indicative of significant harm (EAC) are not (yet) set for flounder and dab. However, with some caution the EAC for 1-OHPyr of 745 ng/ml set for halibut (Hylland et al., 2012) could be used. Furthermore, in a 3-year mesocosm study with flounder exposed to contaminated harbor dredging, levels of 1-OHPyr of 510–1030 ng/ml coincided with DNA damage and the development of liver tumors and associated lesions (Vethaak et al., 1996) and alternatively this threshold level could be used. In this case also possible additive effects due to mixture toxicity of PAHs and other toxic contaminants have been accounted for. Comparison of our monitoring data with these threshold values (Table 2) show that in general only 9.6% of the individual dab values from 1998 to 2005 and 0.6% of the individual flounder values from 1996 to 2012 are below BAC for 1-OHPyr (for both species 16 ng/ml). 9.3% of individual flounder and 0.3% of individual dab exceeded the EAC threshold for halibut. The corresponding percentages for flounder and dab for the lower provisional threshold of PAH effects of 510 ng/ml are 15.6 and 0.6%, respectively. By far most of the individual bile values fall between BAC and EAC and exhibit elevated response levels. Comparison of our recent flounder monitoring data (last 5 years) with data from the whole period (1996–2012) shows a decreased risk of PAH contamination at most locations over time with the exception of location F2 that seems to show an increased risk. The assessment of the monitoring data indicates that the PAH contamination in the estuarine sites Western Scheldt (F2) and the Ems-Dollard (F5) are still a high cause for concern. In contrast, PAH exposure levels in the Dutch coastal waters (F3), Eastern Scheldt (F1) and Wadden Sea (F4), and also at the offshore North Sea monitoring sites probably will not cause adverse health effects in flatfish. There are no recent data on the severely polluted industrialized sites that were sampled in 1996 and 1999.
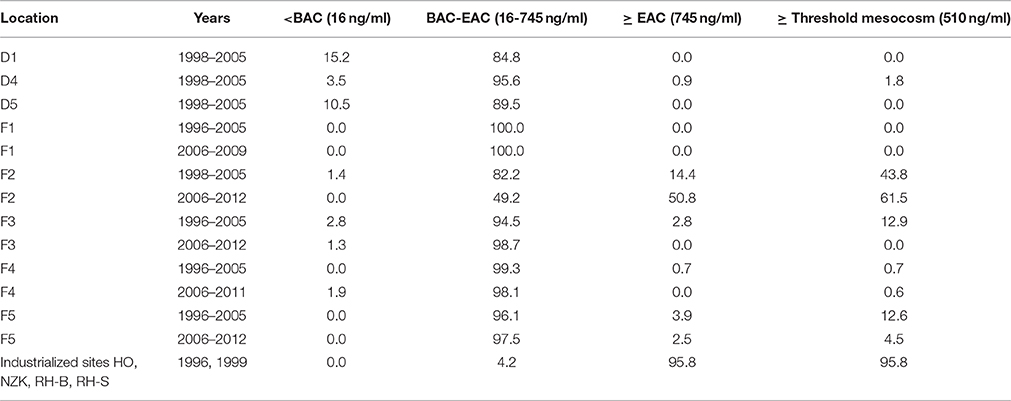
Table 2. Percentages of samples at the dab and flounder locations showing concentrations of 1-OH pyrene below/above Background Assessment Concentration; BAC (16 ng/ml for dab and flounder), Environmental Assessment Concentrations (EAC) for halibut (745 ng/ml) (Hylland et al., 2012) and PAH threshold levels derived from a mesocosm study (Vethaak et al., 1996).
Comparison with Other Studies
The concentrations of 1-OHPyr in flounder and dab from Dutch waters compare well with those reported for these species in Dutch waters and elsewhere in the North Sea. Kammann (2007) reported 1-OHPyr concentrations (measured by HPLC-FL) in individual fish from < 0.7 to 838 ng/ml in bile of dab and 18 to 200 ng/ml in bile of flounder caught between 1997 and 2004 in the North Sea and Baltic Sea. In the North Sea, highest mean values (n = 20) per station of 1-OHPyr were determined in dab from the German Bight (159 ng/ml) with lower values found in offshore regions. Mean levels of 1-OHPyr in flounder bile in the Baltic Sea ranged between 54 and 92 ng/ml (Kammann, 2007).
Bile metabolite data (measured by HPLC-FL) provided by the international workshop on Integrated Assessment of Contaminants Impacts on the North Sea (ICON), carried out in the autumn of 2008, showed lowest mean levels of 1-OHPyr in flounder from Icelandic waters (18.4 ng/ml). Highest mean levels of 1-OHPyr were found in flounder from the Seine estuary (France) and the Alde river (UK), respectively 316.5 and 373.2 ng/ml. Dab from the North Sea showed mean levels ranging from 7.6 (Iceland) to 345.4 ng/ml in the Seine estuary (Kammann et al., in press). The ICON workshop also included the Dutch flounder sampling location (F4), which showed mean values of 77.0 (min 44.5–max 148.4 ng/ml) (Kammann et al., in press). These values match with the mean values (75.4 ng/ml) independently measured in the present study.
Concentrations between 50 and 500 ng/ml 1-OHPyr (measured by SFS) in flounder from the Dutch Wadden Sea from 1989 to 1993 reported by Eggens et al. (1996) are in agreement with the results found in the present study (32–295 ng/ml in 1996–1999, measured by HPLC-FL).
It is clear that the highest values of 1-OHPyr were found in the more industrialized harbors in the Netherlands in 1996 and 1999. However, there are no recent data available for these sites. Van der Oost et al. (1994) reported highest 1-OHPyr bile concentrations of approximately 8000 ng/ml (measured by SFS) in eel (Anguilla anguilla) caught in 1991 from freshwater sites near Amsterdam. The mean level of 1-OHPyr in eel collected in 2011 from the river Rhine in Germany near the Dutch border was 3160 ng/ml (measured by HPLC-FL) (Kammann et al., 2014).
Conclusions
The results indicate that Abs380 is not a suitable parameter for the standardization of PAH metabolite concentrations to feeding status in field samples. Standardization with Abs380 did not result in a lower variability among the values per location/sampling year, and often an increase in spread was observed. For the temporal trends at a certain location, standardization led to a dampening or sign reversal of many slopes. Moreover, the data suggest that the bile absorbance may be influenced by turbidity of the water and is therefore not always a reliable measure of bile pigment concentration.
The analysis indicated that PAH exposure and contamination in dab was lower in the central North Sea (Dogger Bank) than that at the more coastal North Sea locations (D4 and D5). Among the flounder locations, the estuarine Western Scheldt (F2) exhibited the highest PAH exposure levels and the Dutch Wadden Sea the lowest. The high levels of PAH contamination in Western Scheldt estuary may have been partly due to local dredging activities in the period 2006–2010. The trend analyses of 1-OHPyr concentrations in both species mainly showed indications of downward trends, most clearly pronounced in the Dutch Wadden Sea.
PAH contamination in the Dutch estuaries (Western Scheldt and Ems-Dollard) is a cause for concern. In contrast, PAH exposure levels in the Dutch coastal waters including the Eastern Scheldt and Wadden Sea, and also at the offshore monitoring North Sea locations represent levels of response that are not indicative of significant harm. Dutch monitoring data agree well with previously published data from other regions in the North Sea.
We recommend to continue the monitoring of biliary PAH metabolites in flatfish in Dutch estuarine and marine waters. Most emphasis should be given to the estuarine locations and the severely polluted harbors where the PAH contamination is highest. It is advised that future monitoring should register the total bile volume, the sex of the fish and the method of fishing (e.g., fyke nets, standing nets, or beam trawl) to improve the interpretation of the data. Although not useful for standardization, the biliary absorbance at 380 nm should still be registered as it may help the interpretation of outliers in the data.
Author Contributions
AV: Project leader, manuscript preparation, data interpretation, field sampling. FA: Manuscript preparation, chemical analysis, data interpretation. PB and JV: Statistical analysis, data interpretation, manuscript preparation.
Conflict of Interest Statement
The authors declare that the research was conducted in the absence of any commercial or financial relationships that could be construed as a potential conflict of interest.
Acknowledgments
This work was commissioned by Andrea Houben of the Water, Traffic, and Environment Agency of Rijkswaterstaat of the Dutch Ministry of Infrastructure and the Environment and conducted under Deltares project KPP International nr 1207766.004. We thank Johan Jol for his assistance with the field work. Andrea Houben, Gerard Stroomberg, Marcel van der Weijden and Marga Bogaart of the Rijkswaterstaat Central Information Services provided data and additional information on the 1-OHPyr analysis.
Supplementary Material
The Supplementary Material for this article can be found online at: https://www.frontiersin.org/article/10.3389/fmars.2016.00215/full#supplementary-material
References
Aas, E., Beyer, J., and Goksoyr, A. (2000). Fixed wavelength fluorescence (FF) of bile as a monitoring tool for polyaromatic hydrocarbon exposure in fish: an evaluation of compound specificity, inner filter effect and signal interpretation. Biomarkers 5, 9–23. doi: 10.1080/135475000230505
Ariese, F., Beyer, J., Jonsson, G., Porte Visa, C., and Krahn, M. M. (2005). Review of Analytical Methods for Determining Metabolites of Polycyclic Aromatic Compounds (PACs) in Fish Bile. ICES Techniques in Marine Environmental Sciences, No. 39. Copenhagen: International Council for the Exploration of the Sea, 41.
Ariese, F., Burgers, I., Oudhoff, K., and Stroomberg, G. J. (1997). Evaluation of Analytical Procedures for the Analysis of PAH Metabolites in Fish Bile and Normalisation to Biliary Pigments and Biliary Protein. IVM Rapport R-97/9 in opdracht van het Rijksinstituut voor Kust en Zee/RIKZ.
Ariese, F., Kok, S. J., Verkaik, M., Gooijer, C., Velthorst, N. H., and Hofstraat, J. W. (1993). Synchronous fluorescence spectrometry of fish bile: a rapid screening method for the biomonitoring of PAH exposure. Aquat. Toxicol. 26, 273–286. doi: 10.1016/0166-445X(93)90034-X
Beyer, J., Jonsson, G., Porte, C., Krahn, M. M., and Ariese, F. (2010). Analytical methods for determining metabolites of polycyclic aromatic hydrocarbon (PAH) pollutants in fish bile: a review. Environ. Toxicol. Phar. 30, 224–244. doi: 10.1016/j.etap.2010.08.004
Beyer, J., Sandvik, M., Hylland, K., Fjeld, E., Egaas, E., Aas, E., et al. (1996). Contaminant accumulation and biomarker responses in flounder (Platichthys flesus L.) and Atlantic cod (Gadus morhua L.) exposed by caging to polluted sediments in Sorfjorden, Norway. Aquat. Toxicol. 36, 75–98. doi: 10.1016/S0166-445X(96)00798-9
Bovenlander, R. W., and Langenberg, V. T. (2006). National Evaluation Report of the Joint Assessment and Monitoring Programme of the Netherlands 2004. RIKZ Report, 2006.002. RWS/National Institute for Coastal and Marine Management, The Hague, 45.
Carls, M. G., Holland, L., Larsen, M., Collier, T. K., Scholz, N. L., and Incardona, J. P. (2008). Fish embryos are damaged by dissolved PAHs, not oil particles. Aquat. Toxicol. 88, 121–127. doi: 10.1016/j.aquatox.2008.03.014
Collier, T. K., and Varanasi, U. (1991). Hepatic activities of xenobiotic metabolizing enzymes and biliary levels of xenobiotics in English sole (Parophrys vetulus) exposed to environmental contaminants. Arch. Environ. Contam. Toxicol. 20, 462–473. doi: 10.1007/BF01065834
Davies, I. M., and Vethaak, A. D. (eds.). (2012). Integrated Marine Environmental Monitoring and their Effects. ICES Cooperative Research Report No. 315. 270.
Depreiter, D., Lanckriet, T., Van Holland, G., Vanlede, J., Beirinckx, K., and Maris, T. (2015). “Mud disposal and suspended sediment concentrations in the lower Sea Scheldt – towards a hyperturbid system?,” in E-proceedings of the 36th IAHR World Congress (The Hague), 38–52.
Dévier, M.-H., Le Dû-Lacoste, M., Akcha, F., Morin, B., Peluhet, L., Le Menach, K., et al. (2013). Biliary PAH metabolites, EROD activity and DNA damage in dab (Limanda limanda) from Seine Estuary (France). Environ. Sci. Pollut. Res. 20, 708–722. doi: 10.1007/s11356-012-1345-7
Eggens, M. L., Opperhuizen, A., and Boon, J. P. (1996). Temporal variation of CYP1A indices, PCB and 1-OH pyrene concentration in flounder, Platichthys flesus, from the Dutch Wadden Sea. Chemosphere 33, 1579–1596. doi: 10.1016/0045-6535(96)00277-9
Eggleton, J., and Thomas, K. V. (2004). A review of factors affecting the release and bioavailability of contaminants during sediment disturbance events. Environ. Int. 30, 973–980. doi: 10.1016/j.envint.2004.03.001
Escartín, E., and Porte, C. (1999a). Biomonitoring of PAH pollution in high-altitude mountain lakes through the analysis of fish bile. Environ. Sci. Technol. 33, 406–409. doi: 10.1021/es980798a
Escartin, E., and Porte, C. (1999b). Assessment of PAH pollution in coastal areas from the NW Mediterranean through the analysis of fish bile. Mar. Pollut. Bull. 38, 1200–1206. doi: 10.1016/S0025-326X(99)00162-9
Gilbert, R. O. (1987). Statistical Methods for Environmental Pollution Monitoring. New York, NY: Van Nostrand Reinhold.
Gorbi, S., and Regoli, F. (2004). Induction of cytochrome P4501A and biliary PAH metabolites in European eel (Anguilla anguilla): seasonal, dose-and time-response variability in field and laboratory conditions. Mar. Environ. Res. 58, 511–515. doi: 10.1016/j.marenvres.2004.03.038
Hellou, J., Leonard, J., Collier, T. K., and Ariese, F. (2006). Assessing PAH exposure in feral finfish from the Northwest Atlantic. Mar. Pollut. Bull. 52, 433–441. doi: 10.1016/j.marpolbul.2005.11.012
Helsel, D. R., and Hirsch, R. M. (1988). Applicability of the t-test for detecting trends in water quality variables. Water Resour. Bull. 24, 201–204. Discussion of paper by R. H. Montgomery and J. C. Loftis. doi: 10.1111/j.1752-1688.1988.tb00896.x
Helsel, D. R., and Hirsch, R. M. (1991). Statistical Methods in Water Resources. Studies in Environmental Science 49. Amsterdam: Elsevier.
Hirsch, R. M., Alexander, R. B., and Smith, R. A. (1991). Selection of methods for the detection and estimation of trends in water quality. Water Resour. Res. 27, 803–813. doi: 10.1029/91WR00259
Hylland, K., Vethaak, D., and Davies, I. M. (2012). “Background document: polycyclic aromatic hydrocarbon metabolites in fish bile,” in Integrated Marine Environmental Monitoring of Chemicals and Their Effects, ICES Cooperative Research Report No. 315, eds I. M. Davies and A. D. Vethaak (Copenhagen: International Council for Exploration of the Sea), 18–20.
Jørgensen, A., Giessing, A., Rasmussen, L. J., and Andersen, O. (2008). Biotransformation of polycyclic aromatic hydrocarbons in marine polychaetes. Mar. Environ. Res. 65, 171–186. doi: 10.1016/j.marenvres.2007.10.001
Kammann, U. (2007). PAH metabolites in bile fluids of dab (Limanda limanda) and flounder (Platichthys flesus) - spatial distribution and seasonal changes. Environ. Sci. Pollut. Res. 14, 102–108. doi: 10.1065/espr2006.05.308
Kammann, U., Akcha, F., Budzinski, H., Burgeot, T., Gubbins, M. J., and Lang, T. (in press). PAH metabolites in fish bile: from the seine estuary to Iceland. Mar. Environ. Res. doi: 10.1016/j.marenvres.2016.02.014
Kammann, U., Brinkmann, M., Freese, M., Pohlmann, J.-D., Stoffels, S., Hollert, H., et al. (2014). PAH metabolites, GST and EROD in European eel (Anguilla anguilla) as possible indicators for eel habitat quality in German rivers. Environ. Sci. Pollut. Res. 21, 2519–2530. doi: 10.1007/s11356-013-2121-z
Kendall, M. G. (1938). A new measure of rank correlation. Biometrika 30, 81–93. doi: 10.1093/biomet/30.1-2.81
Kopecka, J., Lehtonen, K. K., Baršienė, J., Broeg, K., Vuorinen, P. J., Gercken, J., et al. (2006). Measurements of biomarker levels in flounder (Platichthys flesus) and blue mussel (Mytilus trossulus) from the Gulf of Gdańsk (southern Baltic). Mar. Pollut. Bull. 53, 406–421. doi: 10.1016/j.marpolbul.2006.03.008
Krahn, M. M., Burrows, D. G., MacLeod, W. D. Jr., and Malins, D. C. (1987). Determination of individual metabolites of aromatic compounds in hydrolyzed bile of English sole (Parophrys vetulus) from polluted sites in Puget Sound, Washington. Arch. Environ. Contam. Toxicol. 16, 511–522. doi: 10.1007/BF01055807
Mann, H. B. (1945). Non-parametric tests against trend. Econometrica 13, 245–259. doi: 10.2307/1907187
Martínez-Gómez, C., Lamoree, M., Hamers, T., van Velzen, M., Kamstra, J. H., Fernández, B., et al. (2013). Integrated chemical and biological analysis to explain estrogenic potency in bile extracts of red mullet (Mullus barbatus). Aquat. Toxicol. 134–135, 1–10. doi: 10.1016/j.aquatox.2013.02.015
Meador, J. P., Stein, J. E., Reichert, W. L., and Varanasi, U. (1995). Bioaccumulation of polycyclic aromatic hydrocarbons by marine organisms. Rev. Environ. Contam. Toxicol. 143, 79–165. doi: 10.1007/978-1-4612-2542-3_4
Myers, M. S., Johnson, L. L., and Collier, T. K. (2003). Establishing the causal relationship between polycyclic aromatic hydrocarbon (PAH) exposure and hepatic neoplasms and neoplasia-related liver lesions in English sole (Pleuronectes vetulus). Hum. Ecol. Risk Assess. 9, 67–94. doi: 10.1080/713609853
Nagel, F., Kammann, U., Wagner, C., and Hanel, R. (2012). Metabolites of polycyclic aromatic hydrocarbons (PAHs) in bile as biomarkers of pollution in European eel (Anguilla anguilla) from German rivers. Arch. Environ. Contam. Toxicol. 62, 254–263. doi: 10.1007/s00244-011-9693-8
Nicolas, J. M. (1999). Vitellogenesis in fish and the effects of polycyclic aromatic hydrocarbon contaminants. Aquat. Toxicol. 45, 77–90. doi: 10.1016/S0166-445X(98)00095-2
Önöz, B., and Bayazit, M. (2003). The power of statistical tests for trend detection. Turkish J. Eng. Environ. Sci. 27, 247–251.
OSPAR (2008). JAMP Guidelines for Contaminant-specific Biological Effects (OSPAR Agreement 2008-09). London: Oslo and Paris Commissions.
Peterson, C. H., Rice, S. D., Short, J., Esler, D., Bodkin, J. L., Ballachey, B. E., et al. (2003). Long-term ecosystem response to the Exxon Valdez oil spill. Science 302, 2082–2086. doi: 10.1126/science.1084282
R Core Team (2013). R: A Language and Environment for Statistical Computing. R Foundation for Statistical Computing. Vienna. Avaialble online at: http://www.R-project.org/
Reynaud, S., and Deschaux, P. (2006). The effects of polycyclic aromatic hydrocarbons on the immune system of fish: a review. Aquat. Toxicol. 77, 229–238. doi: 10.1016/j.aquatox.2005.10.018
Richardson, D. M., Gubbinsn, M., Davies, I. M., Moffat, C. F., and Pollard, P. M. (2004). Effects of feeding status on biliary PAH metabolite and biliverdin concentrations in plaice (Pleuronectes platessa). Environ. Toxicol. Pharmacol. 17, 79–85. doi: 10.1016/j.etap.2004.03.003
Rijnsdorp, A. D., Vethaak, A. D., and van Leeuwen, P. I. (1992). Population biology of dab Limanda limanda in the southeastern North Sea. Mar. Ecol. Prog. Ser. 91, 19–35. doi: 10.3354/meps091019
Rocha Monteiro, P. R., Reis-Henriques, M. A., and Coimbra, J. (2000). Polycyclic aromatic hydrocarbons inhibit in vitro ovarian steroidogenesis in the flounder (Platichthys flesus L.). Aquat. Toxicol. 48, 549–559. doi: 10.1016/S0166-445X(99)00055-7
Ruddock, P. J., Bird, D. J., McEvoy, J., and Peters, L. D. (2003). Bile metabolites of polycyclic aromatic hydrocarbons (PAHs) in European eels (Anguilla Anguilla) from United Kingdom estuaries. Sci. Tot. Environ. 301, 105–117. doi: 10.1016/S0048-9697(02)00292-9
Schipper, C. A., Lahr, J., van den Brink, P. J., George, S. G., Hansen, P.-D., da Silva de Assis, H. C., et al. (2009). A retrospective analysis to explore the applicability of fish biomarkers and sediment bioassays along contaminated salinity transects. ICES J. Mar. Sci. 66, 2089–2105. doi: 10.1093/icesjms/fsp194
Sen, P. K. (1968). Estimates of the regression coefficient based on Kendall's tau. J. Am. Stat. Assoc. 63, 1379–1389. doi: 10.1080/01621459.1968.10480934
Sundt, R. C., Beyer, J., Vingen, S., and Sydnes, M. O. (2011). High matrix interference affecting detection of PAH metabolites in bile of Atlantic hagfish (Myxine glutinosa) used for biomonitoring of deep-water oil production. Mar. Environ. Res. 71, 369–374. doi: 10.1016/j.marenvres.2011.04.006
Tairova, Z. M., Strand, J., Chevalier, J., and Andersen, O. (2012). PAH biomarkers in common eelpout (Zoarces viviparus) from Danish waters. Mar. Environ. Res. 75, 45–53. doi: 10.1016/j.marenvres.2011.09.005
Theil, H. (1950). “A rank-invariant method of linear and polynomial regression analysis, 1, 2 and 3,” in Proceedings of the Koninklijke Nederlandse Akademie van Wetenschappen (Amsterdam), 53, 386–392; 521–525; 1397–1412.
Van der Oost, R., Heida, H., Satumalay, K., van Schooten, F. J., Ariese, F., and Vermeulen, N. P. (1994). Bioaccumulation, biotransformation and DNA binding of PAHs in feral eel (Anguilla anguilla) exposed to polluted sediments: a field survey. Environ. Toxicol. Chem. 13, 859–870. doi: 10.1002/etc.5620130604
Vethaak, A. D., and Jol, J. G. (1996). Diseases of flounder Platichthys flesus in Dutch coastal and estuarine waters, with particular reference to environmental stress factors. I. Epizootiology of gross lesions. Dis. Aquat. Organ. 26, 81–97. doi: 10.3354/dao026081
Vethaak, A. D., Jol, J. G., Eggens, M. L., Meijboom, A., ap Rheinallt, T., Wester, P. W., et al. (1996). Skin and liver diseases induced in flounder (Platichthys flesus) after long-term exposure to contaminated sediments in large-scale mesocosms. Environ. Health Persp. 104, 1218–1229. doi: 10.1289/ehp.961041218
Vethaak, A. D., Jol, J. G., and Martínez-Gómez, C. (2011). Effects of cumulative stress on fish health near freshwater outlet sluices into the sea: a case study (1988–2005) with evidence for a contributing role of chemical contaminants. Integr. Environ. Assess. Manag. 7, 445–458. doi: 10.1002/ieam.163
Vethaak, A. D., Jol, J. G., and Pieters, J. P. (2009). Long-term trends in the prevalence of cancer and other major diseases among flatfish in the southeastern North Sea as indicators of changing ecosystem health. Environ. Sci. Technol. 43, 2151–2158. doi: 10.1021/es8028523
Vethaak, A. D., Rijs, G. B. J., Schrap, S. M., Ruiter, H., Gerritsen, A., and Lahr, J. (2002). Estrogens and Xeno-Estrogens in the Aquatic Environment of the Netherlands: Occurrence, Potency and Biological Effects. Rijkswaterstaat: National Institute for Coastal and Marine Management (RIKZ), RIZA/RIKZ Report No. 2002.001.
Vuorinen, P. J., Keinänen, M., Vuontisjärvi, H., Baršiene, J., Broeg, K., Förlin, L., et al. (2006). Use of biliary PAH metabolites as a biomarker of pollution in fish from the Baltic Sea. Mar. Pollut. Bull. 53, 479–487. doi: 10.1016/j.marpolbul.2005.11.020
Keywords: biliary PAH metabolites, polycyclic aromatic hydrocarbons, Platichthys flesus, Limanda limanda, biliverdin, biomonitoring
Citation: Vethaak AD, Baggelaar PK, van Lieverloo JHM and Ariese F (2016) Decadal Trends in Polycyclic Aromatic Hydrocarbon (PAH) Contamination Assessed by 1-Hydroxypyrene in Fish Bile Fluid in the Netherlands: Declining in Marine Waters but Still a Concern in Estuaries. Front. Mar. Sci. 3:215. doi: 10.3389/fmars.2016.00215
Received: 08 July 2016; Accepted: 19 October 2016;
Published: 11 November 2016.
Edited by:
Juan Jose Alava, Simon Fraser University, CanadaReviewed by:
Li-Chun Tseng, National Taiwan Ocean University, TaiwanJongseong Ryu, Anyang University, South Korea
Copyright © 2016 Vethaak, Baggelaar, van Lieverloo and Ariese. This is an open-access article distributed under the terms of the Creative Commons Attribution License (CC BY). The use, distribution or reproduction in other forums is permitted, provided the original author(s) or licensor are credited and that the original publication in this journal is cited, in accordance with accepted academic practice. No use, distribution or reproduction is permitted which does not comply with these terms.
*Correspondence: A. Dick Vethaak, dick.vethaak@deltares.nl