Approach for Supporting Food Web Assessments with Multi-Decadal Phytoplankton Community Analyses—Case Baltic Sea
 Sirpa Lehtinen1*
  Sanna Suikkanen1
  Heidi Hällfors1
  Pirkko Kauppila1
  Maiju Lehtiniemi1
  Jarno Tuimala2
  Laura Uusitalo1
  Harri Kuosa1
- 1Marine Research Centre, Finnish Environment Institute (SYKE), Helsinki, Finland
- 2Finnish Tax Administration, Helsinki, Finland
Combining the existing knowledge on links between functional characteristics of phytoplankton taxa and food web functioning with the methods from long-term data analysis, we present an approach for using phytoplankton monitoring data to draw conclusions on potential effects of phytoplankton taxonomic composition on the next trophic level. This information can be used as a part of marine food web assessments required by the Marine Strategy Framework Directive of the European Union. In this approach, both contemporary taxonomic composition and recent trends of changes are used to assess their potential consequences for food web functioning. The approach consists of four steps: (1) long-term trend analysis of class-level and total phytoplankton biomass using generalized additive models (GAMs) and calculating average biomass share of each phytoplankton class from the total phytoplankton biomass, (2) comparing the current phytoplankton community composition and its long-term changes with non-metric ordination analysis (NMDS) of genus-level biomass, (3) describing which taxa (the most accurate taxonomic level) are primarily responsible for forming the biomass and for causing the possible changes, and (4) interpretation of the phytoplankton results to assess the potential effects on the next trophic level. Within step 4, special attention is given to the following characteristic of taxa: potential suitability or quality as food for grazers, harmfulness, size, and trophy. These characteristics are selected based on existing scientific knowledge on their relevance to the higher trophic levels. In this article, we present the concept of the suggested approach and demonstrate the phytoplankton analyses with multi-decadal monitoring data from the northern Baltic Sea. We also discuss the future development of the approach toward a food web index by combining or replacing the taxonomic analyses with functional trait-based approaches.
Introduction
In marine pelagic ecosystems, phytoplankton is the key organism group responsible for practically all primary production. In the Marine Strategy Framework Directive of the European Union (MSFD; 2008/56/EC), and subsequent Commission Decision (2010/477/EU), the requirements for assessing the status of marine food webs were set. Looking back in time, the role of phytoplankton as the foundation of food webs was one of the main motivators for the first large-scale phytoplankton investigations undertaken in northern seas, among them the Baltic Sea, already in the early 1900s (cf. Kyle, 1910; Richardson, 2002).
On a general level, primary production, often calculated based on algorithms using surface concentration of chlorophyll-a derived from remote sensing images on ocean color as an important parameter, is considered to be a good predictor of the potential fisheries yield of the world's oceans (Chassot et al., 2007, 2010). Chassot et al. (2007) found also in the European seas, including the Baltic Sea, a strong linkage between primary productivity (estimated from chlorophyll-a derived from ocean color) and fisheries yield over long time scales from several years to decades. On the other hand, Friedland et al. (2012) found primary production alone to be a poor predictor of global fishery yields, but instead their results showed that chlorophyll-a concentration, particle-export ratio, and the ratio of secondary to primary production were positively associated with yields. However, chlorophyll-a concentration is a proxy for total phytoplankton biomass. It does not indicate taxonomic composition. Phytoplankton biomass may be formed by high or low-quality food or by toxic or nontoxic species, potentially differing greatly from each other as a food source for the higher trophic levels (Olli et al., 1996; Kozlowsky-Suzuki et al., 2003; Uronen et al., 2005; Sopanen et al., 2009). Thus, analyzing phytoplankton community composition reveals the ability of the primary producers to sustain effective trophic transfer, which is the basis for zooplankton and fish growth.
Prey size is one of the primary characteristics which determine the next trophic level (grazers such as mesozooplankton) (Sommer et al., 2000; Katechakis et al., 2002; Stibor et al., 2004). It is known that microzooplankton feed on phytoplankton with cell volumes <500 to 1000 μm3 (Sommer et al., 2005), while copepods are known to feed on both microzooplankton as well as medium to moderately large-sized phytoplankton (100–100,000 μm3, Sommer and Sommer, 2006). In addition to creating optimal prey size spectrum for different grazers, cell size affects physiological, and ecological processes such as light absorption, nutrient uptake, and sinking (Kriest and Oschlies, 2007; Finkel et al., 2010; Acevedo-Trejos et al., 2015). The dominance of small phytoplankton is the basis for enhanced cycling through the microbial loop and less efficient transfer of production to higher trophic levels (Glibert, 2016).
In addition to cell size, the suitability of phytoplankton as food for the next trophic level is affected by its life form (colonies, filaments etc.), and cell morphology as well as its biochemical properties, e.g., the amino acid, vitamin, sugar, fatty acid, mineral, and toxin content (Koski et al., 1998). A complicating factor is that differences in the presence and concentration of these compounds are partly species-specific (or even strain-specific; Md Amin et al., 2011) and partly related to the physiological state of cells, thus varying with phytoplankton growth rate and cell age (Koski et al., 1998). Different grazer species also react differently to the same phytoplankton food (Engström et al., 2000; Md Amin et al., 2011).
Toxins produced by phytoplankton vary widely in their composition and effects (Granéli and Turner, 2008). In the Baltic Sea, although current knowledge suggests that the transfer rate of phytoplankton toxins through food web is low (Karjalainen et al., 2005, 2007; Setälä et al., 2011), toxic phytoplankton are considered a potential risk for co-occurring organisms, as well as for high-trophic-level consumers through toxin bioaccumulation in the food web (cf. Kuuppo et al., 2006; Sipiä et al., 2006; Setälä et al., 2009, 2014). In the Baltic Sea, phytoplankton toxins have been found in e.g., copepods (Lehtiniemi et al., 2002; Setälä et al., 2009; Sopanen et al., 2011), bivalves (Sipiä et al., 2001; Setälä et al., 2014), Baltic herring, flounder and roach, as well as eider (Sipiä et al., 2006; Karjalainen et al., 2008) with immediate effects of these compounds including reduced feeding and growth rates in fish larvae (Karjalainen et al., 2007), and even mortality in copepods (Sopanen et al., 2008) and fish (Lindholm and Virtanen, 1992). Allelopathy, i.e., the production of allelochemicals which negatively influence the growth and survival of other phytoplankton species, may have an effect on phytoplankton composition and thus affect grazers by modifying the availability of their preferred food (Reigosa et al., 2006).
Mixotrophy is a common feature in phytoplankton, and it is considered to be an important indicator of the efficiency of food webs (Mitra et al., 2014). Mixotrophic phytoplankton is capable of utilizing dissolved and/or particulate organic matter, including bacteria, for their nutrition in addition to phototrophy. Even though a mixotrophy-dominated food web may be more efficient than a traditional phototrophy-based food web in nutrient depleted situations (Mitra et al., 2014), the change from a phytoplankton-based food web toward a bacteria-based food web might yield considerably lower fish productivity (Berglund et al., 2007).
N2-fixation by the diazotrophic cyanobacteria may be an important function for the entire food web (Montoya et al., 2004; Karlson et al., 2015). In the Baltic Sea, it is has been shown that ca. 40–80% of the fixed nitrogen is released as dissolved bioavailable nitrogen for redistribution in the food web (Ohlendieck et al., 2007; Wannicke et al., 2009, 2013; Ploug et al., 2011). Larsson et al. (2001) have estimated that N2-fixation in the Baltic Sea Proper is 180–430 kt N year−1, and this amount would be sufficient to sustain 30–90% of the pelagic net community production during summer. Still, based on results by Olli et al. (2015), the effects of the N2-fixing cyanobacteria on individual co-occurring phytoplankton taxa include both negative and positive effects, with no obvious phylogenetic or functional trait-based patterns.
In this article, we present an approach for using the phytoplankton taxonomic composition on evaluating its potential effects on the next trophic level. The approach consists of four steps: (1) long-term trend analysis of class-level and total phytoplankton biomass using generalized additive models (GAMs) and calculating average biomass share of each phytoplankton class from the total phytoplankton biomass, (2) comparing the current phytoplankton community composition and its long-term changes with non-metric ordination analysis (NMDS) of genus-level biomass, (3) describing which taxa (the most accurate taxonomic level) are primarily responsible for forming the biomass and for causing the possible changes, and (4) interpretation of the phytoplankton results to assess the potential effects on the next trophic level. Potential suitability as food for grazers, harmfulness, cell size, and trophy are the characteristics of the dominant or increased or decreased taxa which are specifically considered when interpreting the results (step 4), based on existing knowledge on their relevance to the next trophic level (e.g., Koski et al., 1998; Sommer et al., 2000; Berglund et al., 2007; Sopanen et al., 2008). Even though we demonstrate the approach with northern Baltic Sea phytoplankton data, the approach can be used for other sea areas as well since the methods are applicable with any long-term data and the functional characteristics which are specifically considered (quality as food, harmfulness, trophy, cell size) are common to all phytoplankton communities.
Materials and Methods
Concept
The aim of the present approach is to obtain an overview of the existing phytoplankton community composition and its possible ongoing changes and draw conclusions on their potential effects on the next trophic level in order to use this information as a part of marine food web assessments required by the MSFD. The approach consists of four steps (Figure 1). While interpreting the results (step 4), characteristics of taxa which are specifically regarded include potential suitability or quality as food for grazers, harmfulness, size, and trophy. A conceptual model presenting linkages between functional characteristics of phytoplankton taxa and high and low trophic transfer efficiency in pelagic food webs is presented in Table 1.
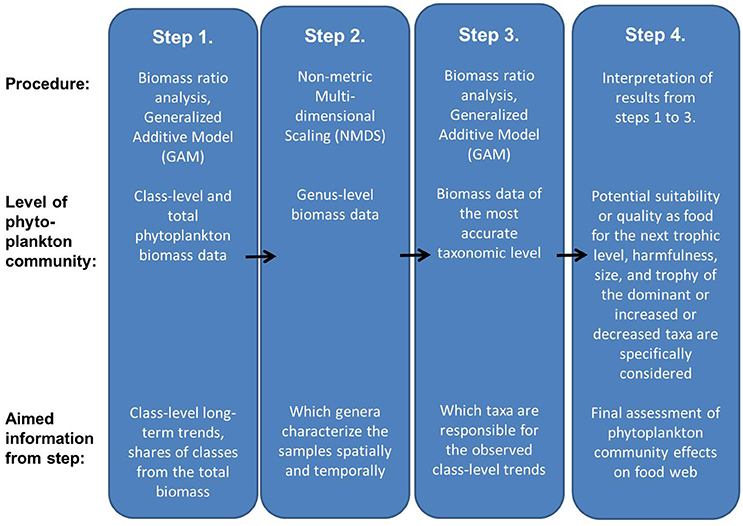
Figure 1. The approach to using phytoplankton long-term data to assess potential effects of phytoplankton community composition and its changes on the next trophic level.
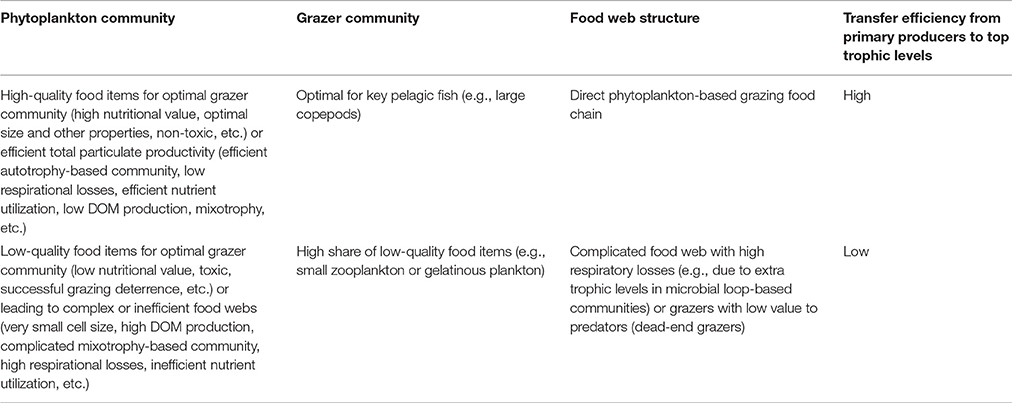
Table 1. A conceptual model of the linkage of phytoplankton community properties (defined as functional characteristics) to high and low trophic transfer efficiency in pelagic food webs (DOM = dissolved organic matter).
The approach requires quality-checked, comparable long-term quantitative phytoplankton biomass data. By phytoplankton, we mean microscopic planktonic auto- and mixotrophic algae and cyanobacteria which can be recognized using a light microscope (i.e., picoplankton is excluded, and trophy is assigned based on light microscopy). The data should be collected at least yearly from a geographical area (can include several stations) where the phytoplankton community composition and seasonal progression are similar. Only data collected during the same phase of the seasonal succession should be analyzed together to avoid adding seasonal variance in the results. Seasonal period when both phytoplankton and zooplankton are abundant (and trophic coupling between phytoplankton and zooplankton is potentially the highest) should be preferred. The number of samples per year should remain the same in the long-term analyses to ensure equal representation of the years.
Data
The proposed approach is demonstrated with Finnish national marine monitoring data collected as part of the HELCOM COMBINE monitoring program (HELCOM, 2015). Phytoplankton samples (n = 286) were collected once a year between July 15th and September 15th in 1979–2014 from 10 offshore monitoring stations situated in the Bothnian Bay, Bothnian Sea, Åland Sea, Gulf of Finland, and northern Baltic Proper (Figure 2). The sampling season was late summer, i.e., the period when zooplankton abundance and biomass are the highest in the area (Ojaveer et al., 1998), following the warming of the water and development of thermocline in the surface layer, but before the downwelling period which breaks up the thermocline. The data are stored in the Finnish national database OIVA (http://www.syke.fi/en-US/Open_information; in Finnish), the ICES database (http://ecosystemdata.ices.dk/inventory/index.aspx), and the COPEPOD database (http://www.st.nmfs.noaa.gov/copepod/data/fimr/index.html).
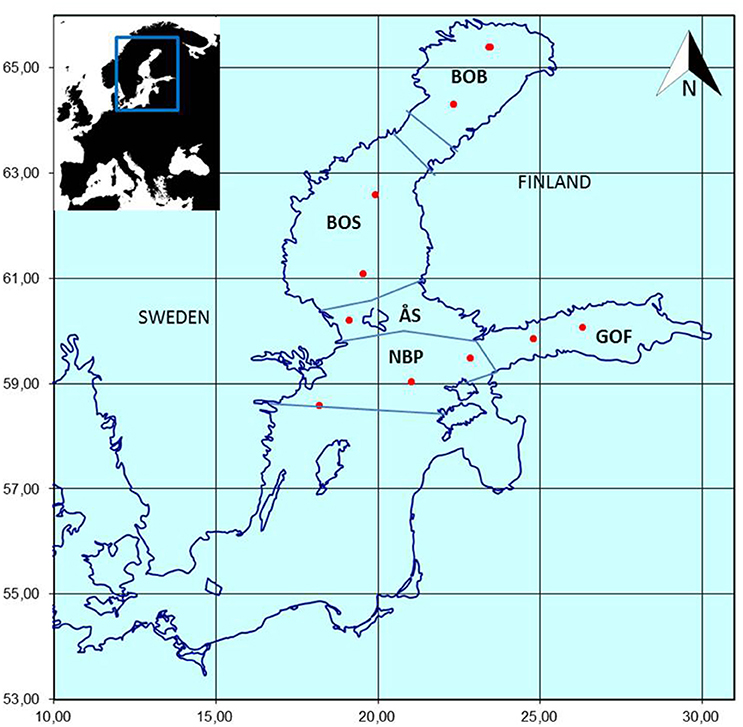
Figure 2. The Finnish HELCOM COMBINE offshore monitoring stations (red dots) in the northern Baltic Sea. Sampling has been performed annually in late summer (from mid-July to mid-September) since 1979. BOB, Bothnian Bay; BOS, Bothnian Sea; GOF, Gulf of Finland; NBP, Northern Baltic Proper; ÅS, Åland Sea.
The methodology followed the HELCOM COMBINE manual (HELCOM, 2015): integrated water samples were taken from the surface layer (0–10 m) by mixing equal amounts of water from the depths of 1, 2.5, 5, 7.5, and 10 m. Samples were preserved with acidic Lugol's solution (1 ml per 300 ml sample), and kept refrigerated (+4 to +10°C) in the dark prior to microscopic analysis within a year of sampling. Microscopy was done with an inverted light microscope using the Utermöhl method (Utermöhl, 1958). A volume of 50 ml (or 25 ml, depending on the density of cells, HELCOM, 2015) of sample was settled in a settling chamber. A magnification of 125x was used to count the species larger than 30 μm as well as taxa belonging to the order Nostocales; 250x magnification was used to count the 20–30 μm sized species, colonies belonging to the order Chroococcales with a cell size larger than 2 μm, as well as taxa belonging to the order Oscillatoriales; and 500x magnification was used to count species smaller than 20 μm as well as Chroococcales colonies with cells smaller than 2 μm. With each of the three magnifications, 60 ocular squares were analyzed, aiming to count at least 400 counting units with each magnification. Picoplankton (cells <2 μm) counting is not possible with this technique.
During microscopic analysis and when converting the counting results into biomass (wet weight μg per liter), the taxon-specific counting units, size classes, and biovolume formulae of the HELCOM PEG (Phytoplankton Expert Group) taxon and biovolume list v. 2014 were used (Olenina et al., 2006; the annually updated biovolume list is available at http://helcom.fi/helcom-at-work/projects/phytoplankton). Only taxa estimated to be auto- or mixotrophic (based on light microscopy and the HELCOM PEG taxon and biovolume list) were included in the analyses, while heterotrophic taxa, cysts, and benthic taxa (which sporadically occur in the plankton) were excluded. Unidentified <10 μm autotrophic monads (unicellular) and flagellates were grouped into “Unidentified.” The nomenclature of the HELCOM PEG biovolume list follows that of the World Register of Marine Species (WoRMS, http://www.marinespecies.org/about.php).
Step 1: Class-Level and Total Biomass Trend Analyses
The statistical analyses were performed using the R software (R Core Team, 2014). Time series for phytoplankton class biomasses in each area were analyzed using Generalized Additive Models (GAM, R package “mgcv,” Wood, 2014). GAMs are well-suited to analyze long-term trends in phytoplankton biomasses (Hastie and Tibshirani, 1990). A GAM is a generalized linear model with a linear predictor involving a sum of smooth functions of covariates, and by specifying the model only in terms of smooth functions, rather than detailed parametric relationships, it allows for rather flexible specification of the dependence of the response on the covariates (Wood, 2006). Curves estimated with GAM are plotted on the data to visualize the direction of the statistically significant long-term changes (i.e., decreasing, increasing, or non-linear trends).
We used class-level data for the GAMs since classes combine taxa with some similar characteristics into a convenient number (ca. 10) of groups. The autotrophic endosymbiont-bearing ciliate Mesodinium rubrum was only included in the phytoplankton counts since 1986, and therefore its trend was analyzed only since that year and its biomass was not included into the trend analyses of total phytoplankton biomass. Classes Chlorophyceae and Charophyceae were grouped into phylum Chlorophyta. In addition to the classes, biomass trends of unidentified taxa, and the total phytoplankton biomass were analyzed separately. Biomass data was modeled as annual averages of all stations within a sea area calculated from the late summer samples. The possible autocorrelation between years was modeled with AR1 (autocorrelation structure with lag 1). Curves estimated with GAM were plotted on the data for visually checking the direction of the significant long-term changes (plots not shown). The average total phytoplankton biomass and average biomass share (%) of each phytoplankton class from the total phytoplankton biomass was calculated based on the whole long-term data set (1979–2014), except for M. rubrum, whose average biomass share was calculated using the total phytoplankton biomass (including M. rubrum) during 1986–2014.
Step 2: Genus-Level Community Analysis
The Non-metric Multidimensional Scaling (NMDS, function metaMDS, R package “vegan,” Oksanen et al., 2016) was used to make a visual ordination of samples based on the similarities and dissimilarities in the genus-level phytoplankton community composition. NMDS is commonly considered as the most robust unconstrained ordination method in community ecology (Legendre and Legendre, 1998; McCune and Grace, 2002). NMDS projects the observed community dissimilarities nonlinearly onto an n-dimensional (usually 2-dimensional) ordination space and it can handle nonlinear taxon responses. NMDS visualizes the phytoplankton community composition by positioning the samples in the ordination space based on their taxon-specific biomass composition. The names of the taxa characterizing the samples can likewise be plotted. The NMDS ordination graphs thus give an overview of the phytoplankton community composition and its spatio-temporal changes, to support the results of GAMs which reveal changes in the biomasses of different phytoplankton classes separately.
We used genus-level biomass data for the NMDS, since consistent species-level identification is not always possible and genus-level data may be more robust to differences in skill and effort among the individual phytoplankton analysts. Genus-level data is also recommended over class-level data since notable genus-level changes may occur even though class biomasses and their shares remain unchanged. Since some genera were not identified consistently by the different microscopists, they were grouped into order-level or into a taxa complex for the NMDS, even though they had been stored into the OIVA database separately: all cryptophyte genera were grouped into the order Cryptomonadales, all genera belonging to the order Chroococcales except for the genera Snowella and Woronichinia were grouped into the order Chroococcales, all genera belonging to the order Ochromonadales were grouped under the order name, and the genera Koliella, Monoraphidium, and Nephrodiella were collectively named the “Monoraphidium complex.” Due to the properties of the community analyses (Legendre and Legendre, 1998) i.e., in order to improve the comparability of the data across the time series and to avoid that sporadically occurring genera confuse the results, genera which were present in less than 5% of the samples (with very low biomasses in all cases) were excluded from the NMDS analyses, resulting in a total of 53 taxa (genera, orders, and complexes) included in the analysis. Taxa which were excluded from the NMDS were acknowledged within the step 3 (most accurate taxonomic level examination). Biomass values were square-root transformed, and the Bray-Curtis dissimilarity was used as the distance metric.
Step 3: The Examination of the Dominant Taxa on the Most Accurate Taxonomic Level
The most accurate taxonomic level data was analyzed by simple biomass ratio analyses showing which taxa dominate the biomass of each phytoplankton class (step 1, GAMs). The role of the dominant taxa in each class was confirmed by running a separate GAM for these taxa to see if the result agreed with that of the total class. Using the conventional methods of phytoplankton monitoring (i.e., light microscopic analysis of preserved samples), not all taxa can be determined to species level, and thus it was necessary for the analyses to consider some higher than species-level taxa in the same manner as the actual species. Within step 3, taxonomic level was anyways more detailed than in the community analysis (step 2, NMDS) to be able to acknowledge, e.g., only sporadically occurring taxa.
Step 4: Interpretation of Results
Within interpretation, all results from steps 1–3 are considered. The taxon-specific (mostly species-specific) characteristics specifically considered when interpreting the results are the potential quality as a food source for grazers, harmfulness, size, and trophy (Table 1). Since these characteristics may be affected by even the life stage of the cells or vary within strains, only the potential of taxa to possess the characteristics can be considered when interpreting the results. If the class-level GAM results were based primarily on taxa for which there exists knowledge on these functional properties, the statistically significant long-term trends (p <0.05) may be used to indicate if the ongoing changes are positive or negative for grazers. For taxa which are considered low-quality food, as well as for taxa which are potentially harmful or toxic to other organisms of the food web, the preferred trend is “decreasing or no change,” while for taxa which are considered high-quality food the preferred trend is “increasing or no change.”
Careful interpretation of the results is important. Even though communities differ geographically and with seasons, the same types of characteristics (quality as food, harmfulness, trophy, size) are common to all phytoplankton communities. Factors possibly affecting the phytoplankton community or causing changes in it are not studied within the approach, but existing studies on physical, chemical, and other biological data can be discussed.
Results
Step 1: Class-Level and Total Biomass Trends
In our demonstration data set from the northern Baltic Sea, the average total phytoplankton biomass during the study period (1979–2014) was the lowest in the Bothnian Bay (191 ± 267 μg l−1, mean ± S.D.), and the highest in the Gulf of Finland (average 520 ± 483 μg l−1). The average total phytoplankton biomass was 427 ± 355 μg l−1 in the northern Baltic Proper, 294 ± 212 μg l−1 in the Bothnian Sea, and 365 ± 159 μg l−1 in the Åland Sea. The Bothnian Bay differed from the other areas also based on its phytoplankton composition. For example, the average share of cyanobacteria was there only ca. 2% of the total phytoplankton biomass, while the average share of cyanobacteria was ca. 27–37% in the other sea areas (Table 2).
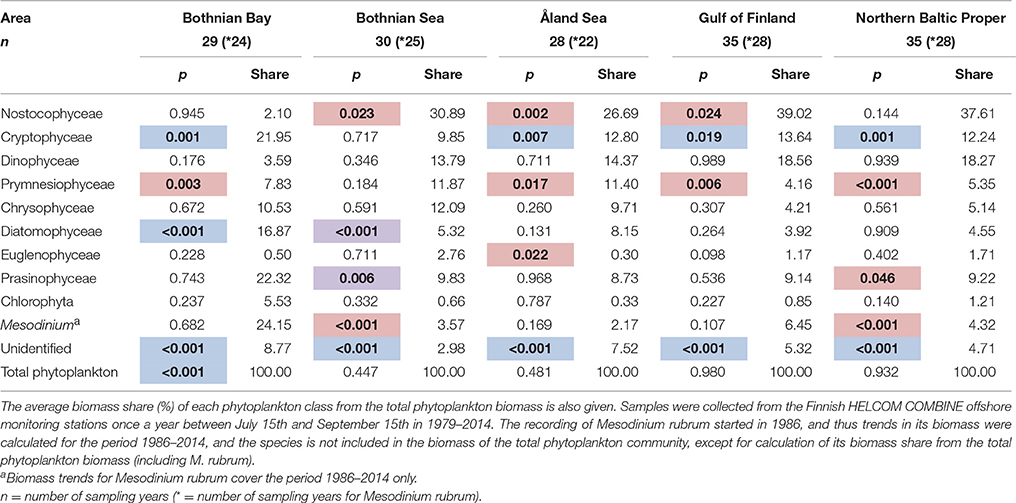
Table 2. Results of the generalized additive models (GAMs) for detection of long-term trends (p-values; bold = significant trend, p < 0.05; direction: blue, decreasing; red, increasing; purple, non-linear).
The class-level data was analyzed for long-term trends in each of the five sea areas using GAMs and the results are summarized in Table 2. Statistically significant increasing trends were found for cyanobacteria (class Nostocophyceae) in the Bothnian Sea, Åland Sea and the Gulf of Finland, for prymnesiophytes (class Prymnesiophyceae) in all sea areas but the Bothnian Sea, euglenophytes (class Euglenophyceae) in the Åland Sea, and prasinophytes (class Prasinophyceae) in the northern Baltic Proper. The autotrophic ciliate M. rubrum increased in the Bothnian Sea and northern Baltic Proper. Cryptophytes (class Cryptophyceae) decreased in all sea areas except the Bothnian Sea, and diatoms (class Diatomophyceae) in the Bothnian Bay. The biomass of unidentified taxa decreased in all sea areas, and biomass of total phytoplankton in the Bothnian Bay. Statistically significant, but non-linear variability was shown by diatoms and prasinophytes in the Bothnian Sea.
Step 2: Genus-Level Community Changes
Based on the NMDS analysis, community composition was clearly different only in the Bothnian Bay compared to the other sea areas (Figure 3). Chlorophyte (phylum Chlorophyta in the GAM) genera Desmodesmus, Elakatothrix, Dictyosphaerium, and Botryococcus, as well as the diatoms (class Diatomophyceae) Diatoma and Skeletonema characterized the Bothnian Bay samples. Nevertheless, the composition changed simultaneously in the same direction during the study period 1979–2014 in all sea areas (Figure 3). The genera Aphanizomenon, Nodularia, Chrysochromulina, and Cryptomonas were shown to be primarily responsible for the biomass formation and the statistically significant trends of cyanobacteria (class Nostocophyceae in GAM), prymnesiophytes (class Prymnesiophyceae), and cryptophytes (class Cryptophyceae), respectively (Tables 1, 2).
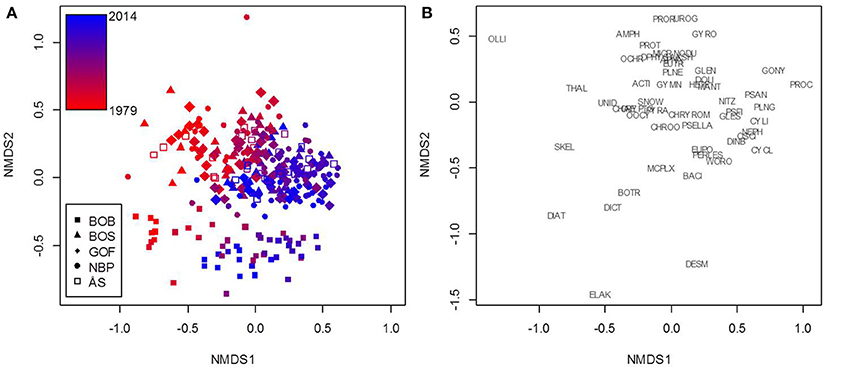
Figure 3. A demonstration of the non-metric multidimensional scaling (NMDS) results based on northern Baltic Sea phytoplankton monitoring data. NMDS was used to cluster samples (A) based on genus-level biomass composition. The 53 genera (and orders and complexes) that the analysis is based on are plotted separately for clarity (B). The color scale represents sampling years from 1979 (red) to 2014 (blue). The HELCOM sea areas investigated were BOB, Bothnian Bay; BOS, Bothnian Sea; GOF, Gulf of Finland; NBP, Northern Baltic Proper; ÅS, Åland Sea. Taxa: ACTI, Actinocyclus; AKSH, Akashiwo; AMPH, Amphidinium; APHA, Aphanizomenon; BACI, Bacillariales; BOTR, Botryococcus; CHAE, Chaetoceros; CHROO, Chroococcales; CHRYROM, Chrysochromulina; CRYPTO, Cryptomonadales; CYCL, Cyclotella; CYLI, Cylindrotheca; DESM, Desmodesmus; DIAT, Diatoma; DICT, Dictyosphaerium; DINB, Dinobryon; DPHYS, Dinophysis; DOLI, Dolichospermum; ELAK, Elakatothrix; EUPO, Eupodiscales; EUTR, Eutreptiella; GLEN, Glenodinium; GONY, Gonyaulax; GLES, Gymnodiniales; GYMN, Gymnodinium; GYRO, Gyrodinium; HETE, Heterocapsa; MANT, Mantoniella; MICR, Micromonas; MCPLX, Monoraphidium complex; NEPH, Nephroselmis; NITZ, Nitzschia; NODU, Nodularia; OCHR, Ochromonadales; OLLI, Ollicola; OOCY, Oocystis; OSCI, Oscillatoriales; PERLES, Peridiniales; PLNE, Planctonema; PLNG, Planktolyngbya; PROC, Prochlorothrix; PROR, Prorocentrum; PROT, Protoceratium; PSAN, Pseudanabaena; PSELLA, Pseudopedinella; PSFI, Pseudoscourfieldia; PYRA, Pyramimonas; SKEL, Skeletonema; SNOW, Snowella; THAL, Thalassiosira; UNID, Unidentified monads and nanoflagellates; UROG, Uroglena; WORO, Woronichinia.
Step 3: Most Accurate Taxonomic Level Examination
The taxa primarily responsible for the biomass formation and the statistically significant trends in each class are listed in Table 3. Most important characteristics of the taxa are also included in the Table 3.
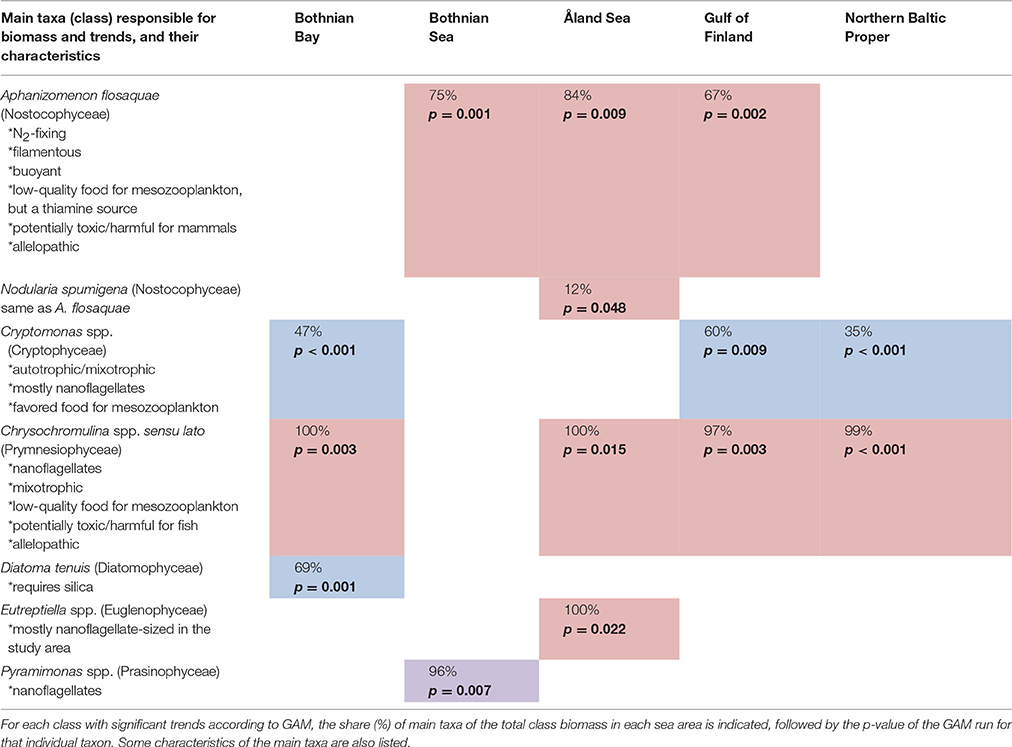
Table 3. Taxa causing the statistically significant trends shown in Table 2 (Colors are explained in Table 2).
Step 4: Interpretation
Total phytoplankton biomass decreased in the Bothnian Bay, but other significant trends in the total phytoplankton biomass were not observed (Table 2). In addition to the lowest total phytoplankton biomass, the Bothnian Bay differed from the other areas also based on its phytoplankton composition (Table 2). However, the community analysis demonstrated an ongoing change toward the same direction in all five sea areas, also in the Bothnian Bay (Figure 3). Suikkanen et al. (2013) found a significant increasing trend for chlorophyll-a concentration during the study period 1979–2011 in the same monitoring stations situated in the northern Baltic Proper, Gulf of Finland, and Åland Sea. In the Bothnian Sea, there was a significant increasing trend for chlorophyll-a (GAM, p <0.001, n = 27) during 1979–2012 (unpublished data), In the Bothnian Bay, no trend in chlorophyll-a was observed (GAM, p = 0.101, n = 27) during 1979–2012 (unpublished data), Thus, our results showed no trends for total phytoplankton biomass (excluding picoplankton) in areas where chlorophyll-a increased, and a decreasing trend for total phytoplankton biomass for the Bothnian Bay where chlorophyll-a showed no trend.
Of the classes with statistically significant long-term changes, cyanobacteria, prymnesiophytes, and cryptophytes are the ones with potentially the most important food web effects in terms of harmfulness, food quality, and trophy in our study area. Both species of cyanobacteria, Aphanizomenon flosaquae and Nodularia spumigena, primarily responsible for the observed increasing trends of the class Nostocophyceae are N2-fixing, i.e., diazotrophic (Table 3). N. spumigena produces hepatotoxin, nodularin, which accumulates in the pelagic and benthic food web and are toxic for mammals (Sipiä et al., 2001; Karjalainen et al., 2007; Sopanen et al., 2009; Karlson and Mozuraitis, 2011), while the Baltic Sea isolates of Aphanizomenon have proven non-toxic, despite the toxicity of several freshwater strains (Lehtimaki et al., 1997).
The most important genus explaining the increasing trends in prymnesiophytes, Chrysochromulina spp. sensu lato, includes potentially harmful algal bloom species which can form fish-killing ichtyotoxins as well as allelopathic substances which are harmful for other phytoplankton species (Reigosa et al., 2006; Granéli and Turner, 2008). In case of toxicity, we used the precautionary principle, i.e., expecting that taxa including potentially toxic strains may be toxic even though we cannot define from the monitoring data if the toxicity was actually present in the community. Another important group of phycotoxin producers is dinoflagellates, but their biomass did not show any statistically significant late-summer trends.
In addition to the increasing risk of potential harmful algal bloom effects in the ecosystem, the observed phytoplankton community changes can have direct food web effects through the changes in the food quality for micro- and mesozooplankton grazers. Cyanobacteria and prymnesiophytes have been shown to be low-quality food for herbivorous zooplankton (de Bernardi and Giussani, 1990; Sopanen et al., 2008), while cryptophytes, which decreased in most of the study area, are considered high-quality food (Lehman and Sandgren, 1985). On the other hand, the cyanobacterium N. spumigena is known to be a good thiamine source for zooplankton (Sylvander et al., 2013), and thus optimal food may contain a small share of it.
Since Chrysochromulina spp. sensu lato includes mixotrophic species, its increase may indicate a shift from an autotrophic, phytoplankton-based food web toward a more mixotrophic, bacteria-based food web. The reason for increasing mixotrophy (importance of the microbial loop) may be either availability of extra energy to the food web due to additional dissolved matter from land, or less efficient food web functioning if the dissolved matter originates from the food web (e.g., direct DOM excretion, decomposition of cyanobacterial blooms, “sloppy feeding” of zooplankton). Based on a study by Berglund et al. (2007), a shift toward a more bacteria-based food web may reduce pelagic productivity at higher trophic levels in the Baltic Sea, since in the bacteria-based food web carbon passes additional trophic levels through flagellates and ciliates before reaching mesozooplankton, while in the phytoplankton-based food web there is a direct pathway from phytoplankton to mesozooplankton.
In the demonstration, all five sea areas were analyzed together in the NMDS to point out that the phytoplankton community composition is quite similar in all studied offshore areas except in the Bothnian Bay, but the ongoing community change was toward the same direction in all five sea areas. The comparison of results of the trend analyses and the community analysis showed that taxa with statistically significant GAM trends (Table 3) were located quite in the middle of the NMDS ordination plot (genus-level, Figure 3) suggesting that their importance in the study area as a whole has not changed markedly during the study period despite the distinct significant increase or decrease in their biomass in particular sea areas. Thus, there is obviously an ongoing phytoplankton community change in the northern Baltic Sea area which cannot be fully explained by changes in biomasses of single taxa in the different sea areas. Based on the recent study by Suikkanen et al. (2013), ongoing changes in the northern Baltic Proper, Gulf of Finland, and Åland Sea are most probably due to complex interactions between warming, eutrophication and increased top-down pressure.
In conclusion, in the Baltic Sea phytoplankton, certain taxonomical groups have a direct link to functional characteristics. Cyanobacteria and prymnesiophytes are low-quality food and potentially harmful, and cryptophytes are considered high-quality food. The community analysis (Figure 3) and some trends (Tables 2, 3) in our data show an ongoing change into an unsatisfactory direction. In the next EU MSFD assessment in 2018, phytoplankton class-level trends with statistically significant p-values in the offshore Gulf of Finland, the Åland Sea, and the northern Baltic Proper should be negative (instead of the current positive) for cyanobacteria and prymnesiophytes, and positive (instead of the current negative) for cryptophytes. In the Bothnian Sea, the trend for cyanobacteria should be negative (instead of the current positive) and new unwanted changes should not appear. In the Bothnian Bay, the trend for prymnesiophytes should be negative (instead of the current positive), and the trend for cryptophytes should be positive (instead of the current negative), and new unwanted changes should not appear. In addition, the results of the community analysis should also be supportive for the results of the trend analyses in 2018.
Discussion
Motivation for the Approach
In this article, we present a novel approach for using the phytoplankton taxonomic community composition to draw conclusions on its potential effects on the next trophic level, the goal being to facilitate the use of this information as a part of the assessment of the structure and functioning of the pelagic marine food web as required by the Marine Strategy Framework Directive (MSFD) of the European Union. Within this approach, a number of phytoplankton properties (potential suitability or quality as food for grazers, harmfulness, size, trophy) can be used to assess the potential efficiency of the pelagic food web, which cannot be deducted from other monitoring data. This supplements the currently insufficiently utilized bottom-up approach, which can then be combined with the results of the present zooplankton indicators (Gorokhova et al., 2015) for a more holistic assessment (cf. Gowen et al., 2011; Pyhälä et al., 2014). The analyses of pressures and management options will follow the holistic analysis. Developing phytoplankton indicators has proven to be challenging (HELCOM, 2013), but it is definitely necessary at least for the food web assessments (Rogers et al., 2010). Currently, an indicator based on phytoplankton community composition does not exist in the Baltic Sea area, instead chlorophyll-a concentration is the only phytoplankton-based indicator used to assess the environmental status in the Baltic Sea (HELCOM core indicators, http://www.helcom.fi/baltic-sea-trends/indicators/).
Evaluation of the Strengths and Weaknesses
The main strength of the present approach is the possibility of applying it to all kinds of quantitative phytoplankton biomass data (as long as data within one analysis follow harmonized methods and taxonomy), since the approach does not include ready-made presumptions of any certain indicator taxa or taxonomic groups forming life forms (Tett et al., 2008) or size categories (Lugoli et al., 2012; Roselli and Basset, 2015). Instead, we point out some functional characteristics which should be considered. Those functional characteristics (potential suitability as food for grazers, harmfulness, size, trophy) are common to all phytoplankton communities, and were selected based on existing knowledge on their relevance to the next trophic level (e.g., Koski et al., 1998; Sommer et al., 2000; Berglund et al., 2007; Sopanen et al., 2008). Using these functional characteristics within the interpretation of the taxonomic results is novel compared to some other recent approaches on analyzing long-term phytoplankton monitoring data (e.g., Suikkanen et al., 2013; Godhe et al., 2015; Haraguchi et al., 2015). Finally, the simple analyses can be done using the freely available R software. The only slight downside of the presented approach is that it will never be an “insert data, push the button, and get the results” type of an indicator: since the assumptions concerning the phytoplankton community composition are not fixed, interpretation of the results is an extremely important part of the approach and requires expert knowledge on local phytoplankton ecology.
Reporting consistent and detailed metadata and complementary information of the procedures enables selecting comparable data for the analyses (Zingone et al., 2015). Sampling, preservation, storage, analysis, taxonomical identification, nomenclature, and biomass calculation need to follow the same procedures throughout the data used in an analysis. In the Baltic Sea area, using phytoplankton monitoring data is feasible since harmonized methods for sampling, microscopy, and biomass calculations developed within the HELCOM PEG group are followed in most of the surrounding countries (HELCOM, 2015). Within the Baltic Sea area, microscopists partaking in HELCOM monitoring are trained annually in the HELCOM PEG workshops, and they participate regularly in species identification and counting proficiency tests (e.g., Vuorio et al., 2015). This is important since in a study including seven European sea areas, the main proportion of the recorded variation between cell densities was explained by the variation between the taxonomists counting the samples (Dromph et al., 2013). In Europe, also the Biological Effects Quality Assurance in Monitoring (BEQUALM) program, using the scheme developed by the UK National Marine Biological Analytical Quality Control (NMBAQC), develops quality standards for community structure analysis and organizes phytoplankton proficiency tests.
When performing the analyses for the first time for an area, a multi-decadal data should be used whenever possible, in order to facilitate distinguishing actual trends from inter-annual variation. Long-term analyses may also enable detecting a period or periods when community composition changed abruptly, indicating possible regime shifts (Möllmann et al., 2015). In addition, multi-decadal data series may in some cases help to estimate the community composition during the time when it was less affected by anthropogenic activities (i.e., being more close to reference conditions or pristine status). A suitable updating frequency of the analyses of presented approach is at least not shorter than 6 years, in accordance with the reporting period of the EU MSFD. When estimating how many years of monitoring data are required for the analyses, it should be considered that single samples are only random fractions representing the continuously fluctuating and dynamic phytoplankton community (Dromph et al., 2013). Thus, low sampling frequency may be a weakness when using phytoplankton monitoring data in assessments. In our demonstration data, the sampling frequency was only once per year but the study period was as long as 36 years. A higher sampling frequency would possibly allow detecting changes already within a shorter monitoring period. Sampling should cover the periods of tightest coupling between phytoplankton and grazers. In the northern Baltic Sea, for example, late summer is the period of the highest zooplankton productivity (Ojaveer et al., 1998) and therefore the season to be focused on.
Offshore and coastal areas should be analyzed separately, because phytoplankton composition in coastal waters usually differs from that in the open sea (e.g., Griffiths et al., 2016). In coastal areas, environmental conditions as well as phytoplankton communities may vary significantly within short distances (Griffiths et al., 2016), and thus it needs to be considered if coastal phytoplankton communities should be analyzed separately even for each station. Data from different offshore stations located within the same sea area may be analyzed together to describe community changes in the area. In that case, annual biomass averages for each season and sea area can be used in the trend analyses.
We recommend using phytoplankton biomass (wet weight per volume) as the input for the analyses because it is often more relevant from the food web perspective than abundance (counting units per volume). The size of different phytoplankton species, and consequently the biovolume of the food sources, varies considerably, which is not evident when using abundance data. Furthermore, biomass data are conveniently converted into carbon biomass data (Menden-Deuer and Lessard, 2000), which are usually utilized in food web models (e.g., Lignell et al., 2013).
The results of trend analyses (GAMs) and community analyses (NMDS) should be interpreted together since their results are complementary to each other and may reveal different aspects. Trend analyses study each taxon separately while community analyses aim at a more holistic view. The reason for using different taxonomic levels in the analyses is due to differing properties of the analyses.
If the possible bottom-up and top-down factors (e.g., Ware and Thomson, 2005; Casini et al., 2008; Prowe et al., 2012) affecting the phytoplankton community are to be discussed within the interpretation of the results (step 4), existing knowledge on those is needed. However, this is not a requirement for using the suggested approach since the analyses of pressures and management options should follow only after a holistic analysis including also other compartments (physical, chemical, and biological) in addition to phytoplankton community composition.
Northern Baltic Sea As an Example Area
Northern Baltic Sea was selected as an example area, since there is almost 40 years of phytoplankton monitoring data from that area and its ecology and phytoplankton and zooplankton dynamics are well studied (e.g., Wulff et al., 2001). Recent studies have reported long-term changes in the Baltic Sea phytoplankton and zooplankton communities (Suikkanen et al., 2013), Secchi depth (Dupont and Asknes, 2014), and several physical, chemical, and biological parameters (Lennartz et al., 2014). Changes have been linked to interactions between warming, eutrophication, and increased top-down pressure (e.g., Suikkanen et al., 2013; Elmgren et al., 2015). Despite the special characteristics (brackish water, clear seasonal succession) of the Baltic Sea, it is a suitable sea area for the demonstration since the functional characteristics which are specifically considered within the suggested approach (quality as food, harmfulness, trophy, cell size) are common to all phytoplankton communities, also for the northern Baltic Sea.
Future Development
The next step will be to compile information on food quality traits, test different trait-based methods (Litchman and Klausmeier, 2008; Litchman et al., 2012, 2015; Barton et al., 2013; Edwards et al., 2015), and finally develop a widely applicable phytoplankton community composition index based on the functional properties. To be able to proceed in this, quantitative information on the biochemical properties of phytoplankton taxa as well as on the specific nutritional needs of the higher trophic levels is required, including information on direct toxicity and harmfulness. Species-specific trait analysis should be supplemented with detailed cell size structure analysis, since pelagic predator-prey size ratios are variable (Hansen et al., 1994; Wirtz, 2012). Based on the results of our demonstration and earlier studies with different approaches and end results (e.g., Berglund et al., 2007; Mitra et al., 2014; Hoikkala et al., 2015), food web modeling would be extremely beneficial for understanding food web interactions connected to auto- and mixotrophy and optimal grazer feeding dynamics.
Author Contributions
Each of the authors has contributed in writing this manuscript. Responsibility on planning was mainly on SL, SS, HH, PK, ML, LU, and HK. Data processing and statistical analyses were performed by SL, SS, and JT.
Conflict of Interest Statement
The authors declare that the research was conducted in the absence of any commercial or financial relationships that could be construed as a potential conflict of interest.
The reviewer LH and handling Editor declared their shared affiliation, and the handling Editor states that the process nevertheless met the standards of a fair and objective review.
Acknowledgments
We thank personnel of the Finnish Institute of Marine Research and Finnish Environment Institute for collection and analysis of the phytoplankton monitoring samples. This work was supported by the DEVOTES (DEVelopment Of innovative Tools for understanding marine biodiversity and assessing good Environmental Status, www.devotes-project.eu) project, funded by the European Union under the 7th Framework Programme, ‘The Ocean of Tomorrow’ Theme (grant agreement no. 308392), Academy of Finland research grant 259357, and BIO-C3 (Biodiversity changes -causes, consequences and management implications, www.bio-c3.eu) project, belonging to BONUS, the joint Baltic Sea research and development programme (Art 185), funded jointly by the Academy of Finland (grant number call 2012-107) and by the European Union's 7th Framework Programme for research, technological development and demonstration. We thank the two reviewers for their constructive comments, which improved the manuscript.
References
Acevedo-Trejos, E., Brandt, G., Bruggeman, J., and Merico, A. (2015). Mechanisms shaping size structure and functional diversity of phytoplankton communities in the ocean. Sci. Rep. 5:8918. doi: 10.1038/srep08918
Barton, A. D., Pershing, A. J., Litchman, E., Record, N. R., Edwards, K. F., Finkel, Z. V., et al. (2013). The biogeography of marine plankton traits. Ecol. Lett. 16, 522–534. doi: 10.1111/ele.12063
Berglund, J., Müren, U., Båmstedt, U., and Andersson, A. (2007). Efficiency of a phytoplankton-based and a bacteria-based food web in a pelagic marine system. Limnol. Oceanogr. 52, 121–131. doi: 10.4319/lo.2007.52.1.0121
Casini, M., Lövgren, J., Hjelm, J., Cardinale, M., Molinero, J.-C., and Kornilovs, G. (2008). Multi-level trophic cascades in a heavily exploited open marine ecosystem. Proc. Biol. Sci. 275, 1793–1801. doi: 10.1098/rspb.2007.1752
Chassot, E., Bonhommeau, S., Dulvy, N. K., Mélin, F., Watson, R., Gascuel, D., et al. (2010). Global marine primary production constrains fisheries catches. Ecol. Lett. 13, 495–505. doi: 10.1111/j.1461-0248.2010.01443.x
Chassot, E., Mélin, F., Le Pape, O., and Gascuel, D. (2007). Bottom-up control regulates fisheries production at the scale of eco-regions in European seas. Mar. Ecol. Prog. Ser. 343, 45–55. doi: 10.3354/meps06919
de Bernardi, D., and Giussani, R. (1990). Are blue-green algae a suitable food for zooplankton? An overview. Hydrobiologia 200–201, 29–41. doi: 10.1007/BF02530326
Dromph, K. M., Agusti, S., Basset, A., Franco, J., Henriksen, P., Icely, J., et al. (2013). Sources of uncertainty in assessment of marine phytoplankton communities. Hydrobiologia 704, 253−264. doi: 10.1007/s10750-012-1353-0
Dupont, N., and Asknes, D. (2014). Centennial changes in water clarity of the Baltic Sea and the North Sea. Estuar. Coast. Shelf Sci. 131, 282–289. doi: 10.1016/j.ecss.2013.08.010
Edwards, K. F., Klausmeier, C. A., and Litchman, E. (2015). Nutrient utilization traits of phytoplankton. Data Paper. Ecology 96:2311. doi: 10.1890/14-2252.1
Elmgren, R., Blenckner, T., and Andersson, A. (2015). Baltic Sea management: successes and failures. Ambio 44(Suppl. 3), 335–344. doi: 10.1007/s13280-015-0653-9
Engström, J., Koski, M., Viitasalo, M., Reinikainen, M., Repka, S., and Sivonen, K. (2000). Feeding interactions of the copepods Eurytemora affinis and Acartia bifilosa with the cyanobacteria Nodularia sp. J. Plankton Res. 22, 1403–1409. doi: 10.1093/plankt/22.7.1403
Finkel, Z. V., Beardall, J., Flynn, K. J., Quihh, A., Alwyn, T., Rees, W. V., et al. (2010). Phytoplankton in a changing world: cell size and elemental stoichiometry. J. Plankton Res. 32, 119–137. doi: 10.1093/plankt/fbp098
Friedland, K. D., Stock, C., Drinkwater, K. F., Link, J. S., Leaf, R. T., Shank, B. V., et al. (2012). Pathways between primary production and fisheries yields of large marine ecosystems. PLoS ONE 7:e28945. doi: 10.1371/journal.pone.0028945
Glibert, P. M. (2016). Margalef revisited: a new phytoplankton mandala incorporating twelve dimensions, including nutritional physiology. Harmful Algae 55, 25–30. doi: 10.1016/j.hal.2016.01.008
Godhe, A., Narayanaswamy, C., Klais, R., Moorthy, K. S. V., Ramesh, R., Rai, A., et al. (2015). Long-term patterns of net phytoplankton and hydrography in coastal SE Arabian Sea: what can be inferred from genus level data? Estuar. Coast Shelf Sci. 162, 69–75. doi: 10.1016/j.ecss.2015.03.006
Gorokhova, E., Lehtiniemi, M., Lesutiene, J., Strake, S., Uusitalo, L., and Demereckiene, N. (2015). Zooplankton Mean Size and Total Abundance. HELCOM Core Indicator Report. Online. Data viewed 6.6.2015. Available online at: http://www.helcom.fi/Core%20Indicators/HELCOM-CoreIndicator-Zooplankton_mean_size_and_total_abundance.pdf
Gowen, R. J., McQuatters-Gollop, A., Tett, P., Best, M., Bresnan, E., Castellani, C., et al. (2011). The Development of UK Pelagic (Plankton) Indicators and Targets for the MSFD. A Report of a workshop held at AFBI, Belfast. Fisheries and Aquatic Ecosystems Branch, Agri-food and Biosciences Institute.
Granéli, E., and Turner, J. T. (eds.) (2008). Ecology of Harmful Algae. Ecological Studies, Vol. 189. Heidelberg: Springer–Verlag, 416.
Griffiths, J. R., Hajdu, S., Downing, A. S., Hjerne, O., Larsson, U., and Winder, M. (2016). Phytoplankton community interactions and environmental sensitivity in coastal and offshore habitats. Oikos 125, 1134–1143. doi: 10.1111/oik.02405
Hansen, B., Bjørnsen, P. K., and Hansen, P. J. (1994). The size ratio between planktonic predators and their prey. Limnol. Oceanogr. 39, 395–403. doi: 10.4319/lo.1994.39.2.0395
Haraguchi, L., Carstensen, J., Abreu, P. C., and Odebrecht, C. (2015). Long-term changes of the phytoplankton community and biomass in the subtropical shallow Patos Lagoon Estuary, Brazil. Estuar.Coast. Shelf Sci. 162, 76–87. doi: 10.1016/j.ecss.2015.03.007
Hastie, T. J., and Tibshirani, R. J. (1990). Generalized Additive Models. New York, NY: Chapman and Hall/CRC.
HELCOM (2013). HELCOM Core Indicators: Final Report of the HELCOM CORESET Project. Balt. Sea Environ. Proc. No. 136, 71. Helsinki: Helsinki Commission.
HELCOM (2015). “Annex C-6: Guidelines concerning phytoplankton species composition, abundance and biomass,” in Manual for Marine Monitoring in the COMBINE Programme of HELCOM. Available online at: http://www.helcom.fi/action-areas/monitoring-and-assessment/manuals-and-guidelines/combine-manual (Accessed February 28, 2015).
Hoikkala, L., Kortelainen, P., Soinne, H., and Kuosa, H. (2015). Dissolved organic matter in the Baltic Sea. J. Mar. Syst. 142, 47–61. doi: 10.1016/j.jmarsys.2014.10.005
Karjalainen, M., Engström-Ost, J., Korpinen, S., Peltonen, H., Pääkkönen, J. P., Rönkkönen, S., et al. (2007). Ecosystem consequences of cyanobacteria in the northern Baltic Sea. Ambio 36, 195–202. doi: 10.1579/0044-7447(2007)36[195:ECOCIT]2.0.CO;2
Karjalainen, M., Pääkkönen, J. P., Peltonen, H., Sipiä, V., Valtonen, T., and Viitasalo, M. (2008). Nodularin concentrations in Baltic Sea zooplankton and fish during a cyanobacterial bloom. Mar. Biol. 155, 483–491. doi: 10.1007/s00227-008-1046-4
Karjalainen, M., Reinikainen, M., Spoof, L., Meriluoto, J. A. O., Sivonen, K., and Viitasalo, M. (2005). Trophic transfer of cyanobacterial toxins from zooplankton to planktivores: consequences to pike larvae and mysid shrimps. Environ. Toxicol. 20, 354–362. doi: 10.1002/tox.20112
Karlson, A. M. L., and Mozuraitis, R. (2011). Deposit-feeders accumulate the cyanobacterial toxin nodularin. Harmful Algae 12, 77–81. doi: 10.1016/j.hal.2011.09.003
Karlson, A. M. L., Duberg, J., Motwani, N. H., Hogfors, H., Klawonn, I., Ploug, H., et al. (2015). Nitrogen fixation by cyanobacteria stimulates production in Baltic food webs. Ambio 44, 413–426. doi: 10.1007/s13280-015-0660-x
Katechakis, A., Stibor, H., Sommer, U., and Hansen, T. (2002). Changes in the phytoplankton community and microbial food web of Blanes Bay (Catalan Sea, NW-Mediterranean) under prolonged grazing pressure by doliolids (Tunicata), cladocerans or copepods (Crustaceae). Mar. Ecol. Prog. Ser. 234, 55–69. doi: 10.3354/meps234055
Koski, M., Klein Breteler, W., and Schogt, N. (1998). Effect of food quality on rate of growth and development of the pelagic copepod Pseudocalanus elongatus (Copepoda, Calanoida). Mar. Ecol. Prog. Ser. 170, 169–187. doi: 10.3354/meps170169
Kozlowsky-Suzuki, B., Karjalainen, M., Lehtiniemi, M., Engström-Öst, J., Koski, M., and Carlsson, P. (2003). Feeding, reproduction and toxin accumulation by the copepods Acartia bifilosa and Eurytemora affinis in the presence of the toxic cyanobacterium Nodularia spumigena. Mar. Ecol. Prog. Ser. 249, 237–249. doi: 10.3354/meps249237
Kriest, I., and Oschlies, A. (2007). Modelling the effect of cell-size-dependent nutrient uptake and exudation on phytoplankton size spectra. Deep Sea Res. I 54, 1593–1618. doi: 10.1016/j.dsr.2007.04.017
Kuuppo, P., Uronen, P., Petermann, A., Tamminen, T., and Granéli, E. (2006). Pectenotoxin-2 and dinophysistoxin-1 in suspended and sedimenting organic matter in the Baltic Sea. Limnol. Oceanogr. 51, 2300–2307. doi: 10.4319/lo.2006.51.5.2300
Kyle, H. M. (1910). “Introduction.” in Conseil Permanent International pour l'Exploration de la Mer, Bulletin Trimestriel des Résultats Acquis Pendant les Croisiéres Périodiques et dans les Périodes Intermédiaires. Résumé des Observations sur le Plankton des Mers Explorées par le Conseil Pendant les Années 1902-1908 (Copenhague: Premiere Partie), (I–)VI–XXXIV [In English and German].
Larsson, U., Hajdu, S., Walve, J., and Elmgren, R. (2001). Baltic Sea nitrogen fixation estimated from the summer increase in upper mixed layer total nitrogen. Limnol. Oceanogr. 46, 811–820. doi: 10.4319/lo.2001.46.4.0811
Lehman, J. T., and Sandgren, C. D. (1985). Species specific rates of growth and grazing loss among freshwater algae. Limnol. Oceanogr. 30, 34–46. doi: 10.4319/lo.1985.30.1.0034
Lehtimaki, J., Moisander, P., Sivonen, K., and Kononen, K. (1997). Growth, nitrogen fixation and nodularin production by two Baltic Sea cyanobacteria. Appl. Environ. Microbiol. 63, 1647–1656.
Lehtiniemi, M., Engström-Öst, J., Karjalainen, M., Kozlowsky-Suzuki, B., and Viitasalo, M. (2002). Fate of cyanobacterial toxins in the pelagic food web: transfer to copepods or to faecal pellets? Mar. Ecol. Prog. Ser. 241, 13–21. doi: 10.3354/meps241013
Lennartz, S. T., Lehmann, A., Herrford, J., Malien, F., Hansen, H.-P., Biester, H., and Bange, H. W. (2014). Long-term trends at the Boknis Eck time series station (Baltic Sea), 1957–2013: does climate change counteract the decline in eutrophication? Biogeosciences 11, 6323–6339. doi: 10.5194/bg-11-6323-2014
Lignell, R., Haario, H., Laine, M., and Thingstad, T. F. (2013). Getting the “right” parameter values for models of the pelagic microbial food web. Limnol. Oceanogr. 58, 301–313. doi: 10.4319/lo.2013.58.1.0301
Lindholm, T., and Virtanen, T. (1992). A bloom of Prymnesium parvum Carter in a small coastal inlet in Dragsfjärd, southwestern Finland. Environ. Toxicol. Water Qual. 7, 165–170. doi: 10.1002/tox.2530070207
Litchman, E., and Klausmeier, C. A. (2008). Trait-based community ecology of phytoplankton. Annu. Rev. Ecol. Evol. Syst. 39, 615–639. doi: 10.1146/annurev.ecolsys.39.110707.173549
Litchman, E., Edwards, K. F., and Klausmeier, C. A. (2015). Microbial resource utilization traits and trade-offs: implications for community structure, functioning, and biogeochemical impacts at present and in the future. Front. Microbiol. 6:254. doi: 10.3389/fmicb.2015.00254
Litchman, E., Edwards, K. F., Klausmeier, C. A., and Thomas, M. K. (2012). Phytoplankton niches, traits and eco-evolutionary responses to global environmental change. Mar. Ecol. Prog. Ser. 470, 235–248. doi: 10.3354/meps09912
Lugoli, F., Garmendia, M., Lehtinen, S., Kauppila, P., Moncheva, S., Revilla, M., et al. (2012). Application of a new multi-metric phytoplankton index to the assessment of ecological status in marine and transitional waters. Ecol. Indic. 23, 338–355. doi: 10.1016/j.ecolind.2012.03.030
McCune, B., and Grace, J. B. (2002). Analysis of Ecological Communities. Gleneden Beach, OR: MjM Software Design.
Md Amin, R. M., Koski, M., Båmstedt, U., and Vidoudez, C. (2011). Strain-related physiological and behavioral effects of Skeletonema marinoi on three common planktonic copepods. Mar. Biol. 158, 1965–1980. doi: 10.1007/s00227-011-1706-7
Menden-Deuer, S., and Lessard, E. J. (2000). Carbon to volume relationships for dinoflagellates, diatoms, and other protist plankton. Limnol. Oceanogr. 45, 569–579. doi: 10.4319/lo.2000.45.3.0569
Mitra, A., Flynn, K. J., Burkholder, J. M., Berge, T., Calbet, A., Raven, J. A., et al. (2014). The role of mixotrophic protists in the biological carbon pump. Biogeosciences 11, 995–1005. doi: 10.5194/bg-11-995-2014
Möllmann, C., Folke, C., Edwards, M., and Conversi, A. (2015). Marine regime shifts around the globe: theory, drivers and impacts. Philos. Trans. R. Soc. B 370:20130260. doi: 10.1098/rstb.2013.0260
Montoya, J. P., Holl, C. M., Zehr, J. P., Hansen, A., Villareal, T. A., and Capone, D. G. (2004). High rates of N2 fixation by unicellular diazotrophs in the oligotrophic Pacific Ocean. Nature 430, 1027–1032. doi: 10.1038/nature02824
Ohlendieck, U., Gundersen, K., Meyerhöfer, M., Fritsche, P., Nachtigall, K., and Bergmann, B. (2007). The significance of nitrogen fixation to new production during early summer in the Baltic Sea. Biogeosciences 4, 63–73. doi: 10.5194/bg-4-63-2007
Ojaveer, E., Lumberg, A., and Ojaveer, H. (1998). Highlights of zooplankton dynamics in Estonian waters (Baltic Sea). ICES J. Mar. Sci. 55, 748–755. doi: 10.1006/jmsc.1998.0393
Oksanen, J., Blanchet, F. G., Friendly, M., Kindt, R., Legendre, P., and McGlinn, D. (2016). Package ‘vegan’. Community Ecology Package. R package version 2.2-1. Available online at: http://cran.r-project.org/web/packages/vegan/vegan.pdf
Olenina, I., Hajdu, S., Edler, L., Andersson, A., Wasmund, N., Busch, S., et al. (2006). Biovolumes and size-classes of phytoplankton in the Baltic Sea. Baltic Sea Environ. Proc. 106, 144.
Olli, K., Heiskanen, A.-S., and Seppälä, J. (1996). Development and fate of Eutreptiella gymnastica bloom in nutrient-enriched enclosures in the coastal Baltic Sea. J. Plankton Res. 18, 1587–1604. doi: 10.1093/plankt/18.9.1587
Olli, K., Klais, R., and Tamminen, T. (2015). Rehabilitating the cyanobacteria – niche partitioning, resource use efficiency and phytoplankton community structure during diazotrophic cyanobacterial blooms. J. Ecol. 103, 1153–1116. doi: 10.1111/1365-2745.12437
Ploug, H., Adam, B., Musat, N., Kalvelage, T., Lavik, G., Wolf-Gladrow, D., et al. (2011). Carbon, nitrogen and O(2) fluxes associated with the cyanobacterium Nodularia spumigena in the Baltic Sea. ISME J. 5, 1549–1558. doi: 10.1038/ismej.2011.20
Prowe, A. E. F., Pahlow, M., Dutkiewicz, S., Follows, M., and Oschlies, A. (2012). Top-down control of marine phytoplankton diversity in a global ecosystem model. Prog. Oceanogr. 101, 1–13. doi: 10.1016/j.pocean.2011.11.016
Pyhälä, M., Fleming-Lehtinen, V., and Laamanen, M. (eds.) (2014). “Eutrophication status of the Baltic Sea 2007-2011. A concise thematic assessment,” in Baltic Sea Environment Proceedings No. 143. Baltic Marine Environment Protection Commission, 41. Helsinki: Helsinki Commission.
R Core Team (2014). R: A Language and Environment for Statistical Computing. Vienna: R Foundation for Statistical Computing. Available online at: http://www.R-project.org/
Reigosa, M. J., Pedrol, N., and González, L. (eds.) (2006). Allelopathy: A Physiological Process with Ecological Implications. Dordrecht: Springer Science and Business Media.
Richardson, K. (2002). Linking plankton and fish production throughout the history of ICES. ICES Mar. Sci. Symp. 215, 156–163.
Rogers, S., Casini, M., Cury, P., Heath, M., Irigoien, X., Kuosa, H., et al. (2010). Marine Strategy Framework Directive – Task Group 4 Report Food Webs. Scientific and Technical Research series. EUR 24343 EN – Joint Research Centre; European Union and ICES; Office for Official Publications of the European Communities, Ispra, 55 pp.
Roselli, L., and Basset, A. (2015). Decoding size distribution patterns in marine and transitional water phytoplankton: from community to species level. PLoS ONE 10:e0127193. doi: 10.1371/journal.pone.0127193
Setälä, O., Lehtinen, S., Kremp, A., Hakanen, P., Kankaanpää, H., Erler, K., et al. (2014). Bioaccumulation of PSTs produced by Alexandrium ostenfeldii in the northern Baltic Sea. Hydrobiologia 726, 143–154. doi: 10.1007/s10750-013-1762-8
Setälä, O., Sopanen, S., Autio, R., and Erler, K. (2009). Grazing and food selection of the calanoid copepods Eurytemora affinis and Acartia bifilosa feeding on plankton assemblages containing Dinophysis spp. Boreal Environ. Res. 14, 837–849.
Setälä, O., Sopanen, S., Autio, R., Kankaanpää, H., and Erler, K. (2011). Dinoflagellate toxins in northern Baltic Sea phytoplankton and zooplankton assemblages. Boreal Environ. Res. 16, 509–520.
Sipiä, V. O., Kankaanpää, H. T., Flinkman, J., Lahti, K., and Meriluoto, J. A. (2001). Time-dependent accumulation of cyanobacterial hepatotoxins in flounders (Platichthys flesus) and mussels (Mytilus edulis) from the northern Baltic Sea. Environ. Toxicol. 16, 330–336. doi: 10.1002/tox.1040
Sipiä, V. O., Sjövall, O., Valtonen, T., Barnaby, D. L., Codd, G. A., Metcalf, J. S., et al. (2006). Analysis of nodularin-R in eider (Somateria mollissima), roach (Rutilus rutilus L.), and flounder (Platichthys flesus L.) liver and muscle samples from the western Gulf of Finland, northern Baltic Sea. Environ. Toxicol. Chem. 25, 2834–2839. doi: 10.1897/06-185R.1
Sommer, F., Stibor, H., Sommer, U., and Velimoriv, B. (2000). Grazing by mesozooplankton from Kiel Bight, Baltic Sea, on different sized algae and natural seston size fractions. Mar. Ecol. Prog. Ser. 199, 43–53. doi: 10.3354/meps199043
Sommer, U., and Sommer, F. (2006). Cladocerans versus copepods: the cause of contrasting top-down controls on freshwater and marine phytoplankton. Oecologia 147, 183–194. doi: 10.1007/s00442-005-0320-0
Sommer, U., Hansen, T., Blum, O., Holzner, N., Vadstein, O., and Stibor, H. (2005). Copepod and microzooplankton grazing in mesocosms fertilised with different Si:N ratios: no overlap between food spectra and Si:N influence on zooplankton trophic level. Oecologia 142, 274–283. doi: 10.1007/s00442-004-1708-y
Sopanen, S., Koski, M., Uronen, P., Kuuppo, P., Lehtinen, S., Legrand, C., et al. (2008). Prymnesium parvum exotoxins affect the grazing and viability of the calanoid copepod Eurytemora affinis. Mar. Ecol. Prog. Ser. 361, 191–202. doi: 10.3354/meps07374
Sopanen, S., Setälä, O., Piiparinen, J., Erler, K., and Kremp, A. (2011). The toxic dinoflagellate Alexandrium ostenfeldii promotes incapacitation of the calanoid copepods Eurytemora affinis and Acartia bifilosa from the northern Baltic Sea. J. Plankton Res. 33, 1564–1573. doi: 10.1093/plankt/fbr052
Sopanen, S., Uronen, P., Kuuppo, P., Svensen, C., Rühl, A., Tamminen, T., et al. (2009). Transfer of nodularin to the copepod Eurytemora affinis through the microbial food web. Aquat. Microb. Ecol. 55, 115–130. doi: 10.3354/ame01289
Stibor, H., Vadstein, O., Diehl, S., Gelzleichter, A., Hansen, T., Hantzsche, F., et al. (2004). Copepods act as a switch between alternative trophic cascades in marine pelagic food webs. Ecol. Lett. 7, 321–328. doi: 10.1111/j.1461-0248.2004.00580.x
Suikkanen, S., Pulina, S., Engström-Öst, J., Lehtiniemi, M., Lehtinen, S., and Brutemark, A. (2013). Climate change and eutrophication induced shifts in Northern Summer plankton communities. PLoS ONE 8:e66475. doi: 10.1371/journal.pone.0066475
Sylvander, P., Häubner, N., and Snoeijs, P. (2013). The thiamine content of phytoplankton cells is affected by abiotic stress and growth rate. Microb. Ecol. 65, 566–577. doi: 10.1007/s00248-012-0156-1
Tett, P., Carreira, C., Mills, D. K., van Leeuwen, S., Foden, J., Bresnan, E., et al. (2008). Use of a phytoplankton community index to assess the health of coastal waters. ICES J. Mar. Sci. 65, 1475–1482. doi: 10.1093/icesjms/fsn161
Uronen, P., Lehtinen, S., Legrand, C., Kuuppo, P., and Tamminen, T. (2005). Haemolytic activity and allelopathy of the haptophyte Prymnesium parvum in nutrient-limited and balanced growth conditions. Mar. Ecol. Prog. Ser. 299, 137–148. doi: 10.3354/meps299137
Utermöhl, H. (1958). Zur Vervollkommnung der quantitativen Phytoplankton-Methodik. Mitt. Int. Verein. Limnol. 9, 1–38.
Vuorio, K., Björklöf, K., Kuosa, H., Jokipii, R., Järvinen, M., Lehtinen, S., et al. (2015). Proficiency Test SYKE 10/2014 Phytoplankton. Reports of Finnish Environment Institute 29/2015. 42. Helsinki: Finnish Environment Institute SYKE.
Wannicke, N., Koch, B., and Voss, M. (2009). Release of fixed N2 and C as dissolved compounds by Trichodesmium erythreum and Nodularia spumigena under the influence of high light and high nutrient (P). Aquat. Microb. Ecol. 57, 175–189. doi: 10.3354/ame01343
Wannicke, N., Korth, F., Liskow, I., and Voss, M. (2013). Incorporation of diazotrophic fixed N2 by mesozooplankton — Case studies in the southern Baltic Sea. J. Marine Syst. 117–118, 1–13. doi: 10.1016/j.jmarsys.2013.03.005
Ware, D. M., and Thomson, R. E. (2005). Bottom-up ecosystem trophic dynamics determine fish production in the Northeast Pacific. Science 308, 1280–1284. doi: 10.1126/science.1109049
Wirtz, K. W. (2012). Who is eating whom? Morphology and feeding type determine the size relation between planktonic predators and their ideal prey. Mar. Ecol. Prog. Ser. 445, 1–12. doi: 10.3354/meps09502
Wood, S. N. (2006). Generalized Additive Models. An Introduction to R. New York, NY: Chapman and Hall/CRC.
Wood S. N. (2014). mgcv: GAMs with GCV/AIC/REML Smoothness Estimation and GAMMs by PQL. R Package Version 1.8-2. Available online at: http://cran.r-project.org/package=mgcv
Wulff, F. V., Rahm, L., and Larsson, P. (eds.) (2001). A Systems Analysis of the Baltic Sea. Heidelberg: Springer-Verlag.
Keywords: food web, phytoplankton community composition, marine strategy framework directive, long-term monitoring, environmental assessment
Citation: Lehtinen S, Suikkanen S, Hällfors H, Kauppila P, Lehtiniemi M, Tuimala J, Uusitalo L and Kuosa H (2016) Approach for Supporting Food Web Assessments with Multi-Decadal Phytoplankton Community Analyses—Case Baltic Sea. Front. Mar. Sci. 3:220. doi: 10.3389/fmars.2016.00220
Received: 14 June 2016; Accepted: 25 October 2016;
Published: 10 November 2016.
Edited by:
Jacob Carstensen, Aarhus University, DenmarkReviewed by:
Alberto Basset, University of Salento, ItalyLumi Haraguchi, Aarhus University, Denmark
Copyright © 2016 Lehtinen, Suikkanen, Hällfors, Kauppila, Lehtiniemi, Tuimala, Uusitalo and Kuosa. This is an open-access article distributed under the terms of the Creative Commons Attribution License (CC BY). The use, distribution or reproduction in other forums is permitted, provided the original author(s) or licensor are credited and that the original publication in this journal is cited, in accordance with accepted academic practice. No use, distribution or reproduction is permitted which does not comply with these terms.
*Correspondence: Sirpa Lehtinen, sirpa.lehtinen@ymparisto.fi