Directional and Spectral Irradiance in Ocean Models: Effects on Simulated Global Phytoplankton, Nutrients, and Primary Production
 Watson W. Gregg1*
  Cécile S. Rousseaux1,2
- 1NASA Global Modeling and Assimilation Office, Greenbelt, MD, USA
- 2Goddard Earth Sciences Technology and Research, Universities Space Research Association (USRA), Greenbelt, MD, USA
The importance of including directional and spectral light in simulations of ocean radiative transfer was investigated using a coupled biogeochemical-circulation-radiative model of the global oceans. The effort focused on phytoplankton abundances, nutrient concentrations and vertically-integrated net primary production. The importance was approached by sequentially removing directional (i.e., direct vs. diffuse) and spectral irradiance and comparing results of the above variables to a fully directionally and spectrally-resolved model. In each case the total irradiance was kept constant; it was only the pathways and spectral nature that were changed. Assuming all irradiance was diffuse had negligible effect on global ocean primary production. Global nitrate and total chlorophyll concentrations declined by about 20% each. The largest changes occurred in the tropics and sub-tropics rather than the high latitudes, where most of the irradiance is already diffuse. Disregarding spectral irradiance had effects that depended upon the choice of attenuation wavelength. The wavelength closest to the spectrally-resolved model, 500 nm, produced lower nitrate (19%) and chlorophyll (8%) and higher primary production (2%) than the spectral model. Phytoplankton relative abundances were very sensitive to the choice of non-spectral wavelength transmittance. The combined effects of neglecting both directional and spectral irradiance exacerbated the differences, despite using attenuation at 500 nm. Global nitrate decreased 33% and chlorophyll decreased 24%. Changes in phytoplankton community structure were considerable, representing a change from chlorophytes to cyanobacteria and coccolithophores. This suggested a shift in community function, from light-limitation to nutrient limitation: lower demands for nutrients from cyanobacteria and coccolithophores favored them over the more nutrient-demanding chlorophytes. Although diatoms have the highest nutrient demands in the model, their relative abundances were generally unaffected because they only prosper in nutrient-rich regions, such as the high latitudes and upwelling regions, which showed the fewest effects from the changes in radiative simulations. The results showed that including directional and spectral irradiance when simulating the ocean light field can be important for ocean biology, but the magnitude varies with variables and regions. The quantitative results are intended to assist ocean modelers when considering improved irradiance representations relative to other processes or variables associated with the issues of interest.
Introduction
Light is a critical physical influence on ocean biology. It initiates the process of photosynthesis, the first step supporting nearly all life in the oceans (Dickey et al., 2011), and altering the oxygen and carbon balances on the Earth. Light from the sun arrives at the top of the atmosphere with different intensities at different spectral bands. It comes entirely in a specific direction depending on the time of day and season, in a beam that is defined by the solar zenith angle. This beam is the direct irradiance. The atmosphere modulates this direct irradiance via spectral absorption by optically active gases and also introduces a second pathway to the oceans resulting from scattering by clouds, aerosols, and molecules. This latter process gives rise to diffuse irradiance, where the light now enters the ocean from a hemisphere encompassing the horizon to nadir. This “sky light” does not have direction specified and is in contrast to direct irradiance that arrives uninterrupted by the atmosphere. Irradiance reaching the surface is often a combination of the direct and diffuse components. The term directional refers to this difference in irradiance pathways.
Once the spectral and directional light enters the ocean, it continues its journey of absorption and scattering, now guided by optical constituents with different spectral absorption capabilities and sizes that determine their scattering effects. Now it encounters much more strongly absorbing constituents than in the atmosphere and finds its pathways blocked by a phalanx of life forms and associated byproducts, as well as inorganic substances, each of which with demands for light unheard of in the atmosphere. Its passage in the oceans differs by the constituents it encounters and the directions it is forced to take, which alters the availability and nature of light to be taken up by phytoplankton and initiate process of photosynthesis, further affecting the distribution of life at the surface and at depth.
Despite the directional and spectral nature of irradiance in the oceans, models that represent these aspects are uncommon. Most ocean biogeochemical models simulate surface bulk irradiance, typically as shortwave radiation (e.g., Maier-Reimer et al., 2005; Doney et al., 2006; Henson et al., 2010) or as photosynthetically available radiation (PAR) (Palmer and Totterdell, 2001; Zielinski et al., 2002; Marinov et al., 2010; Laufkötter et al., 2013), and then represent the transmission as a function of an attenuation term (e.g., Zhao et al., 2013). This is especially true for the global models. The attenuation term is sometimes divided into a component for water and another for phytoplankton (Jiang et al., 2003; Maier-Reimer et al., 2005; Manizza et al., 2005; Xiu and Chai, 2014), but can also represent an estimated average loss of light in the water column (e.g., Doney et al., 2006).
Recognition of the importance of directional and spectral irradiance for phytoplankton dates to Sathyendranath and Platt (1988, 1989) in investigations of phytoplankton in situ light absorption and estimates of in situ primary production. Spectral irradiance was explicitly included in a 1-dimensional regional model of the Sargasso Sea (Bissett et al., 1999), the West Florida Shelf (Bissett et al., 2005), and in 3-dimensional models of the eastern US continental shelf (Mobley et al., 2009) and North Pacific (Xiu and Chai, 2014). But spectral and especially directional irradiance have largely been ignored in global coupled biological-circulation models (with the exceptions of Gregg, 2000; Gregg et al., 2003; Gregg and Casey, 2007; Dutkiewicz et al., 2015). This is likely related to the computational load directional and spectral radiative transfer imposes on ocean models, especially globally resolved ones. But in an era of multi-parallel processing, perhaps the time has come to reconsider its inclusion. Light in the natural oceans is, after all, directionally and spectrally resolved and therefore including these characteristics would enhance the realism of simulated ocean transmittance and light availability.
Our purpose here is to evaluate the importance of directional and spectral irradiance in the global oceans using an established ocean biogeochemical model and an established radiative transfer model that incorporates these aspects of light in the atmosphere and through the oceans. We limit our focus here to the effects on biological processes, specifically phytoplankton abundance, nutrient distributions, and vertically-integrated primary production. Nutrients are indirectly related to irradiance via uptake by phytoplankton. Changes in heat transfer due to ocean light absorption is important for ocean modeling as well (e.g., Gnanadesikan and Anderson, 2009), but we will defer these evaluations in the interest of brevity. Quantitative assessments can assist global modelers on how to proceed with future model improvements by quantifying the importance of these aspects and enable rational choices.
Methods
Global Ocean Physical-Biogeochemical Model Configuration
The underlying biogeochemical constituents are simulated by the NASA Ocean Biogeochemical Model (NOBM; Gregg and Casey, 2007; Gregg et al., 2013) which is coupled to a global ocean circulation model, Modular Ocean Model version 4 (MOM4; Griffies et al., 2004; Gnanadesikan et al., 2006). It spans the global ocean at 1° horizontal resolution, with 50 vertical levels and the shallowest level at 10 m bottom depth. NOBM incorporates global coupled physical-biological processes, including six phytoplankton groups (diatoms, chlorophytes, cyanobacteria, coccolithophores, dinoflagellates, and Phaeocystis spp.). The Phaeocystis genus only includes the high latitude species, specifically Phaeocystis pouchetti (northern high latitudes) and Phaeocystis antarctica (Southern Ocean). These phytoplankton groups span much of the functionality of the global oceans. Diatoms represent high growth, fast sinking, silicate-dependent phytoplankton that have high nutrient requirements. Cyanobacteria are the functional opposite, with slow maximum growth rates, slow sinking, low nutrient requirements, and a capability for nitrogen fixation. Coccolithophores are moderate growers that sink relatively quickly due to their calcium carbonate coccoliths. They are efficient users of nitrogen, enabling them to flourish in low nutrient regions (although not as efficient as cyanobacteria). Phaeocystis spp., at least as represented here, are high latitude nanoplankton that play a role in the Earth's sulfur cycle. Unlike the other phytoplankton, they have a temperature optimum in maximum growth rate around 3°C (Schoemann et al., 2005). Dinoflagellates are large, slow-growing phytoplankton with high nutrient requirements, but sink slowly based on the limited motility provided by flagella. Finally, chlorophytes are intended to represent the diverse functionality associated with nanoplankton, with growth rates, sinking rates, and nutrient requirements between the functional extremes and the more specialized phytoplankton. Phytoplankton-specific physiological and physical parameters are shown in Appendix Table 1.
Diatoms and chlorophytes (Arrigo and Sullivan, 1994; Arrigo et al., 1995; Robinson et al., 1998) and Phaeocystis spp. (Tang et al., 2009; Arrigo et al., 2014) have the capability to grow in sea ice. We limit irradiance in sea ice to one-tenth its value at the surface (Gregg and Casey, 2007). Biological activities in ice are modified by the percentage of sea ice present in a model grid cell.
The model also contains four nutrients (nitrate, ammonium, silicate, and dissolved iron), three detrital components (particulate organic carbon, silicate, and iron), and five carbon components: dissolved organic and inorganic carbon (DOC and DIC), alkalinity, and two new variables, particulate inorganic carbon (PIC), and chromophoric dissolved organic carbon (CDOC).
Phytoplankton growth is a function of scalar quantum irradiance, which is a measure of the photons impacting phytoplankton cells from all directions, expressed as units of μmol photons m−2 s−1 (Kirk, 1992). Variable carbon to chlorophyll ratios are utilized, that depend on the light history (Gregg and Casey, 2007).
PIC is produced by coccolithophores as detached coccoliths and is lost via sinking and dissolution. PIC is produced as a fraction (25%) of the coccolithophore growth rate (Gregg and Casey, 2007) minus respiration. The PIC sinking rate is represented here as an exponential function of concentration, assuming that large concentrations of PIC are associated with larger coccolith size
where ws is the PIC sinking rate (m d−1), PIC is in units of μgC l−1, a0 = 0.1 m d−1 and a1 = 1.0 l μgC−1. Dissolution follows Buitenhuis et al. (2001), except that no dissolution is allowed for depths shallower than the calcium carbonate compensation depth, which we define as 3500 m.
CDOC represents the biogeochemical constituent necessary for the simulation of absorption by aCDOC(λ), the absorption coefficient, which is an optical quantity. It has two sources in the model: phytoplankton excretion and river discharge. Phytoplankton excretion assumes a DOC:CDOC production ratio of 0.7. It is destroyed by the absorption of photons, assuming a quantum yield for CDOC
and the quantum absorption of available spectral irradiance in the water column by CDOC
where Qa is the absorbed quanta by CDOC (μmol photons m−3 s−1). Q denotes irradiance expressed as quanta with subscripts d, s, and u representing direct downwelling, diffuse downwelling, and diffuse upwelling components (μmol photons m−2 s−1), respectively, and aCDOC is the absorption coefficient of CDOC (m−1).
The photolysis of CDOC is then
There is regional information on defining φCDOC (e.g., Reader and Miller, 2012, 2014), but we seek a global spectrally integrated solution for computational reasons. In this case, we iterate model runs with various values of φCDOC, using global distributions of data from MODIS-Aqua (Maritorena et al., 2010) as a target. After several dozen model runs, we derive φCDOC = 1.0E-6 (μM/μmol photons absorbed m−3) for results in reasonable agreement with MODIS-Aqua data, which we use in this simulation.
This approach ignores photo-bleaching of CDOC, which is sometimes assumed to be an intermediate condition on the path to photolysis (photo-oxidation) (Del Vecchio et al., 2009). Photo-bleaching is a milder form of degradation, where the slope of the CDOC absorption curve, SCDOC (see Equation 18) declines (i.e., spectral-dependence becomes weaker) with exposure to irradiance. However, keeping track of various states of photo-bleaching is difficult for a prognostic tracer and requires multiple tracers with different absorption curve slopes to be realistic. Dutkiewicz et al. (2015) approach the problem by defining a CDOM-like tracer that is photo-bleached as a function of PAR. Like here, Xiu and Chai (2014) ignored variability of SCDOC (and thus photo-bleaching). Bissett et al. (1999) also photolyzed CDOC, bypassing photo-bleaching. However, photolysis degradation products were reverted to the DOC pool rather than the DIC pool. The spectral slope SCDOC may also change by water type (Stedmon et al., 2011) but is also not considered here.
River inputs of nutrients and some carbon components are included in the model, but amounts are not differentiated individually by river source. Nitrate and silicate concentrations at river mouths are assumed to be 10 μM, while dissolved iron is 1 nM. DOC is specified at 100 μM, while DIC and alkalinity are assumed to be the same as the nearby ocean discharge locations. CDOC is assumed to be 750 μM at the river mouths. Here we make an exception for northern high latitudes (>70°N) where concentrations are set to 300 μM because the higher concentrations led to complete irradiance extinction, which is not supported by data.
Ocean-Atmosphere Spectral Irradiance Model
NOBM is coupled to the Ocean-Atmosphere Spectral Irradiance Model (OASIM; Gregg and Carder, 1990; Gregg, 2002; Gregg and Casey, 2009) to simulate the propagation of downward spectral irradiance in the atmosphere and oceans and the upwelling irradiance/radiance in the oceans. The irradiance pathways for OASIM are shown in Figure 1. The atmosphere and ocean portions of the irradiance are implemented at variable spectral resolution over the range 200 nm–4 mm, depending upon the major atmospheric and oceanic absorbing sources. There are 33 spectral bands, which account for >99% of the total solar extraterrestrial irradiance. For the PAR spectral region (defined here as 350–700 nm following historical precedent) the model utilizes 25 nm spectral resolution (Figure 2), with band centers located at the bands shown. The 350 nm band represents the beginning of the first band and 700 nm the end of the last band, making them approximately half the width of the other bands (Gregg, 2002).
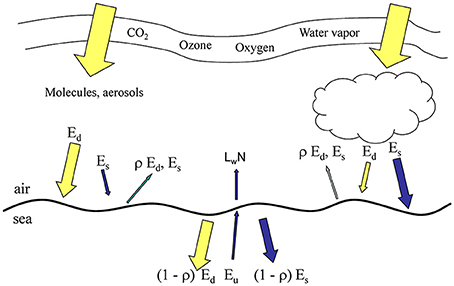
Figure 1. Irradiance pathways (directional irradiance) in OASIM. Ed is direct downwelling irradiance, Es is diffuse downwelling, ρ is surface reflectance, Eu is diffuse upwelling irradiance, and LwN is normalized water-leaving radiance. All irradiances and radiances are spectrally resolved at 25 nm for Ed, Es, and Eu for the range 350–700 nm, and at variable resolution for the remainder of the 200 nm–4 um. Size of arrows approximates relative contributions.
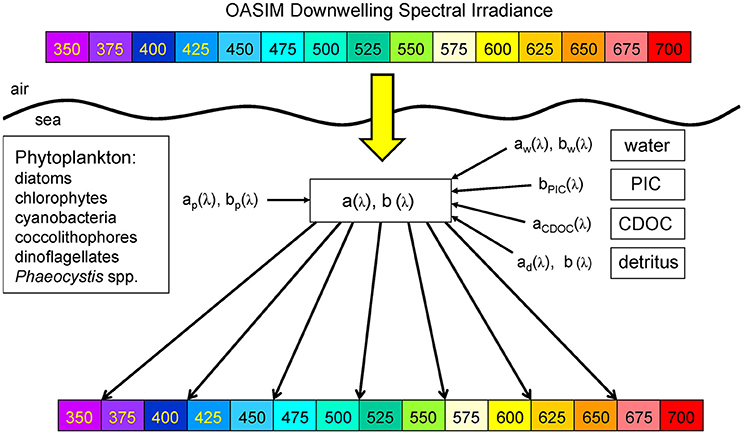
Figure 2. OASIM spectral downwelling radiance and dependencies in the ocean. Shown are the visible bands. Inherent optical properties (spectral absorption coefficient a[λ], and spectral scattering coefficient b[λ]) are derived from spectral characteristics of water, phytoplankton groups, detritus, PIC, and CDOC. OASIM tracks spectral irradiance from the sun through the atmosphere into and through the oceans.
The atmospheric component of OASIM tracks irradiance through cloudy and clear skies (see Figure 1), accounting for spectral absorption and scattering of atmospheric gases, clouds, and aerosols. Biases and uncertainties in the atmospheric component of OASIM have been characterized for clear sky high spectral resolution (1 nm; Gregg and Carder, 1990) and under mixed cloudy and clear skies for 25 nm spectral resolution (Gregg and Casey, 2009). We elaborate here on the ocean optical calculations.
Ocean radiative transfer uses a “three-stream” method based on the Aas (1987) two stream approximation, modified for an explicit direct downwelling component by Ackleson et al. (1994)
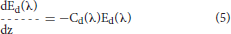
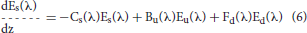
where Ed(λ) is the spectral downwelling direct irradiance at the bottom of a model layer, Es(λ) is the downwelling diffuse irradiance, and Eu(λ) is the upwelling diffuse irradiance. The attenuation terms Cx (where x is an indicator for the irradiance pathway d for direct downwelling, s for diffuse downwelling, and u for diffuse upwelling), backscattering terms Bx, and forward scattering Fx differ for each of the irradiance pathways because of different shape factors (Aas, 1987; Ackleson et al., 1994) and mean cosines
where a is the absorption coefficient, b is the total scattering coefficient, bb is the backscattering coefficient, is the ratio of backscattering to total scattering, and μ is the mean cosine (constant for diffuse irradiance, but varies with solar zenith angle for direct irradiance). The shape factors are indicated by the rx terms, and are specified as in Ackleson et al. (1994). Equation 5 can be solved a priori, which can then be used as a boundary condition, greatly simplifying the solution of the coupled Equations 6, 7.
OASIM is used in 5 different Ocean General Circulation Models (OGCM): NASA Global Modeling and Assimilation Office (GMAO) Poseidon (Gregg, 2000; Gregg and Casey, 2007; Rousseaux and Gregg, 2015), GMAO MOM4 (present effort), NASA Goddard Institute for Space Studies (GISS) HYCOM (Romanou et al., 2013, 2014), NASA GISS Russell (Romanou et al., 2014), and Massachusetts Institute of Technology (MIT) OGCM (Dutkiewicz et al., 2015). It is used in the coupled ocean-atmosphere models of NASA/GMAO-GEOS-5 and NASA/GISS ModelE-H and -R.
Optical Properties of Ocean Constituents
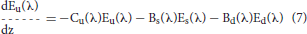
The coupled NOBM-OASIM model includes optically active constituents, including water, phytoplankton, detritus, PIC, and CDOC each with unique spectral characteristics (Figure 3). All are prognostic state variables, with individual sources and sinks. The optical properties of each constituent are taken from various efforts in the peer reviewed literature.
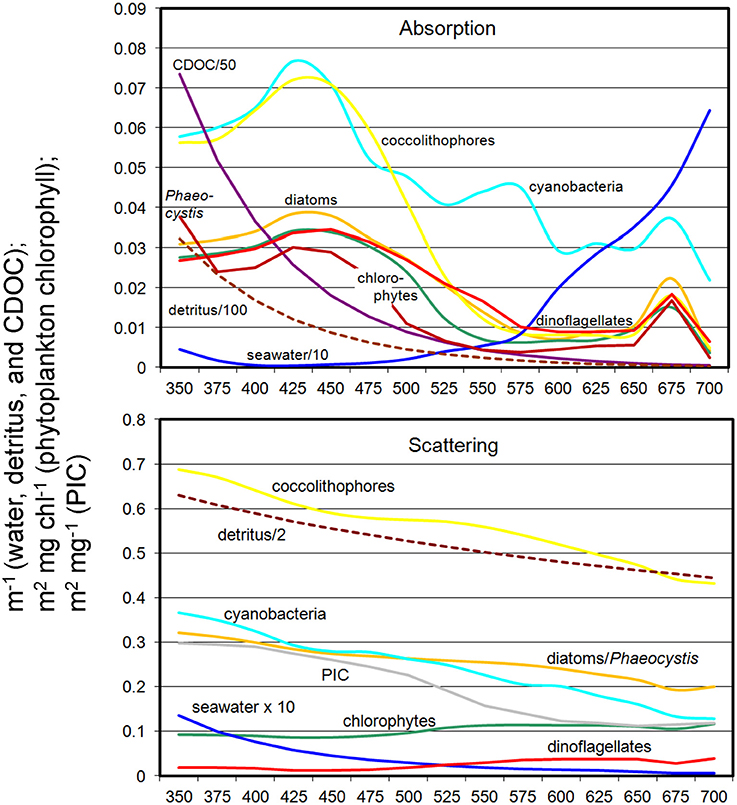
Figure 3. Spectral absorption and scattering coefficients of water, phytoplankton, detritus, PIC, and CDOC in OASIM.
Water
The spectral absorption and scattering properties of water have been re-evaluated several times in the past 3 decades. Originally reported by Smith and Baker (1981) for the 200–800 nm spectral domain, the data was revised by Pope and Fry (1997) for the range 380–720 nm. Morel et al. (2007) derived new data for absorption and scattering for the spectral range 300–500 nm using information in the clearest ocean waters of the South Pacific. Finally, Lee et al. (2015) reported new absorption coefficients in the range 350–550 nm.
Water absorption data used here are from Smith and Baker (1981) for 200–300 nm and 730–800 nm, Morel et al. (2007) for 300–350 nm, Lee et al. (2015) for 350–550 nm, Pope and Fry (1997) for 550–720 nm, Circio and Petty (1951) for 800 nm–2.5 μm, and Maul (1985) for 2.5–4 μm. Water scattering are from Smith and Baker (1981) for the range 200–350 nm and 500–800 nm, and Morel et al. (2007) for the spectral range 350–500 nm. We assume no scattering by water for wavelengths longer than 850 nm. The backscattering-to-total scattering ratio bw for water is 0.5.
Phytoplankton
Phytoplankton optical properties are obtained from various sources. Chlorophyll-specific absorption coefficients (λ) are derived by taking reported spectra and normalizing to the absorption at 440 nm [(440)]. Normalized specific absorption spectra [(λ)]N are computed for each of the five phytoplankton groups: diatom and chlorophyte [(λ)]N are taken from Sathyendranath et al. (1987), cyanobacteria from Bricaud et al. (1988), coccolithophores from Morel and Bricaud (1981), and dinoflagellates from Ahn et al. (1992). Then the specific spectral (λ) values are derived using mean values at 440 nm. Diatom (440) represents the mean of 5 observations containing 4 different spp., chlorophytes 6 observations from 4 spp., cyanobacteria 5 observations from 3 spp., coccolithophores 3 observations of 1 sp., and dinoflagellates 1 sp., all from the references listed above. Phaeocystis spp. specific spectral absorption coefficients are taken from Stuart et al. (2000) measurements for the Arctic species Phaeocystis pouchetti.
Phytoplankton specific scattering coefficients (λ) are obtained from measurements at 590 nm and extended to the entire spectrum from specific attenuation coefficients (Bricaud et al., 1988). Diatom and chlorophyte specific scattering coefficients at 590 nm, (590) and (590), are the mean of 5 observations and 6 observations, respectively, from Morel (1987), Bricaud and Morel (1986) and Bricaud et al. (1988). Cyanobacteria (590) is the mean of 8 observations from Morel (1987), Bricaud and Morel (1986), Bricaud et al. (1988) and Ahn et al. (1992). Coccolithophore (590) is derived from the mean of 3 observations from Bricaud and Morel (1986), Bricaud et al. (1988), and Ahn et al. (1992). Dinoflagellate (590) is derived from a single observation by Ahn et al. (1992). We have been unable to locate spectral scattering properties for Phaeocystis spp., so we assume the specific scattering coefficients are the same as diatoms.
We assume no spectral dependence in the backscattering-to-total scattering ratio bp. Ahn et al. (1992) suggested a spectral dependence for cyanobacteria but generally none for the other groups. Reported values for bp are 0.002 for diatoms (Morel, 1988), 0.00071 for chlorophytes (Ahn et al., 1992), 0.0032 for cyanobacteria (Ahn et al., 1992), 0.00071 for coccolithophores, 0.0029 for dinoflagellates (both from Morel, 1988), and 0.002 for Phaeocystis spp. (assumed same as diatoms). Some of these values have been questioned based on non-sphericity of many natural phytoplankton populations (Vaillancourt et al., 2004; Whitmire et al., 2010). Based on these results, we increased bp for chlorophytes and coccolithophores by a factor of 10, but kept them as reported for diatoms, cyanobacteria, dinoflagellates, and Phaeocystis spp.
Detritus
Detritus both absorbs and scatters light (Figures 2, 3). Absorption is typically considered an exponential function of wavelength (Roesler et al., 1989; Gallegos et al., 2011)
where D is the concentration of detritus μg C l−1, ad(λ) is the absorption coefficient of detritus (m−1), Sd = 0.013 nm−1 (Gallegos et al., 2011) and a∗d is the mass-specific absorption coefficient of detritus, which is set to 8.0E-5 m2 mg−1 for small detritus as typically found in oceanic waters (Gallegos et al., 2011). Only organic carbon detritus in the model is used for detrital optics.
Detritus scattering is also taken from Gallegos et al. (2011)
where bd is the total scattering coefficient, is the mass-specific scattering coefficient. The scattering coefficient is set as 0.00115 m2 mg−1 and the backscattering-to-total scattering ratio bd is 0.005, as in Gallegos et al. (2011).
PIC
PIC optical properties have been evaluated by Gordon et al. (2009). We adopt this formulation for our simulation. PIC scatters irradiance but does not absorb
where PIC is the concentration of PIC (mgC m−3) and (λ) is PIC-specific spectral scattering coefficient from Gordon et al. (2009) in units of m2 mgC−1. The backscattering-to-total scattering ratio bpic is from Balch et al. (1996), using their lower bound of 0.01.
CDOC
As a dissolved component, CDOC only absorbs and does not scatter. Its spectral absorption is similar to detritus but with a different slope
where is the mass-specific absorption coefficient of CDOC, SCDOC = 0.014 nm−1 (Bricaud et al., 1981, 2010). SCDOC is in the low end range of observations in surface waters of the Equatorial Atlantic (Andrew et al., 2013) but only slightly lower than those observed in the Mediterranean Sea (Organelli et al., 2014). There are few reports of the mass-specific absorption coefficient of CDOC . We have found three observations in the literature (Carder et al., 1989; Yacobi et al., 2003; Tzortziou et al., 2007). The more recent two are in agreement at 2.98 × 10⁻⁴ m2 mg−1 in 4 rivers in Georgia, USA (Yacobi et al., 2003) and 2.78 × 10⁻⁴ m2 mg−1 as the mean of 4 stations in the Rhode River, Maryland, USA (Tzortziou et al., 2007). Carder et al. (1989) reported a mean over about nearly an order of magnitude lower in the Gulf of Mexico (4.74 × 10⁻⁵ m2 mg−1). We choose Yacobi et al. (2003) for our simulation.
Model Setup
The model is integrated for 30 years from an initial state using climatological atmospheric forcing and atmospheric absorbing gases from Modern-Era Retrospective Analysis for Research and Applications (MERRA; Rienecker et al., 2011). The initial state for nitrate and silicate is taken from the National Centers for Environmental Information World Ocean Atlas (Conkright et al., 2002), dissolved iron is from Fung et al. (2000), and ammonium is arbitrarily set to 0.5 μM. All phytoplankton concentrations are initialized to 0.5 mg m−3 and the new variables PIC and CDOC initialized to 0 Concentrations (μg l−1 and μM, respectively). Alkalinity and dissolved inorganic carbon are initialized using Global Data Analysis Project (GLODAP; Key et al., 2004) and dissolved organic carbon is initialized as 0 μM. Cloud and aerosol optical properties for surface irradiance are obtained from MODIS-Aqua. Diurnal variability is represented at the model 30-min time step, but atmospheric optical components are monthly climatologies.
Error Characterization of the Model
The biological and optical constituents of the NOBM-OASIM model are compared to in situ and/or satellite (MODIS) data where and when available, in order to quantify the bias and uncertainty. Satellite chlorophyll data are compared with the surface level of the model which is 10 m. Phytoplankton groups are compared to in situ data while total chlorophyll, PIC, and aCDOC are compared to satellite estimates. The statistics are aggregated over the 12 basins of the global oceans, mean differences (biases) computed, and then correlations computed over the basins. This provides an estimate of large scale correlations and is very stringent considering the low number of observations. The major ocean basins are divided into 3 main regions, high latitudes (poleward of 40° latitude): North Atlantic and Pacific and Southern Ocean, mid-latitudes (between 40° and 10° latitude): North Central Atlantic and Pacific, South Atlantic, Pacific and Indian, and North Indian, and tropical basins (between ±10° latitude): Equatorial Atlantic, Pacific, and Indian.
Phytoplankton groups are represented as relative abundances, and are compared to in situ data on relative abundances. The in situ data is a compilation described by Gregg and Casey (2007) and is available at http://gmao.gsfc.nasa.gov/research/oceanbiology/data.php. Some changes to the error characterization of Gregg and Casey (2007) include (1) removal of data obtained in the sub-polar tropical Pacific basins during El Niño-Southern Oscillation (ENSO) events and (2) removal of chlorophyte data poleward of 40° latitude. ENSO events change the phytoplankton relative abundances, sometimes drastically, as noted in in situ (Bidigare and Ondrusek, 1996; Karl et al., 2001), satellite (Uitz et al., 2010; Masotti et al., 2011; Bricaud et al., 2012), and satellite data assimilation studies (Rousseaux and Gregg, 2012). Regarding the removal of high latitude chlorophyte data, we note that little of the data in our data base have explicitly identified chlorophyte relative abundances. Instead, we assume that all reports of intermediate phytoplankton, e.g., nanoplankton, nano-eukaryotes, etc. are compatible with the role played by chlorophytes in the model. While this assumption still holds, it is likely that such a categorization includes Phaeocystis spp. in the high latitudes, which are common here. Since we now explicitly represent these polar species Phaeocystis, we do not need to use chlorophytes as a proxy for nanoplankton and can avoid the misrepresentations between data and model in the high latitudes that we previously accommodated.
We have been unable to find relative abundance data for Phaeocystis spp., so we use absolute abundances from the MARine Ecosytem DATa (MAREDAT) project (Vogt et al., 2012). The data are reported as μg C l−1, which was converted to mg chl m−3 as reported in the model using a carbon:chlorophyll ratio of 50 g g−1. Phaeocystis globosa data are removed from the comparison because our characterization is strictly for polar species of Phaeocystis. We also remove data reported prior to 1975 due to suspect quality. Abundances are log-transformed prior to statistical analysis. We have not been able to obtain global data on dinoflagellate relative abundances and there is not yet a database from MAREDAT, so we are unable to quantify model error statistics on this phytoplankton group.
There is no available satellite data for CDOC that we are aware of, but a satellite product called aCDM (absorption coefficient of Chromophoric Dissolved and Particulate Organic Matter at 443 nm) is available (Garver and Siegel, 1997; Maritorena and Siegel, 2005; Maritorena et al., 2010). We use the products from MODIS-Aqua in this effort. This product represents the absorption of both CDOM and detritus (hence the usage of CDM to minimize confusion about its nature). Siegel et al. (2002) estimated the detrital contribution as (12%). This difference in dissolved organic detrital representations contributes to the low model estimates relative to data reported here, as well as possibly inadequate phytoplankton production of CDOC and/or excessive photolysis. However, the regional correlation in Table 1 is likely more robust.
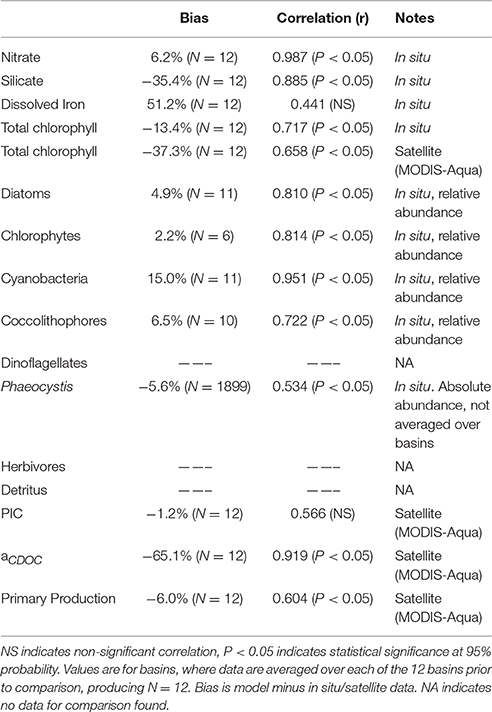
Table 1. Bias and correlation of major model variables with data sources.
Model total chlorophyll is also substantially lower than satellite data (Table 1). This is driven by the uneven seasonal sampling of satellites, resulting in little or no coverage in local winter, when chlorophyll concentrations are very low. By observing the oceans only in seasons of higher growth, satellite data overestimates global median chlorophyll.
Satellite primary production data is from the Vertically Generalized Production Model (Behrenfeld and Falkowski, 1997). Data shown in Table 1 is a climatology from MODIS-Aqua from 2003–2013.
The atmospheric portion of OASIM has been quantitatively evaluated against in situ data (Gregg and Carder, 1990; Gregg and Casey, 2009), so no further analysis is done here. Spectrally-integrated surface irradiance from OASIM had root mean square (RMS) difference = 20.1 Wm−2 (about 11%), bias = 1.6 W m−2 (about 0.8%), regression slope = 1.01 and correlation coefficient = 0.89, when compared to 2322 in situ observations under mixed cloudy and clear skies (Gregg and Casey, 2009). Under clear skies the model has demonstrated a 6.6% RMS with in situ surface observations at 1 nm spectral resolution (Gregg and Carder, 1990).
The ocean component of OASIM has been shown to improve the representation of the deep chlorophyll concentration maximum (Dutkiewicz et al., 2015). Dutkiewicz et al. (2015) also provided maps comparing computed upwelling radiances with some of the MODIS-Aqua bands. Here we present a quantitative comparison of global OASIM normalized upwelling spectral radiances compared to MODIS-Aqua accompanied by statistical characterization. In this evaluation we utilize a different global ocean model (Poseidon; Schopf and Loughe, 1995) with nearly identical NOBM configuration (i.e., not including dinoflagellates and Phaeocystis spp.), and assimilate total chlorophyll, PIC, and aCDM(443) (Maritorena et al., 2010) from MODIS-Aqua. This novel use of data assimilation ensures consistency in underlying optical constituents with observations. This enables us to isolate the OASIM calculations of spectral radiance. The simulation/assimilation/satellite data year for the comparison is 2007. The reason for the ocean circulation model switch is that data assimilation has not yet been developed for GEOS-5 MOM4-NOBM and it is essential for isolating the radiative transfer model evaluation. The normalized upwelling radiance calculation is described in Appendix 1. For this evaluation, we utilize 1 nm spectral resolution data for surface irradiance and ocean optical properties. The 1 nm bands chosen for comparison align with the band centers for MODIS-Aqua. This enables us to match to MODIS bands and reduce impacts of model/data band misalignment in the error characterization.
Evaluation Scenarios for Spectral and Directional Irradiance
The model is run an additional 10 years of simulation after the initial spinup under different scenarios of irradiance treatment in the water column to evaluate the effects of spectral and directional irradiance. Ten years is sufficient to achieve stability for most of the scenarios (defined as <1% change in global nitrate, chlorophyll, and primary production per year), but the more different the scenario from the control, the longer it can take to achieve this level of stability. This extended run was required only for the test of direct irradiance, which required 20 years to stabilize.
All scenarios are evaluated against a control run, which is the spun-up model with full treatment of directional and spectral irradiance. Each scenario of directional and spectral irradiance is evaluated against this directionally and spectrally-resolved model. We focus here strictly on the changes in ocean biology, specifically nitrate, total chlorophyll, phytoplankton composition, and net primary production.
In all cases the surface irradiance enters the ocean as fully differentiated directionally and spectrally using the atmospheric component of OASIM, which accounts for absorption and scattering by atmospheric constituents (clouds, aerosols, gases) and penetration through the atmosphere-ocean boundary as a function of surface roughness (Figure 1). We evaluate the importance of the irradiance nature in the oceans using the ocean component of OASIM (the three-stream model described above, Equations 5–14) by simulating irradiance transmittance involving one of the aspects of the irradiance at a time.
First, directional irradiance is evaluated. All of the surface irradiance, and its spectral quality is conserved. In this case, the light is transmitted through the oceans as purely direct irradiance. The surface diffuse irradiance is added into the direct path as
and is then zeroed out
The irradiance is tracked in the three-stream model as strictly direct irradiance (Equation 5). This enables us to understand the importance of the nature of the light and its effects if treated in the oceans strictly as direct irradiance, without changing the total irradiance entering.
The test of diffuse irradiance is similar, with the roles reversed, i.e., surface direct irradiance is added to the diffuse, and is then zeroed out
Now the radiative transfer is computed using Equations 6 and 7, where the terms containing Ed are zero.
The scenarios thus treat the pathways of light in the oceans differently and are attenuated differently, despite containing the same total irradiance at the surface. The spectral nature of the irradiance is preserved in these scenarios so that we are strictly observing the effects of light direction.
The spectral irradiance scenarios preserve the directional nature of the surface irradiance, with direct and diffuse components explicitly computed in the water column by the OASIM three-stream model. This time, however, we compute only the attenuation (absorption and scattering) of a single spectral band. This is somewhat complex because it is difficult to decide which individual band to select a priori. Thus we test several wavelengths spanning the range of PAR individually. Specifically, we sum all of the irradiance in all the PAR bands into the 400 nm band, then use the attenuation characteristics of 400 nm, i.e., spectral absorption and scattering of water, phytoplankton, detritus, PIC, and CDOC at 400 nm
Then we repeat the process at 450 nm, 500 nm, 550 nm, 600 nm, and finally 650 nm, again moving all the surface spectral irradiance into the band of interest and tracking attenuation in that band. We evaluate changes in ocean biology based on the individual band attenuation compared to the full spectral nature of natural irradiance. In this and the other spectral scenarios, directionality is treated as in the control, i.e., fully resolved from surface inputs including monthly climatological clouds and aerosols.
Finally we evaluate the combined effect of directional and spectral irradiance by choosing the band that most agrees with the control and assuming only diffuse irradiance. The total irradiance entering the ocean is conserved as in all the preceding scenarios.
Results
Model Error Characterization
Comparisons of major constituents in NOBM with various in situ and satellite data sets are summarized in Table 1. In situ and satellite data sets were available for most of the model tracers, but some, like detritus and dinoflagellates, were not. Bias was represented by the global difference (model minus data, usually expressed as percent) and uncertainty was represented by correlation with significance testing. The model variables were taken from year 30 of the 30-year spinup.
OASIM normalized upwelling radiances were compared with the radiances available from MODIS-Aqua. This was a different circulation model coupled to NOBM in a configuration that has the capability to assimilate satellite data, but was otherwise nearly identical to NOBM used here with MOM4 (i.e., not including dinoflagellates and Phaeocystis spp.). The assimilation ensures that we have evaluated the radiative transfer model, rather than convolving differences in underlying optical constituents. We are characterizing the error of the radiative model here, and it is essential to utilize optical constituent distributions that more closely resemble nature than a free-run model does. We achieve this through a novel use of data assimilation. The global mean bias for the band composite was −0.6 mW cm−2 μm−1 sr−1 (−8.0%) and the correlation was 0.68 (P < 0.05). Bias and correlation for normalized upwelling radiances compared to the 6 MODIS visible bands are provided in Table 2.
Table 2. Statistics on the comparison of global normalized water-leaving radiances LwN(λ) from the NOBM-OASIM model and radiances from MODIS-Aqua for 2007.
Directional Irradiance
When all surface irradiance was assumed to be direct, and light transmittance followed Equation 5, global nitrate concentrations increased >200% (Table 3). This was accompanied by a large decline in global net primary production of more than −80% compared to the directionally and spectrally resolved simulation (Table 3). Global annual median chlorophyll, however, was only modestly affected by the change in light stream, falling only by −8.3% (Table 3).
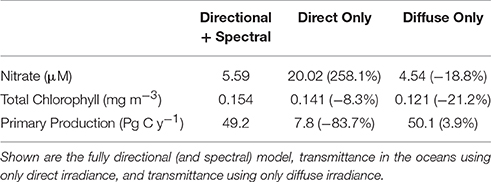
Table 3. Global annual mean nitrate concentrations, global annual median chlorophyll concentrations and global net primary production as a function of directional irradiance.
When all surface irradiance was assumed to be diffuse, and irradiance was computed using Equations 6, 7, global surface nitrate concentrations decreased by nearly 19% and global median chlorophyll concentrations decreased similarly, by 21% (Table 3). Regional distributions showed that the changes were largest in the sub-tropical and tropical regions, defined here as equator-ward of 40° latitude (Figure 4). Global net primary production increased slightly in a diffuse-only representation of irradiance (Table 3). Phytoplankton relative abundances changed considerably more than PP and nitrate for some groups (Figure 5). Chlorophyte relative abundance declined while cyanobacteria, coccolithophores, and dinoflagellates increased. Diatoms and Phaeocystis spp. remained nearly constant regardless of whether the irradiance was treated as directional or as diffuse only.
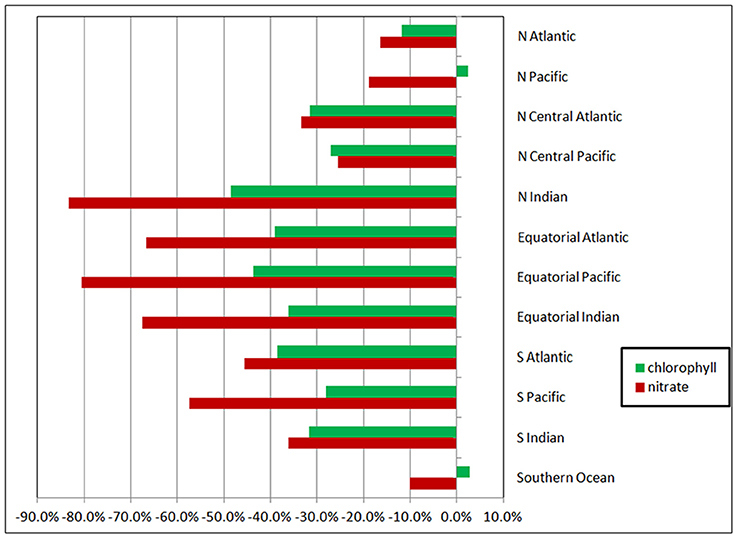
Figure 4. Changes in regional nitrate and chlorophyll as a function of radiative transfer in the oceans tracking only the diffuse component. Changes are relative to the directionally-spectrally resolved model. The high latitudes are poleward of 40° latitude (i.e., the North Atlantic, North Pacific, and Southern Ocean). The tropical and sub-tropical basins are in the middle, with the tropical/sub-tropical delineation at 10°.
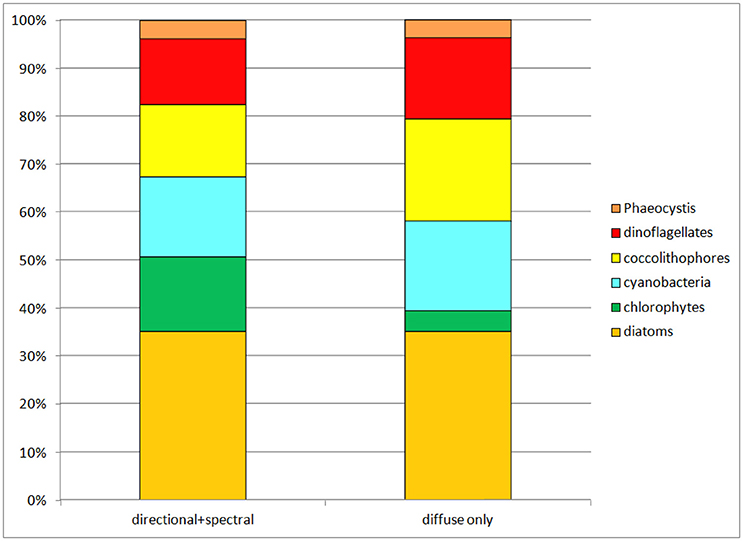
Figure 5. Phytoplankton group relative abundances in the directional and spectrally-resolved model and the diffuse-only simulation. The direct-only simulation is not shown because it attenuates so much irradiance the results are clearly unrealistic.
Spectral Irradiance
Treatment of irradiance attenuation as non-spectral produced differences with the full spectral model that depended upon the choice of attenuation band (Figure 6). Using 400 nm, mean global nitrate concentrations were much lower than the full spectral calculation, a pattern that persisted for the shorter wavelengths through 500 nm. For wavelengths >500 nm, nitrate concentrations were much higher, ranging from 104% at 550 nm to >200% for 600 nm and 650 nm. Global median chlorophyll concentrations tracked nitrate through 550 nm, with lower concentrations than the full spectral model for 400–500 nm, then higher at 550 nm (Figure 6). At longer attenuation wavelengths than 550 nm, global median chlorophyll and global mean nitrate diverged, with nitrate higher than control and chlorophyll lower than the control. Attenuation at 500 nm produced the closest approximation to full spectral treatment for both global nitrate and chlorophyll.
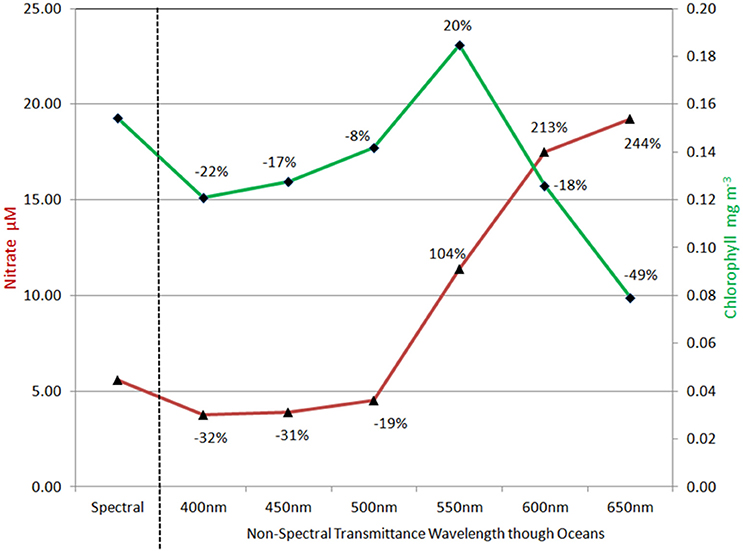
Figure 6. Global nitrate and chlorophyll concentrations using non-spectral transmittance of irradiance. The non-spectral attenuation is shown for six different bands, each beginning with the same total surface irradiance as the spectrally resolved model. The percent change is relative to the spectrally-resolved model. Nitrate is shown in red and follows the left vertical axis.
Phytoplankton relative abundances were also sensitive to non-spectral irradiance transmittance in the oceans (Figure 7). As with nitrate, chlorophyll and primary production, transmittance at 500 nm was closest to the spectral calculation. But even here there were departures from the spectrally-resolved model: chlorophytes were almost half their relative abundance in the full spectral solution, while coccolithophores and cyanobacteria increased their relative abundances by about 3% each. Diatoms were relatively steady in their proportion of the phytoplankton community regardless of the choice of attenuation. Other than diatoms there were major changes in phytoplankton for attenuation choices greater than 500 nm.
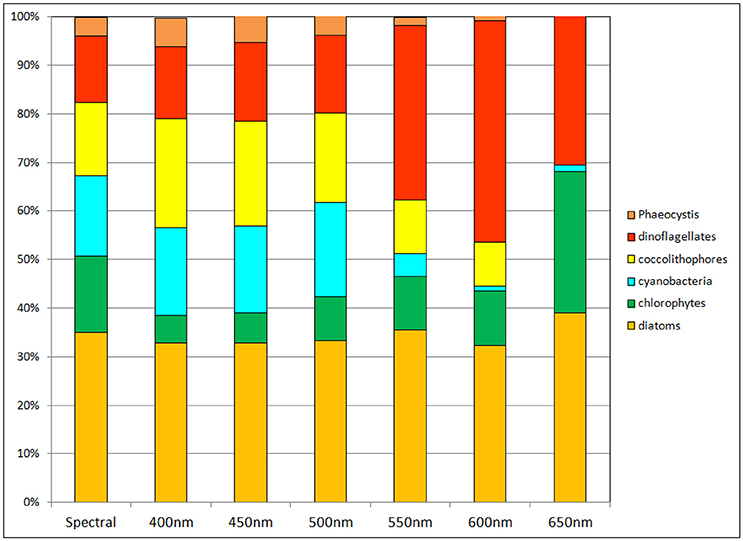
Figure 7. Phytoplankton group relative abundances using non-spectral transmittance of irradiance. The non-spectral attenuation is shown for 6 different bands, each beginning with the same total surface irradiance as the spectrally-resolved model.
Global net primary production as a function of spectral transmittance exhibited inverse patterns to global annual median chlorophyll (Figure 8). Transmittance at 500 nm compared the most favorably to the spectral primary production. Transmittances at wavelengths shorter than 500 nm showed increased primary production, while those longer showed smaller production, with declines well over 50% for 600 nm and above.
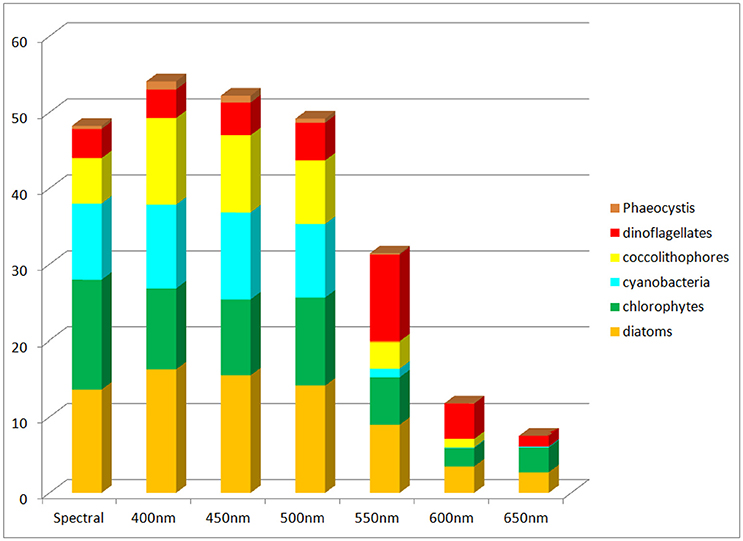
Figure 8. Global net primary production using non-spectral transmittance of irradiance compared to the spectrally-resolved model. Included is the contribution of each phytoplankton component to the total.
Combined Effect of Directional and Spectral Irradiance
The combined effect of utilizing only diffuse and non-spectral irradiance for estimation of the underwater light field was larger than the individual representations of diffuse only and transmittance at 500 nm (the best case for non-spectral attenuation). Global surface nitrate concentrations were lower (−33.6% compared to the directionally and spectrally-resolved model) as was global surface median chlorophyll (−16.4%) (data not shown). Comparisons with in situ and satellite data (Figures 9, 10) reinforced these results as well. In contrast, total primary production was quite similar to the directionally and spectrally-resolved simulations. Global net primary production was within 2.4 Pg C y−1 or about 5%, with the non-resolved model higher (data not shown).
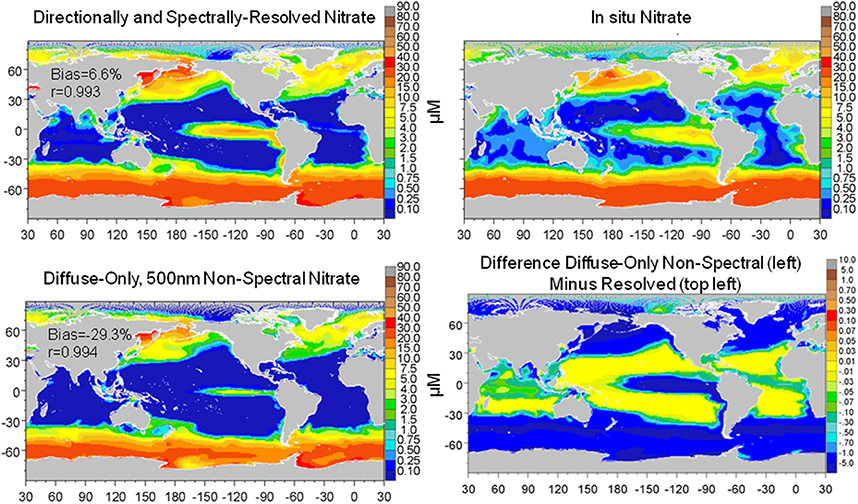
Figure 9. Global distribution of nitrate from the directionally and spectrally-resolved model, in situ data and the diffuse-only, 500 nm non-spectral simulation and the difference. Statistics on global distributions compared to in situ data are shown in the plots. The correlation for both models is statistically significant at P < 0.05.
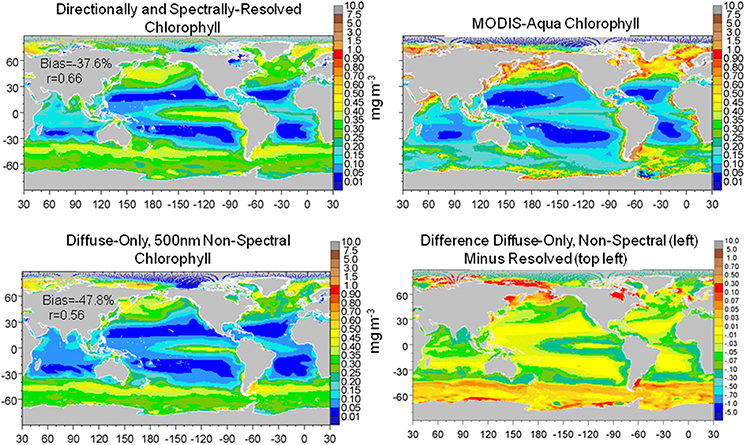
Figure 10. Global distribution of chlorophyll from the directionally and spectrally-resolved model, climatological satellite data, the diffuse-only, 500 nm non-spectral simulation and the ditierence. Statistics on global distributions compared to satellite data are shown in the plots. The directionally-spectrally resolved correlation is statistically significant at P < 0.05; the ditiuse-only + non-spectral model is not.
Discussion
Here we have attempted to clarify the effects of neglecting directional and spectral irradiance in simulations of global ocean biological variables, specifically nitrate, total chlorophyll, phytoplankton relative abundances, and net primary production. Beginning with an ocean radiative transfer model that resolves both directional and spectral irradiances, and a companion atmospheric radiative transfer model that represents directional and spectral irradiance deriving from the sun and local atmospheric conditions, including absorbing gases, clouds, and aerosols, we sequentially remove the directional and spectral components, all the while ensuring that the exact same total irradiance begins at the surface, and then report the changes in the above described biological constituents in the oceans.
The results show consequential, but not drastic changes in global ocean biology from not resolving directional irradiance and treating all irradiance as diffuse: approximately 20% reductions in global annual mean nitrate and global annual median chlorophyll. Global net primary production changes are essentially negligible at 4%. However, there are important changes in the phytoplankton relative abundances, with cyanobacteria and coccolithophores increasing their relative abundances from 31 to 40% of the total combined while chlorophytes fall from 16% of the community (second highest behind diatoms) to 4% (second lowest next to Phaeocystis spp.) (Figure 5).
The changes in nitrate and chlorophyll due to simulation of exclusively diffuse irradiance are much larger in the tropics (between −10° and 10° latitude) and sub-tropics than in the high latitudes (poleward of 40° latitude). For example, the changes in nitrate and total chlorophyll in the Equatorial Pacific are −80 and −43%, respectively, compared to the Southern Ocean, where changes of −10 and −3%, respectively, are found (Figure 4). This is because in the high latitudes surface irradiances is already dominated by diffuse irradiance due to the presence of persistent clouds. Treating all the irradiance as diffuse here has less effect than in the lower latitudes, since there is already less direct irradiance to begin with.
We note that nitrate and total chlorophyll decline (approximately −20% each) while primary production increases by 4% in the diffuse-only scenario (Table 3). Diffuse-only transmittance produces more total irradiance in the water column, which increases primary production and diminishes surface nitrate through uptake. These relationships have been noted by Kim et al. (2015) in a study on the effects on CDOM on biology in the global oceans. Higher total irradiance results in higher community metabolic activity in the surface, especially grazing, which has the net effect of reducing both nitrate (through increased uptake) and surface chlorophyll (through grazing). Higher irradiance also produces higher carbon:chlorophyll ratio, further depressing surface chlorophyll.
In this diffuse-only scenario the increase in primary production is partially due to the fact that in the merger of direct and diffuse solar irradiance (Equations 25, 26) the spectral quality of the direct irradiance is retained. This means the full solar spectrum, most relevantly the shorter (blue) wavelengths from the formerly direct irradiance are added to the diffuse stream in the interest of conserving total irradiance at the surface. These blue spectra (both from the diffuse and the additional direct converted to diffuse) photolyze CDOC, reducing its concentration, and consequently stimulate primary production by enhancing the availability of blue irradiance for photosynthesis. This also suggests that diffuse pathways in the oceans provide more ambient light than the multiple angles of the direct irradiance each day. Although this may seem counter-intuitive because clouds are the most important cause of diffuse irradiance, it is important to remember that clouds also cause a reduction in total irradiance, whereas here the full direct+diffuse irradiance is conserved in the simulation, with the clear-sky direct added to the cloudy and clear diffuse. This is clearly unreasonable in nature but here we are testing modeling approaches for representing the ocean light field. A model that does not consider irradiance directionality but is given the correct total surface irradiance would be susceptible to the scenario described here.
Ocean biological concentrations and primary production are sensitive to the nature of spectral irradiance. The magnitude of the behavior of ocean biology to simulations using non-spectral radiative transfer is dependent upon which wavelength is selected. The shorter (bluer) wavelengths are associated with higher primary production and consequently lower nitrate and chlorophyll (Figure 6). The changes to nitrate and chlorophyll track one another for non-spectral transmittance in these bands. The best comparison with the fully spectrally-resolved model occurs at 500 nm, but even here there are substantial changes in phytoplankton composition, with reductions in the relative abundance of chlorophytes compensated by increases in cyanobacteria and coccolithophores (Figure 7). This suggests, however, that there is potentially an optimal choice for non-spectral transmittance, at least for global representations, and it likely lies near 500 nm. This in turn suggests support for use of diffuse attenuation coefficient for PAR, which is derived from the attenuation coefficient at 490 nm (Kd490) (Morel et al., 2007) or using Kd490 itself (e.g., Lee et al., 2005).
Non-spectral radiative transfer using bands higher than 550 nm show much larger impacts on primary production, nitrate, and chlorophyll. Here the association between nitrate and chlorophyll diverges, with nitrate increasing with increasing wavelength and chlorophyll decreasing.
Relative abundances of phytoplankton are highly sensitive to non-spectral choices of transmittance wavelength (Figure 7). To understand why, we refer to Figure 3, which shows the spectral dependences of the ocean optical constituents. The shorter (blue) wavelengths are where CDOC absorption is strongest, and using these bands for non-spectral attenuation maximizes the absorption by this constituent. It also maximizes the photolysis of CDOC (Equations 3, 4, and Figure 3), which in turn leads to more blue light available for phytoplankton absorption and growth. CDOC global concentrations for the 400 nm transmittance scenario are 46% lower than the spectrally-resolved case (data not shown). This explains the elevated primary production observed in this spectral region (Figure 8). The remaining blue to green light available after absorption by CDOC favors cyanobacteria and coccolithophores, which have strong specific spectral absorption in this region (Figure 3), facilitating their growth and increased relative abundances compared to chlorophytes. This explains the changes observed in relative abundances (Figure 7). As we approach longer wavelengths, water absorption dominates, extinguishing available light for all phytoplankton and leading to high nutrient availability due to reduced primary production. Additionally, CDOC increases because it is a poor absorber in red light and consequently its photolysis is reduced, further exacerbating the irradiance deficit. In this case, the phytoplankton groups with the fastest growing capabilities in nutrient-replenished conditions are advantaged over the other types such as cyanobacteria and coccolithophores, which are better suited for utilizing nutrients at low concentrations.
The combined diffuse-only/non-spectral simulation with 500 nm as the attenuation wavelength does not show compensation, but rather exacerbation of the differences observed in the individual diffuse and spectral scenarios. Nitrate differences exceed −30% (non-directional/spectral low) and chlorophyll is lower by −16%. Global chlorophyll even loses significance in the correlation with satellite data, in contrast to the directionally-spectrally-resolved model (Figure 10). Primary production is only modestly higher at 5.1%. Chlorophytes are the most impacted, dropping their relative abundances from 15.6% in the resolved model to only 2.3%, while cyanobacteria and coccolithophores increase. This suggests that changes in irradiance simulation excluding diffuse/direct differentiation and full spectral behavior spur a community functional switch from light-limitation to nutrient limitation, shifting phytoplankton groups from the high nitrate users like chlorophytes to the efficient users like cyanobacteria and coccolithophores. Although diatoms are the most demanding for nitrate, they are relatively unaffected by changes in the light fields by omitting directional and spectral light, because they are most abundant in the nutrient-rich regions to begin with (e.g., high latitudes and upwelling regions).
We emphasize that the differences using non-directional and non-spectral simulations compared to the three-stream model and optical characterizations used here does not imply that the resolved model is correct. The OASIM model and characterizations have been evaluated in several contexts, as explained in the Methods, but we have not and most likely cannot evaluate the model in all scenarios. We do assert that it is more comprehensive in its representations of directional and spectral irradiance and therefore technically more realistic than models that do not incorporate these characteristics. Natural irradiance is directional and spectral. A model that accounts for these characteristics of light is therefore at least nominally representative. However, this does not necessarily mean the model here is accurate or even complete. There are several optical constituents in the real oceans that are not considered here, such as suspended sediments/minerals, viruses and bacteria (Balch et al., 2002; Stramski et al., 2004), suspended desert dust (Wozniak and Stramski, 2004), and mycosporine-like amino acids (Moisan and Mitchell, 2001), as well as unaccounted effects such as polarization, bi-directionality among others.
We are unable to directly compare the model described here with more typical PAR/shortwave-diffuse attenuation coefficient models because of our inclusion of CDOC. The majority of models using diffuse attenuation coefficient only represent attenuation by water and phytoplankton, which are sometimes taken as climatologies from satellite ocean color. There is growing recognition of the importance of CDOC for ocean biological modeling (e.g., Xiu and Chai, 2014; Dutkiewicz et al., 2015; Kim et al., 2015), building on the pioneering work of Bissett et al. (1999). In our representation, CDOC not only affects the irradiance availability but is also photolyzed by spectral irradiance. Any comparison with other types of models requires us to make significant assumptions about how to handle CDOC photolysis and production. The assumptions themselves would likely be a more important consideration than the presence or absence of directionally and spectrally-resolved radiative transfer.
Our purpose here is to assist modelers in understanding and quantifying the advantages and disadvantages of explicitly incorporating directional and spectral effects of radiative transfer in models of ocean biology. Many models use a representation of PAR or shortwave radiation at the surface, and propagate irradiance as a function of an empirical or analytical diffuse attenuation coefficient using Beer-Lambert's law or another non-spectral, non-directional approach. This is especially true of the global models. It is true that many of these models also obtain very good representations of ocean biology and primary production (e.g., Moore et al., 2004; Dunne et al., 2013). It may be that the parameterization of the models and the radiative transfer implicitly incorporate the dominant effects required for simulation of ocean biology. However, it is also possible that missing explicit directional and spectral aspects of oceanic radiative transfer may impact our ability to simulate climate change scenarios where, for example, changes in clouds may lead to changes in direct and diffuse composition of surface irradiance, thereby affecting evaluations of future phytoplankton and carbon representations and feedbacks. This effort is intended to help modelers quantitatively evaluate the importance of the complexity of ocean radiative transfer and help inform decisions on future model developments.
Author Contributions
All authors listed, have made substantial, direct and intellectual contribution to the work, and approved it for publication.
Conflict of Interest Statement
The authors declare that the research was conducted in the absence of any commercial or financial relationships that could be construed as a potential conflict of interest.
The reviewer CM and handling Editor declared their shared affiliation, and the handling Editor states that the process nevertheless met the standards of a fair and objective review.
Acknowledgments
We thank the NASA/MERRA Project, the MODIS Ocean Color and Atmosphere Processing Teams, the MAREDAT data project, and the algorithm developers for PIC and aCDM. We thank Venetia Stuart, Bedford Institute of Oceanography, for providing Phaeocystis spp. spectral absorption coefficient data. We thank two reviewers for comments and suggestions. This work was supported by NASA PACE, S-NPP, and MAP Programs.
Supplementary Material
The Supplementary Material for this article can be found online at: https://www.frontiersin.org/article/10.3389/fmars.2016.00240/full#supplementary-material
References
Aas, E. (1987). Two-stream irradiance model for deep waters. Appl. Opt. 26, 2095–2101. doi: 10.1364/AO.26.002095
Ackleson, S. G., Balch, W. M., and Holligan, P. M. (1994). Response of water-leaving radiance to particulate calcite and chlorophyll a concentrations: a model for Gulf of Maine coccolithophore blooms. J. Geophys. Res. 99, 7483–7499. doi: 10.1029/93JC02150
Ahn, Y.-H., Bricaud, A., and Morel, A. (1992). Light backscattering efficiency and related properties of some phytoplankters. Deep Sea Res. 39, 1835–1855. doi: 10.1016/0198-0149(92)90002-B
Andrew, A. A., DelVecchio, R., Subramaniam, A., and Blough, N. V. (2013). Chromophoric dissolved organic matter (CDOM) in the Equatorial Atlantic Ocean: optical properties and their relation to CDOM structure and source. Mar. Chem. 148, 33–43. doi: 10.1016/j.marchem.2012.11.001
Arrigo, K., Dieckmann, G., Gosselin, M., Robinson, D., Fritsen, C., and Sullivan, C. (1995). High resolution study of the platelet ice ecosystem in McMurdo Sound, Antarctica: biomass, nutrient, and production profiles within a dense microalgal bloom. Mar. Ecol. Prog. Ser. 127, 255–268. doi: 10.3354/meps127255
Arrigo, K. R., Brown, Z. W., and Mills, M. M. (2014). Sea ice algal biomass and physiology in the Amundsen Sea, Antarctica. Elementa Sci. Anthropocene 2:000028. doi: 10.12952/journal.elementa.000028
Arrigo, K. R., and Sullivan, C. W. (1994). A high resolution bio-optical model of microalgal growth: tests using sea-ice algal community time-series data. Limnol. Oceanogr. 39, 609–631. doi: 10.4319/lo.1994.39.3.0609
Balch, W. M., Kilpatrick, K. A., and Trees, C. C. (1996). The 1991 coccolithophore bloom in the central North Atlantic. 1. Optical properties and factors affecting their distribution. Limnol. Oceanogr. 41, 1669–1683. doi: 10.4319/lo.1996.41.8.1669
Balch, W. M., Vaughn, J. M., Novotny, J. F., Drapeau, D. T., Goes, J. I., Booth, E., et al. (2002). Fundamental changes in light scattering associated with infection of marine bacteria by bacteriophage. Limnol. Oceanogr. 47, 1554–1561. doi: 10.4319/lo.2002.47.5.1554
Barlow, R. G., and Alberte, R. S. (1985). Photosynthetic characteristics of phycoerythrin-containing marine Synechococcus spp. Mar. Biol. 86, 63–74. doi: 10.1007/BF00392580
Bates, S. S., and Platt, T. (1984). Fluorescence induction as a measure of photosynthetic capacity in marine phytoplankton: response of Thalassiosira pseudonana (Bacillariophyceae) and Dunaliella tertiolecta (Chlorophyceae). Mar. Ecol. Prog. Ser. 18, 67–77. doi: 10.3354/meps018067
Behrenfeld, M. J., and Falkowski, P. G. (1997). Photosynthetic rates derived from satellite-based chlorophyll concentration. Limnol. Oceanogr. 42, 1–20. doi: 10.4319/lo.1997.42.1.0001
Ben-Amotz, A., and Gilboa, A. (1980). Cryptopreservation of marine unicellular algae. I. A survey of algae with regard to size, culture age, photosynthetic activity and chlorophyll - to - cell ratio. Mar. Ecol. Prog. Ser. 2, 157–161. doi: 10.3354/meps002157
Bidigare, R. R., and Ondrusek, M. E. (1996). Spatial and temporal variability of phytoplankton pigment distributions in the central equatorial Pacific Ocean. Deep Sea Res. II 43, 809–833. doi: 10.1016/0967-0645(96)00019-7
Bissett, W. P., Arnone, R., DeBra, S., Dieterle, D. A., Dye, D., Kirkpatrick, G. J., et al. (2005). Predicting the optical properties of the West Florida Shelf: resolving the potential impacts of a terrestrial boundary condition on the distribution of colored dissolved and particulate matter. Mar. Chem. 95, 199–233. doi: 10.1016/j.marchem.2004.09.007
Bissett, W. P., Carder, K. L., Walsh, J. J., and Dieterle, D. A. (1999). Carbon cycling in the upper waters of the Sargasso Sea: II. Numerical simulation of apparent and inherent optical properties. Deep Sea Res. Part I Oceanogr. Res. Pap. 46, 271–317. doi: 10.1016/S0967-0637(98)00063-6
Brand, L. E., Sunda, W. G., and Guillard, R. R. I. (1983). Limitation of marine phytoplankton reproductive rates by zinc, manganese, and iron. Limnol. Oceanogr. 28, 1182–1198. doi: 10.4319/lo.1983.28.6.1182
Brand, L. E., Sunda, W. G., and Guillard, R. R. L. (1986). Reductionof marine phytoplankton reproduction rates by copper and cadmium. J. Exp. Mar. Biol. Ecol. 96, 225–250. doi: 10.1016/0022-0981(86)90205-4
Bricaud, A., Ciotti, A. M., and Gentili, B. (2012). Spatial-temporal variations in phytoplankton size and colored detrital matter absorption at global and regional scales, as derived from twelve years of SeaWiFS data (1998–2009). Global. Biogeochem. Cycles 26, GB1010. doi: 10.1029/2010GB003952
Bricaud, A., Edhomme, A.-L., and Morel, A. (1988). Optical properties of diverse phytoplanktonic species: experimental results and theoretical interpretation. J. Plankton Res. 10, 851–873. doi: 10.1093/plankt/10.5.851
Bricaud, A., Babin, M., Claustre, H., Ras, J., and Tieche, F. (2010). Light absorption properties and absorption budget of Southeast Pacific waters. J. Geophys. Res. 115, C08009. doi: 10.1029/2009JC005517
Bricaud, A., and Morel, A. (1986). Light attenuation and scattering by phytoplanktonic cells: a theoretical modeling. Appl. Opt. 25, 571–580. doi: 10.1364/AO.25.000571
Bricaud, A., Morel, A., and Prieur, L. (1981). Absorption by dissolved organic matter of the sea (yellow substance) in the UV and visible domains. Limnol. Oceanogr. 26, 43–53. doi: 10.4319/lo.1981.26.1.0043
Buitenhuis, E. T., van der Wal, P., and de Baar, H. J. W. (2001). Blooms of Emiliana huxleyi are sinks of atmospheric carbon dioxide: a field and mesocosm study derived simulation. Glob. Biogeochem. Cycles 15, 577–587. doi: 10.1029/2000GB001292
Carder, K. L., Steward, R. G., Harvey, G. R., and Ortner, P. B. (1989). Marine humic and fulvic acids: their effects on remote sensing of ocean chlorophyll. Limnol. Oceanogr. 34, 68–81. doi: 10.4319/lo.1989.34.1.0068
Circio, J. A., and Petty, C. C. (1951). The near infrared absorption spectrum of liquid water. J. Opt. Soc. Am. 41, 302–308. doi: 10.1364/JOSA.41.000302
Coale, K. H., Wang, X., Tanner, S. J., and Johnson, K. S. (2003). Phytoplankton growth and biological response to iron and zinc addition in the Ross Sea and Antarctic Circumpolar Current along 170. Deep Sea Res. II 50, 635–653. doi: 10.1016/S0967-0645(02)00588-X
Conkright, M. E., Garcia, H. E., O'Brien, T. D., Locarnini, R. A., Boyer, T. P., Stephens, C., et al. (2002). “World Ocean Atlas 2001,” in NOAA Atlas NESDIS 52: Vol. 4, Nutrients, ed S. Levitus (Washington, DC: US Government Printing Office), 392.
Croot, P. L., Andersson, K., Ozturk, M., and Turner, D. R. (2004). The distribution and speciation of iron along 61E in the Southern Ocean. Deep Sea Res. II 51, 2857–2879. doi: 10.1016/j.dsr2.2003.10.012
Del Vecchio, R., Subramaniam, A., Uz, S. S., Ballabrera-Poy, J., Brown, C. W., and Blough, N. V. (2009). Decadal time-series of SeaWiFS retrieved CDOM absorption and estimated CO2 photoproduction on the continental shelf of the eastern United States. Geophys. Res. Lett. 36, L02602. doi: 10.1029/2008gl036169
Dickey, T. D., Kattawar, G. W., and Voss, K. J. (2011). Shedding new light on light in the ocean. Phys. Today 64, 44–49. doi: 10.1063/1.3580492
Doney, S. C., Lindsay, K., Fung, I., and John, J. (2006). Natural variability in a stable, 1000-Yr global coupled climate–carbon cycle simulation. J. Clim. 19, 3033–3054. doi: 10.1175/JCLI3783.1
Dunne, J. P., John, J. G., Shevliakova, E., Stouffer, R. J., Krasting, J. P., Malyshev, S. L., et al. (2013). GFDL's ESM2 Global Coupled Climate–carbon earth system models. Part II: carbon system formulation and baseline simulation characteristics. J. Clim. 26, 2247–2267. doi: 10.1175/JCLI-D-12-00150.1
Dutkiewicz, S., Hickman, A. E., Jahn, O., Gregg, W. W., Mouw, C. B., and Follows, M. J. (2015). Capturing optically important constituents and properties in a marine biogeochemical and ecosystem model. Biogeosciences 12, 4447–4481. doi: 10.5194/bg-12-4447-2015
Eppley, R. W., Rogers, J. N., and McCarthy, J. J. (1969). Half-saturation constants for uptake of nitrate and ammonium by marine phytoplankton. Limnol. Oceanogr.14, 912–920. doi: 10.4319/lo.1969.14.6.0912
Falkowski, P. G., Dubinsky, G. Z., and Wyman, K. (1985). Growth-irradiance relationships in phytoplankton. Limnol. Oceanogr. 30, 311–321. doi: 10.4319/lo.1985.30.2.0311
Fung, I. Y., Meyn, S. K., Tegen, I., Doney, S. C., John, J. G., and Bishop, J. K. B. (2000). Iron supply and demand in the upper ocean. Glob. Biogeochem. Cycles 14, 281–295. doi: 10.1029/1999GB900059
Furnas, M. J. (1991). Net in situ growth rates of phytoplankton in an oligotrophic, tropical shelf ecosystem. Limnol. Oceanogr. 36, 13–29. doi: 10.4319/lo.1991.36.1.0013
Gallegos, C. L., Werdell, P. J., and McClain, C. (2011). Long-term changes in light scattering in Chesapeake Bay inferred from Secchi depth, light attenuation, and remote sensing measurements. J. Geophys. Res. 116, C00H08. doi: 10.1029/2011JC007160
Garver, S. A., and Siegel, D. A. (1997). Inherent optical property inversion of ocean color spectra and its biogeochemical interpretation: I. Time series from the Sargasso Sea. J. Geophys. Res. 102, 18607–18625.
Gavis, J., Guillard, R. R. L., and Woodward, B. L. (1981). Cupric ion activity and the growth of phytoplankton clones isolated from different marine environments. J. Mar. Res. 39, 315–333.
Gnanadesikan, A., and Anderson, W. G. (2009). Ocean water clarity and the ocean general circulation in a coupled climate model. J. Phys. Oceanogr. 39, 314–332. doi: 10.1175/2008JPO3935.1
Gnanadesikan, A., Dixon, K., Griffies, S. M., Balaji, V., Barreiro, M., Beesley, J. A., et al. (2006). GFDL's CM2 global coupled climate models. Part II: The baseline ocean simulation. J. Clim. 19, 675–697. doi: 10.1175/JCLI3630.1
Goldman, J. C., and Glibert, P. M. (1982). Comparative rapid ammonium uptake by four species of marine phytoplankton. Limnol. Oceanogr. 27, 814–827. doi: 10.4319/lo.1982.27.5.0814
Gordon, H. R., Smyth, T. J., Balch, W. M., Boynton, G. C., and Tarran, G. A. (2009). Light scattering by coccoliths detached from Emiliania huxleyi. Appl. Opt. 48, 6059–6073. doi: 10.1364/AO.48.006059
Gregg, W. W. (2000). “A coupled ocean-atmosphere radiative model for global ocean biogeochemical models,” in NASA Global Modeling and Assimilation Series, Vol. 22, ed M. Suarez (Greenbelt, MD: NASA Technical Memorandum 2002-104606), 33.
Gregg, W. W. (2002). Tracking the SeaWiFS record with a coupled physical/biogeochemical/radiative model of the global oceans. Deep Sea Res. II 49, 81–105. doi: 10.1016/S0967-0645(01)00095-9
Gregg, W. W., and Carder, K. L. (1990). A simple spectral solar irradiance model for cloudless maritime atmospheres. Limnol. Oceanogr. 35, 1657–1675. doi: 10.4319/lo.1990.35.8.1657
Gregg, W. W., and Casey, N. W. (2007). Modeling coccolithophores in the global oceans. Deep Sea Res. II 54, 447–477. doi: 10.1016/j.dsr2.2006.12.007
Gregg, W. W., and Casey, N. W. (2009). Skill assessment of a spectral ocean-atmosphere radiative model. J. Mar. Syst. 76, 49–63. doi: 10.1016/j.jmarsys.2008.05.007
Gregg, W. W., Casey, N. W., and Rousseaux, C. S. (2013). “Global surface ocean carbon estimates in a model forced by MERRA,” in NASA Global Modeling and Assimilation Series, Vol. 31, ed M. Suarez (Greenbelt, MD: NASA Technical Memorandum 2012-104606), 32.
Gregg, W. W., Ginoux, P., Schopf, P. S., and Casey, N. W. (2003). Phytoplankton and iron: validation of a global three-dimensional ocean biogeochemical model. Deep Sea Res. II 50, 3143–3169. doi: 10.1016/j.dsr2.2003.07.013
Griffies, S. M., Harrison, M. J., Pacanowski, R. C., and Rosati, A. (2004). A Technical Guide to MOM4. GFDL Ocean Group Technical Report, Princeton.
Henson, S. A., Sarmiento, J. L., Dunne, J. P., Bopp, L., Lima, I., Doney, S. C., et al. (2010). Detection of anthropogenic climate change in satellite records of ocean chlorophyll and productivity. Biogeosciences 7, 621–640. doi: 10.5194/bg-7-621-2010
Humphrey, G. F. (1979). Photosynthetic characteristics of algae grown under constant illumination and light-dark regimes. J. Exp. Mar. Biol. Ecol. 40, 63–70. doi: 10.1016/0022-0981(79)90034-0
Jiang, M.-S., Chai, F., Dugdale, R. C., Wilkerson, F. P., Peng, T.-H., and Barber, R. T. (2003). A nitrate and silicate budget in the equatorial Pacific Ocean: a coupled physical–biological model study. Deep Sea Res. II 50, 2971–2996. doi: 10.1016/j.dsr2.2003.07.006
Karl, D. M., Bidigare, R. R., and Letelier, R. M. (2001). Long-term changes in plankton community structure and productivity in the North Pacific Subtropical Gyre: the domain shift hypothesis. Deep Sea Res. Part II 48, 1449–1470. doi: 10.1016/S0967-0645(00)00149-1
Key, R. M., Kozyr, A., Sabine, C. L., Lee, K., Wanninkhof, R., Bullister, J. L., et al. (2004). A global ocean carbon climatology: results from Global Data Analysis Project (GLODAP). Glob. Biogeochem. Cycles 18:GB4031. doi: 10.1029/2004GB002247
Kim, G. E., Pradal, M.-A., and Gnanadesikan, A. (2015). Quantifying the biological impact of surface ocean light attenuation by colored detrital matter in an ESM using a new optical parameterization. Biogeosciences 12, 5119–5132. doi: 10.5194/bg-12-5119-2015
Kirk, J. T. O. (1992). “The nature and measurement of the light environment in the ocean,” in Primary Productivity and Biogeochemical Cycles in the Sea, eds P. G. Falkowski and A. D. Woodhead (New York, NY: Springer Science+Business Media), 9–29.
Langdon, C. (1987). On the causes of interspecific differences in the growth–irradiance relationship for phytoplankton. Part I. A comparative study of the growth–irradiance relationship of three marine phytoplankton species: Skeletonema costatum, Olisthodiscus luteus, and Gonyaulax tamarensis. J. Plankton Res. 9, 459–482. doi: 10.1093/plankt/9.3.459
Laufkötter, C., Vogt, M., and Gruber, N. (2013). Long-term trends in ocean plankton production and particle export between 1960–2006. Biogeosciences 10, 7373–7393. doi: 10.5194/bg-10-7373-2013
Lee, Z., Du, K., Arnone, R., Liew, S., and Penta, B. (2005). Penetration of solar radiation in the upper ocean: a numerical model for oceanic and coastal waters. J. Geophys. Res. 110, C09019. doi: 10.1029/2004JC002780
Lee, Z., Wei, J., Voss, K., Lewis, M., Bricaud, A., and Huot, Y. (2015). Hyperspectral absorption coefficient of “pure” seawater in the range of 350–550 nm inverted from remote sensing reflectance. Appl. Opt. 54, 546–558. doi: 10.1364/AO.54.000546
Maier-Reimer, E., Kriest, I., Segschneider, J., and Wetzel, P. (2005). The HAMburg Ocean Carbon Cycle Model HAMOCC5.1, Berichte zur Erdsystemforschung 14/2005. Hamburg: Max Planck-Institut für Meteorologie.
Manizza, M., Le Quéré, C., Watson, A. J., and Buitenhuis, E. T. (2005). Bio-optical feedbacks among phytoplankton, upper ocean physics and sea-ice in a global model. Geophys. Res. Lett. 32, L05603. doi: 10.1029/2004GL020778
Marinov, I., Doney, S. C., and Lima, I. D. (2010). Response of ocean phytoplankton community structure to climate change over the 21st century: partitioning the effects of nutrients, temperature and light. Biogeosciences 7, 3941–3959. doi: 10.5194/bg-7-3941-2010
Maritorena, S., Hembise, O., Fanton d'Andon, A., Mangin, A., and Siegel, D. A. (2010). Merged satellite ocean color data products using a bio-optical model: characteristics, benefits and issues. Remote Sens. Environ. 114, 1791–1804. doi: 10.1016/j.rse.2010.04.002
Maritorena, S., and Siegel, D. A. (2005). Consistent merging of satellite ocean color data sets using a bio-optical model. Remote Sens. Environ. 94, 429–440. doi: 10.1016/j.rse.2004.08.014
Masotti, I., Moulin, C., Alvain, S., Bopp, L., Tagliabue, A., and Antoine, D. (2011). Large-scale shifts in phytoplankton groups in the Equatorial Pacific during ENSO cycles. Biogeosciences 8, 539–550. doi: 10.5194/bg-8-539-2011
Maul, G. A. (1985). Introduction to Satellite Oceanography. Boston, MA: Martinus Nijhoff Publishers.
Mobley, C. D., Sundman, L. K., Bissett, W. P., and Cahill, B. (2009). Fast and accurate irradiance calculations for ecosystem models. Biogeosciences Discuss. 6, 10625–10662. doi: 10.5194/bgd-6-10625-2009
Moisan, T. A., and Mitchell, B. G. (2001). UV absorption by mycosporine-like amino acids in Phaeocystis antarctica Karsten induced by photosynthetically available radiation. Mar. Biol. 138, 217–227. doi: 10.1007/s002270000424
Moore, J. K., Doney, S. C., and Lindsay, K. (2004). Upper ocean ecosystem dynamics and iron cycling in a global three-dimensional model. Glob. Biogeochem. Cycles 18, 1–21. doi: 10.1029/2004GB002220
Morel, A. (1987). Chlorophyll-specific scattering coefficient of phytoplankton. A simplified theoretical approach. Deep Sea Res. 34, 1093–1105. doi: 10.1016/0198-0149(87)90066-5
Morel, A. (1988). Optical modeling of the upper ocean in relation to its biogenous matter content (Case I waters). J. Geophys. Res. 93, 10749–10768. doi: 10.1029/JC093iC09p10749
Morel, A., and Bricaud, A. (1981). Theoretical results concerning light absorption in a discrete medium, and application to specific absorption of phytoplankton. Deep Sea Res. 28, 1375–1393. doi: 10.1016/0198-0149(81)90039-X
Morel, A., Gentili, B., Claustre, H., Babin, M., Bricaud, A., Ras, J., et al. (2007). Optical properties of the “clearest” natural waters. Limnol. Oceanogr. 52, 217–229. doi: 10.4319/lo.2007.52.1.0217
Organelli, E., Bricaud, A., Antoine, D., and Matsuoka, A. (2014). Seasonal dynamics of light absorption by chromophoric dissolved organic matter (CDOM) in the NW Mediterranean Sea (BOUSSOLE Site). Deep Sea Res. I 191, 72–85. doi: 10.1016/j.dsr.2014.05.003
Palmer, J. R., and Totterdell, I. J. (2001). Production and export in a global ocean ecosystem model. Deep Sea Res. I 48, 1169–1198. doi: 10.1016/S0967-0637(00)00080-7
Peperzak, L., Colijn, F., Koeman, R., Gieskes, W. W. C., and Joordens, J. C. A. (2003). Phytoplankton Sinking Rates in the Rhine Region of Freshwater Influence. J. Plankton Res. 25, 365–383. doi: 10.1093/plankt/25.4.365
Perry, M. J., Talbot, M. C., and Alberte, R. S. (1981). Photoadaptation in marine phytoplankton: response of the photosynthetic unit. Mar. Biol. 62, 91–101. doi: 10.1007/BF00388170
Pope, R. M., and Fry, E. S. (1997). Absorption spectrum (380–700 nm) of pure water. II. Integrating cavity measurements. Appl. Opt. 46, 8710–8723. doi: 10.1364/AO.36.008710
Reader, H. E., and Miller, W. L. (2012). Variability of carbon monoxide and carbon dioxide apparent quantum yield spectra in three coastal estuaries of the South Atlantic Bight. Biogeosciences 9, 4279–4294. doi: 10.5194/bg-9-4279-2012
Reader, H. E., and Miller, W. L. (2014). The efficiency and spectral photon dose dependence of photochemically induced changes to the bioavailability of dissolved organic carbon. Limnol. Oceanogr. 59, 182–194. doi: 10.4319/lo.2014.59.1.0182
Rienecker, M. M., Suarez, M. J., Gelaro, R., Todling, R., Bacmeister, J., Liu, E., et al. (2011). MERRA - NASA's modern-era retrospective analysis for research and applications. J. Clim. 24, 3624–3648. doi: 10.1175/JCLI-D-11-00015.1
Robinson, D. H., Arrigo, K. R., Kolber, Z., Gosselin, M., and Sullivan, C. W. (1998). Photophysiological evidence of nutrient limitation of platelet ice algae in McMurdo Sound, Antarctica. J. Phycol. 34, 788–797. doi: 10.1046/j.1529-8817.1998.340788.x
Roesler, C. S., Perry, M. J., and Carder, K. L. (1989). Modeling in situ phytoplankton absorption from total absorption spectra in productive inland marine waters. Limnol. Oceanogr. 34, 1510–1523. doi: 10.4319/lo.1989.34.8.1510
Romanou, A., Gregg, W. W., Romanski, J., Kelley, M., Bleck, R., Healy, R., et al. (2013). Natural air-sea flux of CO2 in simulations of the NASA-GISS climate model: sensitivity to the physical ocean model formulation. Ocean Model. 66, 26–44. doi: 10.1016/j.ocemod.2013.01.008
Romanou, A., Romanski, J., and Gregg, W. W. (2014). Natural ocean carbon cycle sensitivity to parameterizations of the recycling in a climate model. Biogeosciences 11, 1137–1154. doi: 10.5194/bg-11-1137-2014
Rousseaux, C. S., and Gregg, W. W. (2012). Climate variability and phytoplankton composition in the Pacific Ocean. J. Geophys. Res. 117, C10006. doi: 10.1029/2012JC008083
Rousseaux, C. S., and Gregg, W. W. (2015). Recent decadal trends in global phytoplankton composition. Glob. Biogeochem. Cycles 29, 1674–1688. doi: 10.1002/2015GB005139
Sakshaug, E., and Andresen, K. (1986). Effect of light regime upon growth rate and chemical composition of a clone of Skeletonema costatum from the Trondheimsfjord, Norway. J. Plankton Res. 8, 619–637.
Sathyendranath, S., Lazzara, L., and Prieur, L. (1987). Variations in the spectral values of specific absorption of phytoplankton. Limnol. Oceanogr. 32, 403–415. doi: 10.4319/lo.1987.32.2.0403
Sathyendranath, S., and Platt, T. (1988). The spectral irradiance field at the surface and in the interior of the ocean: a model for applications in oceanography and remote sensing. J. Geophys. Res. 93, 9270–9280. doi: 10.1029/JC093iC08p09270
Sathyendranath, S., and Platt, T. (1989). Computation of aquatic primary production: extended formalism to include effect of angular and spectral distribution of light. Limnol. Oceanogr. 34, 188–198. doi: 10.4319/lo.1989.34.1.0188
Schoemann, V., Becquevort, S., Stefels, J., Rousseau, V., and Lancelot, C. (2005). Phaeocystis blooms in the global ocean and their controlling mechanisms: a review. J. Sea Res. 53, 43–66. doi: 10.1016/j.seares.2004.01.008
Schopf, P. S., and Loughe, A. (1995). A reduced gravity isopycnal ocean model: hindcasts of El Nino. Monthly Weather Rev. 123, 2839–2863.
Siegel, D. A., Maritorena, S., Nelson, N. B., Hansell, D. A., and Lorenzi-Kayser, M. (2002). Global distribution and dynamics of colored dissolved and detrital organic materials. J. Geophys. Res. 107, 3228. doi: 10.1029/2001JC000965
Smith, R. C., and Baker, K. S. (1981). Optical properties of the clearest natural waters (200–800 nm). Appl. Opt. 20, 177–184. doi: 10.1364/AO.20.000177
Stedmon, C. A., Thomas, D. N., Papadimitriou, S., Granskog, M. A., and Dieckmann, G. S. (2011). Using fluorescence to characterize dissolved organic matter in Antarctic sea ice brines. J. Geophys. Res. 116:G03027. doi: 10.1029/2011JG001716
Stramski, D., Boss, E., Bogucki, D., and Voss, K. J. (2004). The role of seawater constituents in light backscattering in the ocean. Prog. Oceanogr. 61, 27–56. doi: 10.1016/j.pocean.2004.07.001
Stuart, V., Sathyendranath, S., Head, E. J. H., Platt, T., Irwin, B., and Maass, H. (2000). Bio-optical characteristics of diatom and prymnesiophyte populations in the Labrador Sea. Mar. Ecol. Prog. Ser. 201, 91–106. doi: 10.4319/lo.1996.41.8.1669
Subba Rao, D. V. (1981). Growth response of marine phytoplankton to selected concentrations of trace metals. Bot. Mar. 24, 369–379. doi: 10.1515/botm.1981.24.7.369
Sunda, W. G., and Huntsman, S. A. (1995). Iron uptake and growth limitation in oceanic and coastal Phytoplankton. Mar. Chem. 50, 189–206. doi: 10.1016/0304-4203(95)00035-P
Tang, K. W., Smith, W. O. Jr., Shields, A. R., and Elliott, D. T. (2009). Survival and recovery of Phaeocystis antarctica (Prymnesiophyceae) from prolonged darkness and freezing. Proc. R. Soc. B Biol. Sci. 276, 81–90. doi: 10.1098/rspb.2008.0598
Tungazara, C., Rousseau, V., Brion, N., Lancelot, C., Gichuki, J., Baeyens, W., et al. (2003). Contrasting nitrogen uptake by diatom and Phaeocystis-dominated phytoplankton assemblages in the North Sea. J. Exp. Mar. Biol. Ecol. 292, 19–41. doi: 10.1016/S0022-0981(03)00145-X
Tzortziou, M., Osburn, C. L., and Neale, P. J. (2007). Photobleaching of dissolved organic material from a tidal marsh-estuarine system of the chesapeake bay. Photochem. Photobiol. 83, 782–792. doi: 10.1111/j.1751-1097.2007.00142.x
Uitz, J., Claustre, H., Gentili, B., and Stramski, D. (2010). Phytoplankton class-specific primary production in the world's oceans: seasonal and interannual variability from satellite observations. Glob. Biogeochem. Cycles 24:GB3016. doi: 10.1029/2009GB003680
Vaillancourt, R. D., Brown, C. W., Guillard, R. R. L., and Balch (2004). Light backscattering properties of marine phytoplankton: relationships to cell size, chemical composition, and taxonomy. J. Plankton Res. 26, 191–212. doi: 10.1093/plankt/fbh012
van Hilst, C. M., and Smith, W. O. Jr. (2002). Photosynthesis/irradiance relationships in the Ross Sea, Antarctica, and their control by phytoplankton assemblage composition and environmental factors. Mar. Ecol. Prog. Ser. 226, 1–12. doi: 10.3354/meps226001
Vogt, M., O'Brien, C., Peloquin, J., Schoemann, V., Breton, E., Estrada, M., et al. (2012). Global marine plankton functional type biomass distributions: Phaeocystis spp. Earth Syst. Sci. Data 4, 107–120. doi: 10.5194/essd-4-107-2012
Whitmire, A. L., Pegau, W. S., Karp-Boss, L., Boss, E., and Cowles, T. J. (2010). Spectral backscattering properties of marine phytoplankton cultures. Opt. Expr. 18, 15073–15093. doi: 10.1364/oe.18.015073
Wozniak, S. B., and Stramski, D. (2004). Modeling the optical properties of mineral particles suspended in seawater and their influence on ocean reflectance and chlorophyll estimation from remote sensing algorithms. Appl. Opt. 43, 3489–3503. doi: 10.1364/AO.43.003489
Wyman, M., and Fay, P. (1986). Underwater light climate and the growth and pigmentation of planktonic blue-green algae (Cyanobacteria) I. The influence of light quantity. Proc. R. Soc. Lond. 227, 367–380. doi: 10.1098/rspb.1986.0027
Xiu, P., and Chai, F. (2014). Connections between physical, optical and biogeochemical processes in the Pacific Ocean. Prog. Oceanogr. 122, 30–53. doi: 10.1016/j.pocean.2013.11.008
Yacobi, Y. Z., Alberts, J. J., Takács, M., and Michelle McElvaine, M. (2003). Absorption spectroscopy of chromophoric dissolved organic carbon in Georgia (USA) rivers: the impact of molecular size distribution. J. Limnol. 62, 41–46. doi: 10.4081/jlimnol.2003.41
Zhao, J., Barnes, B., Melo, N., English, D., Lapointe, B., Muller-Karger, F., et al. (2013). Assessment of satellite-derived diffuse attenuation coefficients and euphotic depths in south Florida coastal waters. Remote Sens. Environ. 131, 38–50. doi: 10.1016/j.rse.2012.12.009
Keywords: spectral irradiance, directional irradiance, global phytoplankton, radiative transfer, global models
Citation: Gregg WW and Rousseaux CS (2016) Directional and Spectral Irradiance in Ocean Models: Effects on Simulated Global Phytoplankton, Nutrients, and Primary Production. Front. Mar. Sci. 3:240. doi: 10.3389/fmars.2016.00240
Received: 20 July 2016; Accepted: 04 November 2016;
Published: 22 November 2016.
Edited by:
Susanne Menden-Deuer, University of Rhode Island, USAReviewed by:
Oliver Zielinski, University of Oldenburg, GermanyColleen Mouw, University of Rhode Island, USA
Copyright © 2016 Gregg and Rousseaux. This is an open-access article distributed under the terms of the Creative Commons Attribution License (CC BY). The use, distribution or reproduction in other forums is permitted, provided the original author(s) or licensor are credited and that the original publication in this journal is cited, in accordance with accepted academic practice. No use, distribution or reproduction is permitted which does not comply with these terms.
*Correspondence: Watson W. Gregg, watson.gregg@nasa.gov