Determination of Respiration Rates in Water with Sub-Micromolar Oxygen Concentrations
 Emilio Garcia-Robledo
 Sergey Borisov2
 - 1Microbiology Section, Department of Bioscience, Aarhus University, Aarhus, Denmark
- 2Institute of Analytical Chemistry and Food Chemistry, Graz University of Technology, Graz, Austria
It is crucial for our study and understanding of element transformations in low-oxygen waters that we are able to reproduce the in situ conditions during laboratory incubations to an extent that does not result in unacceptable artifacts. In this study, we have explored how experimental conditions affect measured rates of O2 consumption in low-O2 waters from the anoxic basin of Golfo Dulce (Costa Rica) and oceanic waters off Chile-Peru. High-sensitivity optode dots placed within all-glass incubation containers allowed for high resolution O2 concentration measurements in the nanomolar and low μM range and thus also for the determination of rates of oxygen consumption by microbial communities. Consumption rates increased dramatically (from 3 and up to 60 times) by prolonged incubations, and started to increase after 4–5 h in surface waters and after 10–15 h in water from below the upper mixed layer. Estimated maximum growth rates during the incubations suggest the growth of opportunistic microorganism with doubling times as low as 2.8 and 4.6 h for the coastal waters of Golfo Dulce (Costa Rica) and oceanic waters off Chile and Peru, respectively. Deoxygenation by inert gas bubbling led to increases in subsequently determined rates, possibly by liberation of organics from lysis of sensitive organisms, particle or aggregate alterations or other processes mediated by the strong turbulence. Stirring of the water during the incubation led to an about 50% increase in samples previously deoxygenated by bubbling, but had no effect in untreated samples. Our data indicate that data for microbial activity obtained by short incubations of minimally manipulated water are most reliable, but deoxygenation is a prerequisite for many laboratory experiments, such as determination of denitrification rates, as O2 contamination by sampling is practically impossible to avoid.
Introduction
Element transformations in Oxygen Minimum Zones (OMZs) are very dependent on the local O2 concentrations, and it has for example been shown that O2 concentrations below 0.5 μmol L−1 may be strongly inhibitory for denitrification (Dalsgaard et al., 2014; Bristow et al., 2016), but that sub-micromolar O2 concentrations still allow for high rates of ammonium and nitrite oxidation (Kalvelage et al., 2011, 2015; Füssel et al., 2012; Beman et al., 2013; Bristow et al., 2016). It is thus crucial for our study and understanding of element transformations in OMZ waters that we know exactly which O2 regime is found in situ, and that we can reproduce this in the laboratory when analyzing rates of element transformations. STOX (Switchable Trace Oxygen) sensors have since 2007 been used quite extensively to analyze in situ O2 concentrations down to the few nanomolar range (<20 nM; Revsbech et al., 2009, 2011; Thamdrup et al., 2012), and most OMZ core regions analyzed have had undetectable O2 concentrations. However, there are also examples of OMZ cores having layers of water containing O2 in very low concentrations that are surrounded by anoxic waters (Tiano et al., 2014a; Larsen et al., 2016).
It is very difficult to handle anoxic or near-anoxic ocean water without some O2 contamination, and it is therefore often necessary to remove the O2 contamination by saturation with inert gases before incubations when in situ conditions are simulated. Water that is anoxic in situ thus generally contain about 1 μmol O2 L−1 when brought to the deck by PVC Niskin bottles (E. Garcia-Robledo, unpublished data), and the O2 concentrations may be further elevated by laboratory manipulation (De Brabandere et al., 2012). STOX sensors may be used to monitor O2 concentrations in such incubations, and thus also to measure rates of O2 consumption. Trace oxygen optical sensors (optodes) with a dynamic range from 1 to 1000 nmol O2 L−1 offer an alternative to STOX sensors (Lehner et al., 2015). The optical sensors are simpler to use as they can be made with much more reproducible characteristics than the STOX sensors. Optode dots are placed inside glass incubation containers and can be read through the glass wall, lowering the risk of O2 contamination as compared to the use of electrochemical sensors.
Incubation of low-O2 oceanic waters combined with O2 monitoring by STOX sensors or optodes have, however, shown that so-called bottle effects (e.g., Zobell and Anderson, 1936; Robinson and Williams, 2005) may strongly influence the microbial activity. During the incubation of low activity deep waters from the ETNP-OMZ a significant increase in the oxygen consumption rates was thus measured after about 20 h of incubation at 12°C (Tiano et al., 2014b). In more active shallow waters much faster effects can be expected due to the higher activity and higher temperatures (Massana et al., 2001). Medium turbulence (stirring) has been suspected to have a strong influence on O2 uptake by bottle incubations at low O2, presumably due to diffusion limitation of microorganisms living in particles (Kalvelage et al., 2015), but comparison of incubations at low O2 concentrations with and without stirring and otherwise identical conditions are lacking. It is also possible that the deoxygenation procedure by inert gas bubbling, which is now routinely used before bottle or vial incubation when anoxic metabolism is investigated on OMZ core samples, affects all kinds of metabolism by breaking up aggregates and also by lysing fragile organisms.
In the investigation presented here, we have analyzed the kinetics of O2 respiration by bottle incubation. We have done this with water from various depths and temperatures. We have compared incubations with continuous stirring, stirring for 5% of the time, and no stirring. Some water samples were incubated without deoxygenation by bubbling to avoid this rather harsh treatment and these incubations were compared with incubations exposed to the usual deoxygenation procedure. Samples from both Golfo Dulce and the OMZ off Peru were analyzed.
Materials and Methods
Sampling Sites, Sample Collection, and General Incubation Description
Water samples were taken by hand-operated 3 × 8-L Niskin Bottles at Station GD-1 and GD-2 (Figure 1; Thamdrup et al., 1996; Ferdelman et al., 2006) in Golfo Dulce from the 19th of January to the 1st of February 2015 (Table 1). Oxygen profiles in the water column were measured by a STOX sensor mounted on an in situ STOX electronics unit (Unisense A/S, Denmark) and attached to a custom-built data collection and power supply unit that also monitored depth (pressure) and temperature. The water from the Niskin bottles was transferred to N2-flushed 20-L or 10-L Blue Cap bottles immediately after reaching the deck using Tygon tubing. The bottle was closed with a butyl rubber stopper and brought to the laboratory within 2 h of sampling, during which time the bottles were shielded from light and temperature extremes by wet towels.
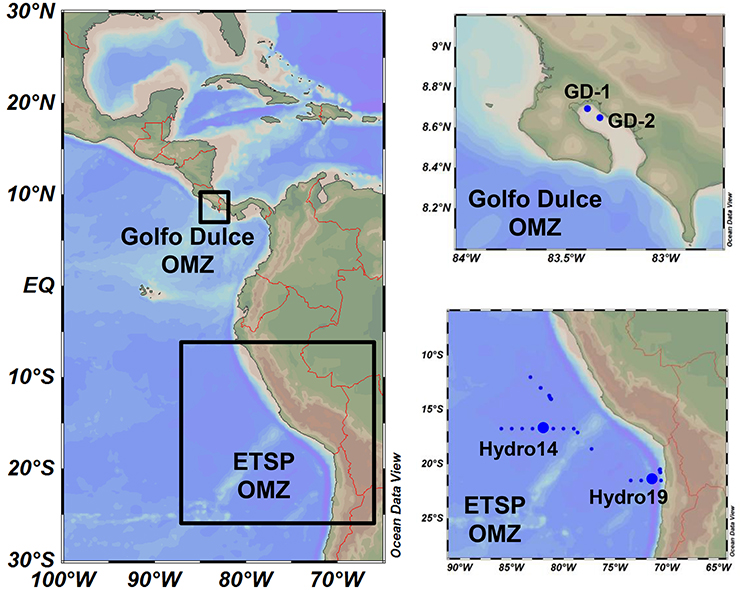
Figure 1. Map of the study area and sampling stations. Study areas were located in the coastal Golfo Dulce (Costa Rica, January 2015) and the Eastern Tropical South Pacific (ETSP, July 2013), with four main sampling stations: GD-1 and GD-2 in Golfo Dulce and Hydro 14 and 19 off Chile and Peru.
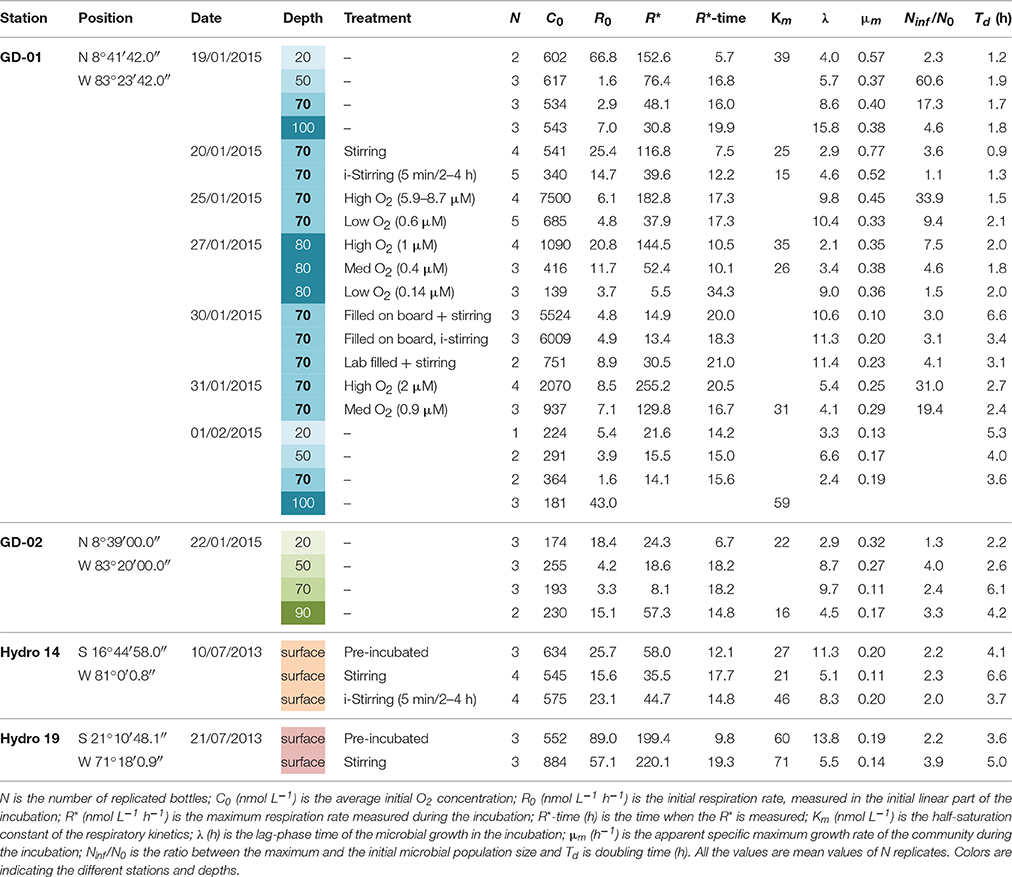
Table 1. Stations, dates, depths, and data of the samplings and experiments carried out in Golfo Dulce (Costa Rica) and in the ETSP.
Water samples were also collected from the OMZ off Peru-Chile during a cruise with the icebreaker Nathaniel B. Palmer during the 10th and 21st of July 2013 at stations Hydro 14 and 19 (Figure 1, Table 1). The ship was equipped with a Seabird SBE-911 CTD system and a SBE 43 oxygen sensor. Seawater samples were collected using a Niskin bottle rosette connected to the CTD, and the water was transferred to N2 flushed 20-L blue-cap bottles immediately after sampling and brought to a coldroom.
All incubations were performed as described previously by Tiano et al. (2014b) in modified 1-L Blue-Cap glass bottles allowing O2 monitoring by both STOX sensors (Tiano et al., 2014b) and high-sensitivity optodes (Lehner et al., 2015; Gong et al., 2016). Immediately after reaching the laboratory, the O2 present in the water was removed by bubbling with a N2: 0.05% CO2 mixture for 20 min. The gas flow was not measured but we estimated a flow between 5 and 10 L/min. The water was siphoned through glass tubes (connected by the shortest possible Tygon joints) to continuously N2-flushed 1-L all-glass incubation bottles. The water was left to overflow and the bottles were closed using glass stoppers to avoid any O2 leakage from polymers. Glass-coated magnets (2-cm long, Fischer Scientific) were inserted into each bottle before the filling procedure. The bottles were placed on custom-made magnetic stirrers (55 rpm), and immersed in a temperature controlled bath. All samples were incubated at 17°C which was within 1.5°C for most sampled depths but 2–3°C cooler for the 50 m sample at both Golfo Dulce stations and >10°C cooler for a 20 m sample in Golfo Dulce where the in situ temperature was 28°C (Figure 2). The initial O2 concentrations measured after the transfer of the samples to the bottles were variable but were adjusted with small volumes of O2 saturated water to reach concentrations ranging from 100 to 1000 nmol O2 L−1 (Table 1). Only the optodes in combination with the “Lumos” optoelectronics (Lehner et al., 2015) were used for the respiration determinations shown below. The bottles were thoroughly rinsed with 0.1 M NaOH, 0.1 M HCl and distilled water before and after each incubation.
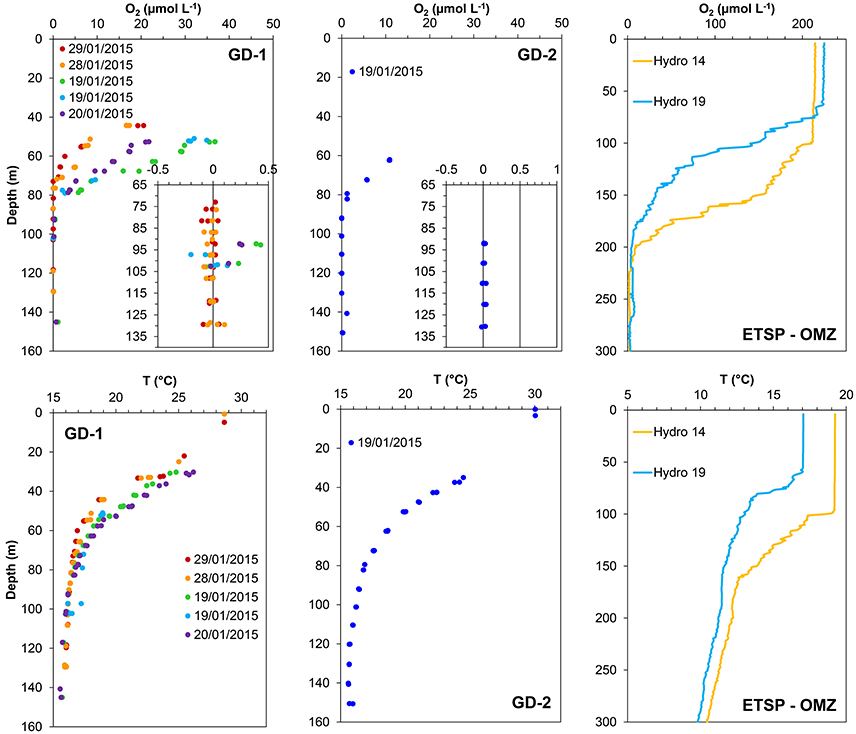
Figure 2. Oxygen and temperature profiles measured at the sampled stations in Golfo Dulce (Costa Rica; GD-1 and GD-2) and in the East Tropical South Pacific Oxygen Minimum zone (ETSP-OMZ) off Chile-Peru (Stations Hydro 14 and Hydro 19). Oxygen was measured using STOX sensors in Golfo Dulce and SBE43 sensors in the ETSP-OMZ. Note the scale differences between locations.
Changes in the O2 concentration during the incubation were monitored to calculate the oxygen consumption rates of the water samples collected at both OMZs. In addition, a series of experiments were performed in order to evaluate the effect of experimental manipulations on the O2 consumption rates being measured.
Experimental Manipulations and Measurements
O2 Consumption Profiles
Water samples from different depths (20, 50, 70, and 100 m) were collected at station GD-1 (19/01/2015 and 01/02/2015) and GD-2 (22/01/2015) in order to characterize the water column metabolism at both stations. The water was brought to the laboratory and treated as described above. Initial oxygen concentrations after filling up the bottles were not modified and values of 0.2–0.5 μmol O2 L−1 were reached.
Effect of Initial O2 Concentration
Water samples from 70 m depth at station GD-1 were collected on the 25th and 31st of January 2015. After deoxygenation by bubbling, the initial concentrations in the bottles were adjusted to different values (~7.5, 2, 0.9, and 0.6 μmol O2 L−1) by the injection of different volumes of oxygen saturated water from the same depth. This specific experiment was designed to show the effect of O2 concentration on O2 consumption rates, but also other experiments with 70 m GD-1 water (Table 1) contributed to elucidate the effect of O2 concentration.
Effect of Stirring
Water samples from 70 m depth at station GD-1 (Golfo Dulce) were collected on January 20, 2015 and from the surface at station Hydro 14 (ETSP) on July 10, 2013 (Figure 1, Table 1). In both cases, one set of randomly chosen bottles were treated and incubated as described above, starting with initial concentrations around 0.5 μmol O2 L−1 while stirring by glass coated magnets was applied throughout the incubation. In a parallel set of bottles the stirring was switched off 5 min after placing the bottles in the incubator and stirring was subsequently only turned on for 2 min for every 2–4 h. The periodic stirring was performed to ensure homogeneous O2 concentration inside the bottles.
Effect of Pre-incubation and Confinement
The effect of the confinement and the possible stimulation of rates by the surfaces in the incubation bottles were tested in a set of experiments at stations Hydro 14 and 19 (ETSP, Table 1). Water samples from surface waters were collected, transferred to the 20-L glass bottle and deoxygenated as described above. After 20 min of bubbling, one set of bottles (n = 3–4, Table 1) were filled and treated as described above (with stirring). The bubbling was then stopped and the remaining water was left in the 20-L Blue-Cap bottle for a “pre-incubation” time of 7–9 h. Another set of 1-L bottles (Pre-incubated, n = 3, Table 1) were filled after this pre-incubation and incubated in the same way as those that were filled immediately after deoxygenation.
Effect of Deoxygenation by Bubbling
Golfo Dulce water from 70 m (Station GD-1) was used to investigate the effect of laboratory manipulation including deoxygenation on O2 consumption rates. On January 31, 2015, water was collected at 70 m and a series of bottles (n = 6) were filled directly from the Niskin bottle while the headspace was flushed with N2 to minimize O2 contamination. In the laboratory, one set of bottles (n = 3) was incubated with intermittent stirring (Filled onboard, i-Stirring) and the remaining three bottles were incubated with continuous stirring (Filled onboard, +Stirring). In addition, one 10-L bottle was also filled up onboard and treated the usual way with laboratory deoxygenation, filling up another set of bottles (n = 2, Lab filled +Stirring).
Results
In situ O2 Profiles
Some O2 and temperature profiles measured at Stations GD-1 and GD-2 in Golfo Dulce are shown in Figure 2. The O2 profile varied considerably during the sampling period. For example, measurements taken at 50 m depth at station GD-1 changed from 32 μmol O2 L−1 and 20°C on the 19th to 6.5 μmol O2 L−1 and 17.5°C on the 29th of January 2015. However, water at 70 m was always oxic (from 1.3 to 15 μmol O2 L−1), and at 100 m it was always anoxic. Only surface water (5 m) from off Chile-Peru was analyzed, and here the O2 concentrations were always close to air saturation (~220 μmol O2 L−1).
Time Course of O2 Depletion during Incubations
As observed earlier (Tiano et al., 2014a) the decrease in O2 concentration (corresponding to the respiration rate) during bottle incubations is not linear during prolonged periods of time. For water retrieved from 100 m depth in Golfo Dulce the depletion curve was linear until about 15 h after the start of the incubation, at 70 m until about 9 h, at 50 m until about 6 h, and at 20 m it became non-linear after about 4 h (Figure 3). It is thus clear that microbial metabolism somehow increased during the incubations, and we tried to model this increase by assuming (1) a lag phase (λ) before the increase, (2) growth of the respiring population with a maximum specific growth (μm) under non-limiting O2 concentration, and a respiration rate that followed saturation kinetics as described in Tiano et al. (2014b):
Where R(C) is the respiration rate as a function of the Oxygen concentration (C), Rmax is the maximum respiration rate measured at saturation O2 concentration and Km is the apparent half-saturation constant, defined as the O2 concentration where half of Rmax is reached.
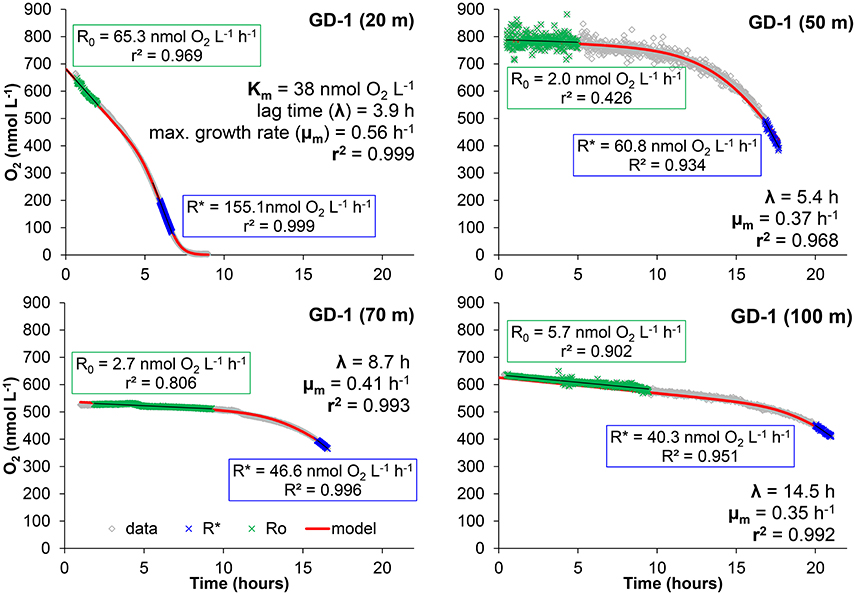
Figure 3. Examples of the bottle effect measured in Golfo Dulce at different depths (19 of January 2015, Station GD-1). Data were modeled as described in the text in order to calculate: initial respiration rate (R0) and maximum respiration rate during the incubation (R*), half saturation constant (Km), lag-phase (λ), and maximum growth rate (μm) of the microbial activity in the bottles during the incubation.
Equation (1) can be integrated with time to fit the evolution of the O2 concentration during incubations reaching limiting O2 levels and going to zero. The lower part of the curve can thus be modeled as:
Or, resolving the equation as finite intervals:
With this equation it is assumed that both Rmax and Km are constant throughout the incubation implying that no significant bacterial growth or metabolism enhancement occurs during the incubation. However, the so called “bottle effect” may produce an evident deviation from linear rates at oxygen concentrations above the limiting oxygen range due to significant increases in bacterial abundance and/or activity. The respiration rate is then a function of both the oxygen concentration and the active population size.
Assuming that the microbial population structure is constant and no significant changes in the expression of different terminal oxidases occurs during the incubation, we can assume that the apparent Km-values and the respiration rate per cell are constant with time. The variable kinetic parameter is then Rmax, which we could express as:
Rcell is the respiration rate per cell and it is assumed to be constant throughout the incubation. N(t) is the number of active cells in the incubation chamber as a function of time. If a significant increase in respiration rates is detected, assuming that Rcell is constant, the increase would be caused by an increase in the number of active cells.
During the first hours of the incubation, the oxygen consumption would correspond to the initial respiration rates (R0) carried out by the initial population size (N0). If Rcell is not a function of time, it can be calculated as:
And the non-oxygen-limited respiration rate at time t is then:
The bacterial growth can be expressed by the logistic growth model described by Zwietering et al. (1990):
Where: μm is the specific growth rate, λ is the lag time, and A is the amplitude of the growth, being defined as the logarithm of the ratio between the maximum cell abundance (Nmax) and the initial abundance (N0):
Combining Equations (6) and (7):
And, combining Equations (3) and (9):
which describes the evolution of the O2 concentration as a function of: time, the kinetic parameters of the respiratory process and the effective bacterial growth occurring during the incubation period.
The aerobic community can increase in size or activity as long as oxygen is present. Therefore, the maximum community size is approached just before the oxygen concentration becomes limiting. The O2 consumption measured just before the bending of the curve caused by O2 limitation thus corresponds to the respiration rate at the maximum abundance (R*), which can be expressed as:
And:
Combining Equations (11) and (12):
Then:
R0 and R* (and thereby A) were calculated as the slope of the O2 concentration with time during the first incubation hours (R0) and the last part of the incubation where the maximum slope was reached (R*). If the O2 was dropping to zero, R* was measured immediately before O2 started to be limiting, otherwise R* was calculated from the last measured data (see examples in Figure 3). The rest of the parameters in Equation (10) (Km, λ, and μm) were varied iteratively until the best fit, obtained by least squares adjustment, was achieved using the Solver command in Excel (Kemmer and Keller, 2010).
The curve fitting outlined above resulted in the parameters shown in Figures 3, 4, where also parameters obtained with water from another site in Golfo Dulce (Station GD-2) are shown. The differences between initial rates and maximum rates are large, especially for Station GD-1. It is interesting that the lag phase before the metabolism was speeding up increased gradually from the surface waters (4.0 ± 0.1 h at 20 m) to the deeper samples (15.8 ± 0.8 h at 100 m), although the incubations were conducted at the same temperature. The maximum apparent growth rate, μm, varied from 0.3 to 0.6 h−1 for Station GD-1 and from 0.11 to 0.32 h−1 for Station GD-2. Incubation of surface water at in situ temperature would have resulted in even shorter lag phase and higher growth rate.
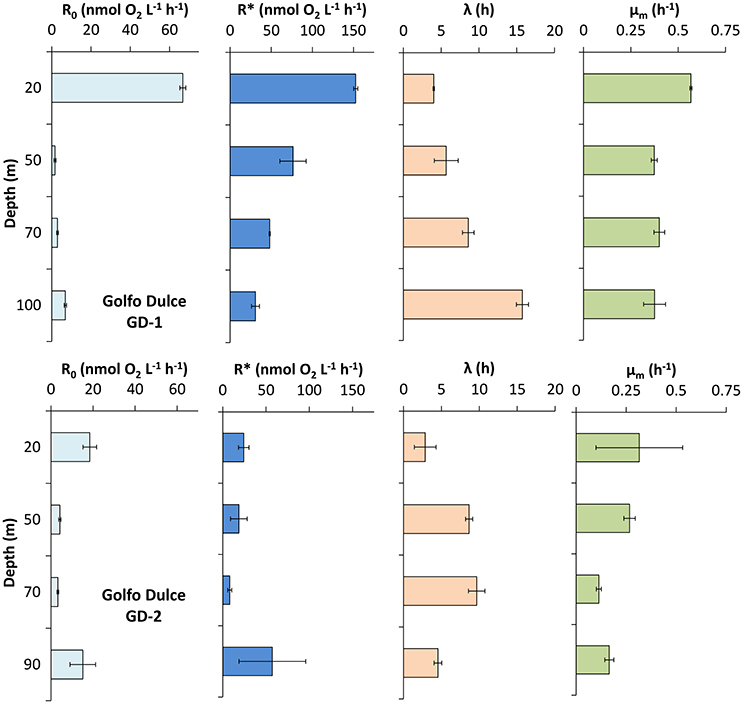
Figure 4. Respiration and active microbial growth profiles measured in Golfo Dulce at station GD-1 (19 of January 2015) and GD-2 (22 of January 2015). Data were modeled as described in the text and shown in Figure 1 in order to calculate: initial respiration rate (R0) and maximum respiration rate during the incubation (R*), lag-phase (λ), and maximum growth rate (μm) of the microbial activity in the bottles during the incubation. Km was only calculated at 20 m depth, being 39 ± 1 nmol O2 L−1. Note the different scale for R0 and R*.
Effect of O2 Concentration On Respiration
The curve fitting performed on the data in Figure 3 resulted in a Km-value of only 39 ± 1 nmol L−1 for the 20 m water sample, and it was not possible to estimate Km-values for samples from the other depths during the same day as they did not approach zero O2 concentration during the experiment. Km-values measured on water samples from different depths during the whole sampling campaign in Golfo Dulce are summarized in Table 1 and mean Km-values of 39 (20 m), 24 (70 m), 30 (80 m), and 59 (100 m) nmol L−1 were obtained. It is, however, difficult to estimate reliable Km-values from O2 depletion curves when there are simultaneous increases in activity, but Km-values were also estimated from initial O2 consumption rates in incubations with variable initial O2 concentrations (Figure 5). During the course of the sampling trip, oxygen consumption rates were determined in 70 m water from Station GD-1 over a wide range of O2 concentrations ranging from 0.4 to 8.7 μmol L−1 (Table 1, Figure 5). There is substantial scatter in the data, but there was no apparent change in O2 consumption rates at concentrations above 0.7–1 μmol L−1. Modeling of the data using Equation (1) resulted in an apparent Km-value of 391 ± 111 nmol O2 L−1.
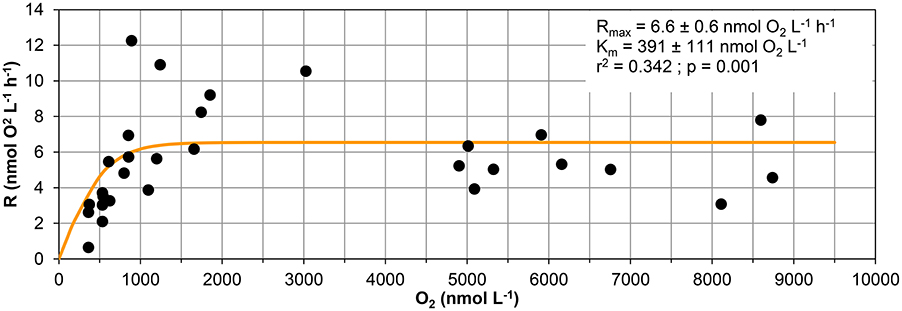
Figure 5. Respiration vs. oxygen concentration. Respiration data measured in samples collected at 70 m at station GD-1 from 4 days (19th, 20th, and 30th of January and 1st of February 2015) used to calculate the respiratory kinetic parameters (Rmax and Km). Data are initial respiration rates (R0) and average O2 concentration during the corresponding period.
Effect of Stirring On O2 Consumption
Incubations were performed with a set of bottles exposed to stirring for only 5 min for every 2–4 h (i-stirred) and another set of bottles that were continuously stirred. The O2 depletion curves were analyzed the same way as those in Figure 3, and the results are shown in Figure 6 for both Golfo Dulce (70 m water) and ETSP surface water. The differences in initial rates between stirred and i-stirred bottles were relatively small and not significant (t-test, p > 0.05), but with a tendency to about 50% higher rates in the stirred bottles. The maximum rate after a long incubation time (R*) was, however, about double in the stirred bottles (about 115 nmol L−1 h−1) when compared to i-stirred (about 45–50 nmol L−1 h−1). The lag phase before the respiration started to increase was about 30% shorter in the stirred bottles. The apparent growth rate of the bacteria (μm) was about three times higher in Golfo Dulce (0.7–0.8 h−1) as compared to the ETSP surface water (0.12–0.2 h−1).
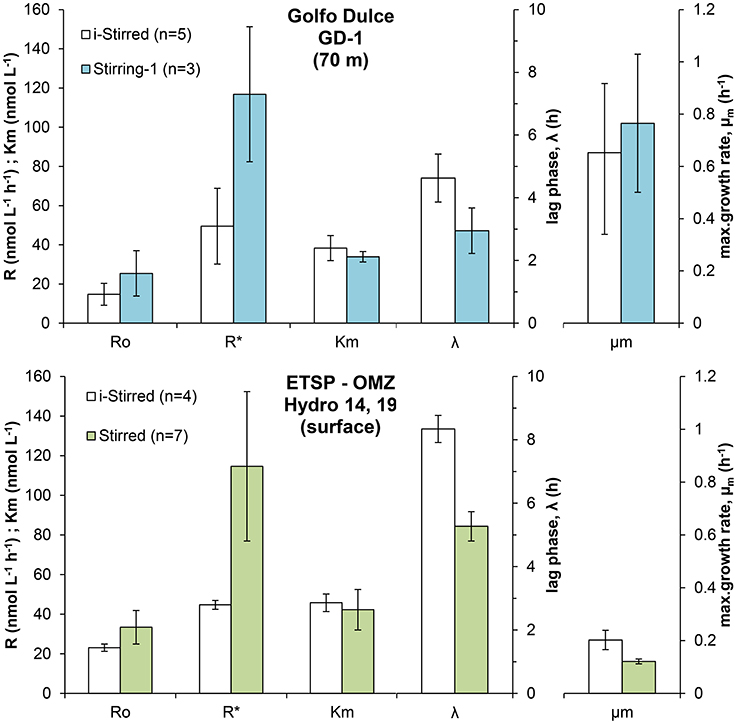
Figure 6. Effect of stirring on the respiratory parameters during the incubation of intermediate waters in Golfo Dulce and surface waters in the ETSP OMZ off Chile/Peru: Initial respiration rates (R0), maximum respiration rate (R*), half saturation constant (Km), lag-phase (λ), and maximum specific growth rate (μm) measured during the incubations. Samples were sparged with inert gas to lower O2 concentration and incubated with constant stirring (Stirred) or with intermittent stirring for 5 min every 2–4 h (i-Stirred).
Effect of Pre-incubation On the O2 Consumption Rates
The effect of the pre-incubation treatment was similar at both investigated stations (Hydro 14 and Hydro 19), although some differences can be noticed (Figure 7). Initial respiration rates (R0) were significantly higher in pre-incubated water (t-test, p < 0.05 for both dates), increasing about 50%, whereas there were no significant changes in maximum respiration rates (R*), lag-phases λ, and the Km-values. Maximum apparent growth rates were significantly higher in the pre-incubated samples (t-test, p < 0.05), increasing from mean values of 0.13 to 0.20 h−1.
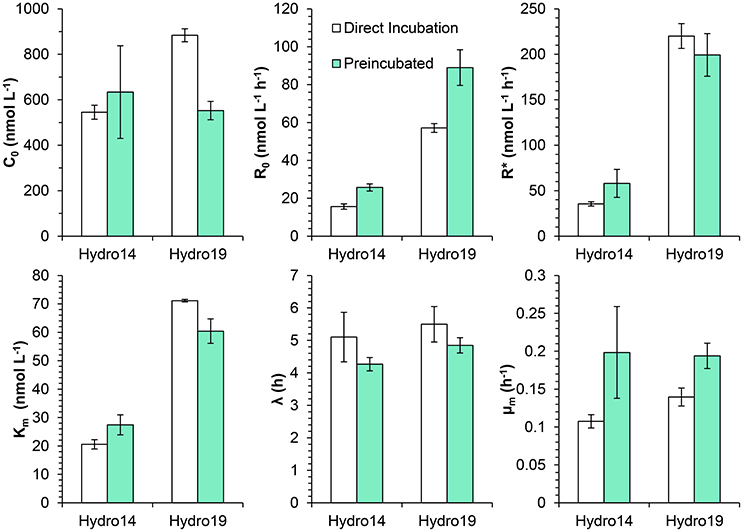
Figure 7. Effect of bubbling with inert gas on the respiratory parameters during the incubation of surface waters from stations Hydro 14 and 19 in the ETSP OMZ off Chile/Peru: Initial O2 concentration (C0), initial respiration rates (R0), maximum respiration rate (R*), half saturation constant (Km), lag-phase (λ), and maximum specific growth rate (μm) measured during the incubations. Samples were sparged with inert gas to lower the O2 concentration and incubated with constant stirring (Direct incubation) or kept in the degassing bottle for 7–9 h prior to the transference to the incubation bottles (Pre-incubated). Note, the different scales for R0 and R*.
Effect of Deoxygenation On O2 Consumption Rates
The difference in initial rates (R0) is not significantly different between the three treatments being tested (On board filling + stirring, On board filling i-stirring and Lab filling + stirring, Figure 8; p < 0.05, one-way ANOVA), but with a tendency for the deoxygenated samples to have a higher rate. The number of replicates for the deoxygenated samples was just 2, but we did measurements on water from the same depth during several days, treating the samples in a similar way and showing a similar initial respiration value (R0) of 8.2 ± 2.0 nmol L−1 h−1 (n = 11). The maximum rates after long incubation (R*) were, however, significantly higher for the laboratory treatment compared with the two on board treatments (p < 0.05, Tukey HSD). It should be noted that the initial O2 concentrations (C0) were about eight times higher in the bottles filled directly from the Niskin bottle and even then the respiration rates were lower. There were no significant differences between the lag-phase and μm measured for the different treatments (p > 0.05, one-way ANOVA).
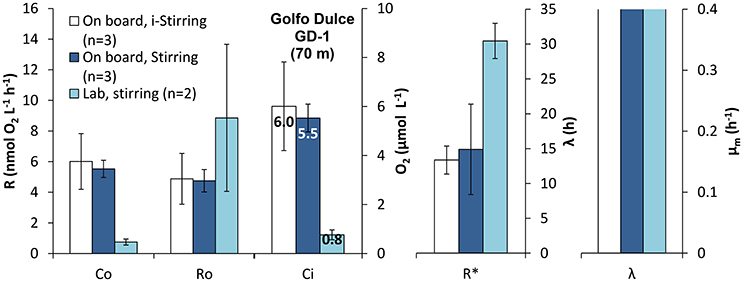
Figure 8. Effect of sample handling and treatment on the respiratory parameters during the incubation of intermediate waters in Golfo Dulce OMZ: Initial respiration rates (R0), maximum respiration rate (R*), initial Oxygen concentration (C0), lag-phase (λ), and maximum specific growth rate (μm) measured during the incubations. Samples were collected by Niskin bottles and transferred immediately and directly to the incubation bottles on board (On board). Once in the laboratory, the bottles were kept at constant temperature with only intermittent (i-Stirred) or with stirring (Stirred). A water sample from the same depth was collected and transported to the laboratory where it was sparged with inert gas to lower the O2 concentration and incubated with constant stirring (Stirred).
Discussion
In this study, we have tried to focus on the potential sources of error associated with the determination of respiration rates in low-O2 waters. It is our hope that the data presented here will contribute to our understanding of how laboratory manipulation of ocean water affects microbial activity. In this context we consider Golfo Dulce water as ocean water, as the activities we measured in the water were comparable to those of the open ocean (Figure 6). We have focused on O2 consumption, in practice identical to O2 respiration, but similar effects may occur for other microbial aerobic or anaerobic processes such as nitrite oxidation, reduction of nitrate to nitrite and denitrification.
The initial (R0) O2 consumption rates in the surface water was, as could be expected, much higher than in the deeper parts of the oxic water column (50 and 70 m), and it would probably have been more than double of the rate measured if we had been able to incubate at the >10°C higher in situ temperature. The higher rates measured in water from the deepest depths (100 m at GD-1 and 90 m at GD-2) were probably due to (microbial) oxidation of reduced compounds such as nitrite, manganese and reduced sulfur species (Ferdelman et al., 2006), and they thus represent rates that would occur in these water masses if turbulence introduces oxygen into these otherwise anoxic water masses. Our measured respiration values (R0) show a similar tendency in terms of high surface activity and low activity at depth as the rates measured at GD-1 by Thamdrup et al. (1996). During all the incubations, we measured a significant enhancement of the respiration rates during the incubation period, resulting in respiration rates (R*) from 1.3 and up to 46 times higher than the initial respiration rates (Ninf/N0, Table 1). The “average” increase in respiration rate after about 24 h of incubation for deep and surface waters was about a factor of 3–4, but much higher increases (10–18 times on average) were observed at intermediate depths where the initial respiration values were lowest. Similarly, large increases in respiration rate was also observed by Tiano et al. (2014a) after incubation of deep waters with initial low activity for more than ~15 h. The prolonged incubations resulted in a respiration profile (R*) more similar to the one shown by Thamdrup et al. (1996), but significantly different from the one measured by short incubations. The integrated R* profile at station GD-1 (from 20 to 100 m) was 141 mmol m−2 d−1, being quite similar to the 170 mmol m−2 d−1, measured also in January of 1994 at the same station by 24 h incubations and Winkler determinations (Thamdrup et al., 1996). These values are, however, 5–6 times higher than the integrated R0 rates (29 mmol m−2 d−1), illustrating the overestimation of the respiration rates by long incubations.
The modeling of the O2 depletion curves serves the purpose of allowing comparison of data from various environments. Such modeling is based on assumptions that cannot reflect reality in all aspects. It was thus assumed that the population causing the oxygen depletion in the beginning of the incubation grows during the incubation. We know from previous studies that the increase in activity is by a small subset of bacteria that are able to respond quickly to new conditions and grow with high rates under conditions of higher nutrient availability (Ferguson et al., 1984; Sherr et al., 1999; Massana et al., 2001; Stewart et al., 2012). Ferguson et al. (1984) showed that the number of bacteria and the community composition of coastal waters changed after 16 h of confinement, but suggest that changes could be relevant after just 5 h, being similar to the lag-phase found in the surface waters of Golfo Dulce. Studies at various locations found a variety of groups favored by confinement like Pseudomonas, Acinetobacter, and Alcaligenes at the coast of North Carolina (Ferguson et al., 1984) and Vibrio, Octadecabacter, and Polaribacter in the Antarctic region (Massana et al., 2001). Stewart et al. (2012) found that the relative abundance of Gammaproteobacterial sequences increased during the on board incubation of water samples from the ETSP OMZ. Especially transcripts matching Colwellia psychrerythraea exhibited a dramatic increase in abundance after being exposed to laboratory incubation.
The maximum growth rates, μm, should not be interpreted as a growth rate of the whole in situ population, but as a useful parameter describing the overall rise in activity. On average, values of 0.32 and 0.17 h−1 were found for Golfo Dulce and ETSP, corresponding to doubling times of 2.8 and 4.6 h, respectively. These values are similar to the doubling times found by Ferguson et al. (1984) and Sherr et al. (1999) in coastal waters (2.2 and 1.9 h, respectively). The short doubling times in their samples were attributed to high growth of culturable cells whereas “non-culturable cells” grew with a doubling time above 50 h (Ferguson et al., 1984). The high similarity of these numbers from previous studies and the present estimates suggest a relative uniformity in the metabolic enhancement caused by confinement and stresses the need for short incubations to obtain relevant data.
The Km-values of 34–38 nmol L−1 obtained from the O2 depletion curves (Figures 3, 6) are also not representing the full truth about the respiratory kinetics in the analyzed waters. In oceanic water there is a dominance of low affinity terminal oxidases with Km-values around 200 nmol L−1 (Morris and Schmidt, 2013), representing the majority of aerobic oxidase genes and gene transcripts even in samples from the anoxic cores of Oxygen Minimum Zones (Stewart et al., 2012; Kalvelage et al., 2015). The O2 consumption must thus be slightly limited by the O2 concentration during the whole experimental period depicted in Figure 3, as the initial O2 concentration was only 600 nmol L−1 and respiration rates may thus be around 90–95% of the unlimited rates. We cannot, however, resolve O2 limitation over the whole experimental range of O2 concentrations by this kind of experiment where we also have rates increasing with time, and we therefore conducted an experiment with initial O2 concentrations covering a wide range (Figure 5). From this experiment we found Km-values of 391 nmol L−1 assuming Jassby kinetics (Tiano et al., 2014b). It is important to stress that these values are apparent Km-values for the whole community and not enzymatic Km-values. Aggregation of cells leads to higher apparent Km-values due to diffusion limitation (Kalvelage et al., 2015; Gong et al., 2016), and the higher than the enzymatic value obtained from Figure 5 may thus be caused by diffusion limitation. Although low affinity terminal oxidases are most widely distributed (Kalvelage et al., 2015), high affinity terminal oxidases may be important for the oxygen depletion below about 50 nmol O2 L−1, as they have Km-values of only 3–8 nmol L−1 (Morris and Schmidt, 2013). The apparent Km-values of 38 nmol L−1 determined at 20 m (Figure 3) and 34–38 nmol L−1 determined from the 70 m depth samples are thus the result of mixed low and high affinity terminal oxidase activity in the low O2 region where rate limitation by low O2 was overriding the rise in activity otherwise observed.
Several sets of experiments were designed to investigate how the experimental conditions affected the O2 consumption rates. Stirring may increase the oxygen availability in aggregates by minimizing the diffusive boundary layers around aggregates and could thus increase O2 respiration rates when O2 concentrations inside the aggregate are limiting for respiration; i.e., are below about three times the Km-values for the active terminal oxidases. We did observe a stimulation of the microbial metabolism in the samples from both Golfo Dulce and ETSP (Figure 6) when the water was continuously stirred. The enhancement of respiration rates was low and not significant during the first hours of the incubations, resulting in similar R0-values, however there was a clear effect of the stirring on the enhancement of microbial activity during the incubations. Stirring may also stimulate respiration by increasing the availability of dissolved electron donors, both by diffusion to aggregates and by lysing sensitive cells and subsequent metabolic burst based on liberated organics. In addition, turbulence might favor the aggregation of organic compounds (Beauvais et al., 2006) which might also enhance microbial metabolism. The clear reduction in the lag-phase and the increase in the maximum respiration rates (R*) in both Golfo Dulce and ETSP samples suggest that better access to organic electron donors is a major reason for the higher rates. The scientific community working with oceanic dinitrogen fixation is aware that the water should not be stirred vigorously as this will affect the fragile Trichodesmium colonies (Howarth et al., 1988). This recommendation should thus be extended to oceanic water activity measurements in general. Although the overestimation of the initial rates may not be dramatic, the exponential growth after a very short lag period could lead to significantly overestimated results if the measuring period is not kept very short.
Two sets of experiments (Figures 7, 8) were designed to elucidate how deoxygenation by bubbling with inert gas affected the O2 consumption rates. The vigorous bubbling might lyse cells and thus increase respiration, and lowering of the O2 concentration to values far below in situ conditions may also kill and lyse sensitive organisms, including eukaryotes. Incubation bottles filled immediately after deoxygenation and bottles filled 7–9 h after deoxygenation exhibited similar behavior (Figure 7), but with an about 40% higher initial rate in pre-incubated water samples. However, there was an additional rise in activity with lag times identical to the ones observed for the non-preincubated samples. This indicates that a substantial part of the increase in O2 consumption was associated with microbial colonization of the walls in the incubation bottles. Surfaces may stimulate microbial respiration of attached microorganisms (Zobell and Anderson, 1936). The surface component of the “bottle effect” was questioned by Hammes et al. (2010), but these authors did not perform experiments with natural samples, restricting the general extrapolation of their results. Garcia-Martin et al. (2011) found an inverse relationship between measured respiration rate and bottle volume, and the difference between rates in small and large bottles increased with incubation time suggesting higher bacterial growth associated with larger surface to volume ratio of the bottles.
In another experiment (Figure 8) two sets of bottles were filled directly from the Niskin bottle without any deoxygenation, and one set of bottles was filled with water brought to the laboratory and deoxygenated by bubbling. In this case the O2 consumption rate in the deoxygenated bottles was about double the rate as compared to water exposed to minimal manipulation, again suggesting a substantial lysis of cells by the harsh mechanical treatment. Interestingly, there was no difference in oxygen uptake between stirred and i-stirred conditions in the water samples taken directly from the Niskin bottle, whereas the data presented in Figure 4 indicated a substantial enhancement by stirring. More experiments are needed to elucidate whether stirring in general enhances O2 consumption more in water samples that have been exposed to the deoxygenation procedure. It can be speculated that stirring may promote growth of prokaryotes attached to glass surfaces when organic matter has been liberated by lysis of organisms.
Conclusions
Microbial metabolism in oceanic water is affected by enclosure in incubation containers, where we can observe a rise in O2 consumption rate with time. It is important to measure rates of metabolism during relatively short incubations (<4 h for surface waters and <15 h for deeper waters with low metabolism), as the enclosure effects are less pronounced in the beginning of the incubations. It is possible to improve the resolution and decrease the incubation time of O2 consumption determinations by lowering the O2 concentration to nanomolar levels, but concentrations should not be lower than 1 μmol L−1 if substantial corrections for saturation kinetics of the terminal oxidases are to be avoided. However, a (partial) deoxygenation procedure by bubbling with inert gas results in a substantial (up to double) increase in subsequently measured rates of initial O2 consumption. Stirring during the incubation may further increase the rates by enhancing oxygen supply to aggregates, by lysing fragile cells, or by promoting surface attachment. Similar incubation artifacts as studied here for O2 consumption will probably also apply for denitrification, nitrate reduction, and other anaerobic processes. Incubations for microbial activity measurements should thus preferentially be performed during short (4–15 h, depending on microbial community composition and temperature) incubations with minimal mechanical disturbance of the microbial community.
Author Contributions
EG and NR participated in all parts of the work: Field work at the Pacific Ocean and the Golfo Dulce, analytical work on board boats and ship and in the laboratory, and in data interpretation and writing of the manuscript. IK and SB developed the essential optode technology in close collaboration with the other authors and provided the sensor dots.
Funding
This work was supported by the ERC Grant “Oxygen” (267233) and EU-FP7 Project “SenseOcean” (614141).
Conflict of Interest Statement
The authors declare that the research was conducted in the absence of any commercial or financial relationships that could be construed as a potential conflict of interest.
Acknowledgments
We are grateful for the technical help of Niels Kristiansen, Preben Sørensen, Lars B. Pedersen, and C. Kondrup. Our work in Golfo Dulce was made possible by the support of Alvaro Morales, Jenaro Acuña, Eddy Gomez, and Eleazar Ruiz from the Centro de Investigacion en Ciencias del Mar y Limnologia (CIMAR), University of Costa Rica. We are also grateful for being invited to participate in the cruise on Nathalie Palmer and the support from the staff including cruise leaders A. Devol and B.B. Ward.
References
Beauvais, S., Pedrotti, M., Egge, J., Iversen, K., and Marrasé, C. (2006). Effects of turbulence on TEP dynamics under contrasting nutrient conditions: implications for aggregation and sedimentation processes. Mar. Ecol. Prog. Ser. 323, 47–57. doi: 10.3354/meps323047
Beman, J. M., Leilei Shih, J., and Popp, B. N. (2013). Nitrite oxidation in the upper water column and oxygen minimum zone of the eastern tropical North Pacific Ocean. ISME J. 7, 2192–2205. doi: 10.1038/ismej.2013.96
Bristow, L. A., Dalsgaard, T., Tiano, L., Mills, D. B., Bertagnolli, A. D., Wright, J. J., et al. (2016). Ammonium and nitrite oxidation at nanomolar oxygen concentrations in oxygen minimum zone waters. Proc. Natl. Acad. Sci. U.S.A. 113, 10601–10606. doi: 10.1073/pnas.1600359113
Dalsgaard, T., Stewart, F. J., Thamdrup, B., De Brabandere, L., Revsbech, N. P., Ulloa, O., et al. (2014). Oxygen at nanomolar levels reversibly suppresses process rates and gene expression in anammox and denitrification in the oxygen minimum zone off Northern Chile. mBio 5:e01966-14. doi: 10.1128/mBio.01966-14
De Brabandere, L., Thamdrup, B., Revsbech, N. P., and Foadi, R. (2012). A critical assessment of the occurrence and extend of oxygen contamination during anaerobic incubations utilizing commercially available vials. J. Microbiol. Methods 88, 147–154. doi: 10.1016/j.mimet.2011.11.001
Ferdelman, T. G., Thamdrup, B., Canfield, D. E., Glud, R. N., Kuever, J., Lillebaek, R., et al. (2006). Biogeochemical controls on the oxygen, nitrogen and sulfur distributions in the water column of Golfo Dulce: an anoxic basin on the Pacific coast of Costa Rica revisited. Rev. Biol. Trop. 54, 171–191. doi: 10.15517/rbt.v54i1.26825
Ferguson, R. L., Buckley, E. N., and Palumbo, A. V. (1984). Response of marine bacterioplankton to differential filtration and confinement. Appl. Environ. Microbiol. 47, 49–55.
Füssel, J., Lam, P., Lavik, G., Jensen, M. M., Holtappels, M., Günter, M., et al. (2012). Nitrite oxidation in the Namibian oxygen minimum zone. ISME J. 6, 1200–1209. doi: 10.1038/ismej.2011.178
Garcia-Martin, E., Serret, P., and Pérez-Lorenzo, M. (2011). Testing potential bias in marine plankton respiration rates by dark bottle incubations in the NW Iberian shelf: incubation time and bottle volume. Cont. Shelf Res. 31, 496–506. doi: 10.1016/j.csr.2010.07.006
Gong, X., Garcia-Robledo, E., Schramm, A., and Revsbech, N. P. (2016). Respiratory kinetics of marine bacteria exposed to decreasing oxygen concentrations. Appl. Environ. Microbiol. 82, 1412–1422. doi: 10.1128/AEM.03669-15
Hammes, F., Vital, M., and Egli, T. (2010). Critical evaluation of the volumetric “bottle effect” on microbial batch growth. Appl. Environ. Microbiol. 76, 1278–1281. doi: 10.1128/AEM.01914-09
Howarth, R. W., Marino, R., and Cole, J. J. (1988). Nitrogen fixation in freshwater, estuarine, and marine ecosystems. 2. Biogeochemical controls. Limnol. Oceanogr. 33, 688–701. doi: 10.4319/lo.1988.33.4_part_2.0688
Kalvelage, T., Jensen, M. M., Contreras, S., Revsbech, N. P., Lam, P., Günter, M., et al. (2011). Oxygen sensitivity of anammox and coupled N-cycle processes in oxygen minimum zones. PLoS ONE 6:e29299. doi: 10.1371/journal.pone.0029299
Kalvelage, T., Lavik, G., Jensen, M. M., Revsbech, N. P., Löscher, C., Schunck, H., et al. (2015). Aerobic microbial respiration in oceanic oxygen minimum zones. PLoS ONE 10:e0133526. doi: 10.1371/journal.pone.0133526
Kemmer, G., and Keller, S. (2010). Nonlinear least-squares data fitting in Excel spreadsheets. Nat. Protoc. 5, 267–281. doi: 10.1038/nprot.2009.182
Larsen, M., Lehner, P., Borisov, S. M., Klimant, I., Fischer, J. P., Stewart, F. J., et al. (2016). In situ quantification of ultra-low O2 concentrations in oxygen minimum zones: application of novel optodes. Limnol. Oceanogr. Methods. doi: 10.1002/lom3.10126. [Epub ahead of print].
Lehner, P., Larndorfer, C., Garcia-Robledo, E., Larsen, M., Borisov, S. M., Revsbech, N.-P., et al. (2015). LUMOS - A sensitive and reliable optode system for measuring dissolved oxygen in the nanomolar range. PLoS ONE 10:e0128125. doi: 10.1371/journal.pone.0128125
Massana, R., Pedros-Alio, C., Casamayor, E. O., and Gasol, J. M. (2001). Changes in marine bacterioplankton phylogenetic composition during incubations designed to measure biogeochemically significant parameters. Limnol. Oceanogr. 46, 1181–1188. doi: 10.4319/lo.2001.46.5.1181
Morris, R. L., and Schmidt, T. M. (2013). Shallow breathing: bacterial life at low O2. Nat. Rev. Microbiol. 11, 205–212. doi: 10.1038/nrmicro2970
Revsbech, N. P., Larsen, L. H., Gundersen, J. K., Dalsgaard, T., Ulloa, O., and Thamdrup, B. (2009). Determination of ultra-low oxygen concentrations in oxygen minimum zones by the STOX sensor. Limnol. Oceanogr. Methods 7, 371–381. doi: 10.4319/lom.2009.7.371
Revsbech, N. P., Thamdrup, B., Dalsgaard, T., and Canfield, D. E. (2011). “Construction of STOX oxygen sensors and their application for determination of O2 concentrations in Oxygen Minimum Zones,” in Methods in Enzymology: Research on Nitrification and Related Processes, Vol. 486, Part A, ed M. G. Klotz (San Diego, CA: Elsevier Academic Press Inc.), 325–341.
Robinson, C., and Williams, P. J. (2005). “Respiration and its measurement in surface marine waters,” in Respiration in Aquatic Ecosystems, eds P. A. Del Giorgio and P. J. Williams (New York, NY: Oxford University Press), 147–181.
Sherr, E. B., Sherr, B. F., and Sigmon, C. T. (1999). Activity of marine bacteria under incubated and in situ conditions. Aquat. Microb. Ecol. 20, 213–223. doi: 10.3354/ame020213
Stewart, F. J., Dalsgaard, T., Young, C. R., Thamdrup, B., Revsbech, N. P., Ulloa, O., et al. (2012). Experimental incubations elicit profound changes in community transcription in OMZ bacterioplankton. PLoS ONE 7:e37118. doi: 10.1371/journal.pone.0037118
Thamdrup, B., Canfield, D. E., Ferdelman, T. G., Glud, R. N., and Gundersen, J. K. (1996). A biogeochemical survey of the anoxic basin Golfo Dulce, Costa Rica. Rev. Biol. Trop. 44, 19–33.
Thamdrup, B., Dalsgaard, T., and Revsbech, N. P. (2012). Widespread functional anoxia in the oxygen minimum zone of the Eastern South Pacific. Deep Sea Res. I 65, 36–45. doi: 10.1016/j.dsr.2012.03.001
Tiano, L., Garcia-Robledo, E., Dalsgaard, T., Devol, A. H., Ward, B. B., Ulloa, O., et al. (2014a). Oxygen distribution and aerobic respiration in the north and south eastern tropical Pacific oxygen minimum zones. Deep Sea Res. I 94, 173–183. doi: 10.1016/j.dsr.2014.10.001
Tiano, L., Garcia-Robledo, E., and Revsbech, N. P. (2014b). A new highly sensitive method to assess respiration rates and kinetics of natural planktonic communities by use of the switchable trace oxygen sensor and reduced oxygen concentrations. PLoS ONE 9:e105399. doi: 10.1371/journal.pone.0105399
Zobell, C. E., and Anderson, D. Q. (1936). Observations on the multiplication of bacteria in different volumes of stored sea water and the influence of oxygen tension and solid surfaces. Biol. Bull. 71, 324–342. doi: 10.2307/1537438
Keywords: Oxygen Minimum Zone, bottle effects, optode, oxygen, respiration, Golfo Dulce, Costa Rica, East Tropical South Pacific
Citation: Garcia-Robledo E, Borisov S, Klimant I and Revsbech NP (2016) Determination of Respiration Rates in Water with Sub-Micromolar Oxygen Concentrations. Front. Mar. Sci. 3:244. doi: 10.3389/fmars.2016.00244
Received: 12 July 2016; Accepted: 10 November 2016;
Published: 25 November 2016.
Edited by:
Carol Robinson, University of East Anglia, UKReviewed by:
J. Michael Beman, University of California, Merced, USAFederico Baltar, University of Otago, New Zealand
Christian Lønborg, Australian Institute of Marine Science, Australia
Wei-dong Zhai, Shandong University, China
Copyright © 2016 Garcia-Robledo, Borisov, Klimant and Revsbech. This is an open-access article distributed under the terms of the Creative Commons Attribution License (CC BY). The use, distribution or reproduction in other forums is permitted, provided the original author(s) or licensor are credited and that the original publication in this journal is cited, in accordance with accepted academic practice. No use, distribution or reproduction is permitted which does not comply with these terms.
*Correspondence: Emilio Garcia-Robledo, emilio.garcia@bios.au.dk