Short-Term Dissolved Organic Carbon Dynamics Reflect Tidal, Water Management, and Precipitation Patterns in a Subtropical Estuary
 Peter Regier1,2
  Rudolf Jaffé1,2*
- 1Department of Chemistry and Biochemistry, Florida International University, Miami, FL, USA
- 2Southeast Environmental Research Center, Florida International University, Miami, FL, USA
Estuaries significantly impact the global carbon cycle by regulating the exchange of organic matter, primarily in the form of dissolved organic carbon (DOC), between terrestrial and marine carbon pools. Estuarine DOC dynamics are complex as tides and other hydrological and climatic drivers can affect carbon fluxes on short and long time scales. While estuarine and coastal DOC dynamics have been well-studied, variations on short time scales are less well-constrained. Recent advancements in sonde technology enable autonomous in situ collection of high frequency DOC data using fluorescent dissolved organic matter (FDOM) as a proxy, dramatically improving our capacity to characterize rapid changes in DOC, even in remote ecosystems. This study utilizes high-frequency FDOM measurements to untangle rapid and complex hydrologic drivers of DOC in the Shark River estuary, the main drainage of Everglades National Park, Florida. Non-conservative mixing of FDOM along the salinity gradient suggested mangrove inputs accounted for 6% of the total DOC pool. Average changes in FDOM concentrations through individual tidal cycles ranged from less than 10% to greater than 50% and multi-day trends >100% change in FDOM concentration were observed. Salinity and water level both inversely correlated to FDOM at sub-hourly and daily resolutions, while freshwater controls via precipitation and water management were observed at diel to monthly time-scales. In particular, the role of water management in rapidly shifting estuarine salinity gradients and DOC export regimes at sub-weekly time-scales was evident. Additionally, sub-hourly spikes in ebb tide FDOM indicated rapid exchange of DOC between mangrove sediments and the river channel. DOC fluxes calculated from high-resolution FDOM measurements were compared to monthly DOC measurements with high-resolution fluxes considerably improving accuracy of fluxes (thereby constraining carbon budgets). This study provides a better understanding of short-term DOC dynamics and associated hydrological drivers and indicates the importance of high-frequency measurements to accurately constrain coastal carbon processes and budgets, particularly in coastal systems increasingly altered by hydrologic restoration and climate change.
Introduction
Estuaries are the continental-oceanic interface of the global aquatic carbon (C) cycle. Terrestrially derived organic C is transported to coastal margins through these systems, primarily as dissolved organic carbon (DOC; Hedges et al., 1997). Tidal wetlands and estuaries, which occupy a small portion of world coastlines, account for an estimated third of all organic C buried in coastal sediments (Bauer et al., 2013), serving as a globally relevant C sink (Chmura et al., 2003; Bridgham et al., 2006). DOC also influences biogeochemical cycling within estuaries, including regulating the transport of nutrients and metals (Boyer et al., 1997; Qualls and Richardson, 2003; Yamashita and Jaffé, 2008) and impacts microbial communities (Tranvik, 1998; Fellman et al., 2010). Components of the DOC pool which absorb UV light, known as chromophoric dissolved organic matter (CDOM), control benthic productivity through light attenuation in the water column (Osburn et al., 2009; Ganju et al., 2014).
DOC dynamics vary dramatically across temporal scales (Spencer et al., 2007; Jollymore et al., 2012), from sub-hourly changes in tidal systems (e.g., Bergamaschi et al., 2012) to inter-annual trends (e.g., Evans et al., 2005). Characterizing the patterns and drivers of DOC variability to understand ecological impacts and constrain coastal C budgets thus requires information spanning a wide range of temporal resolutions. Although long-term investigations of coastal DOC dynamics are relatively common (e.g., Chen et al., 2013; Regier et al., 2016), equivalent studies at high temporal resolution are lacking due to the complex logistics and laboratory costs associated with DOC sampling in remote estuarine environments. However, high-resolution measurements are critical for temporally dynamic systems like estuaries, where rapid water quality changes observable in high-frequency measurements may not be accurately represented by weekly or monthly sampling intervals (Kirchner et al., 2004; Jollymore et al., 2012; Sobczak and Raymond, 2015).
The solution to this dearth of high-frequency DOC information lies in recent technological advances in multi-parameter sondes coupled with sensors measuring fluorescent dissolved organic matter (FDOM), a proxy for DOC (Downing et al., 2009). Sondes combine sensors, data-logging and internal power sources into a single water-proof instrument to achieve high-frequency sampling intervals in situ, eliminating the need for laboratory analysis except to calibrate proxy relationships. These sensors have been applied in a range of environments, including lakes (Watras et al., 2015), streams and rivers (Pellerin et al., 2012; Wilson et al., 2013), wetlands (Ryder et al., 2014), and coastal systems (Downing et al., 2009; Bergamaschi et al., 2012). High-frequency FDOM data provide the resolution necessary to fill in knowledge gaps beyond the scope of conventional monthly sampling frequencies. For instance, high-frequency FDOM measurements have facilitated the development of ecosystem-specific proxies for mercury (Bergamaschi et al., 2012), nutrients (Wilson et al., 2013; Etheridge et al., 2014), and DOC lability (Wilson et al., 2013). Likewise, high-resolution characterization of DOC proxies have provided new insight into processes controlling diel carbon cycles (Watras et al., 2015), rapid changes in hydrologic export of DOC (Bergamaschi et al., 2012; Wilson et al., 2013) and the role of DOC in light attenuation within optically complex waters (Ganju et al., 2014). As such, the application of instruments capable of high-frequency DOC data collection holds great potential for advancing our understanding of temporally dynamic aquatic ecosystems.
In the present study, high-resolution measurements were collected to examine patterns and trends in DOC at sub-hourly time-scales in the coastal estuaries of Everglades National Park (ENP). Landscape-scale restoration efforts underway to re-establish hydrologic connectivity along the Everglades flow-path are expected to alter seasonal timing, quantity and quality of freshwater inflows to ENP (Sklar et al., 2005), but the potential effects on ecosystem function remain uncertain (Estenoz and Bush, 2015). Since hydrology controls DOC dynamics in this system, it is expected that changes in the balance between freshwater (due to changes in management and rainfall) and saltwater intrusion (due to sea-level rise) will alter DOC cycling and export patterns (Orem et al., 2015; Regier et al., 2016). To this end, significant efforts have been placed into understanding the spatial and temporal patterns of DOC quality and quantity across the Everglades landscape (Maie et al., 2006a; Yamashita et al., 2010; Chen et al., 2013). In addition, DOC export patterns and drivers have been investigated at low and high temporal resolutions (Bergamaschi et al., 2012; Cawley et al., 2014; Regier et al., 2016). However, the relationship between rapidly changing and complex estuarine hydrology and high-resolution DOC dynamics for this system remains mostly undetermined. This study applies high-frequency measurements of FDOM to this knowledge gap, to better understand the hydrologic drivers of short-term DOC patterns in the Shark River, located in the mangrove forests of the coastal Everglades. In addition, this study builds on previous characterization of long-term DOC flux drivers (Regier et al., 2016) by linking short-term (daily) to long-term (monthly) DOC export regimes.
Methods
Site Description
Data for this study was collected in the Shark River estuary, located in the coastal ecotone of southwest ENP (Figure 1). The Shark River connects vast upstream freshwater wetlands to coastal margins and is situated within the largest contiguous mangrove forest in the United States. Data was collected at SRS-5 (Figure 1), a monitoring site maintained by the Florida Coastal Everglades Long Term Ecological Research (FCE-LTER) project. The site is subject to semi-diurnal tides and experiences distinct wet and dry seasons, where the wet season delivers the majority of annual freshwater inflows to the estuary via rainfall and inputs through water management structures (Duever et al., 1994; Saha et al., 2012).
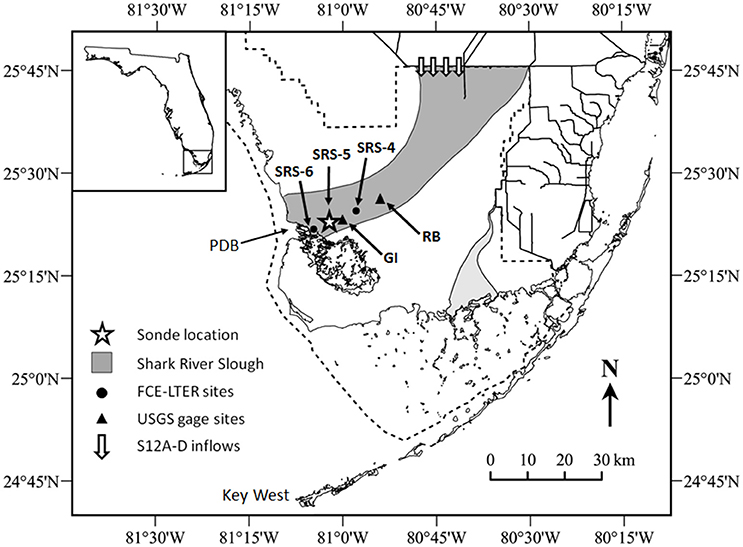
Figure 1. Map of the study area, including long-term monitoring station and USGS gage station locations, where GI stands for Gunboat Island (#252230081021300) and RB stands for Rookery Branch (#022908295). S12A-D water management structures are marked on the northern border of Everglades National Park. PDB, Ponce de Leon Bay, the marine endmember for Shark River transects.
Instrument Calibration and Setup
High-frequency data were collected in situ (measured directly in the water column) using an EXO-2 water quality sonde (Yellow Springs Instrument Company (YSI), Ohio). The sensor measuring FDOM had excitation and emission wavelength ranges of 365 ± 5 and 480 ± 40 nm, respectively, with a range of 0–300 ppb quinine sulfate equivalents (QSE) and resolution of 0.01 ppb QSE reported by the manufacturer. The sonde was calibrated prior to deployment according to manufacturer protocols and again immediately after instrument retrieval. Calibration solutions for FDOM fluorescence were made from quinine sulfate dihydrate diluted with 0.05 M H2SO4, with calibration errors lower than 5% for all deployments. Fluorescence of FDOM is reported in quinine sulfate units (QSU). Prior to deployment, sensors were wrapped in copper tape and surrounded by an anti-fouling sensor guard to minimize impacts of biofouling. Additionally, a wiper was programmed to clean sensor heads every 3 h. In spite of these precautions, sensor drift was detected in two time-series, which were not included in this study. For the data presented here, no drift was detected based on pre and post-calibration. Evidence of erratic turbidity spikes during preliminary deployments indicated interference due to crab activity, known to alter particulate and nutrient dynamics in mangrove sediments (Kristensen and Alongi, 2006). In order to protect against this, mesh was installed over openings in the sensor guard so that water flowed through uninhibited but crabs were unable to interfere with data collection.
Data Collection
A total of five time-series were collected between November 2014 and November 2015 averaging 27 days in duration (Table 1). Two time-series were collected during the wet-dry seasonal transition (T1 and T2), two during the dry season (D1 and D2) and one during the wet season (W1). The sonde was equipped with six external sensors (temperature/conductivity, pH, dissolved oxygen (DO), turbidity, FDOM, and chlorophyll) and one internal pressure sensor for measuring depth. The sonde was secured to the boardwalk at SRS-5 and situated adjacent to the riverbank with sensor heads located ~0.5 meters below the lowest low tide mark. Ancillary hydrologic data was retrieved from the USGS gage at Gunboat Island (#252230081021300), located <1 km upstream from SRS-5 (Figure 1). As the sonde was not deployed relative to a standard vertical datum, stage values collected by the sonde were not directly comparable between time-series. Therefore, stage data from the USGS gage at Gunboat Island was matched to sonde stage using time-lagged correlations. After matching, sonde stage and USGS stage showed strong linear relationships (r > 0.93, p < 0.0001 for all time-series).
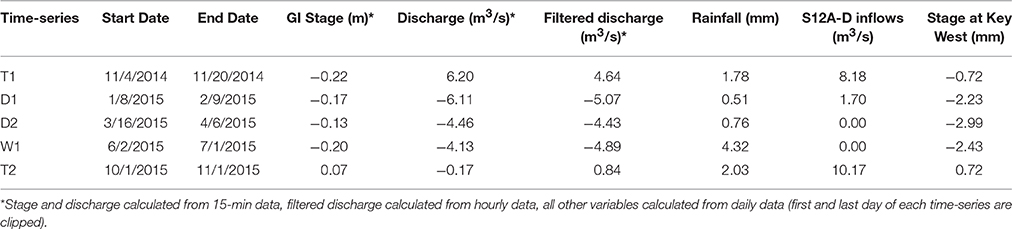
Table 1. Average values of selected hydrologic variables for each time-series.
Data collected at 15 minute intervals from sonde and USGS sources are denoted as 15-min. Tidally filtered discharge was reported at hourly resolution after applying the PL33 low-pass filter for removal of tidal fluctuations (Flagg et al., 1976). Daily averages of high temporal resolution measurements were also reported, with the first and last day of each time-series excluded since these dates did not capture 24 h of continuous data. Long-term daily salinity data for calculations of δ-salinity was retrieved from the Gulf of Mexico Coastal Ocean Observing System (GCOOS) station GBIF1 (http://data.gcoos.org/index.php) as hourly data and binned to daily averages, where days with <12 measurements were excluded. Rainfall data was collected at the Shark River station of the Everglades Depth Estimation Network (EDEN, http://sofia.usgs.gov/eden/). Water management inflows were calculated as the sum of daily average discharge for S12A-D structures (USGS gages, http://waterdata.usgs.gov/).
Fluorescence Interference and Corrections
Corrections for thermal quenching of fluorescence were conducted following methods of Watras et al. (2011). Briefly, temperature and FDOM fluorescence were measured simultaneously for water samples collected at SRS-4, SRS-5, and SRS-6 (Figure 1) over a broad temperature range (5–30°C) exceeding the expected seasonal temperature range for SRS-5. Based on linear regression, a correction factor (ρ = −0.0064 ± 0.0004) was established. A reference temperature (Tr) of 25°C was used instead of 20°C to reflect sub-tropical temperature regimes.
Interference from dissolved and suspended materials that absorb or scatter light can alter in situ fluorescence measurements, and impact instruments differently based on geometry of the sensor optics (Downing et al., 2012). For dissolved materials, absorbance of UV radiation by CDOM can be presented as absorbance at 254 nm (A254, unitless) or absorption coefficients (a254) (Hu et al., 2002; Kowalczuk et al., 2010). As a quantitative measurement, a254 is preferred to A254 as a254 values are comparable between studies regardless of path length. However, A254 values are also reported here to facilitate comparison with values presented by Downing et al. (2012) and Cawley et al. (2014). Conversion of A254 to a254 was performed using Equation 2 in Kowalczuk et al. (2010) where path length was 1 cm for both Downing et al. (2012) and Cawley et al. (2014).
The Shark River is characterized by relatively high CDOM absorbance (A254) ranging from 0.1 to 0.6 (a254: 23–138 m−1) based on Cawley et al. (2014). Figure 1 in Downing et al. (2012) indicates this range of absorbance values equates to FDOM attenuation up to ~15%. Monthly absorbance data collected upstream (SRS-4) and downstream (SRS-6) of the study site (Figure 1) spanning 11/2014–05/2015 were used to estimate SRS-5 absorbance as the average of SRS-4 and SRS-6 (Figure S1). Estimated A254 values for SRS-5 (average A254: 0.44, average a254: 101 m−1) indicated that, at least for the portion of the study period represented in Figure 1, attenuation due to dissolved materials accounted of <10% of the FDOM signal based on a closed path sensor with optics at 90° (Downing et al., 2012).
To assess fluorescence interference due to suspended solids (measured as turbidity), a turbid solution containing 15 g of mangrove sediment collected at SRS-5 (dried, ground, and sieved through a 30-mesh screen) and ~4 L of filtered low-absorbance (A254: 0.09, a254: 21 m−1) mangrove creek water was mixed (water was filtered using combusted 0.7 μm GF/F filters). The solution was equilibrated for 48 h to negate potential FDOM inputs leached from the sediments (Downing et al., 2012; Lee et al., 2015). The solution was then placed in a constantly stirred vessel connected to a YSI flow-cell containing the FDOM and turbidity sensors with previously acid-washed tubing and a peristaltic pump. Sequential removal of turbidity was achieved by siphoning 250 mL aliquots from the stirred vessel, filtering and then returning the filtrate to solution (Figure S2). As previously observed, highly turbid waters attenuated FDOM fluorescence considerably (Downing et al., 2012; Lee et al., 2015). Less turbid conditions (values < 100 FNU) showed a strong linear relationship (r = 0.99, p < 0.0001, n = 216) to FDOM (Figure S2, values <100 FNU). For this study, turbidity values were generally low with 0.5% of turbidity values exceeding 100 FNU and 1.9% exceeding 25 FNU. Based on linear regression of turbidity values lower than 100 FNU in Figure S2, it is estimated that 25 FNU attenuated <5% of the total FDOM fluorescence signal. Furthermore, spikes in turbidity did not appear to elicit anomalous FDOM signals (e.g., Figure S3). This suggests that, while attenuation of fluorescence by suspended solids likely influences FDOM signals, a simple correction for the effects of turbidity on FDOM signals may not be appropriate (Lee et al., 2015). As such, turbidity corrections were not applied to FDOM measurements (See Section Statistics and FDOM Errors for estimates of error).
Establishing the FDOM-DOC Relationship
The relationship between FDOM and DOC was calibrated by collecting grab samples concurrent with in situ FDOM measurements. Due to high seasonal and spatial variability of DOC optical properties in the Shark River (Cawley et al., 2014), the FDOM:DOC relationship was established both with spatial transects and temporal sampling. Four seven-point spatial transects were collected from the marine end member (Ponce De Leon Bay) to the freshwater end member at SRS-4 (Figure 1). Transects were collected during wet and dry seasons and seasonal transitions and temporal data were collected through portions of two consecutive tidal cycles. DOC samples were filtered through 0.7 μm GF/F filters and quantified on a Shimadzu TOC analyzer after acidification and purging to remove inorganic C. A total of 53 paired measurements of DOC and FDOM collected from 02/2015 to 04/2016 exhibited strong linear correlation (r = 0.96, p < 0.0001, Figure S4) yielding a conversion equation of FDOM (QSU) = 0.11*DOC (μM) + 19.06. The root mean square error (RMSE) for this regression was ±9.8 QSU or ±7.5% of the average FDOM value (See Section Statistics and FDOM Errors). Due to the error component associated with converting FDOM fluorescence to DOC concentrations, FDOM measurements were primarily reported in QSU throughout the manuscript while DOC concentrations were reported in μM or ppm for comparison with literature values and to facilitate calculating DOC fluxes. DOC fluxes were calculated as the product of DOC concentration and discharge.
Statistics and FDOM Errors
All statistical analyses were performed using the JMP® Version 12 statistical package (SAS Institute Inc., Cary, NC, 1989–2007). Results of linear regressions are reported as correlations (r). Changes in FDOM presented as percent were calculated using the average FDOM value for the study (130.8 QSU) for consistency. Non-conservative mixing lines were calculated for regression plots of FDOM vs. salinity (e.g., Figure 3), based on previously published methods (Cawley et al., 2014).
Mangrove inputs during FDOM spikes were quantified for three consecutive tidal cycles in T2 with clear ebb tide spikes (Figure 5). For each tidal cycle, consecutive data points were connected with lines. Next, a baseline was drawn by connecting the lowest FDOM value at the start of the tidal cycle to the lowest value at the end of the tidal cycle. The baseline was then set to zero, so integrations only included the change in FDOM during the tidal cycle rather than the entire FDOM signature. Next, spikes were removed by connecting the points immediately preceding and following the spike. Finally, each tidal cycle was integrated with and without FDOM spikes using the “AUC” package in R (Ballings and Van den Poel, 2013). The integration process is represented graphically in Figure S5. FDOM contributions from the three tidal cycles ranged from 5.7 to 14.8% and were estimated to account for up to 24% in other tidal cycles.
Error terms associated with each of the three potential interferences to in situ FDOM measurements are identified in Section Fluorescence Interference and Corrections. The correction factor for temperature was based on linear regression of r > 0.99 (p < 0.0001) with and RMSE <1 QSU. For dissolved materials, attenuation was estimated at <10% based on A254 values for the site. For suspended solids, attenuation/scattering effects on FDOM were estimated at less than 5% for >98% of the data-set. Assuming attenuation of dissolved and suspended solids is additive, FDOM measurements may be ~15% lower than actual FDOM values. These conditions represent the upper limits of FDOM attenuation based on high levels of dissolved matter (A254: 0.44, a254: 101 m−1) and high turbidity (25.0 FNU). As attenuation from dissolved and suspended solids is not corrected for in FDOM values reported in this study, it is important to remember these potential sources of under-linearity when interpreting QSU values.
Results
Environmental Conditions
This study covers a period of limited freshwater delivery to the Shark River estuary due to below-average rainfall and consequent reductions in water management inputs across the northern border of ENP into Shark River Slough (Table 1). This limited rainfall led to moderate to severe drought for the region stretching from the early dry season through the early wet season (droughtmonitor.unl.edu). The combination of these factors resulted in lower than normal discharge rates from the Shark River, with net negative flows (marine inflows to the estuary) from 12/2014 to 09/2015, the longest period of negative discharge for the 2002–2015 data record (USGS gage #252230081021300, tidally filtered discharge). As such, time-series D1, D2, and W1 (early dry, late dry and early wet seasons, respectively) all received minimal freshwater inputs from water management (although W1 received increased rainfall). In contrast, T1 and T2 time-periods exhibited high discharge rates for the estuary linked to high inflows from the S12A-D structures (Figure 1). Sea level acted as an additional hydrologic control and increased from D2 through T2, with the highest daily mean sea level value recorded at Key West between 1913 and 2013 occurring on 10/01/2015, the start-date for T2 (CO-OPS1). Basic statistics for in situ water quality data collected for this study are displayed in Table 2 by time-series. Salinity and freshwater hydrology were inversely related, with lowest salinity during periods of high freshwater discharge and low sea-level (T1). Salinity increased through D1 and peaked during D2 due to minimal freshwater inputs. Salinity values decreased throughout W1 due to increased rainfall and during T2 due to increased water management inflows (Table 1). Dissolved oxygen (DO) inversely co-varied with seasonal patterns in temperature and on diel time-scales, with higher values during the day. In general, turbidity increased with channel velocity (both positive and negative), suggesting control by tidal or wind-induced erosion rather than allochthonous delivery to the estuary, matching previously reported decoupling of particulate and dissolved carbon pools for this system (He et al., 2014).
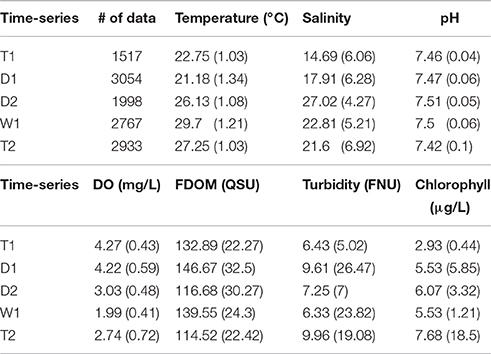
Table 2. Averages and standard deviations for water quality variables by time-series.
Values for FDOM ranged from 55.2 to 208.6 QSU, matching previously reported QSU values for maximum fluorescence intensity in coastal mangrove rivers of the Everglades (Jaffé et al., 2004). High tidal variability was clearly evident for the high resolution data, with variation of the FDOM signal in excess of 100% between consecutive low and high tides (e.g., 1/26/15 and 3/27/15, Figure 2). Highest FDOM values occurred during the beginning of the dry season, similar to previously observed longer-term seasonal trends upstream of SRS-5, which have been attributed to a combination of evaporation-mediated concentration and water management inputs (Chen et al., 2013). In contrast, FDOM values were considerably lower during the late dry season (D2) when DOC concentrations are historically higher in the upstream freshwater marshes (Chen et al., 2013).
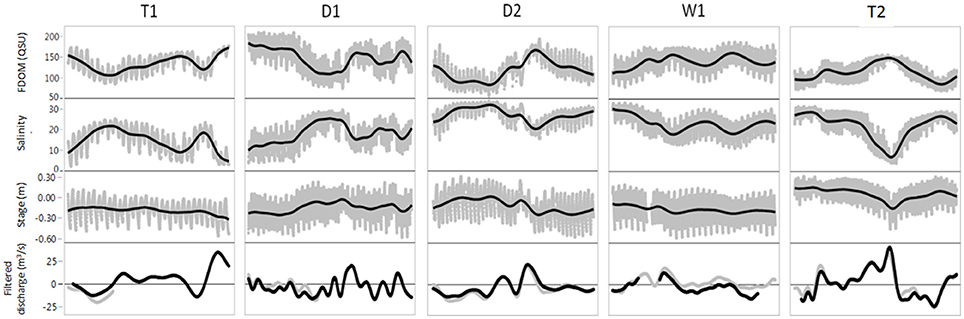
Figure 2. FDOM, salinity, stage and tidally filtered discharge for the 5 time-series: T1, D1, D2, W1, and T2 (see Table 1 for dates). Gray dots are 15-min interval measurements for FDOM, salinity and stage. Black lines for FDOM, salinity and stage are smoothing lines to highlight multi-day trends. For filtered discharge, black lines is hourly tidally filtered discharge measured at Gunboat Island. Gray filtered discharge lines represent data from the adjacent Harney River drainage to serve as reference for gaps in the Gunboat discharge record.
Relationships between FDOM, Water Quality, and Hydrology
To quantitatively assess the relationships between water quality, hydrology and FDOM, linear regression of FDOM vs. parameters in Table 2 is presented in Table 3 as correlations, both for 15-min data and daily averages. Of these parameters, salinity had the strongest relationship to FDOM at both temporal scales. The relationship between FDOM and stage had the second highest r-values, with a higher correlation for daily data. At daily resolution, filtered discharge exhibited the third strongest correlation (though weak: r = 0.28). Temperature, pH, and filtered discharge showed weak correlations to FDOM for the high-resolution data (r = −0.20, −0.24, and 0.24, respectively) as did temperature, discharge and turbidity for daily resolution (r = −0.22, 0.17, and −0.22, respectively). Based on the above (see Table 3), salinity, stage, and tidally filtered discharge (at daily resolution) were investigated as potential drivers of high-frequency FDOM dynamics.
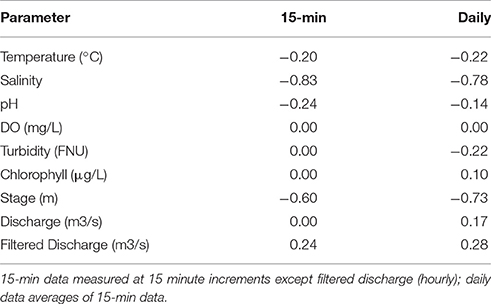
Table 3. Correlations (r) of FDOM to water quality and hydrology variables.
Salinity and FDOM
Measurements of FDOM at 15-min intervals showed distinct semi-diurnal patterns related to tidal influence and inversely tracked salinity patterns where highest FDOM values corresponded to lowest salinity for each tidal cycle (Figure 2), as observed in other mangrove systems (Dittmar and Lara, 2001). Correlations to FDOM were higher for 15-min than daily measurements (Table 3), indicating tidal control. The relationship between salinity and FDOM was examined using the ratio of the two variables (FDOM:salinity) shown in Figure 3A. A clear divide in the data-set was observed through this relationship, where T1 and T2 had lower FDOM:salinity ratios compared to the remaining three time-series. This divide matched closely with management-driven inflows as well as tidally filtered discharge (both considerably higher for T1 and T2, see Table 1). A similar divide in the DOC:salinity ratio observed by (Cawley et al., 2014) indicated that T1 and T2 most closely resembled wet season characteristics while the remaining time-series matched the dry season. As outlined in Section Environmental Conditions, the study period experienced abnormal hydrology, and the divide in FDOM:salinity confirmed that conventional seasonal wet/dry timing did not fit this data-set. Rather, seasonal transition time-series (T1 and T2) resembled classic wet season hydrology and salinity gradients while the remaining three time-series resembled dry season conditions due to reduced rainfall and consequent drought. Based on this observation, the data-set was divided into two sub-groups: the first for time-series during periods of low freshwater inflow (D1, D2, and W1, Figure 3B), the second for time-series during periods of high freshwater inflow (T1 and T2, Figure 3C). Dividing the data-set in this manner dramatically improved linear regression fits (r = 0.94 for D&W, r = 0.93 for T) in comparison to the full data-set (r = 0.83). An additional split in Figure 3C during T2 was observed, where FDOM:salinity ratios transitioned from high salinity and low freshwater inputs to dramatically increased freshwater inflows and low salinity. To examine this, T2 was sub-divided into two sections: before and during the start of high outflows (positive discharge from the estuary, Figure 2) and during and after high outflows. The first sub-group clustered more with D&W time-series due to enhanced saltwater presence, higher stage and low or negative filtered discharge (Figure 3C, dark gray points). The second sub-grouping fell in the same FDOM:salinity region as T1: characteristic of high water management inflows in spite of high sea levels.
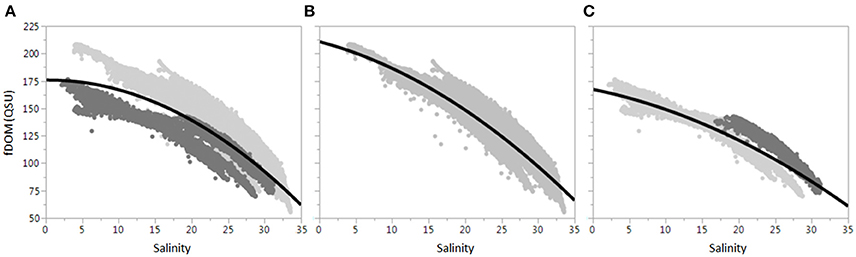
Figure 3. The FDOM:salinity relationship. (A) Shows all data together, while (B,C) divide the data-set into D&W and T sub-groups, respectively. The dark gray dots for (A) are T time-series. The dark gray dots for (C) are discussed in Section Water Management and Rainfall Control Daily FDOM Patterns.
The data presented in Figure 3 suggest a non-conservative relationship between FDOM and salinity, where FDOM values were higher at the mid-estuary than would be expected for conservative (linear) mixing behavior of freshwater and marine endmembers. A similar relationship was previously reported for this location by Cawley et al. (2014), who determined that non-conservative inputs were primarily due to DOC contributions from the riparian mangrove forests. Following this hypothesis, FDOM:salinity plots were fitted with quadratic regression lines which improved fits over linear regression (full data-set: r = 0.85, D&W: r = 0.94, T: r = 0.94). Non-conservative inputs were calculated for individual neap and spring tides for each time-series (n = 20) as the difference between integrations of quadratic and linear fits (Cawley et al., 2014). An average non-conservative input percentage of 6 ± 2% was estimated with a maximum of 9% (neap tide, D2) and a minimum of 3% for the consecutive spring tide.
FDOM and Tidal Dynamics
Tidal FDOM patterns were inversely related to stage with a temporal lag component, where highest tidal values for FDOM lagged lowest stage (low tide) by 1–2 h. Stage correlations to FDOM (FDOM:stage) were considerably higher for daily data (Table 3), likely due to the temporal lag observed at tidal time-scales. When tidal FDOM patterns were time-matched to stage (lowest FDOM values time-lagged to coincide with peak stage), a much stronger regression was achieved (r = −0.77), similar to FDOM:salinity. As with salinity, the FDOM:stage data was divided into T and D&W groupings, with a better fit for D&W (r = −0.79) than T (r = −0.72), indicating stronger tidal control of FDOM:stage dynamics during periods of low freshwater inflows. Values of FDOM were consistently higher for neap tides (average 136.4 QSU) compared to spring tides (average 124.6 QSU). Neap tides also exhibited lower salinity, lower stage and higher tidally filtered discharge, indicating reduced tidal influence. The difference in FDOM between neap and spring tides was considerably larger for T time-series (+17.1 QSU, average of spring and neap: 119.8 QSU) compared to D&W time-series (+10.2 QSU, average of spring and neap: 136.5 QSU). In general, decreasing FDOM trends were observed during spring tides, while increasing trends accompanied neap tides. Differences in neap/spring FDOM patterns provided evidence that greater freshwater influence during neap tides led to higher allochthonous DOC inputs to the estuary. In addition, this suggested a temporal decoupling between weekly (spring/neap tides) and monthly (time-series) resolutions for the relationship between freshwater discharge and FDOM where neap tides increased both filtered discharge rates and FDOM signals while Figure 3 indicated dilution of FDOM (lower signal) during periods of increased freshwater delivery.
Rapid changes in FDOM during ebb tides were consistently observed near the tidal FDOM minimum which did not fit the semi-diurnal sinusoidal tidal signature. Examples of these FDOM patterns along with additional parameters are shown in Figure 4, with the unexpected spikes highlighted in black. These FDOM spikes consistently coincided with a knee observed in ebb tide stage patterns which could not be fully explained by tidal flow asymmetry typically observed in mangrove channels (Mazda et al., 1995). The knee denoted a deceleration of falling water levels attributed to geomorphological control of tidal hydrodynamics by riparian mangrove forests. Specifically, it was hypothesized that these patterns correspond to tidally regulated porewater exchange between mangrove sediments and the river channel. The location where the sonde was deployed is immediately adjacent to mangrove sediments perforated with crab burrows, a feature shown to enhance hydraulic connectivity of mangrove sediments to the water column [up to 20% in some systems, Stieglitz et al. (2013)]. Reduced dissolved oxygen (DO) levels, often associated with porewater hypoxia in mangrove ecosystems (Bouillon et al., 2007), were generally present during FDOM spikes supporting the hypothesis of porewater contributions. However, these patterns were somewhat variable, with examples in Figure 4 showing consistently depleted DO concurrent with FDOM spikes during T2 but not T1.
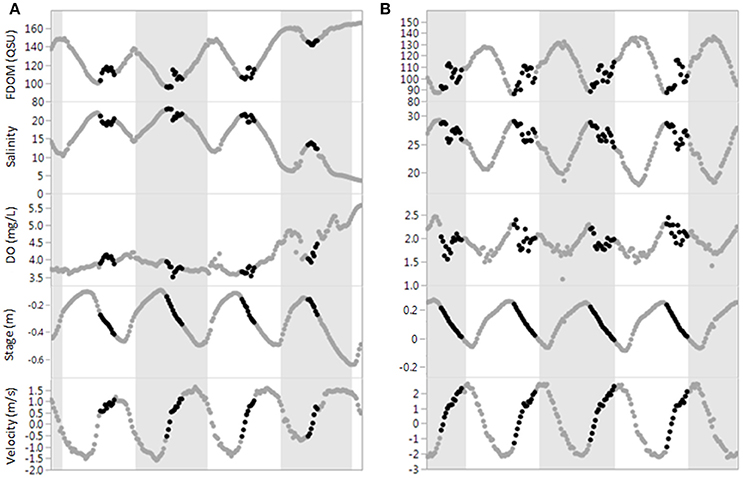
Figure 4. Time-series comparing mangrove inputs during T1 (A, left) and T2 (B, right). Black points highlight FDOM spikes during ebb tide. Note that lower salinities during T1 show no FDOM spike. In contrast, T2 has very pronounced spikes.
Daily FDOM Dynamics
Multi-day patterns in FDOM (see smoothing lines in Figure 2) corresponded to freshwater input patterns observed as tidally filtered discharge. Correlation of daily FDOM values to filtered discharge was relatively weak for the whole data set (r = 0.30, n = 145, p = 0.0009) and for D&W (r = 0.29, n = 77, p = 0.0083) but stronger for T (r = 0.60, n = 45, p < 0.0001), likely due to substantial water management inputs during T1 and T2. To quantify the impact of filtered discharge on changes in FDOM, the difference in FDOM between consecutive days was calculated as δ-FDOM = FDOM(x+1)−FDOM(x) where x is the date. Based on δ-FDOM calculations for time-series, daily changes in FDOM of +40.0 QSU to −28.6 QSU indicate equivalent shifts of +377.4 μM (+31%) to −274.7 μM (−22%) for DOC concentrations. The regression of δ-FDOM:filtered discharge (r = 0.65, n = 115, p < 0.0001) showed a much stronger relationship than FDOM:filtered discharge (r = 0.30, n = 120, p = 0.0009). Interestingly, correlations between filtered discharge and δ-FDOM were stronger for D&W (r = 0.74, n = 72, p < 0.0001) than T (r = 0.71, n = 43, p < 0.0001), which was unexpected since T time-series were more strongly linked to filtered discharge patterns. Regression slopes for T and D&W (0.01 and 0.03, respectively) indicated that equivalent changes in filtered discharge yielded a change in the FDOM signal three times greater for dry season time-series compared to wet season. This was attributed to lower stage during D&W time-series (Table 1), leading to smaller volume in the Shark River. The corresponding evapo-concentration of the Shark River DOC pool would be more sensitive to dilution from changes in freshwater flow.
DOC Fluxes
Previously, long-term DOC fluxes were calculated for this site based on monthly DOC concentrations and tidally filtered discharge (Regier et al., 2016), with modeling of monthly flux values predicted by salinity, rainfall, water management inflows, and the Atlantic Multidecadal Oscillation (AMO), a long-term climatic index. Short-term fluxes based on DOC (using FDOM as a proxy) and hourly tidally filtered discharge were calculated for this study to compare and contrast patterns and drivers of DOC fluxes in the Shark River across temporal scales. Both T time-series exhibited net positive flux values (DOC exported from the estuary), averaging 3.4 * 109 mg C d−1. In contrast, all D&W time-series had negative flux values averaging −4.5 * 109 mg C d−1, indicating considerably longer DOC residence times between periods of positive filtered discharge (average movement calculated from velocities of 2432 m d−1 for D&W in comparison to 8843 m d−1 for T time-series in relation to ~9500 m from the study site to the river mouth). For hourly flux values, no correlations for water quality or hydrology variables (except discharge) were observed, including salinity and stage, which both correlated to long-term fluxes (Regier et al., 2016). As discharge was higher during neap tides, DOC fluxes were also considerably higher, with averages of 2.8 * 109 mg C d−1 and −5.9 * 109 mg C d−1 for neap and spring, respectively. This pattern held true when fluxes were sub-divided into D&W and T groupings with neap tide fluxes 6.2 * 109 mg C d−1 and 1.2 * 1010 mg C d−1 higher than spring tide fluxes for D&W and T subsets, respectively.
To validate the extrapolation of high-frequency FDOM measurements to DOC values and improve the accuracy of DOC flux determinations, flux values were calculated from daily DOC data (based on FDOM as a proxy) and monthly grab samples where the DOC value at the beginning of each time-series was extrapolated to all days in the time-series (Gaiser and Childers, 2016). As the two sets of fluxes were determined for the same days using the same filtered discharge data, the only difference was the application of low-resolution vs. high-resolution DOC concentrations in the estimates. The resulting flux calculations were compared using linear regression (Figure 6), with stronger correlations for D&W time-series (r = 0.95, n = 73, p < 0.0001) in comparison to T time-series (r = 0.93, n = 43, p < 0.0001). To interpret if fluxes based on monthly grab samples were over-estimated or under-estimated in comparison to high-frequency flux calculations, a 1:1 line was included. In general, linear regression for D&W fell slightly below the 1:1 line (slope = 0.80), indicating monthly fluxes were under-estimated (Figure 6A) while T time-series were on or above the line (slope = 1.25), particularly for high fluxes during T2 (Figure 6B).
Discussion
High-resolution measurements of FDOM showed highly dynamic DOC behavior controlled at tidal and daily time-scales by a mixture of tidal influence, freshwater inputs, and exchange with mangrove forests. Whereas tidal control was consistent for all time-series, freshwater control of FDOM was more sporadic and varied seasonally. The study period was unique as the two major sources of freshwater to the Shark River (rainfall and water management inflows), which are usually coupled (though time-lagged, Saha et al., 2012) were separated, allowing for a comparison of the influence of each freshwater source on high-resolution FDOM dynamics. In addition, previously unobserved spikes during ebb tide were identified as likely originating from porewater exchange with the mangrove forests. While tidal control is evident at hourly resolution and freshwater influence is well-characterized at daily resolution, the abovementioned mangrove-derived spikes would not be observable, even at hourly resolution.
Tidal-Scale FDOM Dynamics
The observed semi-diurnal variability in FDOM patterns in contrast to those of salinity and stage suggest strong tidal control of DOC leading to significant inverse relationships for all time-series with the former and weaker correlations with the latter. These relationships have been well-established in this region (Bergamaschi et al., 2012; Cawley et al., 2014) with salinity identified as a significant predictor of long-term DOC fluxes (Regier et al., 2016). However, untangling the influences of salinity and stage on estuarine DOC dynamics remains difficult (requiring controlled experimental conditions, e.g., Chambers et al., 2014) as these factors tightly co-vary. Data presented here shows that FDOM is temporally coupled to salinity and lags stage, suggesting that high-frequency DOC dynamics are primarily controlled by tidal drivers rather than simply by physical hydrology (stage).
A recent mesocosm study of C response to salinity and inundation in mangrove peat soils from the region found that higher salinity decreased porewater DOC by 2.8 ± 3.3 ppm (23 ± 27% of average DOC for this study), while increased inundation enhanced DOC concentrations by 3.6 ± 4.5 ppm [30 ± 37%; based on a 8 cm increase in stage; (Chambers et al., 2014)]. Findings from the current study of an inverse relationship between DOC and salinity at tidal time-scales match findings from the mesocosm study (Chambers et al., 2014). However, increased salinity conditions equivalent to those reported by Chambers et al. (2014) yielded a much larger decrease in DOC (−7.5 ppm or −62% for D&W time-series in Figure 3B, −5.0 ppm or −41% for T time-series in Figure 3C).
In contrast, the inverse relationship between tidal stage and DOC (attributed to dilution) does not match with higher DOC in inundated mesocosm experiments (Chambers et al., 2014). In the latter, an equivalent increase in stage of 8 cm yields decreased DOC of considerably smaller magnitudes (−0.7 ppm or −6% for D&W time-series, −0.5 ppm or −4% for T time-series).
Decoupled response of DOC to inundation between mesocosm and in situ measurements may stem from the estimated small contributions of mangrove-derived DOC at this location (~6% of the DOC pool), whereas the mesocosm results present changes in DOC exclusively from mangrove peats. Based on Chambers et al. (2014), increased inundation is expected to decrease the concentration of the overall DOC pool through dilution while simultaneously enhancing mangrove inputs. As sea level rise drives higher saltwater intrusion and increased inundation in this region, higher C loss from the mangrove forest (See also Section Mangrove Contributions to the DOC Pool) is expected to account for a larger portion of the Shark River DOC pool and increase outwelling of mangrove-derived DOC (Dittmar and Lara, 2001). Such processes are expected to increase light attenuation in the water column (Ganju et al., 2014) of adjacent light-sensitive seagrass and coral reef communities (Shank et al., 2010; McPherson et al., 2011) through long-range DOC transport (Maie et al., 2012; Yamashita et al., 2013. However, DOC export from this region in general is predicted to decrease in the future due to shifting hydrology due to climate change (Regier et al., 2016). Thus, the potential balance between enhanced mangrove forest inundation and predictions based on long-term DOC datasets remains to be determined. Better understanding of the potentially complex relationship between inundation and DOC export is therefore crucial for low-relief coastal systems like mangrove forests, where ecosystem sustainability is based on accretion keeping pace with sea-level rise (McKee, 2011). Mangrove accretion is primarily dependent on primary productivity (Cahoon and Lynch, 1997) and correlates to organic C burial rates, which are below global averages for the Shark River (Breithaupt et al., 2014). Thus, potential DOC losses from mangrove peats due to the combined effects of increased salinity and inundation could increase the vulnerability of the coastal mangrove fringe to submergence.
Mangrove Contributions to the DOC Pool
The DOC pool in the Shark River is strongly influenced by upper watershed freshwater wetland sources, combined with mangrove inputs (Yamashita et al., 2010; Bergamaschi et al., 2012; Cawley et al., 2014). However, it is not clear from previous studies if this mangrove contribution is related to porewater inputs, litter leachates, or combinations of these. As such, these contributions could respond differently to inundation patterns, tidal action, changes in primary productivity, and associated litter-fall. Bouillon et al. (2007) reported considerable porewater contributions of DOC (estimated at 30% of the total DOC pool) draining a mangrove forest in Tanzania during ebb tide, with porewaters exhibiting considerably higher salinity than the creek water column. In contrast, the notably lower percentage of DOC attributed to mangrove inputs in the Shark River indicates that porewater DOC may not account for a considerable component of the DOC pool. However, this is likely due to the large allochthonous DOC inputs received from upstream freshwater marshes in the Everglades, whereas the Tanzania creek system received minimal freshwater inputs (Bouillon et al., 2007).
However, the abovementioned spikes in FDOM during ebb tide provide new information on the role of mangrove inputs to this system. Although non-conservative mixing calculations indicate that mangrove DOC comprises a relatively minor component of the total DOC pool, FDOM spikes indicate seasonally variable contributions exceeding the 6% mangrove input estimation. For three consecutive tidal cycles, FDOM signals were compared by including or excluding the FDOM spikes (Figure 5). Based on this comparison, between 5.7 and 14.8% of the total change in FDOM during these tidal cycles was attributed to mangrove porewater inputs. The percent contribution of FDOM spikes varied with season, with higher and more consistent mangrove DOC contributions observed during the T time-series compared to D&W time-series. This supports previous research reporting higher CDOM production during wet periods compared to dry periods (Shank et al., 2010). However, the magnitude of these FDOM spikes infer that the majority of mangrove DOC export into the river during ebb tide (estimated at 65% for SRS-6, Romigh et al., 2006) occurs at rapid time-scales (1–2 h). Thus, accurately characterizing this highly dynamic exchange process to constrain aquatic C fluxes in mangrove forests requires high-frequency measurements.
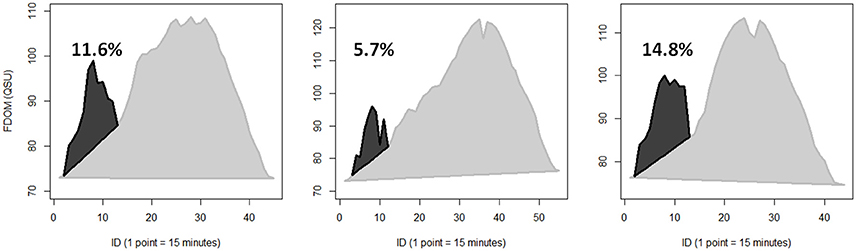
Figure 5. Quantification of rapid spikes in FDOM during ebb tide attributed to mangrove porewater inputs were calculated for three consecutive tidal cycles during T2. Dark gray areas outlined in black represent FDOM spikes associated with ebb tide mangrove porewater inputs. Light gray areas outlined in gray represent the rest of the change in FDOM during each tidal cycle, where change is defined as FDOM above a baseline running from the lowest FDOM value at the start of the tidal cycle to the lowest FDOM value at the end of the tidal cycle. Percentages indicate the percent of FDOM change attributed to ebb tide mangrove porewater inputs.
Seasonal variation in FDOM spikes also gives insight into the potential role of mangrove porewaters and primary production in DOC exchange between mangrove forests and the river channel. If primary production preferentially dictated mangrove DOC inputs over hydrology, it would be expected that the highest inputs (largest spikes) would coincide with peak primary productivity during the wet-season (Castañeda-Moya et al., 2013). However, spikes are smaller and less consistent during W1 than T1 or T2, suggesting that the extent and duration of tidal inundation rather than patterns in primary productivity controls the magnitude of DOC porewater exchange. Furthermore, this may indicate that DOC spikes are more strongly associated with leaching from mangrove sediments and porewater exchange, rather than direct leaching from mangrove leaves and stems (Maie et al., 2006b; Romigh et al., 2006).
Water Management and Rainfall Control Daily FDOM Patterns
Daily and multi-day patterns in FDOM showed clear links to freshwater inputs (Figure 2, Section Daily FDOM Dynamics), indicating the essential role of upstream hydrology in regulating DOC concentrations in the Shark River. In particular, inflows from water management structures drive a division in FDOM:salinity ratios between time-series (Figure 3). Of the hydrologic parameters influencing the estuarine salinity gradient, water management structures are the only means of directly regulating freshwater inflows to this system, with natural delivery of freshwater from rainfall and potential groundwater inputs and seepage through barriers to flow (Saha et al., 2012). A comparison of T1 and T2 time-series demonstrates the control of FDOM temporal dynamics exerted by managed freshwater inputs. Both T1 and T2 exhibit similar FDOM:salinity ratios (Figure 3), suggesting similar DOC source and mixing dynamics. However, neither the salinity gradient (dramatically different sea levels, Table 1, and salinity, Table 2, between the two time-series) nor rainfall (similar for all time-series except W1) can explain the similar FDOM:salinity distributions for T1 and T2 in contrast to the other three time-series. Instead, freshwater control by water management inflows appears to link these time-series (high for T1 and T2, low or absent for the other time-series). This is evident in the shift of FDOM:salinity observed for T2 (Figure 3C and Section Salinity and FDOM) from ratios characteristic of the dry-season to wet-season which occurred in less than a day. Based on this rapid change along with the divide in Figure 2, it is clear that water management inflows (either directly or indirectly) control Shark River hydrology and DOC dynamics and export at short time-scales.
Both rainfall and water management inputs were identified as significant freshwater drivers of long-term DOC fluxes in this system, with rainfall contributing almost double the modeling power as managed inflows (Regier et al., 2016). For the high-frequency data collected during this study, the influence of rainfall is less obvious than water management, likely due to unsusually low precipitation rates for all time-series except for W1 (Table 1). The clearest evidence of rainfall driving changes in DOC occurred with onset of the rainy season (between D2 and W1). Low FDOM values for D2 (relative to D1) were attributed to enhanced saltwater intrusion into upstream freshwater marshes observed through semi-diurnal tidal signatures in stage data at the Rookery Branch gage 20 km upstream of SRS-5 (#022908295, http://waterdata.usgs.gov/). Subsequently increased FDOM during W1 was attributed to the enhanced hydrologic connectivity of the estuary to upstream marsh regions as a result of increased rainfall. Decreased DOC concentration and exports due to drought conditions (e.g., D2) have been reported for other coastal wetland systems (e.g., Ardón et al., 2016). Likewise, rainfall events have been linked to increased DOC concentrations in both marsh and mangrove systems (Bergamaschi et al., 2012; Ryder et al., 2014), although shifts in other drivers between D2 and W1 like soil temperature may be partially responsible for the changes in DOC concentration (Davidson and Janssens, 2006; Ryder et al., 2014).
During the study period, the influences of water management and rainfall on daily FDOM dynamics were evident. However, whereas water management inflows dramatically shifted estuarine hydrology from negative to positive discharge, rainfall did not. The importance of water management to maintain seasonal freshwater delivery has been well-established for this region (Sklar et al., 2005; Obeysekera et al., 2014). High-frequency measurements presented here indicate that, particularly during periods of below-average freshwater flow (e.g., drought), water management inputs are capable of rapidly altering salinity and associated water quality gradients in the coastal Everglades. Based on this, corrective actions by water management (e.g., emergency water releases to slow saltwater intrusion during periods of high drought) guided by high-frequency monitoring provides managers with new tools to rapidly respond to observed or predicted environmental problems. Likewise, as this region is clearly sensitive to managed inflows, high-frequency measurements are increasingly critical in the monitoring of estuarine response to changes in freshwater inputs.
Linking Short-Term and Long-Term Fluxes
Hydrology is the primary driver of DOC fluxes, and the strong linear fits in Figure 6 confirm this. However, differences in fluxes based on monitoring frequency of DOC concentrations are evident through the deviations of fluxes from the 1:1 line. In general, D&W time-series cluster together close to 1:1 (Figure 6A), suggesting that during periods of lower freshwater inflows and therefore less variable filtered discharge (Figure 2), interpolating daily DOC fluxes from monthly DOC values is relatively accurate. In contrast, T time-series show more variability (Figure 6B), where T1 flux calculations closely follow the 1:1 line but T2 does not. In particular, high flux values during T2 are dramatically over-estimated (up to 180%) by interpolation of monthly DOC to daily resolution. This is likely due to large and rapid fluctuations in discharge (Figure 2) driving rapid changes in DOC concentrations. As such, interpolation of daily fluxes from monthly DOC sampling frequencies may be applicable during periods of relatively static discharge, but is not sufficiently accurate to constrain DOC export rates during periods of variable freshwater flows. This supports previous findings that weekly grab sampling was temporally inadequate to characterize DOC fluxes during rapid shifts in hydrology (Jollymore et al., 2012; Pellerin et al., 2012). Thus, current long-term monitoring projects seeking to better constrain C budgets in dynamic aquatic systems like estuaries could greatly benefit from the simultaneous application of high-frequency measurements.
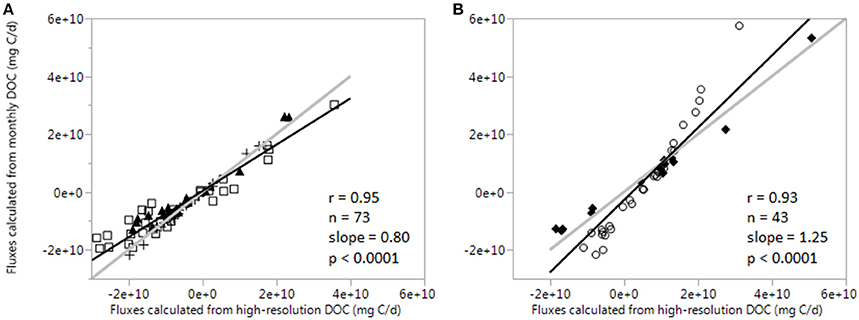
Figure 6. Comparison of DOC fluxes calculated using the same discharge data but different data sources of DOC (different sampling resolutions). Fluxes calculated from monthly grab samples are on the y-axis, fluxes calculated from daily averges of high-resolution FDOM measurements are on the x-axis. (A) Plots D&W time-series (D1: open squares, D2: solid triangles, W1: crosses). (B) Plots T time-series (T1: solid diamonds, T2: open circles). Solid gray lines are best fit linear regressions and dashed black lines represent a 1:1 line.
Conclusions
A suite of environmental drivers, including salinity, stage and tidally filtered discharge, were identified as regulators of high-frequency FDOM patterns in the Shark River estuary. Values for FDOM were dynamic at tidal time-scales, changing in excess of 100% between consecutive low and high tides during periods of high freshwater discharge. The drivers of FDOM manifested in multiple distinct patterns, with salinity and stage varying semi-diurnally with tides, and knees in ebb tide stage corresponding to spikes in FDOM potentially attributed to mangrove porewater inputs accounting for up to 24% the tidal FDOM signal, particularly during periods of higher inundation. Freshwater discharge also controlled daily and multi-day changes in FDOM (up to ±25%), indicating hydrologically driven shifts in DOC concentration, and potentially source. The influence of water management on DOC dynamics in the mangrove estuary demonstrated the capability of managed inflows to restore the salinity gradient and accompanying estuarine C dynamics following pronounced drought and elevated sea levels. Rainfall was observed to alter DOC concentrations but had less influence over salinity and FDOM than water management (potentially related to drought conditions during much of this study). In general, managed inflows most strongly affected FDOM dynamics during seasonal transitions while precipitation preferentially and expectedly, controlled FDOM during the onset of the wet season. While management strategies currently focus on longer term hydrologic response (e.g., seasonal to inter-annual) in the context of Everglades restoration, rapid response of the coastal zone to freshwater inflows suggests the ability of water management to control hydrology in the mangrove ecotone at much shorter time-scales. Since response of DOC mixing and source dynamics to environmental drivers changes across temporal scales, integration of high-frequency data into current long-term monitoring programs is essential to understand temporally complex relationships between water quality and hydrology.
Hydrology, climate and management have all been identified as drivers of long-term DOC export in the Shark River (Regier et al., 2016), and findings here generally support that these drivers apply to short-term (hours to days) variations in DOC (based on FDOM as a proxy). Adaptive restoration management relies on constantly improving our understanding of ecosystem function and response to climatic and management factors. Further investigating key ecological indicators like biogeochemistry and nutrient transport spanning spatial and temporal scales will advance modeling capabilities and inform management decision-making. High-resolution measurements of FDOM provide new insights into organic matter cycling in coastal systems and indicate the potential value of high-frequency data to complement and expand existing long-term monitoring programs through a temporally integrated understanding of biogeochemical processes and nutrient budgets in dynamic coastal ecosystems.
Author Contributions
PR performed field work, data analysis, interpretations, and contributed to writing the manuscript. RJ obtained the funding to support this study, designed the study, assisted in data analyses and interpretation and writing the manuscript.
Conflict of Interest Statement
The authors declare that the research was conducted in the absence of any commercial or financial relationships that could be construed as a potential conflict of interest.
Acknowledgments
This work was primarily supported through the George Barley Endowment and is associated with the NSF-funded Florida Coastal Everglades LTER (DBI-0620409) and the SFWSC programs. The authors thank John Kominoski for helpful comments on the original manuscript, Mike Rugge for assistance with Figure 1 and Rafael Travieso for help in the field. The authors also thank Piotr Kowalczuk and Heather Erin Reader for comments that greatly improved this manuscript. This is contribution number 816 from the Southeast Environmental Research Center.
Supplementary Material
The Supplementary Material for this article can be found online at: https://www.frontiersin.org/article/10.3389/fmars.2016.00250/full#supplementary-material
Footnotes
1. ^Center for Operational Oceanographic Products and Services (CO-OPS) (2016-07-14): NOAA Monthly Mean Sea Level Summary Data for the Key West, Florida, Water Level Station (FCE) (NOAA/NOS Co-OPS ID 8724580) from 01-Jan-1913 to Present. Center for Operational Oceanographic Products and Services (CO-OPS); Long Term Ecological Research Network. doi: 10.6073/pasta/4fca540ab6a8146f26b97c4eb1186a80.
References
Ardón, M., Helton, A. M., and Bernhardt, E. S. (2016). Drought and saltwater incursion synergistically reduce dissolved organic carbon export from coastal freshwater wetlands. Biogeochemistry 127, 411–426. doi: 10.1007/s10533-016-0189-5
Ballings, M., and Van den Poel, D. (2013). AUC: Threshold Independent Performance Measures for Probabilistic Classifiers. R package version 0.3.0. Available online at: https://CRAN.R-project.org/package=AUC
Bauer, J. E., Cai, W.-J., Raymond, P. A., Bianchi, T. S., Hopkinson, C. S., and Regnier, P. A. G. (2013). The changing carbon cycle of the coastal ocean. Nature 504, 61–70. doi: 10.1038/nature12857
Bergamaschi, B. A., Krabbenhoft, D. P., Aiken, G. R., Patino, E., Rumbold, D. G., and Orem, W. H. (2012). Tidally driven export of dissolved organic carbon, total mercury, and methylmercury from a mangrove-dominated estuary. Environ. Sci. Technol. 46, 1371–1378. doi: 10.1021/es2029137
Bouillon, S., Middelburg, J. J., Dehairs, F., Borges, A. V., Abril, G., Flindt, M. R., et al. (2007). Importance of intertidal sediment processes and porewater exchange on the water column biogeochemistry in a pristine mangrove creek (Ras Dege, Tanzania). Biogeosciences 4, 311–322. doi: 10.5194/bg-4-311-2007
Boyer, J. N., Fourqurean, J. W., and Jones, R. D. (1997). Spatial characterization of water quality in Florida Bay and Whitewater Bay by multivariate analyses: zones of similar influence. Estuaries 20, 743–758. doi: 10.2307/1352248
Breithaupt, J. L., Smoak, J. M., Smith, T. J., and Sanders, C. J. (2014). Temporal variability of carbon and nutrient burial, sediment accretion, and mass accumulation over the past century in a carbonate platform mangrove forest of the Florida Everglades. J. Geophys. Res. Biogeosci. 119, 2032–2048. doi: 10.1002/2014jg002715
Bridgham, S. D., Megonigal, J. P., Keller, J. K., Bliss, N. B., and Trettin, C. (2006). The carbon balance of North American wetlands. Wetlands 26, 889–916. doi: 10.1672/0277-5212(2006)26[889:TCBONA]2.0.CO;2
Cahoon, D. R., and Lynch, J. C. (1997). Vertical accretion and shallow subsidence in a mangrove forest of southwestern Florida, USA. Mangroves Salt Marshes 1, 173–186. doi: 10.1023/A:1009904816246
Castañeda-Moya, E., Twilley, R. R., and Rivera-Monroy, V. H. (2013). Allocation of biomass and net primary productivity of mangrove forests along environmental gradients in the Florida Coastal Everglades, USA. For. Ecol. Manage. 307, 226–241. doi: 10.1016/j.foreco.2013.07.011
Cawley, K. M., Yamashita, Y., Maie, N., and Jaffé, R. (2014). Using optical properties to quantify fringe mangrove inputs to the dissolved organic matter (DOM) pool in a subtropical estuary. Estuaries Coasts 37, 399–410. doi: 10.1007/s12237-013-9681-5
Chambers, L. G., Davis, S. E., Troxler, T., Boyer, J. N., Downey-Wall, A., and Scinto, L. J. (2014). Biogeochemical effects of simulated sea level rise on carbon loss in an Everglades mangrove peat soil. Hydrobiologia 726, 195–211. doi: 10.1007/s10750-013-1764-6
Chen, M., Maie, N., Parish, K., and Jaffé, R. (2013). Spatial and temporal variability of dissolved organic matter quantity and composition in an oligotrophic subtropical coastal wetland. Biogeochemistry 115, 167–183. doi: 10.1007/s10533-013-9826-4
Chmura, G. L., Anisfeld, S. C., Cahoon, D. R., and Lynch, J. C. (2003). Global carbon sequestration in tidal, saline wetland soils. Global Biogeochem. Cycles 17, 1111. doi: 10.1029/2002GB001917
Davidson, E. A., and Janssens, I. A. (2006). Temperature sensitivity of soil carbon decomposition and feedbacks to climate change. Nature 440, 165–173. doi: 10.1038/nature04514
Dittmar, T., and Lara, R. J. (2001). Driving forces behind nutrient and organic matter dynamics in a mangrove tidal creek in North Brazil. Estuar. Coast. Shelf Sci. 52, 249–259. doi: 10.1006/ecss.2000.0743
Downing, B. D., Boss, E., Bergamaschi, B. A., Fleck, J. A., Lionberger, M. A., Ganju, N. K., et al. (2009). Quantifying fluxes and characterizing compositional changes of dissolved organic matter in aquatic systems in situ using combined acoustic and optical measurements. Limnol. Oceanogr. Methods 7, 119–131. doi: 10.4319/lom.2009.7.119
Downing, B. D., Pellerin, B. A., Bergamaschi, B. A., Saraceno, J. F., and Kraus, T. E. C. (2012). Seeing the light: the effects of particles, dissolved materials, and temperature on in situ measurements of DOM fluorescence in rivers and streams. Limnol. Oceanogr. Methods 10, 9. doi: 10.4319/lom.2012.10.767
Duever, M. J., Meeder, J. F., Meeder, L. C., and McCollom, J. M. (1994). “The climate of South Florida and its role in shaping the Everglades ecosystem,” in Everglades: the Ecosystem and Its Restoration, eds S. M. Davis and J. C. Ogden (Boco Raton, FL: St. Lucie Press), 225–248.
Estenoz, S., and Bush, E. (2015). Everglades restoration science and decision-making in the face of climate change: a management perspective. Environ. Manage. 55, 876–883. doi: 10.1007/s00267-015-0452-x
Etheridge, J. R., Birgand, F., Osborne, J. A., Osburn, C. L., Burchell, M. R., and Irving, J. (2014). Using in situ ultraviolet-visual spectroscopy to measure nitrogen, carbon, phosphorus, and suspended solids concentrations at a high frequency in a brackish tidal marsh. Limnol. Oceanogr. Meth. 12, 10–22. doi: 10.4319/lom.2014.12.10
Evans, C. D., Monteith, D. T., and Cooper, D. M. (2005). Long-term increases in surface water dissolved organic carbon: observations, possible causes and environmental impacts. Environ. Pollut. 137, 55–71. doi: 10.1016/j.envpol.2004.12.031
Fellman, J. B., Spencer, R. G. M., Hernes, P. J., Edwards, R. T., D'Amore, D. V., and Hood, E. (2010). The impact of glacier runoff on the biodegradability and biochemical composition of terrigenous dissolved organic matter in near-shore marine ecosystems. Mar. Chem. 121, 112–122. doi: 10.1016/j.marchem.2010.03.009
Flagg, C. N., Vermersch, J. A., and Beardsley, R. C. (1976). New England Shelf dynamics experiment (March, 1974) Data Report Part II: The Moored Array. MIT Report, 76–1.
Gaiser, E., and Childers, D. (2016). Water Quality Data (Grab Samples) from the Shark River Slough, Everglades National Park (FCE), from May 2001 to Present. Long Term Ecological Research Network. doi: 10.6073/pasta/bb732e1e254c2a797afee65e6c21d535
Ganju, N. K., Miselis, J. L., and Aretxabaleta, A. L. (2014). Physical and biogeochemical controls on light attenuation in a eutrophic, back-barrier estuary. Biogeosciences 11, 7193–7205. doi: 10.5194/bg-11-7193-2014
He, D., Mead, R. N., Belicka, L., Pisani, O., and Jaffé, R. (2014). Assessing source contributions to particulate organic matter in a subtropical estuary: a biomarker approach. Org. Geochem. 75, 129–139. doi: 10.1016/j.orggeochem.2014.06.012
Hedges, J. I., Keil, R. G., and Benner, R. (1997). What happens to terrestrial organic matter in the ocean? Org. Geochem. 27, 195–212. doi: 10.1016/S0146-6380(97)00066-1
Hu, C., Muller-Karger, F. E., and Zepp, R. G. (2002). Absorbance, absorption coefficient, and apparent quantum yield: a comment on common ambiguity in the use of these optical concepts. Limnol. Oceanogr. 47, 1261–1267. doi: 10.4319/lo.2002.47.4.1261
Jaffé, R., Boyer, J. N., Lu, X., Maie, N., Yang, C., Scully, N. M., et al. (2004). Source characterization of dissolved organic matter in a subtropical mangrove-dominated estuary by fluorescence analysis. Mar. Chem. 84, 195–210. doi: 10.1016/j.marchem.2003.08.001
Jollymore, A., Johnson, M. S., and Hawthorne, I. (2012). Submersible UV-Vis spectroscopy for quantifying streamwater organic carbon dynamics: implementation and challenges before and after forest harvest in a headwater stream. Sensors (Basel) 12, 3798–3813. doi: 10.3390/s120403798
Kirchner, J. W., Feng, X. H., Neal, C., and Robson, A. J. (2004). The fine structure of water-quality dynamics: the (high-frequency) wave of the future. Hydrol. Process. 18, 1353–1359. doi: 10.1002/hyp.5537
Kowalczuk, P., Zablocka, M., Sagan, S., and Kulinski, K. (2010). Fluorescence measured in situ as a proxy of CDOM absorption and DOC concentration in the Baltic Sea. Oceanologia 52, 431–471. doi: 10.5697/oc.52-3.431
Kristensen, E., and Alongi, D. M. (2006). Control by fiddler crabs (Uca vocans) and plant roots (Avicennia marina) on carbon, iron, and sulfur biogeochemistry in mangrove sediment. Limnol. Oceanogr. 51, 1557–1571. doi: 10.4319/lo.2006.51.4.1557
Lee, E.-J., Yoo, G.-Y., Jeong, Y., Kim, K.-U., Park, J.-H., and Oh, N.-H. (2015). Comparison of UV–VIS and FDOM sensors for in situ monitoring of stream DOC concentrations. Biogeosciences 12, 3109–3118. doi: 10.5194/bg-12-3109-2015
Maie, N., Boyer, J. N., Yang, C., and Jaffé, R. (2006a). Spatial, geomorphological, and seasonal variability of CDOM in estuaries of the Florida Coastal Everglades. Hydrobiologia 569, 135–150. doi: 10.1007/s10750-006-0128-x
Maie, N., Jaffé, R., Miyoshi, T., and Childers, D. L. (2006b). Quantitative and qualitative aspects of dissolved organic carbon leached from senescent plants in an oligotrophic wetland. Biogeochemistry 78, 285–314. doi: 10.1007/s10533-005-4329-6
Maie, N., Yamashita, Y., Cory, R. M., Boyer, J. N., and Jaffé, R. (2012). Application of excitation emission matrix fluorescence monitoring in the assessment of spatial and seasonal drivers of dissolved organic matter composition: sources and physical disturbance controls. Appl. Geochem. 27, 917–929. doi: 10.1016/j.apgeochem.2011.12.021
Mazda, Y., Kanazawa, N., and Wolanski, E. (1995). Tidal asymmetry in mangrove creeks. Hydrobiologia 295, 51–58. doi: 10.1007/BF00029110
McKee, K. L. (2011). Biophysical controls on accretion and elevation change in Caribbean mangrove ecosystems. Estuar. Coast. Shelf Sci. 91, 475–483. doi: 10.1016/j.ecss.2010.05.001
McPherson, M. L., Hill, V. J., Zimmerman, R. C., and Dierssen, H. M. (2011). The optical properties of greater Florida bay: implications for seagrass abundance. Estuar. Coast. Shelf Sci. 34, 1150. doi: 10.1007/s12237-011-9411-9
Obeysekera, J., Barnes, J., and Nungesser, M. (2014). Climate sensitivity runs and regional hydrologic modeling for predicting the response of the greater Florida Everglades ecosystem to climate change. Environ. Manage. 55, 749–762. doi: 10.1007/s00267-014-0315-x
Orem, W., Newman, S., Osborne, T. Z., and Reddy, K. R. (2015). Projecting changes in Everglades soil biogeochemistry for carbon and other key elements, to possible 2060 climate and hydrologic scenarios. Environ. Manage. 55, 776–798. doi: 10.1007/s00267-014-0381-0
Osburn, C. L., Retamal, L., and Vincent, W. F. (2009). Photoreactivity of chromophoric dissolved organic matter transported by the Mackenzie River to the Beaufort Sea. Mar. Chem. 115, 10–20. doi: 10.1016/j.marchem.2009.05.003
Pellerin, B. A., Saraceno, J. F., Shanley, J. B., Sebestyen, S. D., Aiken, G. R., Wollheim, W. M., et al. (2012). Taking the pulse of snowmelt: in situ sensors reveal seasonal, event and diurnal patterns of nitrate and dissolved organic matter variability in an upland forest stream. Biogeochemistry 108, 183–198. doi: 10.1007/s10533-011-9589-8
Qualls, R. G., and Richardson, C. J. (2003). Factors controlling concentration, export, and decomposition of dissolved organic nutrients in the Everglades of Florida. Biogeochemistry 62, 197–229. doi: 10.1023/A:1021150503664
Regier, P., Brice-o, H. O., and Jaffé, R. (2016). Long-term environmental drivers of DOC fluxes: linkages between management, hydrology and climate in a subtropical coastal estuary. Estuar. Coast. Shelf Sci. 182, 112–122. doi: 10.1016/j.ecss.2016.09.017
Romigh, M. M., Davis, S. E., Rivera-Monroy, V. H., and Twilley, R. R. (2006). Flux of organic carbon in a riverine mangrove wetland in the Florida Coastal Everglades. Hydrobiologia 569, 505–516. doi: 10.1007/s10750-006-0152-x
Ryder, E., de Eyto, E., Dillane, M., Poole, R., and Jennings, E. (2014). Identifying the role of environmental drivers in organic carbon export from a forested peat catchment. Sci. Total Environ. 490, 28–36. doi: 10.1016/j.scitotenv.2014.04.091
Saha, A. K., Moses, C. S., Price, R. M., Engel, V., Smith, T. J. III, and Anderson, G. (2012). A hydrological budget (2002–2008) for a large subtropical wetland ecosystem indicates marine groundwater discharge accompanies diminished freshwater flow. Estuaries Coasts 35, 459–474. doi: 10.1007/s12237-011-9454-y
Shank, G. C., Lee, R., Vahatalo, A., Zepp, R. G., and Bartels, E. (2010). Production of chromophoric dissolved organic matter from mangrove leaf litter and floating Sargassum colonies. Mar. Chem. 119, 172–181. doi: 10.1016/j.marchem.2010.02.002
Sklar, F. H., Chimney, M. J., Newman, S., McCormick, P., Gawlik, D., Miao, S., et al. (2005). The ecological–societal underpinnings of Everglades restoration. Front. Ecol. Environ. 3, 161–169. doi: 10.1890/1540-9295(2005)003[0161:TEUOER]2.0.CO;2
Sobczak, W. V., and Raymond, P. A. (2015). Watershed hydrology and dissolved organic matter export across time scales: minute to millennium. Freshw. Sci. 34, 392–398. doi: 10.1086/679747
Spencer, R. G. M., Pellerin, B. A., Bergamaschi, B. A., Downing, B. D., Kraus, T. E. C., Smart, D. R., et al. (2007). Diurnal variability in riverine dissolved organic matter composition determined by in situ optical measurement in the San Joaquin River (California, USA). Hydrol. Process. 21, 3181–3189. doi: 10.1002/hyp.6887
Stieglitz, T. C., Clark, J. F., and Hancock, G. J. (2013). The mangrove pump: the tidal flushing of animal burrows in a tropical mangrove forest determined from radionuclide budgets. Geochim. Cosmochim. Acta 102, 12–22. doi: 10.1016/j.gca.2012.10.033
Tranvik, L. J. (1998). “Degradation of dissolved organic matter in humic waters by bacteria,” in Aquatic Humic Substances Ecological Studies, eds D. O. Hessen and L. J. Tranvik (Berlin, Heidelberg: Springer), 259–283.
Watras, C. J., Hanson, P. C., Stacy, T. L., Morrison, K. M., Mather, J., Hu, Y.-H., et al. (2011). A temperature compensation method for CDOM fluorescence sensors in freshwater. Limnol. Oceanogr. Methods 9, 296–301. doi: 10.4319/lom.2011.9.296
Watras, C. J., Morrison, K. A., Crawford, J. T., McDonald, C. P., Oliver, S. K., and Hanson, P. C. (2015). Diel cycles in the fluorescence of dissolved organic matter in dystrophic Wisconsin seepage lakes: implications for carbon turnover. Limnol. Oceanogr. 60:482–496. doi: 10.1002/lno.10026
Wilson, H. F., Saiers, J. E., Raymond, P. A., and Sobczak, W. V. (2013). Hydrologic drivers and seasonality of dissolved organic carbon concentration, nitrogen content, bioavailability, and export in a Forested New England Stream. Ecosystems 16, 604–616. doi: 10.1007/s10021-013-9635-6
Yamashita, Y., Boyer, J. N., and Jaffé, R. (2013). Evaluating the distribution of terrestrial dissolved organic matter in a complex coastal ecosystem using fluorescence spectroscopy. Cont. Shelf Res. 66, 136–144. doi: 10.1016/j.csr.2013.06.010
Yamashita, Y., and Jaffé, R. (2008). Characterizing the Interactions between Trace Metals and Dissolved Organic Matter Using Excitation–Emission Matrix and Parallel Factor Analysis. Environ. Sci. Technol. 42, 7374–7379. doi: 10.1021/es801357h
Keywords: dissolved organic carbon (DOC), mangrove estuary, fluorescence sensor, water management, carbon fluxes
Citation: Regier P and Jaffé R (2016) Short-Term Dissolved Organic Carbon Dynamics Reflect Tidal, Water Management, and Precipitation Patterns in a Subtropical Estuary. Front. Mar. Sci. 3:250. doi: 10.3389/fmars.2016.00250
Received: 23 September 2016; Accepted: 17 November 2016;
Published: 02 December 2016.
Edited by:
Patricia M. Medeiros, University of Georgia, USAReviewed by:
Piotr Kowalczuk, Institute of Oceanology Polish Academy of Sciences, PolandHeather Erin Reader, Technical University of Denmark, Denmark
Copyright © 2016 Regier and Jaffé. This is an open-access article distributed under the terms of the Creative Commons Attribution License (CC BY). The use, distribution or reproduction in other forums is permitted, provided the original author(s) or licensor are credited and that the original publication in this journal is cited, in accordance with accepted academic practice. No use, distribution or reproduction is permitted which does not comply with these terms.
*Correspondence: Rudolf Jaffé, Jaffer@fiu.edu