Using Genome-Wide SNPs to Detect Structure in High-Diversity and Low-Divergence Populations of Severely Impacted Eastern Tropical Pacific Spinner (Stenella longirostris) and Pantropical Spotted Dolphins (S. attenuata)
 Matthew S. Leslie
 Phillip A. Morin
- 1Scripps Institution of Oceanography, University of California San Diego, La Jolla, CA, USA
- 2Southwest Fisheries Science Center, National Marine Fisheries Service, NOAA, La Jolla, CA, USA
Millions of spinner (Stenella longirostris) and pantropical spotted dolphins (Stenella attenuata) died since the 1960's as bycatch in tuna nets in the eastern tropical Pacific Ocean. Despite three decades of protection, they show little-to-no sign of recovery (although recent fisheries-independent abundance estimates are not available). In efforts to establish biologically meaningful management boundaries for recovery, endemic subspecies and multiple stocks have been proposed. However, genetic differentiation among most of these units has been difficult to identify, possibly due to low statistical power stemming from large historical abundances, ongoing gene flow, and recent divergence. We tested for genetic structure at multiple hierarchical levels by analyzing the largest dataset to date brought to bear on these questions. Single nucleotide polymorphisms (SNPs) were collected from nuclear DNA regions associated with the restriction enzyme site PstI from 72 spinner dolphins and 58 pantropical spotted dolphins using genotype-by-sequencing (GBS). Our results support the current subspecies for both species and indicate stock-level separation for Tres Marias spinner dolphins and the two offshore pantropical spotted dolphin stocks in this area. Although bycatch has been reduced to a small fraction of pre-protection levels, incidental mortality continues to impact these populations. Our results are important for the ongoing management and recovery of these highly-impacted pelagic dolphins in the eastern tropical Pacific Ocean.
Introduction
Knowledge of population structure forms the foundation of assessment and monitoring for species and stock recovery; we need to know population boundaries in order to estimate abundance and trends and to set appropriate mortality limits (Taylor, 2005). Without knowledge of how organisms are geographically structured we may fail to conserve subspecies or distinct population segments (Taylor, 2005).
The study of population structure in pelagic organisms is inherently challenging. Open ocean habitat may have few permanent physical barriers to gene flow, thereby increasing the likelihood of mixing between populations; even a few successful migrants per generation greatly decrease the signal of population segregation (Waples, 1998). Pelagic species with high abundance and weak barriers provide a challenge for using genetic tools to determine population structure (Taylor and Dizon, 1996; Waples, 1998). High abundance, often a characteristic of pelagic populations, can result in a large amount of standing genetic variation. High genetic diversity can dramatically increase the time needed for populations to drift apart genetically, even in the complete absence of gene flow (Taylor and Dizon, 1996).
Spinner and pantropical spotted dolphins in the eastern tropical Pacific Ocean (ETP) illustrate this problem. They historically numbered in the low millions (Wade et al., 2007), but starting in the 1960s, hundreds of thousands were killed annually as bycatch in the dolphin-set tuna purse-seine fishery (Lo and Smith, 1986; National Research Council, 1992; Wade, 1995) and some populations have declined substantially (Wade et al., 2007; Gerrodette et al., 2008). Despite large decreases in the number killed over forty years of protection under the U.S. Marine Mammal Protection Act of 1972 and multi-national protection under the 1999 Agreement on the International Dolphin Conservation Program (Joseph, 1994; Gosliner, 1999), the depleted populations have not recovered as predicted (Wade et al., 2007; Gerrodette et al., 2008). However, it is worth noting that fisheries-independent abundance estimates have not been conducted since 2006. Therefore it is difficult to determine if any recovery has occurred in the last decade.
Endemic Spinner Dolphin Subspecies and Stocks
There are four recognized subspecies of spinner dolphin (Stenella longirostris) globally. The pantropical “Gray's” spinner (S. l. longirostris) occurs throughout the world's tropics except in the ETP. In the central and western Pacific, Gray's spinners are found associated with islands, such as the Hawaiian Islands. The much smaller dwarf spinner subspecies (S. l. rosiventris) inhabits shallow waters in Southeast Asia (Perrin et al., 1989, 1999). The other two subspecies, the eastern spinner dolphin (Stenella longirostris orientalis) and Central American spinner dolphin (S. l. centroamericana), are found only in the ETP and were described based on differences in external coloration, body size, and skull morphology (Perrin et al., 1991; Douglas et al., 1992). The Central American subspecies inhabits coastal waters of the Pacific coast from the Gulf of Tehuantepec in southern Mexico southeast to Costa Rica (Figure 1), while the eastern subspecies inhabits pelagic waters (Perrin, 1990). A distinct morphotype of the eastern spinner dolphin (S. l. orientalis), known as the “Tres Marias” spinner dolphin, has been described from near the islands of the same name off the coast of Mexico based on external body morphometrics (Perryman and Westlake, 1998). Although currently classified as a form of the pantropical Gray's spinner dolphin, the “whitebelly” spinner is proposed to represent a hybrid swarm between the eastern subspecies and the pantropical Gray's subspecies of the central and western Pacific (Perrin et al., 1991; Andrews et al., 2013). Significant geographic overlap exists between the eastern subspecies and the whitebelly form (Perrin et al., 1985).
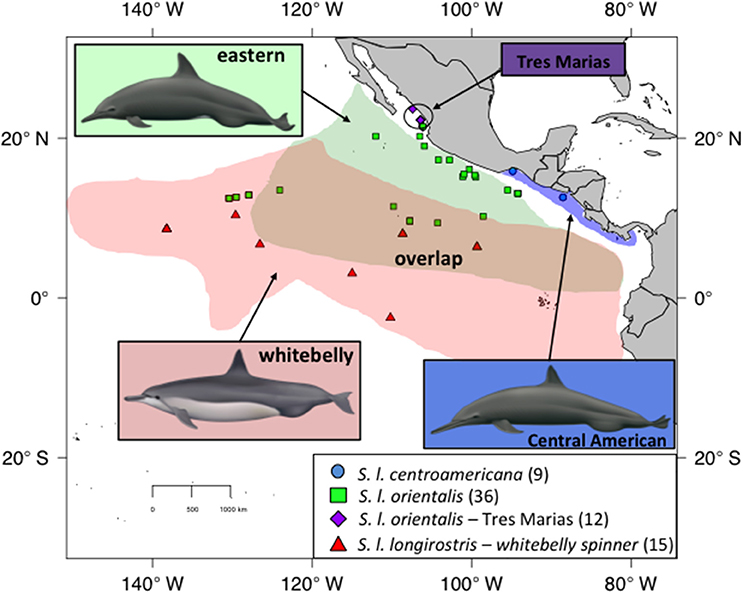
Figure 1. Sampling for spinner dolphins within the ETP. Blue dots indicate Central American spinners. Green squares indicate eastern spinners. Purple diamonds are the proposed Tres Marias spinners. Red triangles indicate whitebelly spinners, a proposed intergrade between the pantropical or Grey's spinner (not shown) and the eastern subspecies (green squares). The map shows current stock and subspecies boundaries. Illustrations by Uko Gorter, used by permission.
The eastern spinner dolphin (S. l. orientalis) exhibits traits indicative of a polygynous breeding system (Perrin and Henderson, 1979; Perrin and Mesnick, 2003). Perrin and Mesnick (2003) found significant difference in testis size between the eastern subspecies and the whitebelly form, indicating differing reproductive strategies and probably different breeding behavior between the two types. The three ETP spinner management stocks correspond to the two aforementioned subspecies plus the whitebelly spinners. Dizon et al. (1994) found few differences between any of the proposed types based on mtDNA and allozymes. Galver (2002) found no differences between the whitebelly and the eastern spinner dolphins based on mtDNA control region haplotypes and microsatellites, but found support for separating Central American spinners from the eastern and whitebelly groups using these same markers. Andrews et al. (2013) found low divergence between all the spinner dolphin subspecies and the whitebelly spinner dolphins based on mtDNA and autosomal genes, but found strong separation in Y-chromosome markers between the three most phenotypically divergent groups (Grey's spinner dolphin, dwarf spinner dolphin, and the ETP group—which includes the eastern and Central American subspecies). This study also found whitebelly spinners had Y-chromosome haplotypes in common with Grey's and eastern; thus, supporting the hypothesis that the whitebelly is a hybrid group. Andrews et al. (2013) discuss several scenarios that could explain the patterns found in the Y-chromosome data, including low Ne, female biased dispersal, assortative mating, and hybrid male sterility. Ultimately they hypothesized that the evidence suggests sexual selection on male characters via assortative mating.
Endemic ETP Spotted Dolphin Subspecies and Stocks
Extensive analyses of cranial morphology of pantropical spotted dolphins (Stenella attenuata) in the ETP led to the designation of a coastal endemic subspecies (S. a. graffmani—Perrin, 1975; Perrin et al., 1987). Spotted dolphins in offshore regions in the ETP are part of the global subspecies (S. a. attenuata). In contrast to the spinner dolphins, genetic analyses of microsatellites has indicated some differentiation between subspecies (Escorza-Trevino et al., 2005). That study found differences between southern populations of the coastal subspecies and the pelagic subspecies, but no differences between the northern extents of the coastal and the pelagic forms. The authors concluded that genetic diversity in the coastal subspecies is contained within demographically independent populations. Tests for genetic structure have not previously been conducted within the pelagic subspecies.
Despite the results of Escorza-Trevino et al. (2005) showing differences between at least four demographically independent populations within the coastal subspecies (S. a. graffmani), the entire subspecies is currently treated as a single management stock. The offshore pantropical spotted dolphins are divided into a “northeastern” (NE) stock, defined geographically as north of 5°N, east of 120°W and a “western-southern” (WS) stock residing south and west of this northeastern area (Figure 2, Perrin et al., 1994). The north-south boundary between these stocks is based on a distributional hiatus (see Perrin et al., 1994 for discussion). In addition, general similarity in cranial variation suggests a combined WS stock (see Perrin et al., 1994 for discussion and primary references). Little is known about movements in these animals, although analyses of seasonal distributions have suggested complementary changes and could indicate intraregional seasonal movements (Reilly and Fiedler, 1994). Tagging data are sparse, but support the direction (although not the magnitude) of movement indicated by the distribution patterns of Reilly and Fiedler (1994) and Perrin et al. (1979).
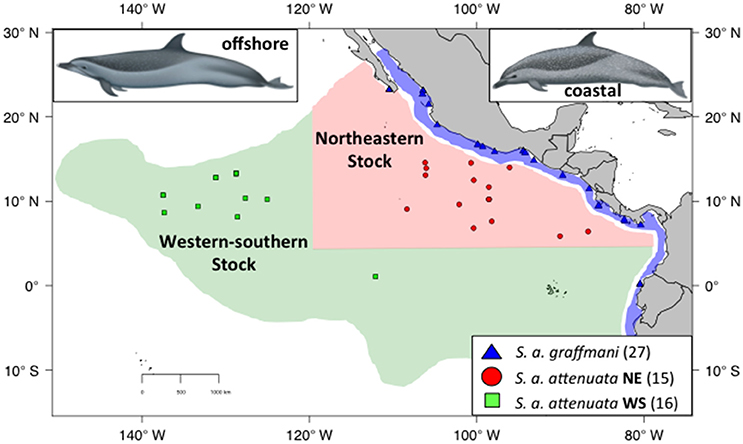
Figure 2. Sampling localities for spotted dolphins with the ETP. Coastal spotted dolphins (S. a. graffmani) are blue triangles, northeastern offshore pantropical spotted dolphins (S a. attenuata) are in red dots, and western-southern offshore spotted dolphins are shown in green squares. The map shows current stock and subspecies boundaries (based on Perrin et al., 1985). DAPC. Illustrations by Uko Gorter, used by permission.
Leslie et al. (in review) tested for structure at multiple hierarchical levels by collecting whole mitochondrial genome sequences (mtDNA) and nuclear SNPs (nuDNA) from 104 spinner and 76 pantropical spotted dolphins using capture array library enrichment and highly parallel DNA sequencing. Fifty-one SNPs were analyzed for spinner dolphins and 36 for spotted dolphins. MtDNA showed weak but significant differences between the subspecies of pantropical spotted dolphins (FST: 0.0125; P = 0.0402) and the first mtDNA evidence for differentiation between the ETP spinner dolphin subspecies (FST: 0.0133; P = 0.034). NuDNA supported subspecies of pantropical spotted dolphins, but not subspecies of spinner dolphins. Strong and significant differentiation was detected between whitebelly and eastern spinner stocks using nuDNA (FST: 0.0297; P = 0.0059). Neither mtDNA nor nuDNA supported the division of existing offshore stocks of pantropical spotted dolphins or Tres Marias spinner dolphins. This work helped identify a genetic basis for establishing biologically meaningful management units for the recovery of these dolphins, but as with previous genetic studies that used relatively few molecular markers, it lacked the power to resolve some populations and putative subspecies.
Thus, while both spinner and spotted dolphins exhibit significant morphometric differences supporting structured management units (Perrin et al., 1991, 1994), early traditional molecular genetics approaches have largely been unable to find corresponding population genetic structure (Dizon et al., 1994; Galver, 2002) in the face of high levels of genetic variation (Dizon et al., 1994; Galver, 2002; Escorza-Trevino et al., 2005; Andrews et al., 2013; Leslie et al., in review). When signals of differentiation are faint, as in low divergence, large abundance cases such as these, additional genetic markers can increase statistical power to detect structure. Willing et al. (2012) presented convincing evidence that estimations of genetic differentiation (F-statistics) can be very powerful with a large number of genetic markers (>1000)—even if samples sizes are small (4–6).
Objectives
In this study we use high-throughput DNA sequencing to generate >3700 restriction-site-associated nuclear SNP genotypes from each species to infer population genetic structure by testing a priori hypotheses at the subspecies and population level. For the population level questions, we test for genetic support of the Tres Marias spinner dolphin and the presence of two or more offshore pantropical spotted dolphins. Whereas, previous genetic studies targeted neutrally-evolving markers—presumably reflecting drift and phylogenetic relationships, this study uses an array of SNPs that are likely to include some selected markers and therefore not only reflects patterns of drift and phylogeny alone, but also functional evolution. This approach better indicates significant distinctive evolutionary units to conserve (Funk et al., 2012).
Materials and Methods
Ethics Statement
Procedures for ensuring animal welfare during biopsy sampling were approved as part of the Scientific Research permits issued by the National Marine Fisheries Service under the authority of the Marine Mammal Protection Act of 1972 (16 U.S.C. 1361 et seq), the regulations governing the taking and importing of marine mammals (MMPA) (50 CPR part 216), the Endangered Species Act of 1973 (ESA) (16 U.S.C. 1531 et seq.), and the regulations governing endangered fish and wildlife permits (50 CFR parts 222–226). Biopsies were taken under NMFS permit numbers 779–1339, 779–1663, 14097, 774–1437, 774–1714, 1026/689424, and 873 issued to the National Marine Fisheries Service Southwest Fisheries Science Center.
Sample Collection and DNA Extraction
Skin samples were collected from spinner dolphins and spotted dolphins via biopsy dart (Lambertsen, 1987) on research cruises or from soft-tissue specimens taken as bycatch in the tuna purse-seine fishery (Tables S1, S2, respectively). Spinner dolphin samples collected on research cruises were assigned to a stock based on the external morphology of the majority of animals in the school. This approach was taken because: (1) these often-large groups (sometimes >1000 individuals) contained individuals exhibiting a range of morphology due at least in part to ontological variation but also to morphological overlap; only after observing the group for some time (through high-powered binoculars and with the naked eye) could observers classify it to stock, (2) researchers collecting biopsies from fast swimming dolphins at the bow of the research vessel found it very difficult to confidently classify the actual individual sampled, and (3) there is significant overlap in range; therefore, geography was not a reliable predictor of stock identity. To be conservation, samples were not used in this study, or were removed from the analyses, if the observers noted any doubt about subspecies identification. Samples were selected from areas where the eastern and whitebelly types are known to overlap as well as regions exclusive to each type (Figure 1). Photographic evidence was used to review stock identity of groups in some cases, but these instances were few. No effort was made to quantify the amount of assignment error.
Pantropical spotted dolphins samples (Figure 2) were assigned to subspecies and stocks based on the geographic location of the sampling site. In areas where the ranges of the two subspecies overlap, spotted dolphin samples collected from research cruises were assigned to stocks based on external morphology described in Perrin and Hohn (1994) and Perrin (2001). As with the spinner dolphins, to be conservative, samples were removed from the subspecies analyses if the observers had doubt about subspecies identification.
Samples were stored in salt-saturated 20% DMSO, 70% ethanol, or frozen with no preservative. DNA was extracted using silica-based filter membranes (Qiagen, Valencia, CA) on an automated workstation (Perkin Elmer, Waltham, MA) or by NaCl salting out based on Miller et al. (1988). Starting concentrations of DNA were quantified using Pico-Green fluorescence assays (Quant-it Kit, Invitrogen, Carlsbad, CA) using a Tecan Genios microplate reader (Tecan Group Ltd, Switzerland). DNA quality was assessed by electrophoresis of 100 ng on 1% agarose gel; only high-molecular weight extracts were used.
Sequencing libraries were constructed using the restriction enzyme PstI (CTGCAG) using a “genotype-by-sequencing” protocol (Elshire et al., 2011). Unique oligonucleotide barcodes were added to each sample for multiplexed sequencing on the Illumina HiSeq 2000/2500 (100 bp, single-end reads). One no-template-control was included with every batch of 95 samples. Libraries for several individuals were reconstructed and resequenced to increase read depth. Library preparation and sequencing were completed at the Cornell University Institute of Biotechnology's Genomic Diversity Facility (http://www.biotech.cornell.edu/brc/genomic-diversity-facility).
Filtering, Assembly, SNP Discovery, and Genotyping
Demultiplexing, initial quality control, assembly, and SNP discovery were completed in the TASSEL pipeline (v3.0.166; Glaubitz et al., 2014). Genotypes were filtered to those with a quality of 98 or higher using vcftools (v0.1.12b; Danecek et al., 2011). No-template controls were also removed in vcftools. Reads were assembled to the common bottlenose dolphin genome (T. truncatus, turTru1, 2.59X coverage; Lindblad-Toh et al., 2011) using bwa (v0.78-r455; Li and Durbin, 2009). If library prep and sequencing resulted in relatively low coverage for a sample, it was repeated in subsequent libraries and sequencing batches. Not all low coverage samples were repeated; decisions as to whether to repeat samples were based on the need of more samples from certain strata. Multiple reads from the same samples were merged after VCF SNP calling with TASSEL. Samples were removed from the data set if they did not pass a minimum “missingness” threshold (0.1 minimum taxon coverage) prior to filtering (using TASSEL), or after filtering using vcftools. We initially accepted genotypes with a minimum read depth of 5 and minimum genotype quality of 15. Sites were filtered by minor allele frequency (between 0.05 and 0.5), genotype missingness (maximum 0.05), and coverage (removed if the mean genotype depth of coverage was <8 or >1.5 times the mean depth over all individuals). Finally, one of every pair of potentially linked loci—within a distance of 100,000 bp—were removed using the “thin” function in vcftools. VCF-format data were converted to various formats using PGDSpider2 (v2.0.8.3; Lischer and Excoffier, 2012). SNP loci were removed if heterozogosity was >0.65. Sites were not filtered based on Hardy-Weinburg equilibrium, nor were sex-linked loci or FST outlier loci removed.
Diversity Estimates and Population Structure Analyses
Per-site mean heterozygosity and standard deviation were measured in R (R Core Team, 2011), using the strataG package (Archer et al., 2016). We then estimated differentiation (FST) for each pairwise combination of populations (Wright, 1951). FST measures the variance in allele frequencies in a population (Wright, 1969) to estimate the amount of structure within and among subpopulations. Point estimates and permutation tests (1000 repetitions) were generated using the strataG package in R. Differentiation statistics that correct for high allelic diversity (Nei, 1973) and high heterozygosity within polymorphic sites (Hedrick and Goodnight, 2005) were not used because we used a large number of biallelic SNPs (see Meirmans and Hedrick, 2011).
Multivariate Analysis of Population Differentiation
We directly tested hypotheses of population differentiation using multivariate analyses, specifically the Discriminant Analysis of Principle Components (DAPC) as implemented in the R package Adegenet (Jombart and Ahmed, 2011). This method calculates principle components and then estimates a centroid and measures the variance for each predefined population. The discriminant analysis then tests the probability of each individual falling in the space of each of the populations based on the “geometric space” created by the position of the centroid and the extent of the variation.
Discriminant Analysis of Principle Components (DAPC) aims to describe genetic clusters using synthetic variables derived from the allelic data (Jombart and Ahmed, 2011). Outcomes of the DAPC can vary depending on the number of principle components (PCs) included in the analysis. We used three different approaches to investigate this variance. First, using Adegenet, we estimated the optimum number of PCs by calculating the mean Alpha-score for a range of different PCs. Alpha is the reassignment probability calculated using the given cluster minus the reassignment probability for randomly permuted clusters. This analysis simulates the dataset 10 times and takes the mean alpha-score for each PC. Values near zero indicate low discrimination and instability, whereas values near one indicate higher discrimination and stability. The optimum is the number of PCs with the highest mean alpha across all simulations. Second, we calculated alpha scores for all putative populations under two different scenarios: (1) using the highest number recommended by the developers (i.e., n/3), and (2) the “optimum” number of PCs indicated by the highest mean alpha-score estimated using simulations. Third, we also examined the cumulative variance explained by the eigenvalues for the full range of principle components.
To complete the DAPC, we then constructed synthetic discriminant functions that represent linear combinations of the allelic data with the largest between-group variance and the smallest within-group variance. In all analyses we kept only the first three eigenvalues, as they represented the vast majority of the information. The DAPC resulted in sample membership probabilities for the predicted membership of given samples based on the data from all samples. The number of correct classifications (i.e., a sample was classified back to its cluster of origin) was then compared to the expected classification rate (or prior). The prior, or expected classification rate for each population, was calculated by dividing the population sample size by the total sample size. An overall prior was also calculated by multiplying each prior times the population size, summing all of the products, and dividing by the total sample size. These priors were then compared to the posterior classification rate generated using DAPC. Finally, we calculated the mean membership probabilities of all individuals within the pre-defined populations (i.e., stocks and subspecies). All of these calculations were done in R using output from the Adegenet package. Furthermore, two-dimensional scatter plots were constructed to visualize the spread of the first two discriminant functions between and within populations.
Results
The average read depth for spinner and pantopical spotted dolphin SNP genotypes was 34.70 and 29.96, respectively. To remove genotypes with high coverage possibly due to clonality and repetitive DNA, those with coverage depth greater than 56.88 and 50.75 (the mean read depth plus 1.5 times the standard deviation) were removed from the spinner and pantropical spotted dolphin datasets, respectively. The final data sets for each species included 72 spinner dolphins and 58 pantropical spotted dolphins genotyped at 4381 and 3721 SNPs, respectively. Summaries of the sample sizes, mean heterozygosity, and pairwise population differentiation FST statistics for ETP spinner and pantropical spotted dolphins are found in Tables 1, 2, respectively.
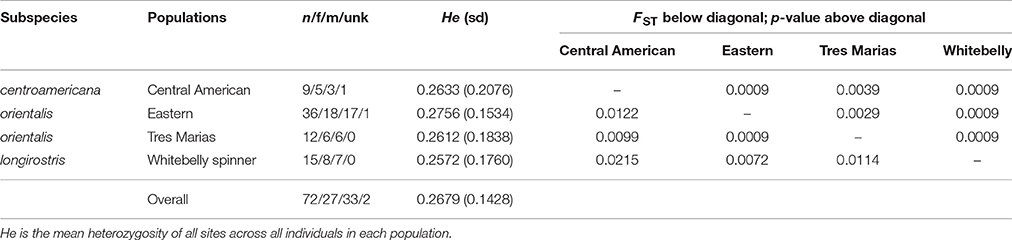
Table 1. Population genetic summary and differentiation statistics for ETP spinner dolphins based on 4381 SNPs.
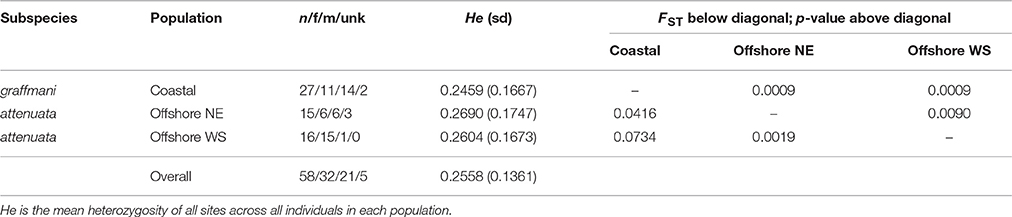
Table 2. Population genetic summary and differentiation statistics for ETP spotted dolphins based on 3721 SNPs.
Population Structure: FST
For both spinner and pantropical spotted dolphins, all pairwise comparisons between putative stocks and subspecies were significantly different from zero (p < 0.004 in all cases; Tables 1, 2). FST point estimates were low for comparisons between Tres Marias spinner and both the eastern and Central American spinners (0.0099 and 0.0029, respectively)—as well as between the eastern spinner and the whitebelly spinner (0.0072). We found higher estimates in comparisons between whitebelly and Central American (0.0215) and whitebelly and Tres Marias (0.0114) indicating stronger segregation between these geographically distant populations. FST point estimates for the comparison of the endemic eastern and Central American spinner dolphin subspecies were also higher (FST = 0.0122).
For pantropical spotted dolphins, FST point estimates were higher for coastal versus the western-southern stock (0.0734) compared to between the coastal and the northeastern stocks (0.0416). Divergence was lower but significant between the two offshore stocks (FST: 0.0090, p = 0.0019).
Discriminant Analysis
The first step in conducting the DAPC analysis was to determine the appropriate number of principle components (PCs) to use. Examination of the mean alpha (difference in reassignment probabilities between observed and permuted clusters) for the spinner dolphin data (with a max of 24 PCs) resulted in the optimum being 7 PCs (Figure S1). Analysis of the pantropical spotted dolphin data (with a maximum of 19 PCs) resulted in the optimum being 1 PC (Figure S2). Although the optimum number of PCs maximized mean population stability over the highest recommended number of PCs, some of the populations had very low alpha scores with the optimized-simulation-based method (see Table S3). In other words, the standard deviation (SD in Table S3) was also much higher in the optimum number of PCs—meaning that assignment of any individual population might be highly unstable. The cumulative variance explained by the eigenvalues for the full range of principle components indicated that there was no reason for restricting the PCs to a small number (see Figures S3, S4). Because of these results, we chose to present the results obtained using the highest recommended number of PCs (n/3) recommended by the developers of Adegenet for each species: 24 and 19 PCs for spinner and pantropical spotted dolphin analysis, respectively. Moreover, given the difficulty of finding genetic structure in previous studies—in what are already morphologically distinct subspecies—we decided to err on the side of over-fitting rather than decreased statistical power.
Using the DAPC results, we classified individuals to groups based on their assignment probabilities. The results of this classification are presented in confusion matrixes in Tables 3, 4 for spinner and pantropical spotted dolphins, respectively. For every pre-defined population, the majority of individuals were assigned back to their population of origin. Comparing the “posterior” values to the “prior” values in Tables 3, 4, DAPC classified individuals back to their population of origin at a much higher rate than expected based on random assignment. For both spinner and spotted dolphins, the overall classification rate back to the subspecies or stock of origin was 0.931, compared to the expected values of 0.337 and 0.359, respectively.
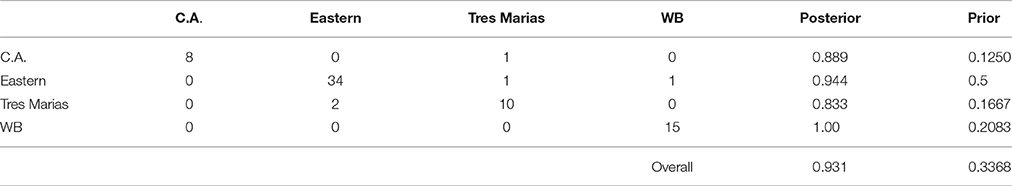
Table 3. Confusion matrix showing predicted assignments for ETP spinner dolphins based on DAPC using 4381 SNPs.

Table 4. Confusion matrix showing predicted assignments for ETP pantropical spotted dolphins based on DAPC using 3721 SNPs.
DAPC Results Spinner Dolphins
The majority of the variation within the spinner dolphin data was well represented in the first two discriminant analysis (DA) eigenvalues, as displayed in the inset of Figure 3. The scatter plot of DAPC (Figure 3) indicated that the whitebelly spinner is the most distinct (in red). We found a very close relationship between the eastern spinner dolphins (green) and the Tres Marias Islands spinner dolphins (purple). These two populations share space on the two dimensions of the DAPC analysis. The Central American subspecies (light blue) formed a largely independent group with the exception of one sample that grouped within the Tres Marias Islands spinner dolphins (purple) cluster.
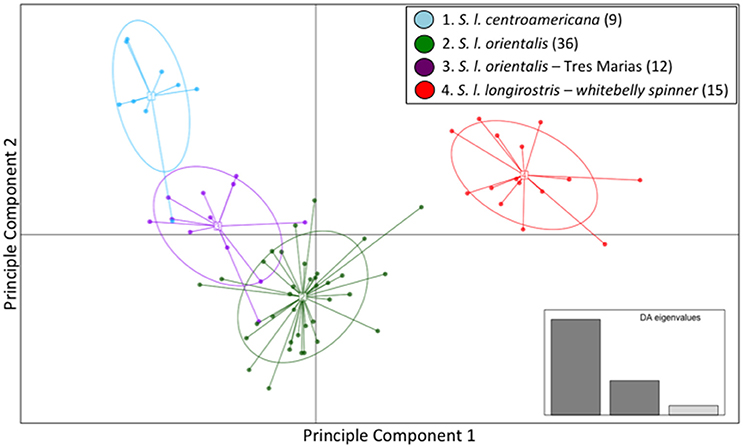
Figure 3. Genomic variation across individuals and populations of ETP spinner dolphins: scatter plot of individuals based on the first two eigenvalues of the Discriminant Analysis of Principle Components. Ellipses represent 67% of the variation for each population.
The mean membership probabilities from the DAPC across all individuals for each stock or subspecies showed high differentiation between populations (Table S4) for spinner dolphins. Again, our results showed that the highest membership probabilities for most pre-defined groups were back to the stock or subspecies of origin; thus indicating population structure. For instance, the average membership probability for Central American spinner dolphins back to the Central American group was 0.888. For eastern spinner dolphins the mean membership probability back to the eastern group was 0.938. And for Tres Marias spinner dolphins the mean membership probability to the Tres Marias group was 0.827. Finally, for the whitebelly stock, the average membership probability to the whitebelly stock was 1. A bar graph of membership probability by individual is shown in Figure S5.
DAPC Results Spotted Dolphins
Similar to the spinner dolphins, the vast majority of the variation within the pantropical spotted dolphin dataset was represented by the first of the two DA eigenvalues (Figure 4 inset). Results from the DAPC—presented as a scatterplot in Figure 4—showed a high level of segregation between the offshore subspecies and the coastal endemic subspecies. The coastal pantropical spotted dolphin (blue) is a distinct cluster from the offshore stocks (red and green) with no samples overlapping between the two subspecies. This analysis showed separation between the northeastern offshore stock (red) and the western-southern stock (green), but with considerable overlap between these two offshore stocks.
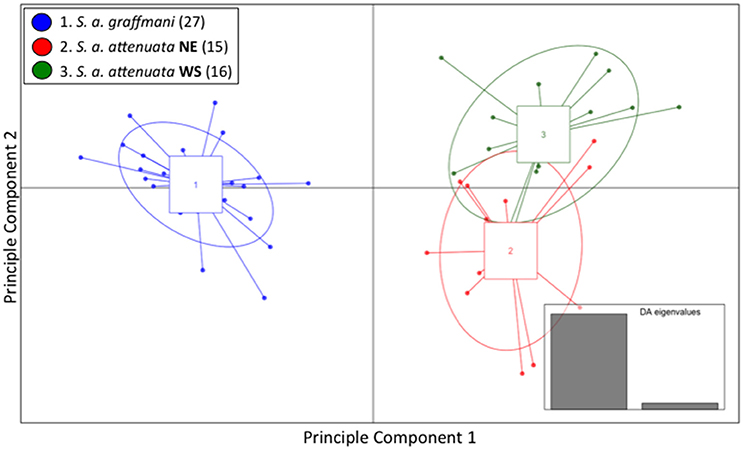
Figure 4. Genomic variation across individuals and populations of ETP spotted dolphins: scatter plot of individuals based on the first two eigenvalues of the Discriminant Analysis of Principle Components. Ellipses represent 67% of the variation for each population.
The average membership probabilities across all individuals for each hypothesized spotted dolphin stock reflected the separation between subspecies (Table S5). Individuals from the coastal subspecies (blue) exhibited very high probability of membership back to that population (probability of 1). Despite the apparent interchange between these two offshore stocks, average individual membership probabilities of the northeastern and western-southern pantropical spotted dolphin stocks were >76% to the respective stock of origin. A bar graph of membership probability by individual is shown in Figure S6.
Discussion
Pelagic spinner and pantropical spotted dolphins in the eastern tropical Pacific have presented a paradox for management, where subspecies and stocks differ morphologically but heretofore apparently exhibited little genetic differentiation (Dizon et al., 1994; Galver, 2002; Leslie et al., in review). To overcome the limitations of using a few markers to describe genetic structure in these historically abundant populations, we expanded the genetic analyses to include >3700 nuclear SNPs per species. Our results show genetic structure in support of the morphologically designated subspecies of both pantropical spotted and spinner dolphins and suggest stock-level differences within offshore pantropical spotted dolphins.
Spinner Dolphins
Our results support the three groups proposed by Perrin et al. (1991) and show evidence for a separate Tres Marias Islands stock as proposed by Perryman and Westlake (1998). Despite very convincing evidence for population structure using allele frequency data (FST) and DAPC, we found several individuals (See Table S6) with high probability of membership to a group other than the one in which they were sampled. Details of the individual samples and their membership probabilities are presented in Table S1, and graphically in Figure S5.
One male eastern spinner dolphin sample (SWFSC_2127) assigned to the whitebelly spinner group with >90% membership probability. In addition, one Central American biopsy sample (SWFSC_38197) from off the coast of El Salvador that assigned to the Tres Marias cluster was collected well into the core distribution of Central American spinner dolphins. This one sample genotyped as a Tres Marias dolphin may represent ongoing migration between the Tres Marias and Central American groups or a remnant genotype from periods of past connection. Two Tres Marias biopsy specimens (SWFSC_38020 and SWFSC_38033) assigned to the eastern spinner dolphin cluster (>90%). Finally, one eastern spinner dolphin biopsy sample (SWFSC_38144) assigned to the Tres Marias cluster at a 90% membership probability.
Of course some misassignment is expected because we are investigating overlapping forms within a species, not separate species. Furthermore, high spatial overlap between the two types and our acceptance of some possible error in identifying all individuals sampled to stocks, based on morphology, during sample collection in the field could reduce statistical power. Finally, these individuals could be migrants across boundaries—an expected result given previously inferred levels of gene flow (Andrews et al., 2013).
Spinner Dolphin Population Genetic Structure
Galver (2002), using DNA sequence data from the mitochondrial control region, found no significant differences between the Tres Marias population and the Central American or eastern subspecies. However, this same study found significant differences between the Tres Marias population and the Central American subspecies based on 12 microsatellite loci (FST = 0.0245; p < 0.01). Andrews et al. (2013) also found no differences between Tres Marias and eastern and Central American spinners based on mtDNA (control region/cytb), but did find differences using the actin intron (ΦST = 0.034; p < 0.05). Leslie et al. (in review) found no differences between the Tres Marias and either the eastern or Central American subspecies using whole mitochondrial genomes.
Our analyses supported four closely related, but well-differentiated, groups of spinner dolphins in the ETP (Central American, eastern, Tres Marias, and whitebelly). They corroborate the morphometric studies (Perrin et al., 1991; Perryman and Westlake, 1998), but contrast with previous genetic studies that found little or no consistent differences among most of these groups (Dizon et al., 1994; Galver, 2002; Leslie et al., in review). Our interpretation is that previous datasets have not had the statistical power to discern these closely related, but demographically independent, groups with high historical abundance and potentially ongoing gene flow.
Based on our results, Tres Marias, eastern, and Central American spinner dolphins maintain genetic segregation despite parapatry and some interchange. Perryman and Westlake (1998) compared the Tres Marias spinner dolphins to both the eastern and Central American subspecies in their initial description of this group. Based on body size data collected from aerial photogrammetry, these authors concluded that the spinner dolphins near Tres Marias Island are intermediate in length between the eastern and Central American spinner subspecies. They concluded that the Tres Marias spinners are different enough from the other two subspecies that they may represent a separate stock or subspecies. The authors noted the strong similarities between Tres Marias spinners and eastern spinners in external body characteristics (long, slender body; uniform medium-to-dark gray in color; dorsal fin is triangular to forward-canted; pronounced ventral keels on some individuals), but also noted the large “tightly packed” Tres Marias schools are more characteristic of Central American spinners than eastern spinners. Perryman and Westlake (1998) referenced cranial morphometric comparisons presented in Douglas et al. (1992) that note similarities in a small set of skulls (n = 3) from northern coastal spinner dolphins (i.e., Tres Marias Islands region) to those from the southern (core) Central American spinner distribution. Perryman and Westlake (1998) also report never observing Tres Marias spinners schooling with eastern spinners. Unpublished data from recent aerial surveys suggest that the range of the Central American spinner dolphins likely extends north of Acapulco—beyond the traditional range limit at the Gulf of Tehuantepec (W. Perryman pers. Comm.1). Their range could also shift based on oceanographic conditions, food availability, and population abundance, although this remains untested. Our genetic results support the conclusion that spinner dolphins near Tres Marias Island are an independent form, intermediate between the eastern and Central American spinner subspecies.
In summary, the results of our analysis of >4K SNPs from across the genome yield statistically significant patterns of structure in four morphologically different groups of spinner dolphins. Based on the results of significant differentiation from both FST and DAPC analyses, the Tres Marias spinner dolphin is consistent with stock-level differentiation. Management authorities should consider this information in the implementation of recovery efforts. Finally, we recommend a phylogenetic analysis—within the context of all spinner dolphin diversity—to determine the subspecies identity of the Tres Marias population.
Pantropical Spotted Dolphins
Escorza-Trevino et al. (2005) found a latitudinal difference in differentiation between the offshore and coastal spotted dolphins in the ETP. Their results (based on one mitochondrial gene and seven microsatellite loci) showed no differentiation between offshore and coastal spotted dolphins from the northern part of their range (i.e., northern Mexico). All other coastal areas south of central Mexico were statistically differentiated from the offshore subspecies (Escorza-Trevino et al., 2005).
Using whole mtDNA genomes and a dataset of 36 nuDNA SNPs, Leslie et al. (in review) found no support for the division of northeastern and western-southern offshore stocks of pantropical spotted dolphins. The results of the current study—using a much larger dataset that represents a scan of the entire genome—suggest stock-level differentiation between offshore northeastern and western-southern spotted dolphins with significant divergence (FST) and mean individual assignment probability greater than 75% for each stock.
The tests for population differentiation using allele frequency (FST) and DAPC for pantropical spotted dolphins support the current subspecies taxonomy based on morphology (Perrin et al., 1994) and genetics (Dizon et al., 1994; Escorza-Trevino et al., 2005). Two samples of NE pantropical spotted dolphins (SWFSC_4084 and SWFSC_24049) assigned to the WS stock with membership probabilities >80% (Table S6). These two occurrences of pantropical spotted dolphins with WS genotypes, sampled in NE territory, could represent movement across stock boundaries from the WS stock to the NE stock, with or without gene flow. Similarly, three WS individuals exhibited intermediate membership probability to the NE stock (individual assignment values are found in Table S2). Reasons for this could include low assignment power due to mixing of genotypes from different populations in the geographically stratified reference sets, or they could represent ongoing gene flow.
Conclusions
Divergence among highly abundant populations, subspecies, and even species can be difficult to detect due to low levels of genetic drift and potential ongoing gene flow. To overcome these issues, we have used >3700 SNPs per species to investigate important questions of population structuring for the conservation of ETP dolphins. Our results, based on analysis of nuclear SNPs, suggest that the existing management units for spinner dolphins are biologically meaningful and add further support for the need to erect a Tres Marias Islands management stock. Our results also provide genetic support for the two subspecies of pantropical spotted dolphins and indicate divergence among stocks of offshore spotted dolphins. Genotyping with large numbers of SNPs from additional samples throughout the range would be useful to better define the spatial structure and assess potential environmental barriers to geneflow. Moreover, genotyping more samples using this approach will enable the testing of alternate hypotheses, including examining genetic differences between western and southern offshore spotted groups, western and southern whitebelly spinner dolphin groups, and latitudinal gradients between coastal pantropical spotted dolphins described by Escorza-Trevino et al. (2005). The larger data sets for these species likely gave us more power to detect fine-scale differences.
Future studies should investigate the patterns of genetic clustering as they relate to environmental factors and habitat characteristics (i.e., environmental distances) to ensure a more comprehensive view for informing accurate stock boundary for offshore spotted dolphins (Mendez et al., 2010; Leslie et al., in review). SNPs that presumably represent loci under selection (or of functional evolutionary importance) should be investigated in future work—specifically if the inclusion of these loci account for the better concordance with morphology. In addition, future studies should include a phylogenetic analysis to the taxonomic identity of the Tres Marias spinner dolphins stock.
Author Contributions
ML and PM conceived of the work; ML conducted research and analysis and wrote the manuscript as part of his Ph.D. dissertation.
Funding
ML was supported by funding from the National Science Foundation (NSF) Graduate Research Fellowship Program, a NSF Integrative Graduate Education and Research Traineeship Program (NSF IGERT No: 0903551), the Ralph A. Lewin Graduate Fellowship in Marine Biology at Scripps Institution of Oceanography. The Lerner-Grey Memorial Foundation at the American Museum of Natural History, the Edna Bailey Sussman Foundation, and the Southwest Fisheries Science Center's Marine Mammal and Turtle Division all provided research funding for this work.
Conflict of Interest Statement
The authors declare that the research was conducted in the absence of any commercial or financial relationships that could be construed as a potential conflict of interest.
Acknowledgments
We especially thank Dr. William F. Perrin who provided guidance and support throughout this project. Drs. Andy Foote and Eric Archer also provided guidance with analyses. Dr. Kim Andrews provided helpful comments on an early draft of this manuscript. Gabriela Serra-Valente, Victoria Pease, Kelly Robertson, Dr. Louella Dolar, Nicole Beaulieu, and Morgane Lauf helped in the laboratory and tissue archive. We thank Dr. Robin Baird of Cascadia Research Collective and Dr. Erin Oleson of the NOAA Pacific Islands Science Center for permission to use Hawaiian spinner dolphin samples. Support for this research was also provided from Drs. Lisa Ballance and Barbara Taylor, as well as Al Jackson, of the Marine Mammal and Turtle Division of SWFSC. Finally, we offer special thanks to Jeremy Rusin of SWFSC for his logistical and administrative help.
Supplementary Material
The Supplementary Material for this article can be found online at: https://www.frontiersin.org/article/10.3389/fmars.2016.00253/full#supplementary-material
Footnotes
1. ^Wayne Perryman—NOAA Southwest Fisheries Science Center 8901 La Jolla Shores Dr. La Jolla CA 92038.
References
Andrews, K. R., Perrin, W. F., Oremus, M., Karczmarski, L., Bowen, B. W., Puritz, J. B., et al. (2013). The evolving male: spinner dolphin (Stenella longirostris) ecotypes are divergent at Y chromosome but not mtDNA or autosomal markers. Mol. Ecol. 22, 2408–2423. doi: 10.1111/mec.12193
Archer, F. I., Adams, P. E., and Schneiders, B. B. (2016). strataG: an R package for manipulating, summarizing, and analyzing population genetic data. Mol. Ecol. Resour. doi: 10.1111/1755-0998.12559. [Epub ahead of print].
Danecek, P., Auton, A., Abecasis, G., Albers, C. A., Banks, E., DePristo, M. A., et al. (2011). The variant call format and VCFtools. Bioinformatics 27, 2156–2158. doi: 10.1093/bioinformatics/btr330
Dizon, A. E., Perrin, W. F., and Akin, P. A. (1994). Stocks of Dolphins (Stenella spp.) and (Delphinus delphis) in the Eastern Tropical Pacific: A Phylogeographic Classification. NOAA Technical Report NMFS.
Douglas, M., Schnell, G. D., Hough, D., and Perrin, W. F. (1992). Geographic variation in cranial morphology of spinner dolphins Stenella longirostris in the eastern tropical Pacific Ocean. Fish. Bull. 90, 54–76.
Elshire, R. J., Glaubitz, J. C., Sun, Q., Poland, J. A., Kawamoto, K., Buckler, E. S., et al. (2011). A robust, simple genotyping-by-sequencing (GBS) approach for high diversity species. PLoS ONE 6:e19379. doi: 10.1371/journal.pone.0019379
Escorza-Trevino, S., Archer, F. I., Rosales, M., Dizon, A., and Lang, A. (2005). Genetic differentiation and intraspecific structure of Eastern Tropical Pacific spotted dolphins, Stenella attenuata, revealed by DNA analyses. Conserv. Genet. 6, 587–600. doi: 10.1007/s10592-005-9013-9
Funk, W. C., McKay, J. K., Hohenlohe, P. A., and Allendorf, F. W. (2012). Harnessing genomics for delineating conservation units. Trends Ecol. Evol. 27, 489–496. doi: 10.1016/j.tree.2012.05.012
Galver, L. (2002). The Molecular Ecology of Spinner Dolphins (Stenella longirostris): Genetic Diverstiy and Population Structure. Ph.D. Dissertation, University of California, San Diego, CA.
Gerrodette, T., Watters, G. M., Perryman, W., and Ballance, L. T. (2008). Estimates of 2006 Dolphin Abundance in the Eastern Tropical Pacific, with Revised Estimates from 1986-2003. NOAA Technical Memorandum NMFS-SWFSC-422.
Glaubitz, J. C., Casstevens, T. M., Lu, F., Harriman, J., Elshire, R. J., Sun, Q., et al. (2014). TASSEL-GBS: a high capacity genotyping by sequencing analysis pipeline. PLoS ONE 9:e90346. doi: 10.1371/journal.pone.0090346
Gosliner, M. L. (1999). “The tuna-dolphin controversy,” in Conservation and Management of Marine Mammals, eds J. R. Jr. Twiss and R. R. Reeves (Washington, DC; London: Smithsonian Institution Press), 120–155.
Hedrick, P. W., and Goodnight, C. (2005). A standardized genetic differentiation measure. Evolution 59, 1633–1638. doi: 10.1554/05-076.1
Jombart, T., and Ahmed, I. (2011). adegenet 1.3-1: new tools for the analysis of genome-wide SNP data. 27, 3070–3071. Bioinformatics. doi: 10.1093/bioinformatics/btr521
Joseph, J. (1994). The tuna-dolphin controversy in the eastern Pacific Ocean: biological, economic, and political impacts. Ocean Dev. Int. Law J. 25, 1–30.
Lambertsen, R. H. (1987). A biopsy system for large whales and its use for cytogenetics. J. Mammal. 68, 443–445.
Li, H., and Durbin, R. (2009). Fast and accurate short read alignment with burrows–wheeler transform. Bioinformatics 25, 1754–1760. doi: 10.1093/bioinformatics/btp324
Lindblad-Toh, K., Garber, M., Zuk, O., Lin, M. F., Parker, B. J., Washietl, S., et al. (2011). A high-resolution map of human evolutionary constraint using 29 mammals. Nature 478, 476–482. doi: 10.1038/nature10530
Lischer, H. E., and Excoffier, L. (2012). PGDSpider: an automated data conversion tool for connecting population genetics and genomics programs. Bioinformatics 28, 298–299. doi: 10.1093/bioinformatics/btr642
Lo, N. C. H., and Smith, T. D. (1986). Incidental mortality of dolphins in the eastern tropical Pacific, 1959–1972. Fish. Bull. 84, 27–34.
Meirmans, P. G., and Hedrick, P. W. (2011). Assessing population structure: FST and related measures. Mol. Ecol. Resour. 11, 5–18. doi: 10.1111/j.1755-0998.2010.02927.x
Mendez, M., Rosenbaum, H. C., Subramaniam, A., Yackulic, C., and Bordino, P. (2010). Isolation by environmental distance in mobile marine species: molecular ecology of franciscana dolphins at their southern range. Mol. Ecol. 19, 2212–2228.
Miller, S. A., Dykes, D. D., and Polesky, H. F. (1988). A simple salting out procedure for extracting DNA from human nucleated cells. Nucleic Acids Res. 16, 1215.
National Research Council (1992). Dolphins and the Tuna Industry. Washington, DC: National Academy Press.
Nei, M. (1973). Analysis of gene diversity in subdivided populations. Proc. Natl. Acad. Sci. U.S.A. 70, 3321–3323.
Perrin, W. F. (1975). Variation of spotted and spinner porpoise (genus Stenella) in the eastern Pacific and Hawaii. Bull. Scripps Instit. Oceanogr. 21, 1–211.
Perrin, W. F. (1990). Subspecies of Stenella longirostris (Mammalia: Cetacea: Delphinidae). Proc. Biol. Soc. Wash. 103, 453–463.
Perrin, W. F. (2001). Stenella attenuata. Mammal Study 683, 1–8. doi: 10.1644/1545-1410(2001)683<0001:SA>2.0.CO;2
Perrin, W. F., Akin, P. A., and Kashiwada, J. V. (1991). Geographic variation in external morphology of the spinner dolphin (Stenella longirostris) in the eastern Pacific and implications for conservation. Fish. Bull. 89, 411–428.
Perrin, W. F., Dolar, M. L. L., and Robineau, D. (1999). Spinner dolphins (Stenella longirostris) of the western Pacific and Southeast Asia: pelagic and shallow-water forms. Mar. Mammal Sci. 15, 1029–1053.
Perrin, W. F., Evans, W. E., and Holts, D. B. (1979). Movements of Pelagic Dolphins (Stenella spp.) in the Eastern Tropical Pacific as Indicated by Results of Tagging with Summary of Tagging Operations, 1969–1976. NOAA Technical Report NMFS SSRF-737, 1–14.
Perrin, W. F., and Henderson, J. R. (1979). Growth and Reproductive Rates in Two Populations of Spinner Dolphins, (Stenella longirostris), with Different Histories of Exploitation. SWFC Admin. Report LJ-79-29, 14P.
Perrin, W. F., and Hohn, A. A. (1994). “Pantropical spotted dolphin (Stenella attenuata),” in The First Book of Dolphins, Vol. 5, Handbook of Marine Mammals, eds S. H. Ridgway and R. Harrison (San Diego, CA: Academic Press), 71–98.
Perrin, W. F., and Mesnick, S. L. (2003). Sexual ecology of the spinner dolphin, Stenella longirostris: geographic variation in mating system. Mar. Mammal Sci. 19, 462–483. doi: 10.1111/j.1748-7692.2003.tb01315.x
Perrin, W. F., Mitchell, E. D., Mead, J. G., Caldwell, D. K., Caldwell, M. C., Bree, P. J. H., et al. (1987). Revision of the spotted dolphins, Stenella spp. Mar. Mamm. Sci. 3, 99–170.
Perrin, W. F., Miyazaki, N., and Kasuya, T. (1989). A dwarf form of the spinner dolphin (Stenella longirostris) from Thailand. Mar. Mammal Sci. 5, 213–227.
Perrin, W. F., Schnell, G. D., Hough, D. J., Gilpatrick, J. W. Jr., and Kashiwada, J. V. (1994). Reexamination of geographic variation in cranial morphology of the pantropical spotted dolphin, (Stenella attenuata), in the eastern Pacific. Fish. Bull. 92, 324–346.
Perrin, W. F., Scott, M. D., Walker, G. J., and Cass, V. L. (1985). Review of Geographical Stocks of Tropical Dolphins (Stenella spp. and Delphinus delphis) in the Eastern Pacific. NOAA Technical Report. NMFS 28, 1–28.
Perryman, W. L., and Westlake, R. L. (1998). A new geographic form of the spinner dolphin, Stenella longirostris, detected with aerial photogrammetry. Mar. Mammal Sci. 14, 38–50.
R Core Team (2011). R: A language and Environment for Statistical Computing. Vienna: R Foundation for Statistical Computing.
Reilly, S. B., and Fiedler, P. C. (1994). Interannual variability of dolphin habitats in the eastern tropical Pacific. I: research vessel surveys, 1986-1991. Fish. Bull. 92, 434–450.
Taylor, B. L. (2005). Identifying Units to Conserve. Marine Mammal Research: Conservation Beyond Crisis. Baltimore, MD: The John Hopkins University Press. 149–164.
Taylor, B. L., and Dizon, A. E. (1996). The need to estimate power to link genetics and demography for conservation. Conser. Biol. 10, 661–664.
Wade, P. R. (1995). Revised estimates of incidental kill of dolphins (Delphinidae) by the purse-seine tuna fishery in the eastern tropical Pacific, 1959–1972. Fish. Bull. 93, 345–354.
Wade, P. R., Watters, G. M., Gerrodette, T., and Reilly, S. B. (2007). Depletion of spotted and spinner dolphins in the eastern tropical Pacific: modeling hypotheses for their lack of recovery. Mar. Ecol. Prog. Series 343, 1–14. doi: 10.3354/meps07069
Waples, R. S. (1998). Separating the wheat from the chaff: patterns of genetic differentiation in high gene flow species. J. Hered. 89, 438–450.
Willing, E.-M., Dreyer, C., and van Oosterhout, C. (2012). Estimates of genetic differentiation measured by F(ST) do not necessarily require large sample sizes when using many SNP markers. PLoS ONE 7:e42649. doi: 10.1371/journal.pone.0042649
Keywords: conservation, genomics, genotype-by-sequencing, RADseq, subspecies, tuna-dolphin problem
Citation: Leslie MS and Morin PA (2016) Using Genome-Wide SNPs to Detect Structure in High-Diversity and Low-Divergence Populations of Severely Impacted Eastern Tropical Pacific Spinner (Stenella longirostris) and Pantropical Spotted Dolphins (S. attenuata). Front. Mar. Sci. 3:253. doi: 10.3389/fmars.2016.00253
Received: 24 August 2016; Accepted: 23 November 2016;
Published: 15 December 2016.
Edited by:
Lars Bejder, Murdoch University, AustraliaReviewed by:
Brian Michael Shamblin, University of Georgia, USALuciana M. Moller, Flinders University, Australia
Copyright © 2016 Leslie and Morin. This is an open-access article distributed under the terms of the Creative Commons Attribution License (CC BY). The use, distribution or reproduction in other forums is permitted, provided the original author(s) or licensor are credited and that the original publication in this journal is cited, in accordance with accepted academic practice. No use, distribution or reproduction is permitted which does not comply with these terms.
*Correspondence: Matthew S. Leslie, mleslie@ucsd.edu