Highly selective mercury detection at partially oxidized graphene/poly(3,4-ethylenedioxythiophene):poly(styrenesulfonate) nanocomposite film-modified electrode
 Nael G. Yasri
 Ashok K. Sundramoorthy
 Woo-Jin Chang
 Sundaram Gunasekaran
- 1Department of Mechanical Engineering, University of Wisconsin-Milwaukee, Milwaukee, WI, USA
- 2Department of Biological Systems Engineering, University of Wisconsin-Madison, Madison, WI, USA
- 3Department of Chemistry, Faculty of Science, University of Aleppo, Aleppo, Syria
- 4Great Lakes WATER Institute, School of Freshwater Sciences, University of Wisconsin-Milwaukee, Milwaukee, WI, USA
Partially oxidized graphene flakes (po-Gr) were obtained from graphite electrode by an electrochemical exfoliation method. As-produced po-Gr flakes were dispersed in water with the assistance of poly(3,4-ethylenedioxythiophene)/poly(styrenesulfonate) (PEDOT:PSS). The po-Gr flakes and the po-Gr/PEDOT:PSS nanocomposite (po-Gr/PEDOT:PSS) were characterized by Raman spectroscopy, Fourier transform-infrared spectroscopy (FT-IR), UV–Vis spectroscopy, X-ray diffraction (XRD), and scanning electron microscopy (SEM). In addition, we demonstrated the potential use of po-Gr/PEDOT:PSS electrode in electrochemical detection of mercury ions (Hg2+) in water samples. The presence of po-Gr sheets in PEDOT:PSS film greatly enhanced the electrochemical response for Hg2+. Cyclic voltammetry measurements showed a well-defined Hg2+ redox peaks with a cathodic peak at 0.23 V, and an anodic peak at 0.42 V. Using differential pulse stripping voltammetry, detection of Hg2+ was achieved in the range of 0.2–14 μM (R2 = 0.991), with a limit of detection of 0.19 μM for Hg2+. The electrode performed satisfactorily for sensitive and selective detection of Hg2+ in real samples, and the po-Gr/PEDOT:PSS film remains stable on the electrode surface for repeated use. Therefore, our method is potentially suitable for routine Hg2+ sensing in environmental water samples.
Introduction
Mercury (Hg) is an essential element in the industry; however, the metal and its compounds are extremely dangerous to human health and to the environment. Although the use of Hg is regulated in many countries, it is still used in several domestic and industrial applications, which has led to the accumulation of Hg residues in landfills, soils, and streams (Seco-Reigosa et al., 2014). As a result, the focus of numerous investigations has been on closely monitoring Hg present in the environment (Pesavento et al., 2009). Standard methods for Hg analysis include: cold vapor atomic absorption spectrometry (CVAAS) (EPA, 2007a) and inductively coupled plasma-mass spectrometry (ICP-MS) (EPA, 2007b). Some Hg-monitoring applications, without requiring sample pretreatment, depend upon point-of-use sensors that are simple, rapid, stable, reliable, and inexpensive. Accordingly, various methods have been developed such as colorimetric (Liu et al., 2010), fluorometric (Wang et al., 2014a), magnetic (Najafi et al., 2013), electrochemical (Martin-Yerga et al., 2013), etc. The electroanalytical techniques have played a major role in simplified testing for Hg and have been approved by many regulatory bodies (EPA, 1996). In general, many electroanalytical or colorimetric methods rely upon a change in electrical signal following a reaction (amalgamation) of gold (Au) or other precious metals with Hg, either at the electrode or within the sample solution to selectively bind with the target mercury ions (Hg2+) (Welch et al., 2004; Martin-Yerga et al., 2013). The major drawbacks in using Au for sensing Hg are the significant effect of the sample matrix (Botasini et al., 2013) and the structural changes on the sensor material caused by the amalgam formation (Welch et al., 2004; Martin-Yerga et al., 2013), which require some additional chemical, electrochemical, and mechanical pretreatment of the sample (Anandhakumar et al., 2012).
Some electrochemical methods for sensing Hg use the conjugation of functional groups, such as the donor ligands of nitrogen (N) or sulfur (S) present in amino acids or conducting polymers, such as poly (3,4-ethylenedioxythiophene) (PEDOT), which have a strong binding preference for Hg2+ (Chow and Gooding, 2006; Giannetto et al., 2011; Anandhakumar et al., 2012). In the case of PEDOT, although it contains S, which can endow two unpaired electrons, it may not be possible to use PEDOT by itself due to the low signal sensitivity, high insolubility, and intractability (Martin-Yerga et al., 2013). Therefore, to produce a stable and flexible polymer, a conventional poly(styrenesulfonate) (PSS) is incorporated into PEDOT to form PEDOT:PSS (Vacca et al., 2008), which is an excellent copolymer because of its high conductivity, environmental stability (Wang et al., 2014b). To date, the potentials of PEDOT:PSS for electrode modification and electrochemical sensing of toxic metal ions have been seldom reported (Anandhakumar et al., 2011; Yasri et al., 2011; Rattan et al., 2013).
Due to high electrical conductivity, biocompatibility, and the exceptional surface-to-volume ratio, graphene (Gr) received more attention in various applications, including chemical and biosensors (Hill et al., 2011; Sundramoorthy and Gunasekaran, 2014). Recently, incorporating Gr on the working electrode surface to enhance the electrochemical signal for analytical applications has become fairly common (Mikolaj and Zbigniew, 2012; Sundramoorthy and Gunasekaran, 2014). Generally, Gr or reduced graphene oxide (rGO) are used for sensor applications (Yang and Gunasekaran, 2013; Yang et al., 2013). Gr can be obtained from graphite by mechanical cleavage (Jayasena and Subbiah, 2011), chemical exfoliation (Zhang et al., 2010), thermal decomposition (Wang et al., 2012), or electrochemical exfoliation (Low et al., 2013). Among other methods, electrochemical exfoliation of graphite electrode is considered a simple, rapid, and “green” method, as the use of toxic or corrosive reducing reagents or stabilizers are avoided in this method (Su et al., 2011; Singh et al., 2012; Chang et al., 2013; Gee et al., 2013; Mao et al., 2013).
The electrochemical exfoliation of graphite can be achieved by a one or two-step process. In a two-step process, in the first step, graphite electrode is activated in an electrolyte solution at a relatively low bias voltage. During this part of the process, the electrode expands due to the intercalation of electrolyte (usually Li+ or Na+) ions into the graphite lattice (Zhong and Swager, 2012). The second step involves applying a higher bias voltage to ensure exfoliation of the expanded graphite electrode and separating Gr flakes into the solution (Qi et al., 2011; Su et al., 2011; Zhang et al., 2012; Gee et al., 2013; Li et al., 2013). For example, when lithium ion (Li+) is used as an electrolyte, −3.0 V of static bias voltage is applied to intercalate Li+ into graphite electrode (Wang et al., 2011). In this work, we have electrochemically synthesized partially oxidized Gr (po-Gr) flakes to study its potential application in detecting mercury (Hg2+) ions with PEDOT:PSS. The po-Gr/PEDOT:PSS conducting film readily conjugates with Hg2+ in water and allowed us to do selective detection of Hg2+ in real samples.
Materials and Methods
Reagents
We used analytical-grade chemicals from Fisher, Acros Organics, and Sigma-Aldrich (USA). Supporting electrolytes were prepared using HNO3 or NaCl. Stock solution of 10 × 10−4 M Hg2+ was prepared using mercury nitrate [Hg(NO3)2] and used after further dilution. All aqueous solutions were prepared using deionized water with 18.2 MΩ cm (EMD, Millipore). The PEDOT:PSS sample was received from CIDETEC research group (San Sebastian, Spain) (Istamboulie et al., 2010).
Electrochemical Synthesis of po-Gr
The po-Gr flakes were obtained by electrochemical exfoliation of graphite sheet. Briefly, a two-electrode cell was used with a piece of flexible graphite sheet (Graphitestore, Inc., USA) as a working electrode and a platinum (Pt) wire were placed parallel to and about 10 mm away from the graphite electrode which served as a counter electrode. The electrodes were connected to a DC power supply (Tektronix PS 280). About 10 mm of the working and counter electrodes were immersed into 25 mL containing 0.1 M HClO4 and 0.1 M NaCl which served as an electrolyte. The exfoliation was performed by applying DC bias on the working electrode. Initially, a potential of −2.5 V was applied for 60 min to facilitate the electrochemical expansion of graphite electrode by intercalation of Na+ ions into graphite layers; after which, a potential of +10 V was applied for another 60 min to achieve exfoliation. The electrolyte solution containing the exfoliated po-Gr flakes was vacuum filtrated (using membrane with a pore size 0.4 μm) and washed with deionized water many times to remove the residual electrolyte.
Preparation of po-Gr/PEDOT:PSS Dispersion
The obtained po-Gr flakes were dried at 60°C for 30 min, and then dispersed in 10 mL PEDOT:PSS solution by a probe sonicator (Sonics, VibraCell VCX130) for 15 min. Later, the po-Gr/PEDOT:PSS dispersion was centrifuged for 30 min at 2,000 rpm (Sorvall Super T21) and the supernatant was used for further characterization. The po-Gr flakes were also dispersed in water (without PEDOT:PSS) for 15 min by probe sonicator and centrifuged at 2,000 rpm for 30 min to collect supernatant for control studies. All experiments were performed at room temperature (25 ± 3°C).
Preparation of po-Gr/PEDOT:PSS-Modified Electrode
A 10 μL sample of po-Gr/PEDOT:PSS or po-Gr dispersion was placed on a well cleaned (after mirror-like polishing with alumina powder) glassy carbon electrode (GCE) surface and dried in an air-oven for 30 min to evaporate solvents. By this method, po-Gr/PEDOT:PSS or po-Gr film-coated electrode was obtained and gently washed by immersing in water for about 5 min to remove unbounded materials from the electrode surface. For Raman measurements, the po-Gr film prepared on glass substrate was reduced with hydrazine in pH 9.0 water solution at 80°C for 2 h (Park et al., 2011).
Electrochemical Measurements and Characterization
Electrochemical measurements were performed by using an electrochemical workstation (660D, CH Instruments). A 10-mL volume, three-electrode system was used with GCE, Ag/AgCl (3 M KCl), and Pt wire as working, reference, and counter electrode, respectively. The GCE was used either bare or after modification with po-Gr film, PEDOT:PSS film, or po-Gr/PEDOT:PSS film. The electrochemical responses of the bare GCE and modified GCE’s toward Hg2+ were examined with cyclic voltammetry (CV) in 0.05 M HNO3 as an electrolyte.
Electrochemical impedance spectroscopy (EIS) measurements were performed in a solution containing 2.5 mM [Fe(CN)6]4-/3- and 0.1 M KCl supporting electrolyte in the frequency range of 1–106 Hz. Differential pulse stripping voltammetry (DPSV) was performed by applying deposition and then stripping steps with the following parameters: initial potential, −0.2 V; final potential, 0.8 V; amplitude, 50 mV; pulse width, 0.2 s; pulse period, 0.5 s; sample width, 0.0169 s; and deposition time, 2 min. During the deposition period, the solution was stirred at 800 rpm, and the potential was held at −0.30 V. The DPSV voltammograms were recorded upon injection of Hg2+ ions in the range of 0.2–14.0 μM in 0.05 M HNO3. The interferences of some metal ions (Ca2+, Fe2+, Co2+, Ni2+, Cd2+, Zn2+, Cr6+, and Pb2+) on the determination of 6.0 μM Hg2+ in 0.05 M HNO3 were also investigated by adding their respective nitrate salts.
The surface morphology of po-Gr flakes was studied by scanning electron microscopy (SEM) (LEO1530, Gemini FESEM, Carl Zeiss). Further characterizations were performed on dry samples using Raman spectroscopy (LabRAM Aramis Horiba Jobin Yvon Confocal Raman Microscope, wavelength: 532 nm) and attenuated total reflectance-Fourier transform-infrared spectroscopy (ATR-FT-IR) (Spectrum 100, PerkinElmer). UV–Vis spectra of po-Gr and po-Gr/PEDOT:PSS dispersed in water were obtained using a spectrophotometer (Lambda 25, PerkinElmer). X-ray diffraction (XRD) pattern of samples were measured using Bruker D8 Discover diffractometer.
Results and Discussion
Characterization of po-Gr and po-Gr/PEDOT:PSS Film
The scheme for electrochemical exfoliation of po-Gr flakes and modification of GCE surface with po-Gr/PEDOT:PSS dispersion for Hg2+ detection using DPSV is shown in Figure 1. After successful exfoliation, po-Gr flakes were dispersed separately in water, and PEDOT:PSS solution (Figure 2A). The po-Gr solution (Figure 2A, image a) was light yellowish brown in color and the po-Gr dispersed in PEDOT:PSS was light bluish (Figure 2A, image b). UV–Vis spectra of po-Gr solution showed a strong absorption band at 261 nm, which can be assigned to the partially oxidized graphene sheets. It has been shown that graphene oxide (GO) and rGO have absorption peaks at 230 nm, and 270 nm (π–π* transition of aromatic C–C bonds), respectively (Figure 2B) (Li et al., 2008; Choi et al., 2010).
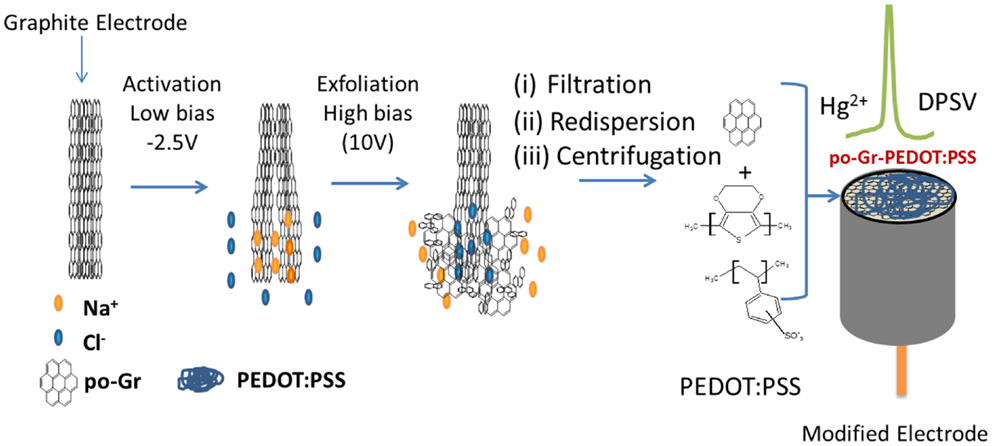
Figure 1. Schematic representation of electrochemical synthesis of po-Gr and electrochemical detection of mercury (Hg2+) at po-Gr-PEDOT:PSS film-coated electrode by differential pulse stripping voltammetry (DPSV).
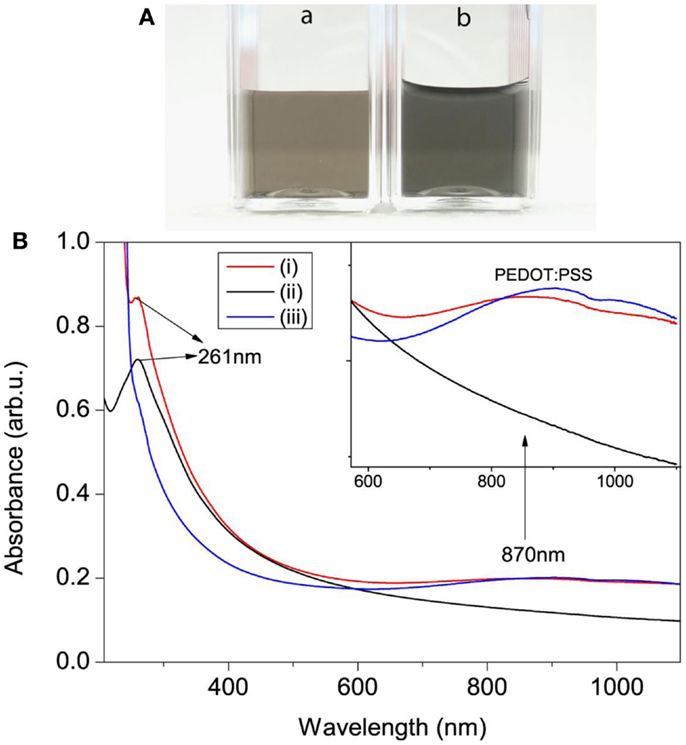
Figure 2. (A) Photographs of (a) po-Gr and (b) po-Gr/PEDOT:PSS solutions. (B) UV–Vis spectra of (i) po-Gr/PEDOT:PSS, (ii) po-Gr, and (iii) PEDOT:PSS solutions (Inset shows enlarged view of absorption peak of PEDOT:PSS).
The optical absorption peak of our synthesized po-Gr solution (after centrifugation) is in the range between that for GO and rGO; thus, we describe it as po-Gr. However, UV–Vis spectra of po-Gr/PEDOT:PSS solution showed two major absorption bands, first band observed at 261 nm and second broad band centered at 870 nm. The first peak corresponds to the optical absorption of the po-Gr and the second peak corresponds to the oxidized PEDOT:PSS (light blue) (Gustafsson-Carlberg et al., 1995; Pettersson et al., 1999; Tarabella et al., 2012). For comparison, we also measured UV–Vis spectra of PEDOT:PSS solution, which shows a broad optical absorption band centered at 870 nm (Figure 2B). This study provides evidence that po-Gr sheets are stabilized in PEDOT:PSS solution.
Raman spectra of the (a) pristine graphite sheet, (b) as-synthesized po-Gr flakes, (c) po-Gr film prepared from water dispersion after centrifugation, and (d) po-Gr film after reduction with hydrazine are presented in Figure 3. The spectra show D, G, and 2D bands for all samples (Table 1). For pristine graphite sheet, almost insignificant D band was observed, because of highly crystalline structure of graphite without defects (Figure 3A). However, Raman spectrum of the other three samples (Figures 3B–D) showed significant changes upon exfoliation, following redispersion in water and after reduction with hydrazine (Table 1). The G band is characteristic of sp2-hybridized C = C bonds in graphene sheets (Childres et al., 2013); whereas, the D band is associated with structural defects and partially disordered structures of the sp2 domain (Childres et al., 2013). The 2D band located at 2718 cm−1 originates from a double-resonance process (Krauss et al., 2009; Yan et al., 2011). The calculated values of ID/IG listed in Table 1. Su et al. (2011) show that it changed significantly from 1.073 to 1.234 after reduction with hydrazine, indicating that restoration of C–C bonds in the graphene lattice, and a decrease in the average size of graphene domains (Lee et al., 2014). This study supports our understanding that as synthesized graphene flakes contain significant defects, due to functional groups generated upon electrochemical exfoliation at high voltage (Morales et al., 2011). ID/IG ratio (0.310) of as-synthesized graphene flakes is relatively small compared to po-Gr film (after centrifugation), which may be due to the presence of large graphene flakes without complete exfoliation (Figure 3B). Therefore, it was necessary to disperse po-Gr flakes in a suitable dispersant with a probe sonicator to achieve complete exfoliation of graphene sheets. In this work, we used PEDOT:PSS to disperse po-Gr flakes in water.
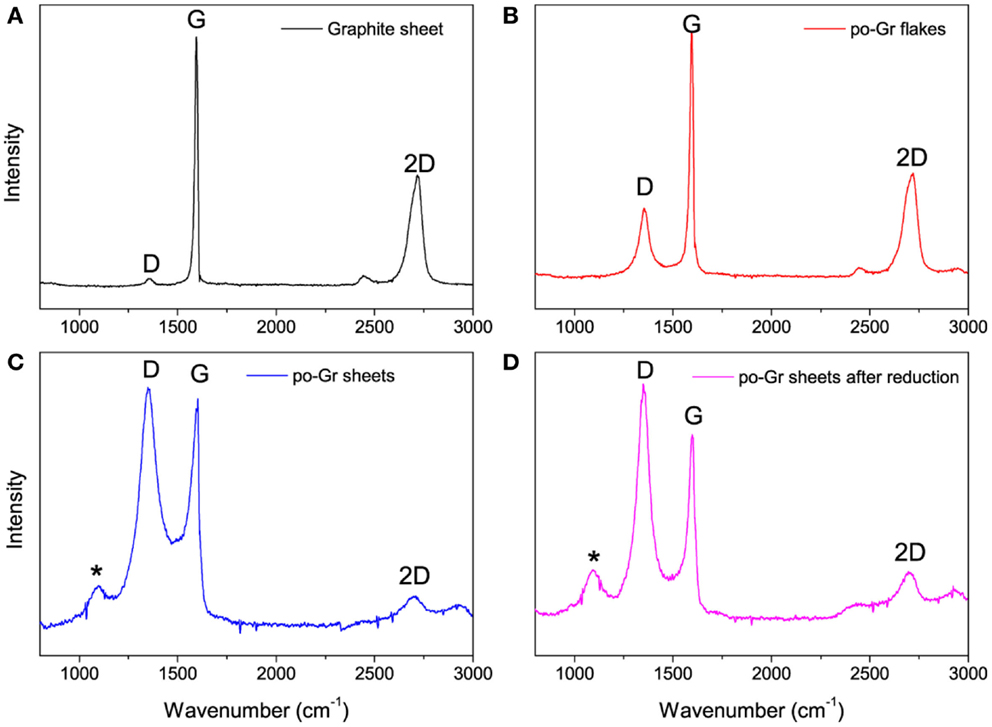
Figure 3. Raman spectra of (A) pristine graphite sheet, (B) po-Gr flakes (as-synthesized from electrochemical exfoliation), (C) po-Gr film (after centrifugation), and (D) po-Gr film after reduction with hydrazine (532 nm laser was used) (*peak is assigned to the glass substrate).
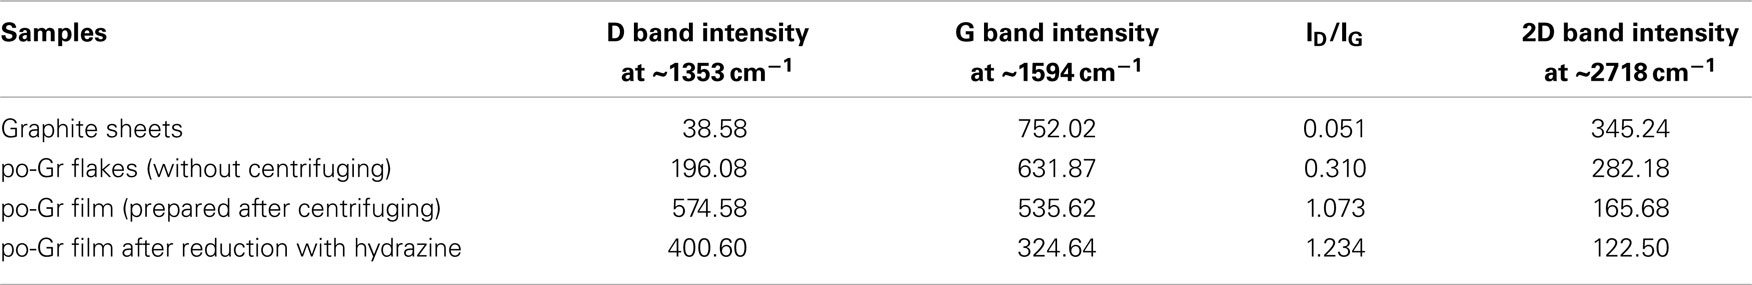
Table 1. The D, G, 2D bands and ID/IG ratio were estimated from the Raman spectrum of pristine graphite sheet, po-Gr flakes, po-Gr film (prepared after centrifugation), and po-Gr film after chemical reduction using hydrazine.
The as-synthesized po-Gr flakes, po-Gr film (after centrifugation), PEDOT:PSS film, and po-Gr/PEDOT:PSS film were characterized by FT-IR (Figure 4). For as-synthesized po-Gr flakes, no significant bands were observed, which may be due to the incomplete exfoliation process. Indeed, after successful redispersion in water and following centrifugation, po-Gr film on glass showed significant bands at ~3430 (OH stretch), 2337 (CO2 stretch), 1722 (C = O stretch), and 1637 cm−1(OH bending and C = C stretch) (Pham et al., 2011). The FT-IR spectrum of PEDOT:PSS showed peaks at 1372, 1289, 1124, 1023, 1002 cm−1, which are derived from PEDOT:PSS (Alemu Mengistie et al., 2013; Yoo et al., 2014). The IR bands at 1160 and 1023 cm−1 are assigned to SO3− of the PSS. Further, the FT-IR spectrum of po-Gr/PEDOT:PSS consists bands of PEDOT:PSS, which proves that po-Gr sheets wrapped with the polymer structure (Figure 4).
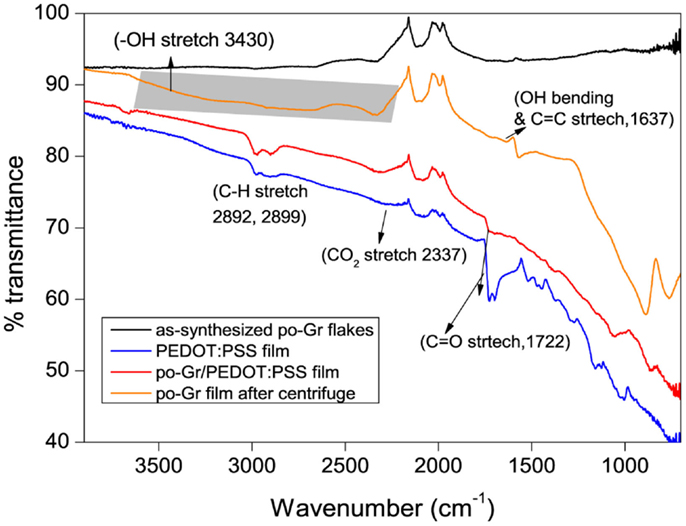
Figure 4. FT-IR Spectra of po-Gr flakes, po-Gr film (prepared after centrifugation), po-Gr/PEDOT:PSS film, and PEDOT:PSS film (highlighted area in the figure shows the –OH stretch due to partial oxidation of po-Gr sheets).
Surface morphology of po-Gr sheets was also studied by SEM. SEM images of the exfoliated po-Gr film show wrinkled or folded thin sheets with the lateral dimension of 1–3 μm (Figure 5A). The XRD spectrum of graphite sheet exhibits an intense peak at 26.5°, corresponding to d-spacing of 0.34 nm (Figure 5B). However, after electrochemical exfoliation, po-Gr flakes exhibit a broad peak at ~16 to 23° and another intense peak at 26.52°. The broad peak at ~16 to 23° indicates the presence of functional groups containing oxygen, which is formed during electrochemical exfoliation (Figure 5B) (Fang et al., 2009). There is also slight shift in the peak position of po-Gr flakes from graphite after electrochemical exfoliation from 26.50 to 26.52 (inset of Figure 5B), which may due to intercalation of ions into the graphene layers.
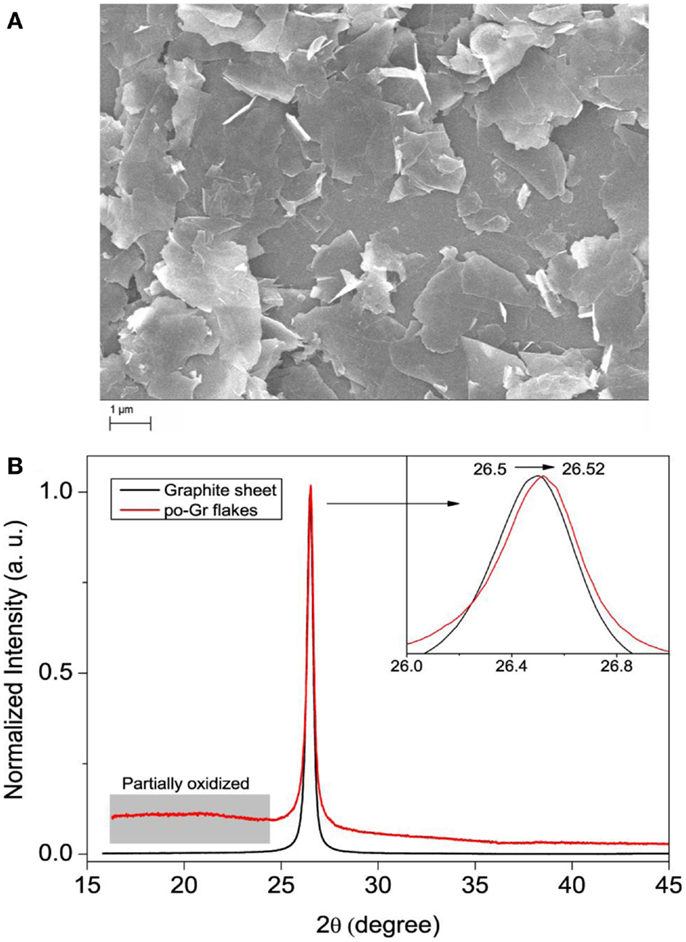
Figure 5. (A) SEM image of po-Gr sheets and (B) XRD patterns of pristine graphite sheet and po-Gr flakes (inset shows enlarged view of peak 002). The distorted peak in the range of 15–24 θ is assigned to the partially oxidized parts of graphene flakes.
Electrochemical Impedance Studies
Figure 6 is the Nyquist plot of the modified GCE’s in 2.5 mM [Fe(CN)6]4-/3- in 0.1 M KCl. The semicircular part in the high-frequency region represents electron-transfer-limiting process with its effective diameter equal to Faradaic charge transfer resistance (Rct), which is responsible for the electron transfer kinetics of redox reactions at the electrode-electrolyte interface (Kumar et al., 2010; Yang and Gunasekaran, 2013). The Rct values of po-Gr/GCE (Rct = 144 Ω), PEDOT:PSS/GCE (Rct = 65 Ω), and po-Gr/PEDOT:PSS/GCE (Rct = 54 Ω), modified electrodes were lower than that for bare electrode (Rct = 228 Ω), indicating higher conductivity as a result of modification processes (Figure 6). Generally poor conductivity of GO-modified electrode is due to the presence of excessive oxygenated species, which accentuates the insulating characteristics (Yang and Gunasekaran, 2013). The Rct for po-Gr film is also higher than for PEDOT:PSS/GCE and po-Gr/PEDOT:PSS/GCE’s perhaps due to the presence of oxygenated species associated with po-Gr, which may affect conductivity of the electrode. However, when po-Gr sheets present in PEDOT:PSS, it improves the conductivity of the electrode (Figure 6).
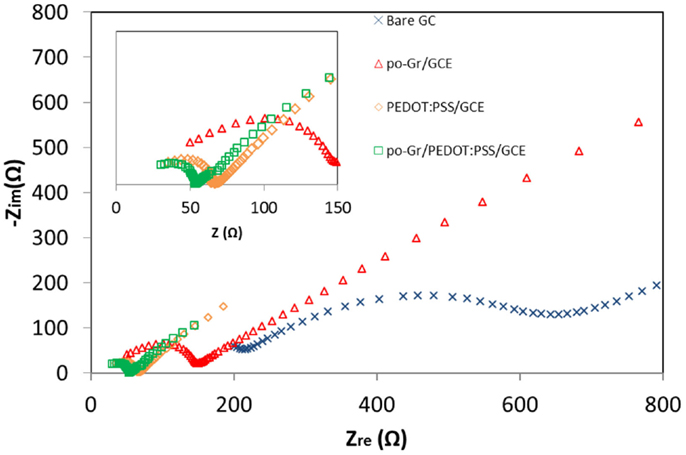
Figure 6. Nyquist (Zre vs. Zimg) impedance spectra collected using bare GCE, po-Gr/GCE, PEDOT:PSS/GCE, and po-Gr/PEDOT:PSS/GCE electrodes in 2.5 mM [Fe(CN)6]4-/3- and 0.1 M KCl. Inset: enlarged high-frequency region.
Detecting Hg2+
Linear sweep voltammetry
The linear sweep voltammograms (LSVs) of Hg2+ recorded on bare, po-Gr/PEDOT:PSS-, PEDOT:PSS-, and po-Gr-modified GCE’s in 0.05 M HNO3 show two electrochemical oxidation peaks for Hg2+ (Figure 7). These peaks are attributed to two well-defined one-electron steps, according to the two-step equation: Hg2+ + e− = Hg+ + e− = Hg0 (Orlik and Galus, 2007). The presence of po-Gr on both bare GCE and PEDOT:PSS-modified GCE improved the peak current (Ipa) compared to that in the absence of po-Gr. For example, 3-fold, 23-fold, and 100-fold increases in oxidation currents were obtained with po-Gr-, PEDOT:PSS-, and po-Gr-PEDOT:PSS-modified GCE’s, respectively compared to 23.4 μA obtained with bare GCE (Figure 7). These Ipa increases are attributed to the combined effects of sulfonic (Pillay et al., 2013) and thiol (Chandrasekhar et al., 2007; Kadarkaraisamy et al., 2011; Mandal et al., 2013) functional groups on PEDOT:PSS matrix/po-Gr nanocomposite (Shao et al., 2010; Anandhakumar et al., 2012).
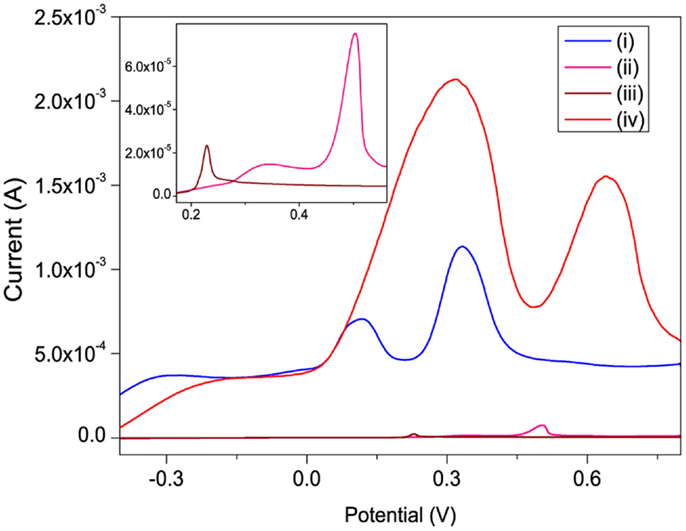
Figure 7. Linear sweep voltammograms recorded for 0.8 mM Hg2+ in 0.05 M HNO3 solution on (i) PEDOT:PSS-, (ii) po-Gr-, (iii) bare-, and (iv) po-Gr/PEDOT:PSS/modified GCE’s. Inset: enlarged bare and po-Gr-modified GCE’s. Scan rate = 100 mV/s.
The effect of scan rate on the voltammograms of Hg2+ at 0.4 mM concentration is shown in Figure 8A. Significant increases in Ipa with increasing scan rate from 1 to 100 mV/s were obtained using po-Gr/PEDOT:PSS-modified GCE (Figure 8A). The relation between Ipa vs. square root of scan rate was linear, which indicated that the electrode reaction was diffusion-controlled (Bard and Faulkner, 2001). However, at lower scan rates of up to 20 mV/s, the Ipa showed only single oxidation peak, which may be due to a slower process, as the reaction occurs in one step: Hg2+ + 2e− = Hg0 (Orlik and Galus, 2007). The po-Gr/PEDOT:PSS-modified GCE showed a linear response for various Hg2+ concentrations from 0.3 to 1.6 mM (R2 = 0.997) (Figure 8B).
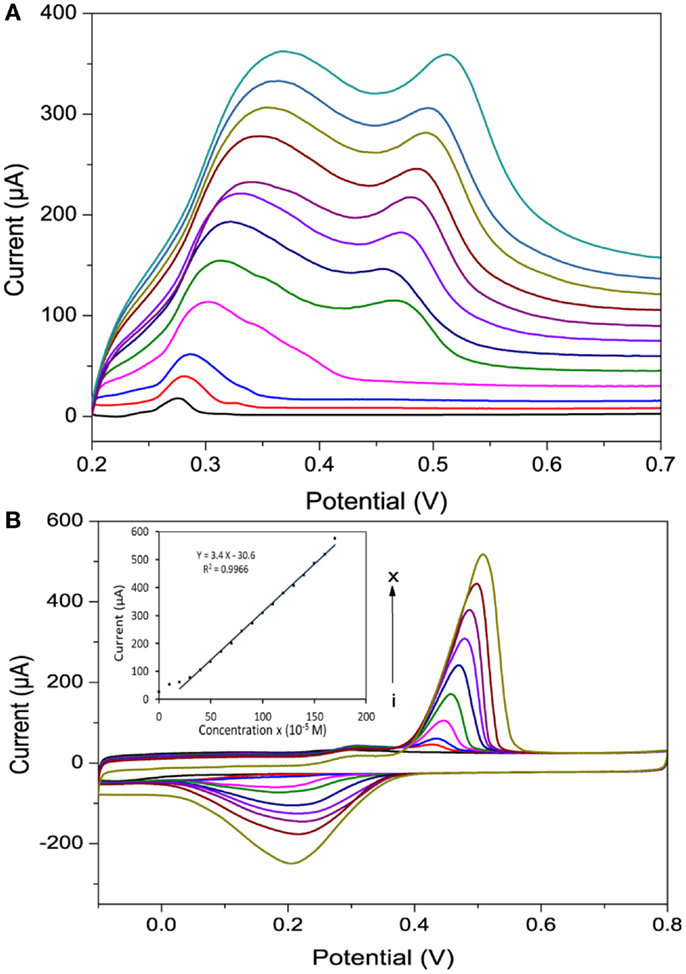
Figure 8. (A) A linear sweep voltammograms recorded using po-Gr/PEDOT:PSS-modified GCE in 0.4 mM Hg2+ + 0.05 M HNO3 at various scan rates (1–100 mV/s) and (B) cyclic voltammograms of different concentration of Hg2+. (i) 0.0, (ii) 0.1, (iii) 0.2, (iv) 0.4, (v) 0.6, (vi) 0.8, (vii) 1.0, (viii) 1.2, (ix) 1.4, and (x) 1.6 mM (inset shows the corresponding calibration curve) in 0.05 M HNO3 medium using po-Gr/PEDOT:PSS-modified GCE at a scan rate of 20 mV/s.
Differential pulse stripping voltammetry measurements
The DPSV is a highly sensitive technique for electroanalysis of trace metals in different samples. It involves two steps for the detection of Hg2+ (Somerset et al., 2010) such as (i) deposition of Hg0 at an optimized potential for a certain duration and (ii) anodic stripping of deposited Hg0. As shown in Figure 8B, the reduction of Hg2+ occurs at 0.21 V vs. Ag/AgCl. The effects of the deposition potential and time on the Hg stripping responses were investigated accordingly. The stripping peak currents at different deposition potentials (from −0.5 to +0.2 V) showed that the best stripping signal was obtained in the range of −0.30 to 0.0 V vs. Ag/AgCl (Figure 9B). Based on these results, a deposition potential of −0.30 V was selected for further investigation. Figure 9A shows the relationship between the Hg stripping signal against the deposition time at −0.3 V vs. Ag/AgCl using po-Gr/PEDOT:PSS-modified electrode. The peak current becomes fairly stable after 120 s of deposition.
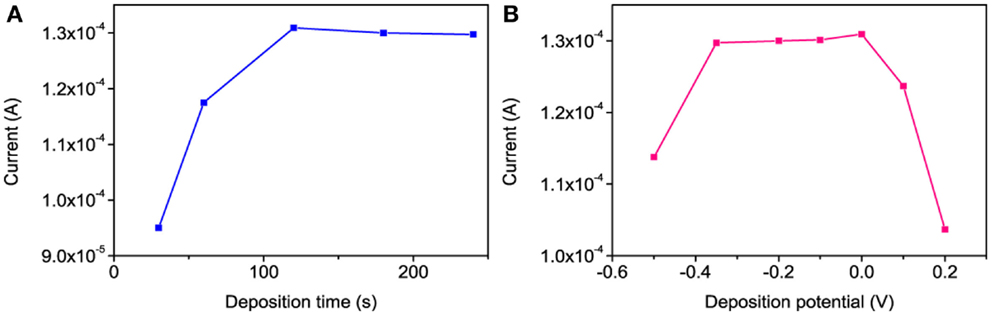
Figure 9. The effect of (A) deposition time at −0.3 V vs. Ag/AgCl and (B) deposition potential for 120 s on the DPSV stripping responses of 6 μM of Hg2+ at po-Gr/PEDOT:PSS-modified GCE in 0.05 M HNO3.
The anodic DPSV response of the po-Gr/PEDOT:PSS-modified electrode with successive Hg2+ concentrations in 0.05 M HNO3 solution are presented in Figure 10. A linear variation of the Ipa was observed for concentrations ranging from 0.2 to 14.0 μM (R2 = 0.991), with a sensitivity of 8.72 μA/μM. The limit of detection (LOD) and limit of quantification (LOQ) were calculated as LOD = 3.3 SD/b and LOQ = 10 SD/b, where SD is the standard deviation of five reagent blank determinations and b is the slope of the calibration curve (Shrivastava and Gupta, 2011). Using po-Gr/PEDOT:PSS-modified GCE, the LOD and LOQ were found to be 0.19 and 0.58 μM for Hg2+, respectively. This LOD is lower than dithiodianiline-derivative-modified electrode (~2.1 μM) (Somerset et al., 2010) and silver ink screen-printed electrode (~0.5 μM) (Chiu et al., 2008). The po-Gr-PEDOT:PSS-modified GCE also exhibited excellent stability and reproducibility with relative standard deviation (RSD) of 0.93% for 10 successive measurements of 6.0 μM Hg2+ in 0.05 M HNO3 solution. The RSD for six similarly prepared electrodes tested under the same conditions was 1.6%. LOD of Hg2+ at Au-PEDOT carbon composite film was ~5 μM (Anandhakumar et al., 2012). In addition, Au-PEDOT film-modified electrode may not be suitable for repeated use because of amalgam formation with AuNPs. Amalgam formation on the electrode surface affects reproducibility of analytical response. It is necessary to regenerate or activate the electrode surface each time with ethylenediaminetetraacetic acid (Giannetto et al., 2011). Electrochemical response of Hg2+ at po-Gr/PEDOT:PSS-modified GCE is not dependent on amalgam formation, so it offers reproducible measurements without the need for regeneration or electrode activation.
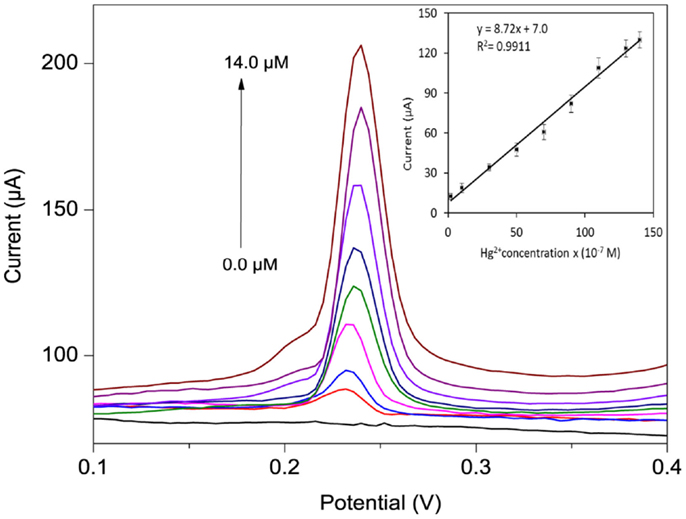
Figure 10. DPSV curves for different Hg2+ concentrations (0, 0.2, 1.0, 3.0, 5.0 7.0, 9.0, 11.0, and 14.0 μM) in 0.05 M HNO3 using po-Gr/PEDOT:PSS-modified GCE (inset shows calibration plot of peak current vs. Hg2+ concentration). The reduction voltage is −0.30 V vs. Ag/AgCl for 120 s, then DPSV stripping in the range −0.2 to 0.8 V vs. Ag/AgCl at increments of 4 mV, amplitude 0.05 V, pulse width 0.2 s, and pulse period 0.5 s.
Effect of Interference
The influence of various common interfering metal cations (Ca2+, Zn2+, Ni2+, Cr6+, As3+, Cd2+, Co2+, Fe2+, and Cu2+) in the presence of 6.0 μM Hg2+ in 0.05 M HNO3 were tested using the po-Gr/PEDOT:PSS-modified GCE. The interference effect was calculated as:
where, IHg = peak current for Hg2+, IHg+ interferent = peak current for Hg2+ plus added interferent. The data in Table 2 indicate that the performance of the po-Gr-PEDOT:PSS-modified GCE was unaffected by the tested interferents. The stripping peak current of Hg2+ exhibited no change in the presence of Zn2+, Cd2+, Ca2+, As3+, or Ni2+ ions even at concentrations each at more than 300 times that of Hg2+. Assuming an acceptable interference of ±5% (Fifield and Kealey, 2000), only Cu2+ at 16 times that of Hg2+ and Fe2+, at 10 times that of Hg2+, can be considered as interferents. DPSV of a solution containing Fe2+, Cu2+, and Hg2+, exhibited oxidation peaks for Fe2+ at 0.44 V and for Cu2+ at −0.024 V vs. Ag/AgCl (Figure S1 in Supplementary Material).
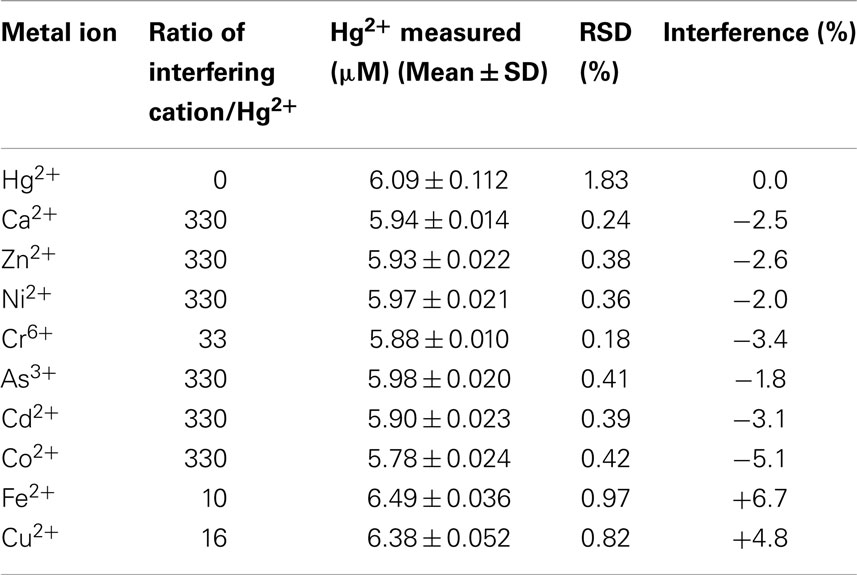
Table 2. Interference study of other metal ions on the DPSV measurement of 6.0 μM Hg2+ using po-Gr/PEDOT:PSS-modified GCE.
Validation with Real Sample Tests
The performance of the po-Gr/PEDOT:PSS-modified GCE was evaluated by comparing test results with those determined according to US Environmental Protection Agency (EPA) Method 245.1 (EPA, 2007a) using CVAAS performed at the Wisconsin State Laboratory of Hygiene. The data obtained by measuring Hg2+ content in three unknown laboratory waste samples (Table 3) provide an excellent validation of proposed method.
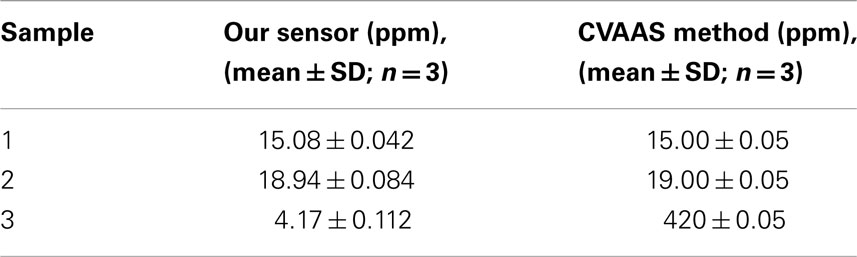
Table 3. Comparison of Hg2+ content determined by using po-Gr/PEDOT:PSS/GCE and by standard cold vapor atomic absorption spectroscopy (CVAAs) method in unknown samples.
Conclusion
We synthesized po-Gr from graphite sheets by electrochemical exfoliation using HClO4/NaCl solution as an electrolyte. The po-Gr and po-Gr-PEDOT:PSS film were characterized using SEM, Raman, FT-IR, XRD, and UV–Vis spectroscopy. Both EIS and CV measurements proved that the presence of po-Gr enhanced the electrochemical catalytic properties of PEDOT:PSS material. The po-Gr/PEDOT:PSS-modified GCE exhibited higher catalytic peak current for Hg2+ compared to bare and PEDOT:PSS-modified GCE. The Gr-PEDOT:PSS/GCE was stable and reproducible for determining Hg2+ at micromolar levels. The LOD determined by DPSV was 0.19 μM, and the detection was linear in the range of 0.2–14.0 μM (R2 = 0.991). The sensor response was not affected by other metal ions. Accurate selective detection of Hg2+ in laboratory water samples showed that our method is suitable for routine Hg2+ sensing in environmental samples.
Conflict of Interest Statement
The authors declare that the research was conducted in the absence of any commercial or financial relationships that could be construed as a potential conflict of interest.
Acknowledgments
The authors are thankful to funding support to Nael G. Yasri through Scholar Rescue Fund Fellowship. Authors would also like to thank Prof. Thierry Noguer (Université de Perpignan Via Domitia) for cooperation and supplying the sensitized PEDOT:PSS sample.
Supplementary Material
The Supplementary Material for this article can be found online at http://www.frontiersin.org/Journal/10.3389/fmats.2014.00033/abstract
References
Alemu Mengistie, D., Wang, P.-C., and Chu, C.-W. (2013). Effect of molecular weight of additives on the conductivity of PEDOT:PSS and efficiency for ITO-free organic solar cells. J. Mater. Chem. A 1, 9907–9915. doi:10.1039/c3ta11726j
Anandhakumar, S., Mathiyarasu, J., Lakshmi, K., Phani, N., and Yegnaraman, V. (2011). Simultaneous determination of cadmium and lead using PEDOT/PSS modified glassy carbon electrode. Am. J. Anal. Chem. 2, 470–474. doi:10.4236/ajac.2011.24056
Anandhakumar, S., Mathiyarasu, J., and Phani, K. L. N. (2012). Anodic stripping voltammetric detection of mercury(ii) using Au-PEDOT modified carbon paste electrode. Anal. Methods 4, 2486–2489. doi:10.1039/c2ay25170a
Bard, A. J., and Faulkner, L. R. (2001). Electrochemical Methode; Fundamentals and Applications. New York: John Wiley & Sons, INC.
Botasini, S., Heijo, G., and Mendez, E. (2013). Toward decentralized analysis of mercury (II) in real samples. A critical review on nanotechnology-based methodologies. Anal. Chim. Acta 800, 1–11. doi:10.1016/j.aca.2013.07.067
Pubmed Abstract | Pubmed Full Text | CrossRef Full Text | Google Scholar
Chandrasekhar, S., Chopra, D., Gopalaiah, K., and Guru Row, T. N. (2007). The generalized anomeric effect in the 1,3-thiazolidines: evidence for both sulphur and nitrogen as electron donors. Crystal structures of various N-acylthiazolidines including mercury(II) complexes. Possible relevance to penicillin action. J. Mol. Struct. 837, 118–131. doi:10.1016/j.molstruc.2006.10.034
Chang, C. F., Truong, Q. D., and Chen, J. R. (2013). Graphene sheets synthesized by ionic-liquid-assisted electrolysis for application in water purification. Appl. Surf. Sci. 264, 329–334. doi:10.1016/j.apsusc.2012.10.022
Childres, I., Jauregui, L. A., Park, W., Cao, H., and Chen, Y. (2013). “Raman spectroscopy of graphene and related materials,” in Developments in Photon and Materials Research, ed. J. I. Jang (New York: Nova Science Publishers).
Chiu, M.-H., Zen, J.-M., Kumar, A. S., Vasu, D., and Shih, Y. (2008). Selective cosmetic mercury analysis using a silver ink screen-printed electrode with potassium iodide solution. Electroanalysis 20, 2265–2270. doi:10.1002/elan.200804307
Choi, E.-Y., Han, T. H., Hong, J., Kim, J. E., Lee, S. H., Kim, H. W., et al. (2010). Noncovalent functionalization of graphene with end-functional polymers. J. Mater. Chem. 20, 1907–1912. doi:10.1039/b919074k
Chow, E., and Gooding, J. J. (2006). Peptide modified electrodes as electrochemical metal ion sensors. Electroanalysis 18, 1437–1448. doi:10.1002/elan.200603558
EPA. (1996). Mercury in Aqueous Samples and Extracts by Anodic Stripping Voltammetry (ASV) (Method 7472). Boston: EPA. Available from: http://www.epa.gov/osw/hazard/testmethods/sw846/pdfs/7472.pdf
EPA. (2007a). Determination of Mercury in Water by Cold Vapor Atomic Absorption Spectrometry (Method 245.1). Cincinnati, OH: U.S. EPA. Available at: http://water.epa.gov/scitech/methods/cwa/bioindicators/upload/2007_07_10_methods_method_245_1.pdf
EPA. (2007b). Determination of Trace Elements In Waters And Wastes by Inductively Coupled Plasma – Mass Spectrometry (Method 200.8). Cicinnati, OH: US EPA. Available at: http://water.epa.gov/scitech/methods/cwa/bioindicators/upload/2007_07_10_methods_method_200_8.pdf
Fang, M., Wang, K., Lu, H., Yang, Y., and Nutt, S. (2009). Covalent polymer functionalization of graphene nanosheets and mechanical properties of composites. J. Mater. Chem. 19, 7098–7105. doi:10.1039/b908220d
Fifield, F. W., and Kealey, D. (2000). Principles and Practice of Analytical Chemistry. Oxford: Blackwell Science Ltd.
Gee, C. M., Tseng, C. C., Wu, F. Y., Chang, H. P., Li, L. J., Hsieh, Y. P., et al. (2013). Flexible transparent electrodes made of electrochemically exfoliated graphene sheets from low-cost graphite pieces. Displays 34, 315–319. doi:10.1016/j.displa.2012.11.002
Giannetto, M., Mori, G., Terzi, F., Zanardi, C., and Seeber, R. (2011). Composite PEDOT/Au nanoparticles modified electrodes for determination of mercury at trace levels by anodic stripping voltammetry. Electroanalysis 23, 456–462. doi:10.1002/elan.201000469
Gustafsson-Carlberg, J. C., Inganäs, O., Andersson, M. R., Booth, C., Azens, A., and Granqvist, C. G. (1995). Tuning the bandgap for polymeric smart windows and displays. Electrochim. Acta 40, 2233–2235. doi:10.1016/0013-4686(95)00169-F
Hill, E. W., Vijayaragahvan, A., and Novoselov, K. (2011). Graphene sensors. Sens. J. IEEE 11, 3161–3170. doi:10.1109/JSEN.2011.2167608
Istamboulie, G., Sikora, T., Jubete, E., Ochoteco, E., Marty, J.-L., and Noguer, T. (2010). Screen-printed poly(3,4-ethylenedioxythiophene) (PEDOT): a new electrochemical mediator for acetylcholinesterase-based biosensors. Talanta 82, 957–961. doi:10.1016/j.talanta.2010.05.070
Pubmed Abstract | Pubmed Full Text | CrossRef Full Text | Google Scholar
Jayasena, B., and Subbiah, S. (2011). A novel mechanical cleavage method for synthesizing few-layer graphenes. Nanoscale Res. Lett. 6, 95. doi:10.1186/1556-276X-6-95
Pubmed Abstract | Pubmed Full Text | CrossRef Full Text | Google Scholar
Kadarkaraisamy, M., Thammavongkeo, S., Basa, P. N., Caple, G., and Sykes, A. G. (2011). Substitution of thiophene oligomers with macrocyclic end caps and the colorimetric detection of Hg(II). Org. Lett. 13, 2364–2367. doi:10.1021/ol200442k
Pubmed Abstract | Pubmed Full Text | CrossRef Full Text | Google Scholar
Krauss, B., Lohmann, T., Chae, D. H., Haluska, M., Von Klitzing, K., and Smet, J. H. (2009). Laser-induced disassembly of a graphene single crystal into a nanocrystalline network. Phys. Rev. B 79, 165428. doi:10.1103/Physrevb.79.165428
Kumar, S. A., Cheng, H.-W., Chen, S.-M., and Wang, S.-F. (2010). Preparation and characterization of copper nanoparticles/zinc oxide composite modified electrode and its application to glucose sensing. Mater. Sci. Eng. C 30, 86–91. doi:10.1016/j.msec.2009.09.001
Lee, K. H., Lee, B., Hwang, S.-J., Lee, J.-U., Cheong, H., Kwon, O.-S., et al. (2014). Large scale production of highly conductive reduced graphene oxide sheets by a solvent-free low temperature reduction. Carbon N. Y. 69, 327–335. doi:10.1016/j.carbon.2013.12.031
Li, D., Muller, M. B., Gilje, S., Kaner, R. B., and Wallace, G. G. (2008). Processable aqueous dispersions of graphene nanosheets. Nat. Nanotechnol. 3, 101–105. doi:10.1038/nnano.2007.451
Pubmed Abstract | Pubmed Full Text | CrossRef Full Text | Google Scholar
Li, Y.-F., Chen, S.-M., Lai, W.-H., Sheng, Y.-J., and Tsao, H.-K. (2013). Superhydrophilic graphite surfaces and water-dispersible graphite colloids by electrochemical exfoliation. J. Chem. Phys. 139, 64703–64714. doi:10.1063/1.4817680
Pubmed Abstract | Pubmed Full Text | CrossRef Full Text | Google Scholar
Liu, D., Qu, W., Chen, W., Zhang, W., Wang, Z., and Jiang, X. (2010). Highly sensitive, colorimetric detection of mercury(II) in aqueous media by quaternary ammonium group-capped gold nanoparticles at room temperature. Anal. Chem. 82, 9606–9610. doi:10.1021/ac1021503
Pubmed Abstract | Pubmed Full Text | CrossRef Full Text | Google Scholar
Low, C. T. J., Walsh, F. C., Chakrabarti, M. H., Hashim, M. A., and Hussain, M. A. (2013). Electrochemical approaches to the production of graphene flakes and their potential applications. Carbon N. Y. 54, 1–21. doi:10.1016/j.carbon.2012.11.030
Mandal, S., Banerjee, A., Lohar, S., Chattopadhyay, A., Sarkar, B., Mukhopadhyay, S. K., et al. (2013). Selective sensing of Hg2+ using rhodamine–thiophene conjugate: red light emission and visual detection of intracellular Hg2+ at nanomolar level. J. Hazard. Mater. 261, 198–205. doi:10.1016/j.jhazmat.2013.07.026
Pubmed Abstract | Pubmed Full Text | CrossRef Full Text | Google Scholar
Mao, M., Wang, M., Hu, J., Lei, G., Chen, S., and Liu, H. (2013). Simultaneous electrochemical synthesis of few-layer graphene flakes on both electrodes in protic ionic liquids. Chem. Commun. (Camb) 49, 5301–5303. doi:10.1039/c3cc41909f
Pubmed Abstract | Pubmed Full Text | CrossRef Full Text | Google Scholar
Martin-Yerga, D., Gonzalez-Garcia, M. B., and Costa-Garcia, A. (2013). Electrochemical determination of mercury: a review. Talanta 116, 1091–1104. doi:10.1016/j.talanta.2013.07.056
Pubmed Abstract | Pubmed Full Text | CrossRef Full Text | Google Scholar
Mikolaj, D., and Zbigniew, S. (2012). “Nanoparticles and Nanostructured Materials Used in Modification of Electrode Surfaces,” in Functional Nanoparticles for Bioanalysis, Nanomedicine, and Bioelectronic Devices, Vol. 1. Washington: American Chemical Society, 313–325. doi:10.1021/bk-2012-1112.ch012
Morales, G. M., Schifani, P., Ellis, G., Ballesteros, C., Martínez, G., Barbero, C., et al. (2011). High-quality few layer graphene produced by electrochemical intercalation and microwave-assisted expansion of graphite. Carbon N. Y. 49, 2809–2816. doi:10.1016/j.carbon.2011.03.008
Najafi, E., Aboufazeli, F., Zhad, H. R., Sadeghi, O., and Amani, V. (2013). A novel magnetic ion imprinted nano-polymer for selective separation and determination of low levels of mercury(II) ions in fish samples. Food Chem. 141, 4040–4045. doi:10.1016/j.foodchem.2013.06.118
Pubmed Abstract | Pubmed Full Text | CrossRef Full Text | Google Scholar
Orlik, M., and Galus, Z. (2007). “Electrochemistry of mercury,” in Encyclopedia of Electrochemistry, Vol. 7 (New York: Wiley-VCH Verlag GmbH & Co. KGaA), 958–991. doi:10.1002/9783527610426.bard072406
Park, S., An, J., Potts, J. R., Velamakanni, A., Murali, S., and Ruoff, R. S. (2011). Hydrazine-reduction of graphite- and graphene oxide. Carbon N. Y. 49, 3019–3023. doi:10.1016/j.carbon.2011.02.071
Pesavento, M., Alberti, G., and Biesuz, R. (2009). Analytical methods for determination of free metal ion concentration, labile species fraction and metal complexation capacity of environmental waters: a review. Anal. Chim. Acta 631, 129–141. doi:10.1016/j.aca.2008.10.046
Pubmed Abstract | Pubmed Full Text | CrossRef Full Text | Google Scholar
Pettersson, L. A. A., Johansson, T., Carlsson, F., Arwin, H., and Inganäs, O. (1999). Anisotropic optical properties of doped poly(3,4-ethylenedioxythiophene). Synth. Met. 101, 198–199. doi:10.1016/S0379-6779(98)01215-6
Pubmed Abstract | Pubmed Full Text | CrossRef Full Text | Google Scholar
Pham, V. H., Cuong, T. V., Hur, S. H., Oh, E., Kim, E. J., Shin, E. W., et al. (2011). Chemical functionalization of graphene sheets by solvothermal reduction of a graphene oxide suspension in N-methyl-2-pyrrolidone. J. Mater. Chem. 21, 3371–3377. doi:10.1039/c0jm02790a
Pillay, K., Cukrowska, E. M., and Coville, N. J. (2013). Improved uptake of mercury by sulphur-containing carbon nanotubes. Microchem. J. 108, 124–130. doi:10.1016/j.microc.2012.10.014
Qi, B., He, L., Bo, X. J., Yang, H. J., and Guo, L. P. (2011). Electrochemical preparation of free-standing few-layer graphene through oxidation-reduction cycling. Chem. Eng. J. 171, 340–344. doi:10.1016/j.cej.2011.03.078
Rattan, S., Singhal, P., and Verma, A. L. (2013). Synthesis of PEDOT:PSS (poly(3,4-ethylenedioxythiophene))/poly(4-styrene sulfonate))/ngps (nanographitic platelets) nanocomposites as chemiresistive sensors for detection of nitroaromatics. Polym. Eng. Sci. 53, 2045–2052. doi:10.1002/pen.23466
Seco-Reigosa, N., Cutillas-Barreiro, L., Nóvoa-Muñoz, J. C., Arias-Estévez, M., Fernández-Sanjurjo, M., Álvarez-Rodríguez, E., et al. (2014). Mixtures including wastes from the mussel shell processing industry: retention of arsenic, chromium and mercury. J. Clean. Prod. 84, 680–690. doi:10.1016/j.jclepro.2014.01.050
Shao, Y., Wang, J., Wu, H., Liu, J., Aksay, I. A., and Lin, Y. (2010). Graphene based electrochemical sensors and biosensors: a review. Electroanalysis 22, 1027–1036. doi:10.1002/elan.200900571
Shrivastava, A., and Gupta, V. (2011). Methods for the determination of limit of detection and limit of quantitation of the analytical methods. Chron. Young Sci. 2, 21–25. doi:10.4103/2229-5186.79345
Singh, V. V., Gupta, G., Batra, A., Nigam, A. K., Boopathi, M., Gutch, P. K., et al. (2012). Greener electrochemical synthesis of high quality graphene nanosheets directly from pencil and its spr sensing application. Adv. Funct. Mater. 22, 2352–2362. doi:10.1002/adfm.201102525
Somerset, V., Leaner, J., Mason, R., Iwuoha, E., and Morrin, A. (2010). Development and application of a poly(2,2’-dithiodianiline) (PDTDA)-coated screen-printed carbon electrode in inorganic mercury determination. Electrochim. Acta 55, 4240–4246. doi:10.1016/j.electacta.2009.01.029
Su, C. Y., Lu, A. Y., Xu, Y., Chen, F. R., Khlobystov, A. N., and Li, L. J. (2011). High-quality thin graphene films from fast electrochemical exfoliation. ACS Nano 5, 2332–2339. doi:10.1021/nn200025p
Pubmed Abstract | Pubmed Full Text | CrossRef Full Text | Google Scholar
Sundramoorthy, A. K., and Gunasekaran, S. (2014). Applications of graphene in quality assurance and safety of food. Trends Anal Chem 60, 36–53. doi:10.1016/j.trac.2014.04.015
Tarabella, G., Nanda, G., Villani, M., Coppede, N., Mosca, R., Malliaras, G. G., et al. (2012). Organic electrochemical transistors monitoring micelle formation. Chem Sci 3, 3432–3435. doi:10.1039/c2sc21020g
Vacca, P., Petrosino, M., Miscioscia, R., Nenna, G., Minarini, C., Della Sala, D., et al. (2008). Poly(3,4-ethylenedioxythiophene):poly(4-styrenesulfonate) ratio: structural, physical and hole injection properties in organic light emitting diodes. Thin Solid Films 516, 4232–4237. doi:10.1016/j.tsf.2007.12.143
Wang, J. Z., Manga, K. K., Bao, Q. L., and Loh, K. P. (2011). High-yield synthesis of few-layer graphene flakes through electrochemical expansion of graphite in propylene carbonate electrolyte. J. Am. Chem. Soc. 133, 8888–8891. doi:10.1021/ja203725d
Pubmed Abstract | Pubmed Full Text | CrossRef Full Text | Google Scholar
Wang, L., Fang, G., Ye, D., and Cao, D. (2014a). Carbazole and triazole-containing conjugated polymer as a visual and fluorometric probe for iodide and mercury. Sens Actuators B Chem 195, 572–580. doi:10.1016/j.snb.2014.01.081
Wang, Z., Xu, J., Yao, Y., Zhang, L., Wen, Y., Song, H., et al. (2014b). Facile preparation of highly water-stable and flexible PEDOT:PSS organic/inorganic composite materials and their application in electrochemical sensors. Sens Actuators B Chem 196, 357–369. doi:10.1016/j.snb.2014.02.035
Wang, Z.-L., Xu, D., Huang, Y., Wu, Z., Wang, L.-M., and Zhang, X.-B. (2012). Facile, mild and fast thermal-decomposition reduction of graphene oxide in air and its application in high-performance lithium batteries. Chem. Commun. 48, 976–978. doi:10.1039/c2cc16239c
Pubmed Abstract | Pubmed Full Text | CrossRef Full Text | Google Scholar
Welch, C. M., Nekrassova, O., Dai, X., Hyde, M. E., and Compton, R. G. (2004). Fabrication, characterisation and voltammetric studies of gold amalgam nanoparticle modified electrodes. Chemphyschem 5, 1405–1410. doi:10.1002/cphc.200400263
Pubmed Abstract | Pubmed Full Text | CrossRef Full Text | Google Scholar
Yan, K., Peng, H., Zhou, Y., Li, H., and Liu, Z. (2011). Formation of bilayer Bernal graphene: layer-by-layer epitaxy via chemical vapor deposition. Nano Lett. 11, 1106–1110. doi:10.1021/nl104000b
Pubmed Abstract | Pubmed Full Text | CrossRef Full Text | Google Scholar
Yang, J., and Gunasekaran, S. (2013). Electrochemically reduced graphene oxide sheets for use in high performance supercapacitors. Carbon N. Y. 51, 36–44. doi:10.1016/j.carbon.2012.08.003
Yang, J., Yu, J.-H., Rudi Strickler, J., Chang, W.-J., and Gunasekaran, S. (2013). Nickel nanoparticle–chitosan-reduced graphene oxide-modified screen-printed electrodes for enzyme-free glucose sensing in portable microfluidic devices. Biosens Bioelectron 47, 530–538. doi:10.1016/j.bios.2013.03.051
Pubmed Abstract | Pubmed Full Text | CrossRef Full Text | Google Scholar
Yasri, N. G., Halabi, A. J., Istamboulie, G., and Noguer, T. (2011). Chronoamperometric determination of lead ions using PEDOT:PSS modified carbon electrodes. Talanta 85, 2528–2533. doi:10.1016/j.talanta.2011.08.013
Pubmed Abstract | Pubmed Full Text | CrossRef Full Text | Google Scholar
Yoo, D., Kim, J., and Kim, J. (2014). Direct synthesis of highly conductive poly(3,4-ethylenedioxythiophene):poly(4-styrenesulfonate) (PEDOT:PSS)/graphene composites and their applications in energy harvesting systems. Nano Res. 7, 717–730. doi:10.1007/s12274-014-0433-z
Zhang, L., Li, X., Huang, Y., Ma, Y., Wan, X., and Chen, Y. (2010). Controlled synthesis of few-layered graphene sheets on a large scale using chemical exfoliation. Carbon N. Y. 48, 2367–2371. doi:10.1016/j.carbon.2010.02.035
Zhang, W. Y., Zeng, Y., Xiao, N., Hng, H. H., and Yan, Q. Y. (2012). One-step electrochemical preparation of graphene-based heterostructures for Li storage. J. Mater. Chem. 22, 8455–8461. doi:10.1039/c2jm16315b
Zhong, Y. L., and Swager, T. M. (2012). Enhanced electrochemical expansion of graphite for in situ electrochemical functionalization. J. Am. Chem. Soc. 134, 17896–17899. doi:10.1021/ja309023f
Pubmed Abstract | Pubmed Full Text | CrossRef Full Text | Google Scholar
Keywords: graphene flakes, mercury determination, PEDOT:PSS-modified electrode, heavy metal analysis, electrochemical exfoliation
Citation: Yasri NG, Sundramoorthy AK, Chang W-J and Gunasekaran S (2014) Highly selective mercury detection at partially oxidized graphene/poly(3,4-ethylenedioxythiophene):poly(styrenesulfonate) nanocomposite film-modified electrode. Front. Mater. 1:33. doi: 10.3389/fmats.2014.00033
Received: 27 September 2014; Accepted: 03 December 2014;
Published online: 22 December 2014.
Edited by:
Emilia Morallon, Universidad de Alicante, SpainReviewed by:
Santosh Kumar Yadav, Drexel University, USACesar Alfredo Barbero, Universidad Nacional de Rio Cuarto, Argentina
Copyright: © 2014 Yasri, Sundramoorthy, Chang and Gunasekaran. This is an open-access article distributed under the terms of the Creative Commons Attribution License (CC BY). The use, distribution or reproduction in other forums is permitted, provided the original author(s) or licensor are credited and that the original publication in this journal is cited, in accordance with accepted academic practice. No use, distribution or reproduction is permitted which does not comply with these terms.
*Correspondence: Ashok K. Sundramoorthy and Sundaram Gunasekaran, Department of Biological Systems Engineering, University of Wisconsin-Madison, 460 Henry Mall, Madison, WI 53706, USA e-mail: sundramoorth@wisc.edu, ashok.research@outlook.com; guna@wisc.edu;
Woo-Jin Chang, Department of Mechanical Engineering, University of Wisconsin-Milwaukee, 3200 N. Cramer Street, Milwaukee, WI 53211, USA e-mail: wjchang@uwm.edu
†Nael G. Yasri and Ashok K. Sundramoorthy have contributed equally to this work.