In situ observation of nucleated polymer crystallization in polyoxymethylene sandwich composites
 Miroslav Slouf
 Sabina Krejcikova1
 Tatana Vackova
 Libor Novak
- 1Institute of Macromolecular Chemistry, Academy of Sciences of the Czech Republic, Prague, Czech Republic
- 2FEI Czech Republic, Brno, Czech Republic
We introduce a dynamic sandwich method, which can be used for in situ observation and quantification of polymer crystallization nucleated by micro/nanoparticles. The method was applied on polyoxymethylene (POM) composites with three nucleating agents: talc micropowder (POM/mTalc), chalk nanopowder (POM/nChalk), and titanate nanotubes (POM/TiNT). The nucleating agents were deposited between polymer films, the resulting sandwich samples were consolidated by thermal treatment, and their microtomed cross-sections were observed during isothermal crystallization by polarized light microscopy (PLM). As the intensity of polarized light was shown to be proportional to the relative crystallinity, the PLM results could be fitted to Avrami equation and the nucleating activity of all investigated particles could be quantified by means of Avrami parameters (n, k). The crystallization half-times increased reproducibly in the following order: POM/nChalk < POM/mTalc < POM/TiNT ~ POM. For strong nucleating agents (mTalc, nChalk), the crystallization kinetics corresponded to spontaneous crystallization starting from central nucleating layer, which was verified by computer simulations. The results were also confirmed by differential scanning calorimetry. We concluded that the sandwich method is an efficient microscopic technique for detailed evaluation of nucleating activity of arbitrary micro/nanoparticles in polymer systems.
Introduction
Polyoxymethylene (POM) is a semicrystalline synthetic polymer, which ranges among important engineering thermoplastic materials (Sinker, 1985). It is used for production of precise components requiring high stiffness, high dimensional stability, and low friction (Sinker, 1990). Under standard conditions, the polymer melts around 190°C, crystallizes in spherulitic morphology; the spherulites are well visible in the polarized light microscope (average spherulite size is usually (1 μm), and crystallinity ranges within 60–80% (Sinker, 1985, 1990; Muck, 1999). There are two crystal modifications: the stable trigonal (t-POM) and the metastable orthorhombic (o-POM) form. On heating, o-POM transforms irreversibly to t-POM at 69°C, which is accompanied with an endotherm transition of 0.6 kJ/mol per OCH2 unit (Kobayashi, 1992).
Due to the semicrystalline character of POM, its processing parameters and final performance can be fine-tuned by adding nucleating agents (nucleants). The nucleating agents facilitate formation of crystal nuclei in a semicrystalline polymer melt. This increases number of nucleation sites, decreases the average size of polymer spherulites, and shortens the solidification of the polymer during processing. Moreover, the nucleating agents may improve properties (modulus, impact strength, clarity, transparency, etc.) (Masirek et al., 2010; Zhao and Ye, 2011; Jiang et al., 2012). Numerous compounds have been demonstrated to nucleate POM crystallization: talc [silicate mineral, Mg3Si4O10(OH)2; (Nowacki and Piorkowska, 2007)], chalk [calcium carbonate, CaCO3; (Shu et al., 2006; Nowacki and Piorkowska, 2007)], and sorbitol derivatives [sorbitol = sugar alcohol, C6H14O6; (Shu et al., 2006)]. Nucleation of POM crystallization was observed in POM blends with polytetrafluoroethylene (Bernland and Smith, 2009; Masirek and Piorkowska, 2010), poly (vinylidene fluoride) (Ding et al., 2007), and polyamides (Hu and Ye, 2005). Nucleation effects were reported also in POM composites with multi-wall carbon nanotubes (Yao et al., 2009; Zhao and Ye, 2011) or various minerals (montmorillonite, atapulgite, diatomite) (Xu and He, 2001; Sun et al., 2007). In the great majority of the studies mentioned above, the POM/nucleants systems were prepared in macroscopic scale, usually by melt mixing. Consequently, the efficiency of different nucleating agents is difficult to compare, as the number of nucleation sites is strongly influenced by dispersion and agglomeration of the nucleating agent micro/nanoparticles during the processing.
In this work, we introduce a microscopic technique, called sandwich method, for direct qualitative and quantitative comparison of nucleating activity of various nucleants in semicrystalline polymers. The samples for sandwich method consist of two thin polymer films (thickness ~100 μm) with a thin, homogeneous layer of nucleating agent (thickness ~2 μm) between them. The cross-section of the sandwich, containing the central nucleating agent layer, is observed in polarized light microscope during isothermal crystallization. We compare nucleating activity of three inorganic compounds: talc, chalk, and titanate nanotubes (TiNT). Talc and chalk are known, strong nucleating agents for POM (Shu et al., 2006; Nowacki and Piorkowska, 2007), while TiNT are new, laboratory-synthesized nanoparticles (Kralova et al., 2010), which exhibited certain nucleating activity in radiation-modified polypropylene (Mikešová et al., 2013). We show that the sandwich method is reliable and reproducible if the samples are prepared carefully. The advantages of the new method in comparison with other approaches, such as well-defined preparation of microscopic samples, elimination of nucleating particles agglomeration, very low consumption of the polymer and nucleating agent for sample preparation, and direct visualization of the crystallization process, are discussed.
Materials and Methods
Materials
Polyoxymethylene, type Ultraform N2320 003 (BASF, Germany) was used: 50 cm3 of POM granules were melt mixed (Brabender Plasti-Corder PLE 651; mixing at 200°C, 10 min, and 60 rpm) and compression molded (hydraulic press Fontijne Holand; 210°C for 4 min) into a 4 mm thick plate, from which all sandwich samples were prepared. TiNT were prepared according to our previous work (Kralova et al., 2010; Mikešová et al., 2013) with initial concentration 3 g TiO2 in 100 g 10M NaOH. Talc microparticles (mTalc; type Steamic 00S, fineness ≤10 μm) were bought from Talc de Luzenac, France. Calcium carbonate nanoparticles (nChalk; purity 97.5%, 15–40 nm), were obtained from Sky Spring Nanomaterials, Inc., USA.
Preparation of Sandwich Composites
In the first step of sandwich composites preparation (Figure 1, left), the suspension of the nucleant was deposited between two thin POM films. The polymer films were prepared by microtomy (rotary microtome RM 2155, Leica; cut section 4 mm × 4 mm × 0.2 mm) followed by pressing on the hot stage (Kofler bench: 2 min at 220°C between two glasses with load 500 g, 100 μm aluminum foils were placed between the glasses to set required thickness; the glasses and the aluminum foils were pre-heated in an oven at 225°C). The nucleant layer was deposited using suspensions (TiNT in water; mTalc and nChalk in acetone; concentration of all nucleants 0.6 wt-%). Each suspension was shaken vigorously, before 10 μL of it was deposited onto the POM film. Morphology of the nucleant particles and their films on the POM films is given in Figure 2: high-magnification TEM micrographs (Figures 2A–C) show the size and shape of individual particles, while low-magnification SEM micrographs (Figures 2D–F) illustrate the homogeneity and compactness of the film on the polymer surface.
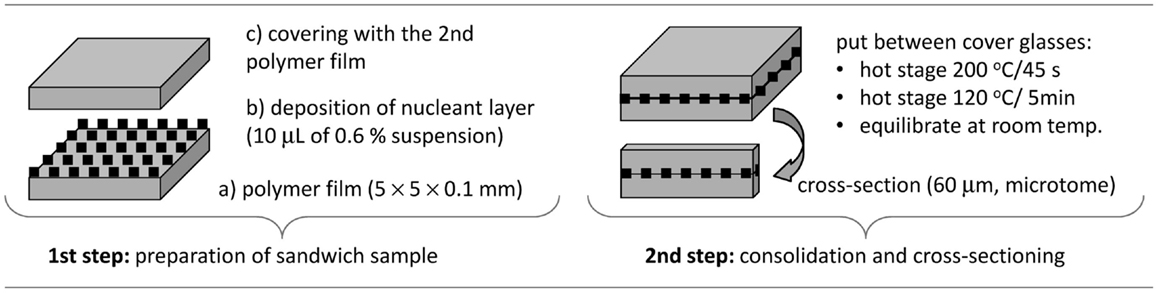
Figure 1. Scheme of sandwich composite preparation.
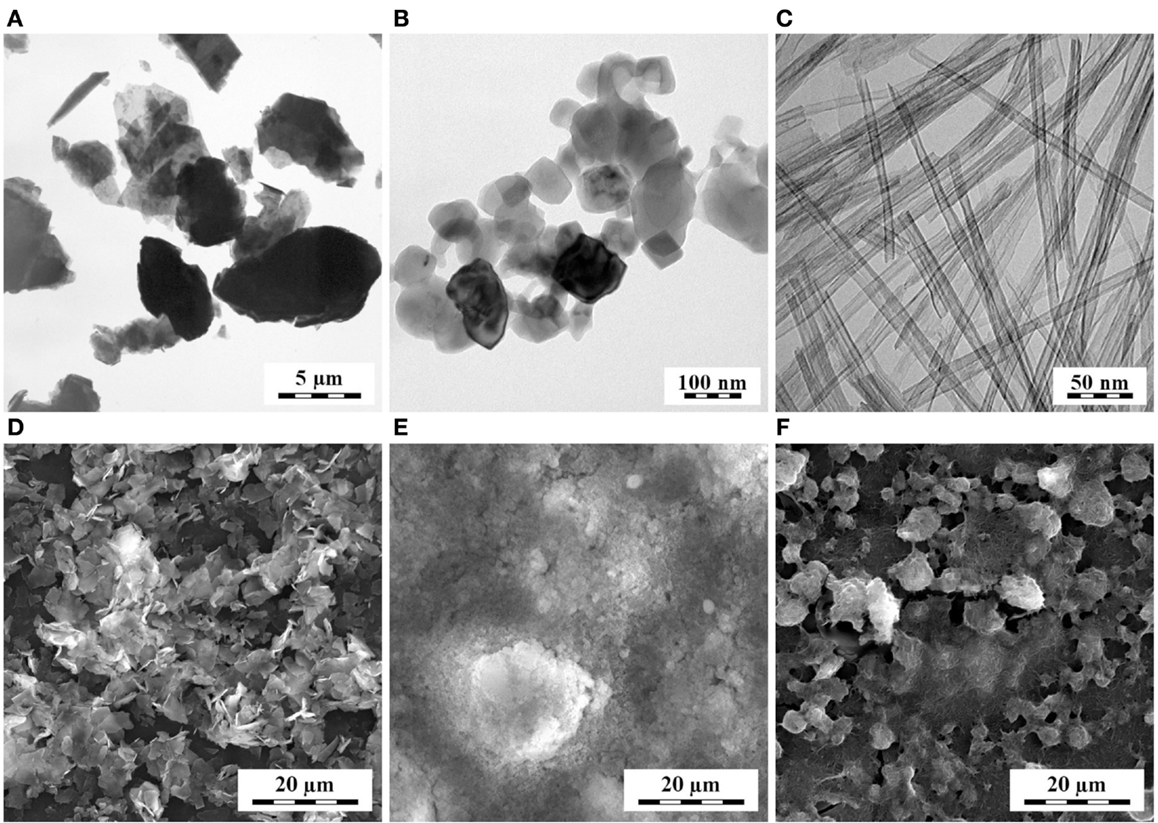
Figure 2. Morphology of talc microparticles (A,D), chalk nanoparticles (B,E), and titanate nanotubes (C,F): TEM micrographs of individual particles (A–C) and SEM micrographs of their layers on polymer films (D–F).
In the second step (Figure 1, right), the sandwich was consolidated at elevated temperature (Kofler bench: sandwich sample between two glasses without load, 200°C for 1 min and then 120°C for 30 min) and cross-sectioned using a microtome (rotary microtome with a glass knife; thickness of the cross-sections 60 μm). The thin sandwich cross-sections were denoted as POM/0 (empty sandwich, control), POM/TiNT, POM/mTalc, and POM/nChalk (sandwiches with a given nucleating agent). These final sandwich samples were studied by polarized light microscopy (PLM).
Isothermal Crystallization in Polarized Light Microscope
Isothermal crystallization of sandwich composites, whose preparation is described in the previous section, was investigated by PLM: a sandwich sample was put between two glasses (circular shape, diameter 12 mm, thickness 140 μm) and placed into a microscopic heating stage (THMS 600/TMS 9; Linkam, UK), which was connected with a light microscope (Nikon Eclipse 80i; Nikon, Japan) equipped with a digital camera (ProgRes CT3; Jenoptik, Germany). The samples were molten (heated at 20°C/min and held at 180°C for 5 min), isothermally crystallized (cooled at 80°C/min and held at 151°C till the end of crystallization), and observed in polarized light. The microscope was controlled by program NIS Elements 4.0 (Laboratory imaging, Czech Republic) so that the PLM micrographs were recorded during the whole crystallization process in regular intervals (4–10 s). Each set of micrographs was saved in a single multi-image file (ND2 format of NIS Elements software) and processed semi-automatically as described in the next section.
Quantitative Evaluation of Polarized Light Micrographs
Quantitative evaluation of polarized light micrographs was aimed at evaluation of crystallization kinetics and, consequently, nucleating activity of the tested particles. The scheme of the data processing is shown in Figure 3. In the first step, we went through investigated series of PLM micrographs and selected a region (200 μm × 200 μm), which contained nucleating agent layer (Figure 3, lower row). In the second step, we determined relative crystallinity, X(t), on each micrograph of the set by means of image analysis using program NIS Elements 4.0. The crystallinity could be determined either from the area of the spherulites (morphological descriptor AreaFraction; method named by us PLM/AF) or from the average intensity of polarized light (morphological descriptor MeanIntensity; method named PLM/INT). The morphological descriptors AreaFraction and MeanIntensity are described in the NIS Elements manual (NiS-Elements, 2012). The results achieved by the two methods are identical within experimental error (Figure 3: compare black and gray points on the plot). In the third step, the experimental values of X(t) were fitted to Avrami equation:
where n and k are Avrami parameters related to type and rate of crystallization, respectively (Sperling, 1992). The fitting was performed with a user-defined script in program Gnuplot (www.gnuplot.info), within range given by t(ind) and t(max); t(ind) was set at the time when the crystallization started, because t(ind) is the time necessary for the onset of nucleation once the subcooled state has been attained according to Lednický and Muchová (1993); t(max) was set so that it corresponded X(t) ≤ 0.35–0.50. The main reason why we fitted the data with X(t) < 0.50 consisted in the fact that the overall crystallization process in sandwich composites could be divided in two parts: during the first, faster part the crystallization started on the nucleant layer, while during the second, slower part the crystallization continued in the surrounding polymer matrix – this is why the experimental values in the second part of crystallization (X(t) > 0.50) are below the Avrami fit (Figure 3). The secondary reason why the fit is better for the first part of the data X(t) < 0.50 was shown by Lorenzo et al. (2007): the Avrami theory works best for the initial phase of crystallization.
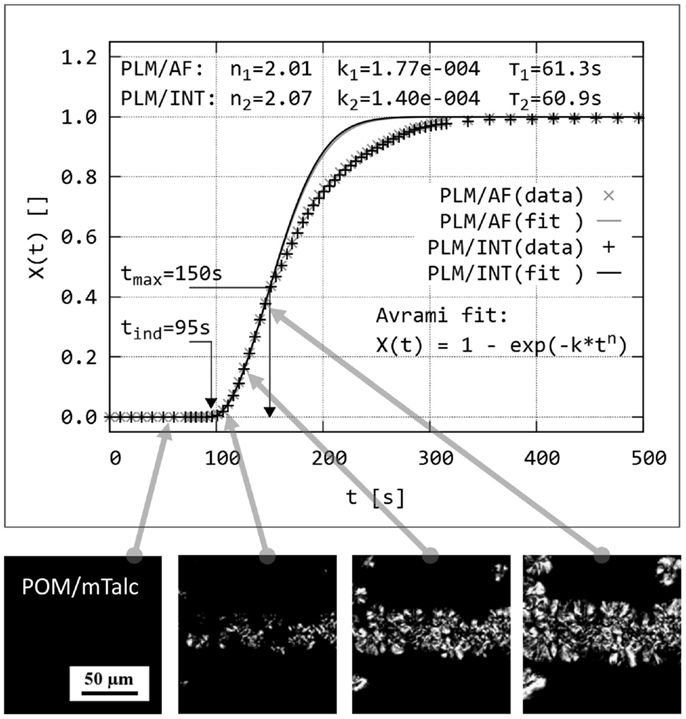
Figure 3. Principle of dynamic sandwich method: Isothermal crystallization in a sandwich cross-section is observed in situ by polarized light microscopy (series of PLM micrographs at the bottom of the figure). Relative crystallinity, X(t), is determined either from the area of the spherulites (PLM/AF method) or from the normalized intensity of the polarized light in the whole image (PLM/INT method). The data are plotted and fitted with Avrami equation; each data point corresponds to one PLM micrograph (real width of the PLM micrographs corresponds to ~150 μm; scale bar in the leftmost image applies to all other images in of this figure).
In addition to Avrami parameters [n and k in Eq. (1)], we calculated another two parameters of crystallization kinetics, K and τ using Eqs (2) and (3), respectively:
where K is an overall rate constant (proportional to crystallization rate regardless of n) and τ is a crystallization half-time (the time at which X(t) = 0.5). For each sample, >10 independent measurements were made and the values from Avrami fitting (n, k, K, τ) were averaged. The two-sample t-tests (unpaired, unequal variance t-test, 95% level of significance) were calculated to verify if the variations in crystallization kinetics among the tested samples are significantly different; description and examples of two-sample t-tests can be found in numerous textbooks (Urdan, 2010) and also in our previous studies (Vacková et al., 2011; Slouf et al., 2012).
Simulation of Spherulitic Crystallization in Sandwich Nanocomposites
Spherulitic crystallization in sandwich composites was simulated by our own program SCRYST. The input parameters for the program are: (i) sample geometry (x, y, z dimensions of the sample), (ii) nucleant layer geometry (position and thickness of the nucleant layer), (iii) spherulite growth rate (in micrometer per second), (iv) time interval, during which nucleation occurs, (v) primary nucleation probability in the polymer matrix (defined as the probability that a spherulite will start to grow in given volume element – voxel with dimensions 1 μm × 1 μm × 1 μm – within 1 s), and (vi) primary nucleation probability in the nucleant layer. The first four parameters are known or measurable from PLM micrographs. Primary nucleation probability in the polymer matrix (parameter 5) can be estimated from the average number of spherulites in PLM micrographs. Primary nucleation probability in the nucleant layer (parameter 6) cannot be obtained from the experiment (too small spherulites), but can be fitted to the experimental crystallization half-times (Eq. 3). Nucleating activity of the investigated nucleant is defined as a ratio of primary nucleation probability in the nucleant layer and primary nucleation probability in the polymer matrix, i.e., the nucleating activity is a number which says how many times the nucleant increases the primary nucleation probability with respect to polymer matrix.
Program SCRYST uses advanced random number generator to place spherulites in the simulated volume, taking into account all input parameters described above, and optionally also growth of spherulites from outer volume and melting/broadening of the nucleant layer. The program produces three types of output: (a) simulated polarized light micrographs showing spherulitic growth, (b) relative crystallinities X(t), and (c) Avrami parameters (n, k, K, τ) obtained by automated fitting of the simulated crystallization curves. The program is freeware, available on request to the first author of this work (together with detailed documentation and sample calculations).
Differential Scanning Calorimetry
The differential scanning calorimetry (DSC) was used to verify results from PLM. Samples for DSC were three-layer sandwiches (Figure 4), in which the nucleant/polymer ratio was increased in order to get stronger nucleation effect in 3D, as explained in our previous work on isotactic polypropylene (Slouf et al., 2012). Fifty micrometer films of POM were prepared in the same way as the 100 μm films for PLM (see Preparation of Sandwich Composites), only the aluminum foils were 50 μm thick. The 6 mm circles were made by cutting. The layer of the nucleant particles was prepared like in the sandwiches for PLM, but 3× higher amount of the nucleant than for PLM was used (three subsequent depositions of 10 μL of the suspension). The DSC experiments were carried out using a Perkin-Elmer 8500 DSC apparatus. Cyclohexane, indium, and n-hexatriacontane were used for calibration. The instrument was naturally cooled and flushed with nitrogen as a purge gas. Samples of 5–10 mg were quickly heated from 50 to 200°C, left there for 5 min, quenched to 152°C, and left there for necessary period for complete development of the crystallization exotherm. The isothermal crystallization kinetics was evaluated using the Avrami approach (Eqs 1–3 above).
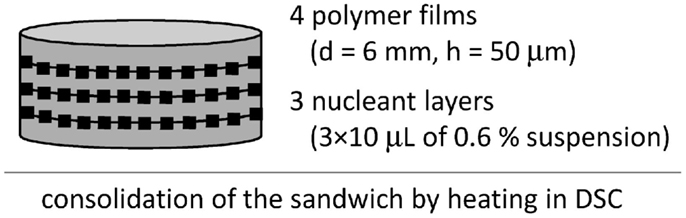
Figure 4. Preparation of three-layer sandwich for study of nucleating activity by DSC.
In situ Scanning Electron Microscopy
An in situ scanning electron microscope (SEM) makes it possible to observe samples at both elevated temperatures (usually up to 1000°C or slightly more) and pressures (usually up to 1 kPa). In this work, we used a SEM microscope FEI Quanta FEG 650 (FEI, Czech Republic), which had a low vacuum mode (pressures up to 4 kPa) and customized heating stage (temperatures up to 1000°C). The samples for the microscopes were simple thin POM films (100 μm) on silicon support. Selected parts of the film surface were covered with the nucleating agents. The samples were heated/cooled inside the microscope, while the free surface crystallization/melting was observed by means of a customized secondary electrons detector at 10 kV.
Results
Polarized Light Microscopy
This work was focused on study of crystallization kinetics in small sandwich composite samples (Figure 1) using in situ PLM (Figure 3). Typical PLM micrographs illustrating isothermal crystallization in sandwich composites are shown in Figure 5. In empty sandwiches (POM/0; Figures 5A–E), the spherulites grew randomly in the whole volume of the sample. The nucleation was semi-instantaneous, i.e., the nucleation appeared within the first 20–30 s, and then the crystallinity increased only due to growth of existing spherulites. This was also documented in the micrographs – most of the spherulites were formed within the first 20 s (Figure 5A), and after 50 s (Figure 5B) no new spherulites appeared (Figures 5C–E; from the start of the crystallization the micrographs were recorded with step Δt = 4 s, but only a few selected times/images are shown in Figure 5). It is worth reminding that the two limiting cases of spherulitic crystallization are instantaneous nucleation (all nuclei/spherulite centers appear at the same time, t = 0 s) and spontaneous nucleation (nucleation during the whole crystallization process; this is also called sporadic nucleation) (Sperling, 1992; Piorkowska et al., 2005). The sandwiches with a strong nucleating agent, such as microparticles of talc (POM/mTalc; Figures 5F–O) showed clear difference between the strong instantaneous nucleation within the central nucleant layer and much weaker, sporadic semi-instantaneous nucleation in the surrounding polymer matrix. In a few cases the nucleant layer remained relatively thin and compact (Figures 5F–J), but more often the nucleant layer was broadened due to initial re-melting of the sandwich before the isothermal crystallization in the PLM microscope (Figures 5K–O). The two examples of strong nucleation (Figures 5F–J vs. Figures 5K–O) are the limiting cases – in most experiments the nucleant layer thickness was between these two extremes (such as the experiment shown in Figure 3).
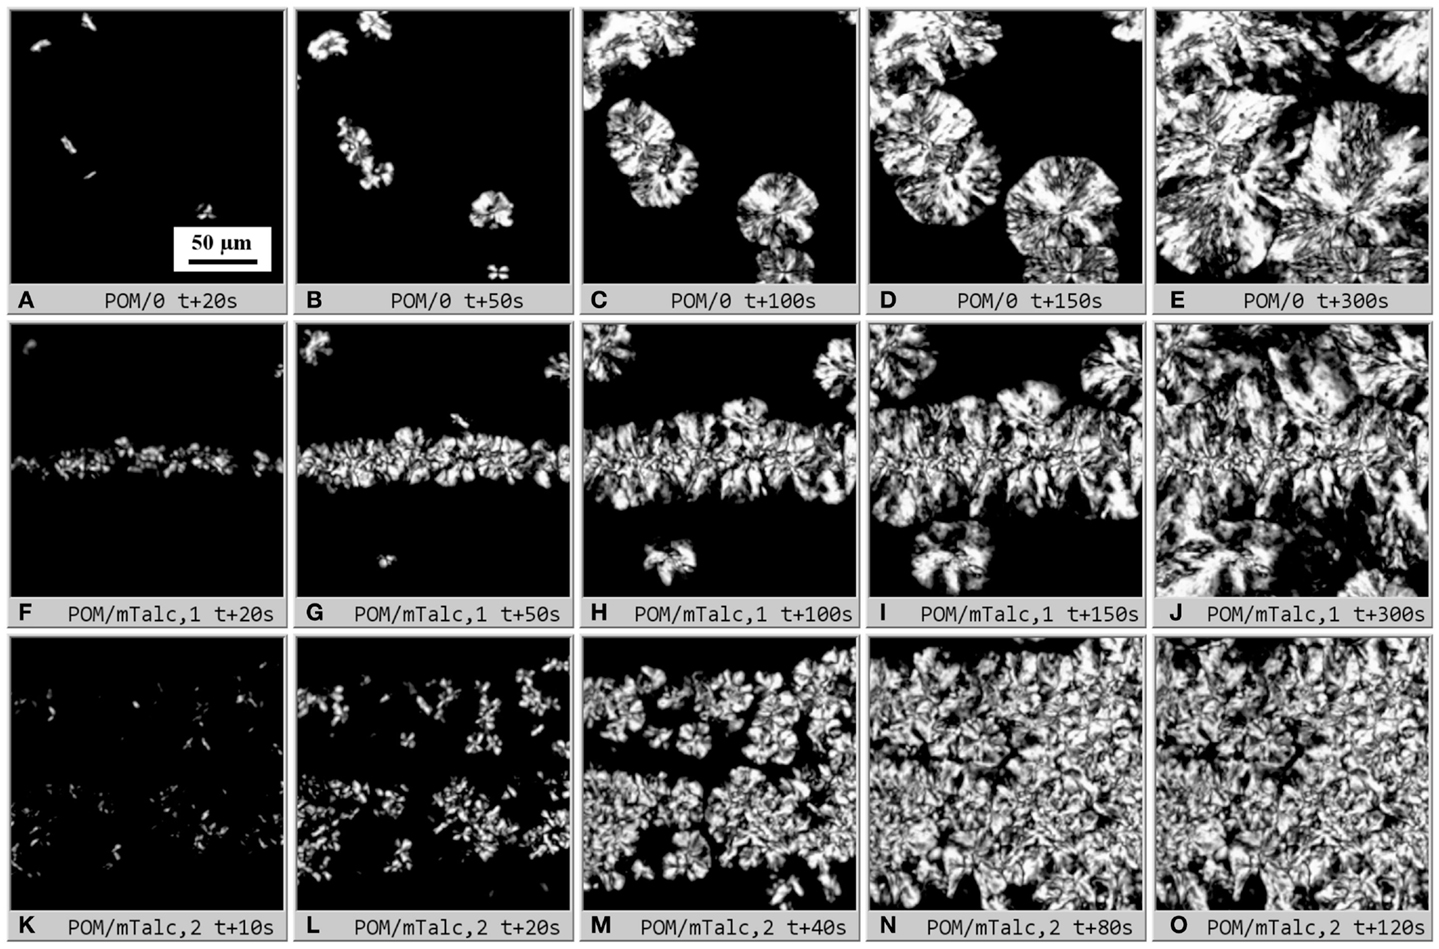
Figure 5. Dynamic sandwich method – primary output from the experiments: sets of polarized light micrographs (real width of all micrographs = 200 μm; scale bar in the first image (A) applies to all other images (B–O) of this figure) illustrating isothermal crystallization in POM sandwich composites. The first row shows empty sandwich POM/0 (A–E), the lower two rows show POM/mTalc sandwiches with (F–J) thin and compact nucleant layer and (K–O) thick and diluted nucleant layer (due to sandwich melting). The micrographs (F–J) and (K–O) show two limiting cases – typical nucleant layer thickness in most sandwiches was between these two extremes. Sandwich preparation is described in Sections “Materials,” “Preparation of Sandwich Composites,”and “Isothermal Crystallization in Polarized Light Microscope.”
The series of PLM micrographs were converted to relative crystallinities, X(t). Figure 6 compares the raw X(t) values (i.e., data obtained directly from the micrographs by PLM/INT method as described in Section “Quantitative Evaluation of Polarized Light Micrographs”) for all studied sandwich composites. The raw data were scattered due to the local nature of the technique, because each curve represented as small field of view as 200 μm × 200 μm. Nevertheless, each sample was measured >10 times and the repeated experiments clearly indicated that the nucleating activity decreases in the following order: POM/nChalk > POM/mTalc > POM/TiNT ≈ POM/0. This was finally confirmed in the next step – fitting and averaging.
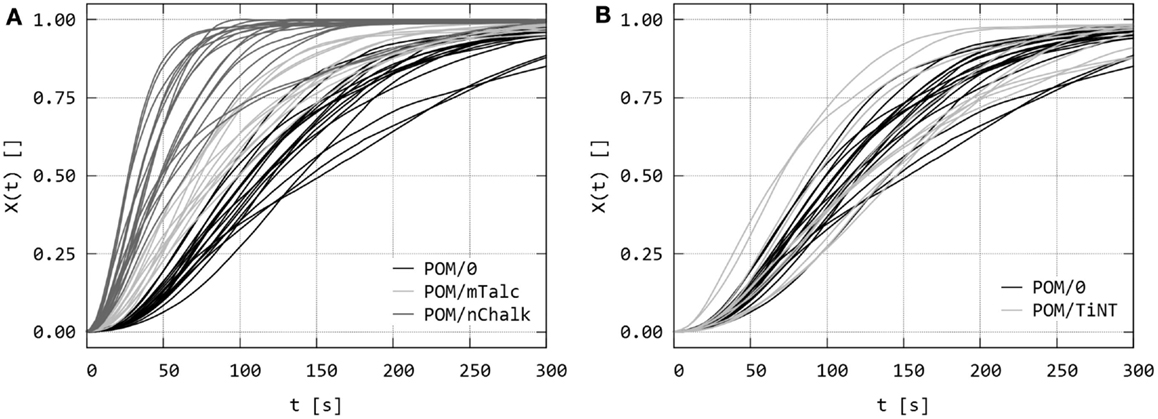
Figure 6. Dynamic sandwich method – the second output from the experiments: the raw values of relative crystallinity, X(t), obtained from the intensity of polarized light in the sets of PLM micrographs as illustrated in Figures 4 and 5. The graphs compare raw X(t) data of (A) sandwiches POM/0 vs. POM/mTalc and POM/nChalk, and (B) POM/0 vs. POM/TiNT.
The final step of quantitative evaluation of PLM micrographs consisted of fitting each single X(t) curve with Avrami equation. Details about the fitting can be found in section “Quantitative Evaluation of Polarized Light Micrographs” or elsewhere (Lorenzo et al., 2007; Sencadas et al., 2010; Zhao and Ye, 2011). The results are summarized in Figure 7 (average fitted curves) and Table 1 (averaged Avrami parameters – n, k, K, τ). We note that the average values of the derived Avrami parameters (K, τ) can be either calculated from average (n, k) – this was done in Figure 7 or averaged from the individual fitted curves – this was done in Table 1. The values may differ slightly due to the fact that the Avrami equation is non-linear. In any case, the final crystallization curves, calculated from the averaged Avrami parameters (n, k) confirmed that the nucleation activity decreased as indicated by the raw data (POM/nChalk > POM/mTalc > POM/TiNT ≈ POM/0). Statistical analysis based on two-sample t-tests (Table 2) confirmed that there was a significant difference in crystallization kinetics among three sandwich composites POM/0, POM/mTalc, and POM/nChalk (Figure 6A), while similar crystallization of POM/0 and POM/TiNT (Figure 6B) resulted in statistically insignificant difference between their Avrami parameters.
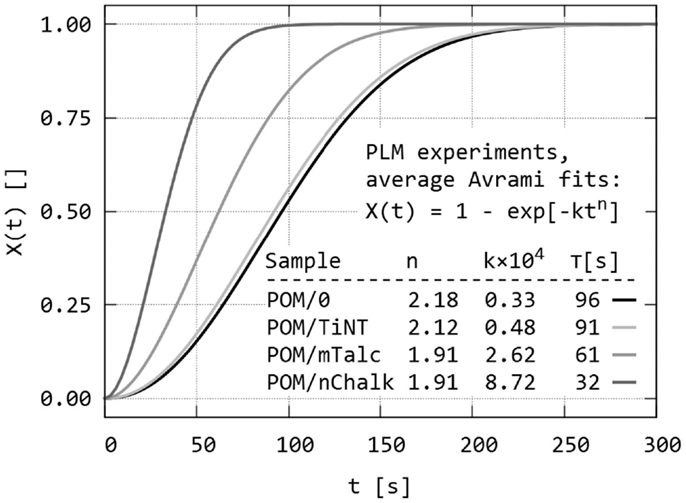
Figure 7. Dynamic sandwich method – the third output from the experiments: average Avrami fits of all X(t) values of all studied POM sandwiches. The fits were calculated from average Avrami parameters (n, k), obtained from fitting of raw data illustrated in Figure 6. The crystallization half-times (τ) in the inset table were calculated from (n, k) using Eq. (3).
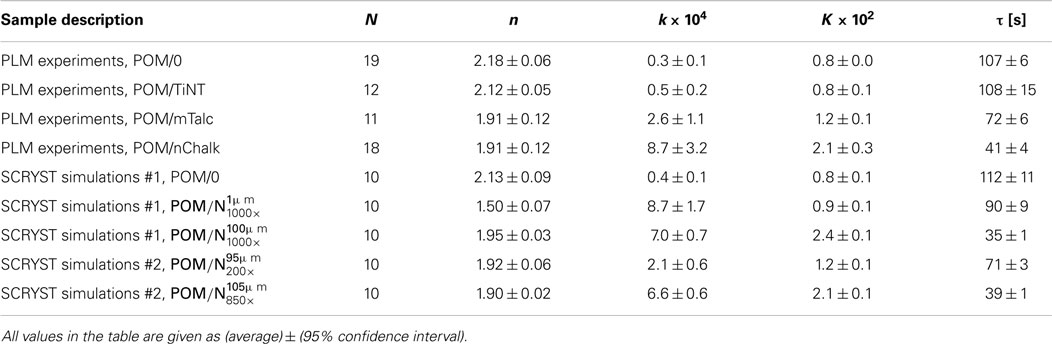
Table 1. Final Avrami parameters (n, k, K, τ) from PLM experiments and SCRYST simulations; N = number of experiments/simulations for given sample.
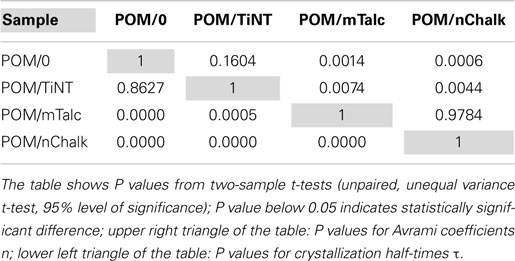
Table 2. Statistical comparison of Avrami parameters (n, τ) from PLM data fitting.
Simulations by Program SCRYST
Program SCRYST (described in Section “Simulation of Spherulitic Crystallization in Sandwich Nanocomposites”) simulates spherulitic crystallization in homogeneous samples, sandwich composites, or any other user-defined samples. The outputs of the program are analogous to those from the real PLM experiments: (i) simulated PLM micrographs (Figure 8, cf. Figure 5), (ii) relative crystallinities, X(t), as a function of time (Figure 9, cf. Figure 6), and (iii) average crystallization curves fitted to Avrami equation, together with average Avrami parameters (Figure 10, cf. Figure 7). We can summarize the benefits of SCRYST simulation as follows: (i) they enabled us to simulate the impact of sample geometry (sample size, broadening of nucleating agent layer due to melting etc.) on overall crystallization rate – this confirmed that selected sample geometry was suitable for investigations of nucleating activity, (ii) the simulations reproduced the features observed on PLM micrographs (nucleation of spherulites in central layer, overall crystallization rate, fitted Avrami parameters) – this confirmed the reliability and reproducibility of the sandwich method, and (iii) the simulations even enabled us to estimate or quantify a few additional parameters (such as primary nucleation probability and ratios between the nucleating activity for the investigated/simulated nucleants, as explained below).
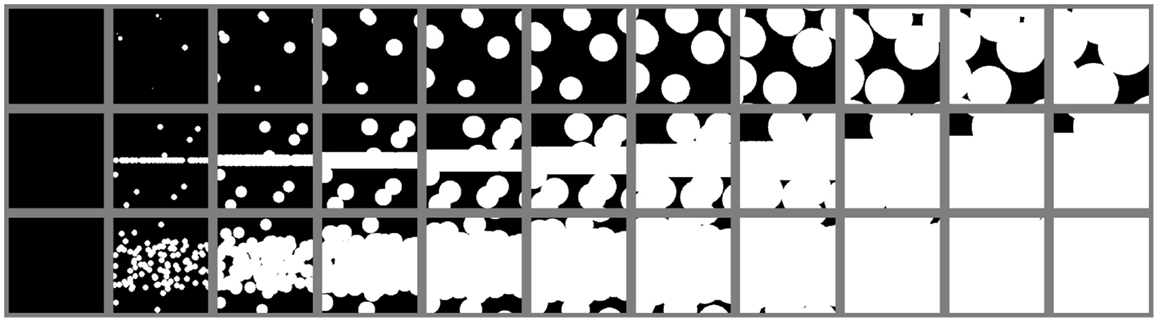
Figure 8. Simulation of isothermal spherulitic crystallization in sandwich composites with program SCRYST: the first output of the program – simulated PLM micrographs. Upper row: empty sandwich POM/0; middle row: sandwich with strong nucleant (primary nucleation probability in the nucleant layer 1000 × higher than in the polymer matrix), compact nucleant layer (thickness 1 μm); lower row: sandwich with the same strong nucleant as in the previous case, but the nucleant layer broadened due to melting to final thickness 100 μm. In each row, the first micrograph corresponds to t = 0 s and the following micrographs show the isothermal crystallization process with step Δt = 20 s.
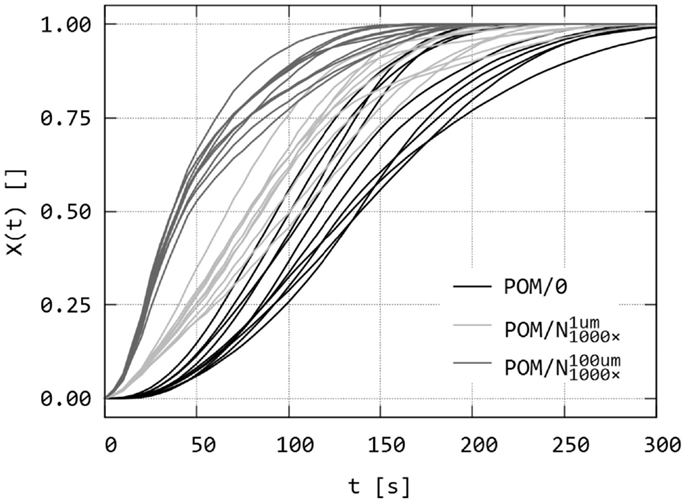
Figure 9. Simulation of isothermal spherulitic crystallization in sandwich composites with program SCRYST: the second output of the program – raw data of relative crystallinity, X(t), as a function of time. The sandwiches POM/0, and are the same as in Figure 8. For each sandwich, 10 simulations were calculated.
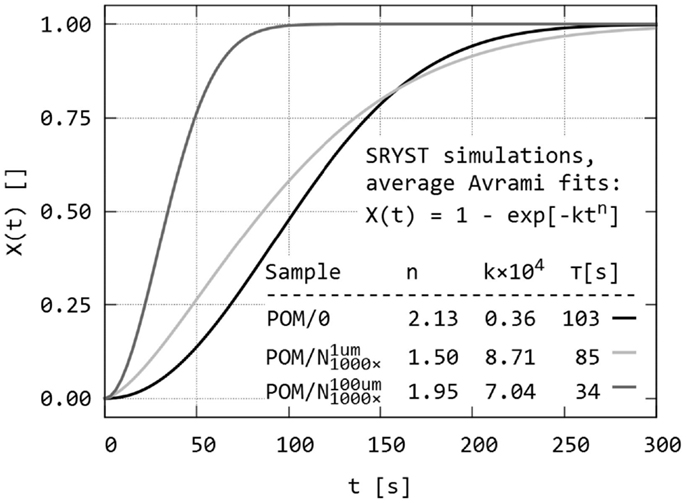
Figure 10. Simulation of isothermal spherulitic crystallization in sandwich composites with program SCRYST: the third output of the program – average Avrami fits of all X(t) values of all simulated POM sandwiches. The sandwich composites POM/0, , and are the same as in Figures 8 and9.
Figure 8 shows three sets of simulated PLM micrographs, corresponding to three sandwich composites during isothermal crystallization. The first simulation was an empty sandwich composite POM/0 (Figure 8, upper row; cf. Figures 5A–E). The second simulated sandwich (Figure 8, middle row; cf. Figures 5F–J) was denoted as i.e., sandwich with a strong nucleant, which exhibits nucleating activity 1000 × higher than the surrounding polymer matrix and which is localized in thin 1 μm layer. The third simulated sandwich was denoted as i.e., the same sample as in the previous case, but the nucleant layer was supposed to be broadened due to melting to final thickness of 100 μm (Figure 8, lower row; cf. Figures 5K–O). It is worth noting that the broadening of the nucleating agent layer does not influence the results in a negative way: for given nucleating agent, if the broadening occurs, the observed nucleating activity is even higher. In other words, the nucleating layer in thick layer exhibits higher overall rate of crystallization than the same nucleating agent in thin layer , as evidenced by Figures 8–10. This means that broadening of the nucleating agent layer increases the difference between the sandwich with studied nucleant and empty control. Other simulations (results not shown for the sake of brevity) suggested that the overall crystallization rate was quite sensitive to the activity of the nucleant (for example, there was ca 50% decrease in τ toward the empty sandwich if the nucleating activity decreases from 1000× to 100×).
The agreement between simulations (Figure 8) and experiments (Figure 5) was encouraging but not surprising, because spherulitic crystallization is a random process and all important parameters could be taken and/or estimated from PLM micrographs. The sample dimensions were set to 200 μm × 200 μm × 30 μm; the thickness of 30 μm was an average value measured experimentally – the original thickness of the thin sandwich section was 60 μm (Figure 1), but on thermal treatment in the microscope before crystallization the sample was molten, its width increased ca 2× and the thickness decreased to ca 1/2. Semi-instantaneous nucleation (spontaneous nucleation during the first 20 s, followed only by growth of existing spherulites) was applied in modeling of crystallization in empty sandwich; this corresponded to experimental data (as discussed in Section “Polarized Light Microscopy”). Instantaneous nucleation (nucleation only at t = 0 s) was used in modeling sandwiches with strong nucleating agent (Figure 8, lower two rows), because here the crystallization kinetics was dominated by immediate/instantaneous nucleation from the nucleant layer, while the semi-instantaneous nucleation in the surrounding polymer matrix played a minor role. Spherulite growth rate (here: 0.29 μm/s) could be measured directly from the series of experimental micrographs. Primary nucleation probability in the polymer matrix (here: 7.0 × 106 μm-3/s) was estimated from the experiments as explained in section “Simulation of Spherulitic Crystallization in Sandwich Nanocomposites,” while the primary nucleation activity of the nucleant was estimated to be 1000× higher than that of the matrix. These parameters approximated the experimental data quite well, as illustrated by the fact that series of PLM micrographs (Figure 5) were in good agreement with the series of simulated micrographs (Figure 8).
Figure 9 shows the second output of PLM program: simulated relative crystallities, X(t), as a function of time, which are analogous to experimental relative crystallinities (cf. Figure 6). Sandwich samples in Figures 8 and 9 (POM/0, ) are the same, but Figure 8 shows just one simulation per sandwich for sake of brevity while Figure 9 gives X(t) curves of all 10 simulation for each sandwich. The difference between the three simulations is evident. Melting of the nucleant layer did not decrease the overall crystallization process, but just the reverse – molten/broadened layer resulted in faster crystallization within the observed area. This was in perfect agreement with the experiments, in which the broader layer of nucleant resulted in earlier completion of crystallization (Figure 5).
Figure 10 displays the third output of PLM program: average crystallization curves fitted to Avrami equation, together with average Avrami parameters. The averaged data confirm that the melting of the nucleant layer is an important parameter, which should be considered during simulations in order to get results corresponding to real sandwich samples. Very thin nucleant layer in led to clear difference at the beginning of crystallization process in comparison with empty sandwich POM/0, measurable increase in crystallization half-time, and very small difference in later stages of crystallization. Simulated sandwich with thicker nucleant layer was very similar to real sandwich POM/nChalk (compare the curves and Avrami parameters in Figures 7 and 10).
Overall comparison of PLM experiments on real sandwiches (POM/0, POM/TiNT, POM/mTalc, POM/nChalk) and SCRYST simulations on model sandwiches (POM/0, ) is given in Table 1. POM/0 simulation was very close to the crystallization of real POM/0 sandwich. simulation was quite close to the real POM/nChalk sandwich. Fine-tuning of the two key parameters of sandwich composites, primary nucleation probability of nucleant and melting/broadening of the nucleant layer, made it possible to achieve better approximations for real sandwich composites: POM/mTalc and POM/nChalk. The best models for POM/mTalc and POM/nChalk sandwiches showed to be and respectively (Table 1). Therefore, it was possible to quantify nucleation activity of the nucleants: nChalk and mTalc exhibited ca 850× and 200× higher primary nucleation probabilities (exact definition in Section “Simulation of Spherulitic Crystallization in Sandwich Nanocomposites”) in comparison with POM matrix, respectively. This suggested that the tested nChalk nanopowder was approximately 4× stronger nucleating agent than the tested mTalc micropowder. Moreover, the more precise SCRYST simulations confirmed the experimental observation that the average thickness of the molten nucleant layer in the sandwich composites were in between the two extreme cases shown in Figure 5. Model sandwich POM/0 did not have to be fine-tuned as its parameters corresponded to real POM/0 very well. Sandwich POM/TiNT was not modeled because its crystallization kinetics is practically the same as that of POM/0. In conclusion, the SCRYST models not only approximated the real crystallizations very well, but even enabled us to evaluate nucleating activity of tested nucleants quantitatively.
Supplementary Experiments: DSC and SEM
Differential scanning calorimetry (described in Section “Differential Scanning Calorimetry”) and in situ scanning electron microscopy (SEM, described in Section “In-situ Scanning Electron Microscopy”) were used to verify the results from PLM experiments (see Section “Polarized Light Microscopy”) and SCRYST simulations (see Section “Simulations by Program SCRYST”).
Isothermal crystallization kinetics in DSC was measured with multilayer sandwiches (Figure 4) at slightly higher temperature (T = 152°C). The multilayer sandwiches were used in order to increase nucleant/polymer ratio. The higher temperature had to be applied because at lower temperatures the crystallization of DSC samples with strong nucleanting agents was too fast for correct evaluation of crystallization kinetics. Three multilayered sandwiches were measured in DSC: POM/0, POM/mTalc, and POM/nChalk; for each sample, five sandwich composites were prepared and measured. The results confirmed the decrease in nucleating activity observed in PLM; the crystallization half-times, τ (Eq. 3), decreased in the following order: POM/nChalk [τ(DSC) = 6.4 ± 1.3 min] > POM/mTalc [τ(DSC) = 9.7 ± 1.0 min] > POM/0 [τ(DSC) = 23.8 ± 1.2 min].
In situ SEM experiments (Figure 11) documented that also scanning electron microscopy can monitor melting/crystallization of non-conductive samples, such as polymers. By means of a SEM microscope equipped with a heating stage, we confirmed that crystallization/melting of POM occured around 150–160°C, which was in accord with parallel PLM and DSC measurements. These results implied that in the future the in situ SEM methods might monitor thermal processes, which are beyond the resolution of light microscopes.
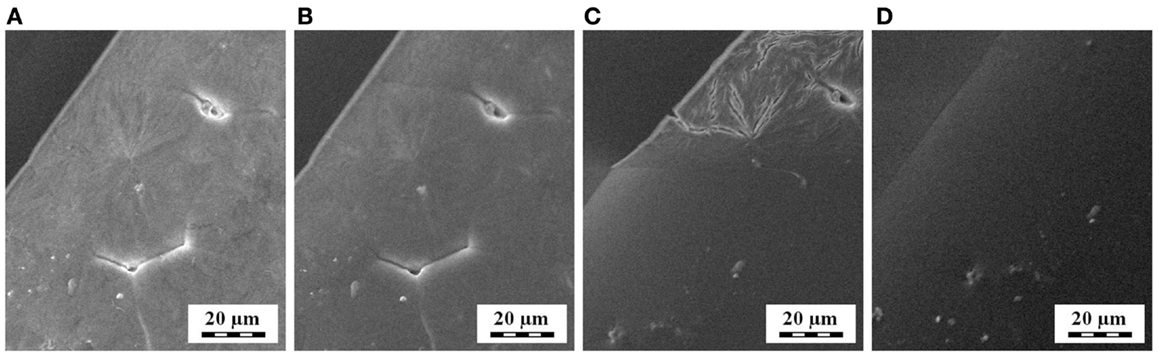
Figure 11. Melting of spherulites at the surface of thin POM film, as observed by in situ SEM microscopy during heating: (A) 150°C, (B) 155°C, (C) 160°C, and (D) 165°C.
It is worth mentioning that also in situ AFM studies of polymer crystallization have appeared recently (Takanashi and Kumaki, 2013; Löhman et al., 2014; Malwela and Ray, 2014). This is due to improvement of AFM techniques (increase in scanning speed, more stable heating devices etc.). Consequently, AFM is another interesting method for in situ study of polymer crystallization, offering higher resolution (in comparison with in situ PLM) and higher contrast combined with lower damage of the sample (in comparison with in situ SEM).
Discussion
Overall crystallization kinetics in polymer samples according to Eq. (1) can be studied by any method, which yields the values of relative crystallinity, X(t), as a function of time. From historical perspective, the first methods were based on dilatometry, because the crystallization is usually accompanied by measurable decrease in sample dimensions (Runt and Harrison, 1980). Later studies relied on DSC, which is the most convenient and the most widely used technique in the field up to now (Lorenzo et al., 2007; Sencadas et al., 2010; Perez et al., 2014; Zou et al., 2014). Nevertheless, sporadically also a few other methods were applied to study of crystallization kinetics in polymers, such as PLM (Plummer and Kausch, 1995; Krumme, 2004), infrared spectroscopy (Zhang et al., 2004), or even less common techniques like microhardness (Balta Calleja and Fakirov, 2009).
Polarized light microscopy has been widely employed in visualization of semicrystalline polymers morphology. Nevertheless, applications of PLM to quantitative evaluation of crystallization kinetics in polymers are quite scarce. In most cases, the crystallization kinetics was studied by DSC and PLM was used as a supplementary method to reveal additional details about crystallization, such as to measure spherulitic growth rate (Castillo et al., 2010), to differentiate between instantaneous and spontaneous nucleation (Michell et al., 2012) to distinguish α- and β-spherulites of isotactic polypropylene (Zeng et al., 2011), to confirm presence of banded spherulites (Huang et al., 2010), or just to verify the DSC results (Zou et al., 2014). In a few studies focused on crystallization kinetics evaluation exclusively by PLM (Plummer and Kausch, 1995; Krumme, 2004; Misztal-Faraj et al., 2009), the authors focused in some theoretical aspects of PLM and/or in extracting quantitative information from PLM micrographs, while other authors (Mazzobre et al., 2003; Annunziata et al., 2013) used DSC and PLM in parallel sets of experiments in order to determine relative crystallinity, X(t), and study crystallization kinetics. The fact that intensity of polarized light in a PLM microscope is proportional to X(t) was mentioned also in older studies of Lednicky et al. (Lednický and Muchová, 1993; Muchová and Lednický, 1996), but they were concentrated on the theory of induction time and not on the overall crystallization kinetics.
In contrast to great majority of previous studies, this work is focused primarily on practical evaluation of crystallization kinetics by means of PLM. The final objective was to develop an efficient method, which would enable us to investigate and to quantify nucleating activity of inorganic particles in polymer composites. In the first step, we developed reproducible sample preparation in microscopic scale – the sandwich method – in which the inorganic micro/nanoparticles are deposited in between thin polymer films. The first experiments were, however, static in the sense that we evaluated the nucleation activity semi-quantitatively, i.e., we evaluated possible transcrystallization on sandwich cross-section after the crystallization was finished (Pavlova et al., 2010; Slouf et al., 2012). In parallel experiments, we successfully tested quantitative evaluation of crystallization kinetics from PLM micrographs of bulk samples; the key benefit of the study was the experimental evidence that relative crystallinities from PLM could be reasonably fitted to Avrami equation (Mikešová et al., 2013). Finally, this work combines the two approaches and presents a new version of sandwich method, which is dynamic in the sense that the nucleation activity of micro/nanoparticles in sandwiches is observed by in situ PLM, during the crystallization process.
The advantages of the dynamic sandwich method, presented in this work, can be summarized as follows: (i) the method uses its own, well-defined samples – sandwich composites – which can be prepared easily and reproducibly in any laboratory equipped with a microtome and a heating stage, (ii) due to the small size of sandwich samples, the consumption of both polymer and nucleating agent is very low, and so the method is suitable for expensive and/or difficult-to-synthesize nucleants, which are available in low amounts, (iii) the agglomeration of nucleating agent particles, which strongly influences the results when using traditional preparation methods such as melt-mixing, can be eliminated in sandwich composites as the particles are deposited in a very thin homogeneous layer and in this way the formation of bulky 3D-agglomerates can be prevented, and (iv) in situ PLM yields not only relative crystallinities for quantitative evaluation of crystallization kinetics, but also direct visualization of the crystallization process; consequently we obtain valuable additional information, such as directly measurable spherulite growth rate, number of spherulites in observed volume, type of nucleation (instantaneous × spontaneous), type of spherulites (α- or β-spherulites in polypropylene, banded spherulites in polyethylene), direct visualization of nucleating agent activity due to its well-defined localization in the central layer, etc. From the above mentioned facts it follows that the sandwich method in combination with PLM is applicable on any polymer composite with sufficiently large spherulites (with diameters above 5–10 μm) that can be resolved reliably in the micrographs. The multiple sandwiches (Figure 4) in combination with DSC can be used to study the nucleation activity of arbitrary semicrystalline polymer composite. On the other hand, the method has the following limitations: (i) due to the microscopic nature of the method, the observed volume is small, and so enough samples must be measured in order to obtain statistically relevant results and (ii) the sandwich samples have to be prepared with extreme care since the constant dimensions and high purity of the samples are crucial for reproducibility. It is necessary to prepare the samples in exactly the same way, using exactly the same materials, which underwent exactly the same thermo-mechanical history. To illustrate this, let us point out that the polymer films should not be prepared from single granules of the polymer by one-step compression molding. The films prepared from individual granules exhibit slightly different crystallization behavior and, as a result, the final data are more scattered. Instead, the granules have to be melt-mixed and compression molded into a plate, from which the films are prepared by microtomy followed by thermal treatment as described in Sections “Materials” and “Preparation of Sandwich Composites.”
In situ PLM microscopy directly visualizes the crystallization process, which enabled us to analyze the crystallization process in higher detail. In section “Simulations by program SCRYST,” we demonstrated that PLM micrographs yielded all necessary parameters (such as average number of spherulites in observed volume, spherulite growth rate, average thickness of the nucleant layer etc.) to simulate/model the crystallization in sandwich composites. The simulations matched the experiments very well and gave quantitative description of nucleating activity of the investigated nucleants, in the form of primary nucleation probabilities (Table 1). Moreover, the known geometry of the sample in combination with direct visualization of the crystallization process facilitates more precise interpretation of Avrami parameters (n, k, K, τ). This holds especially for the first Avrami parameter, n, which is connected with dimensionality of crystallization and type of nucleation as shown in Table 3. In PLM experiments, the parameter n of both POM/0 and POM/TiNT samples was slightly above 2, while the strong-nucleant-containing samples, POM/mTalc and POM/nChalk, exhibited the parameter n slightly below 2 (Figure 7). Statistical analysis implied that the difference between these two groups of samples is significant (Table 2). Our explanation, based on theoretical considerations (Table 3), PLM experiments (Figures 5–7), and SCRYST simulations (Figures 8–10), is as follows: (i) according to PLM micrographs, nucleation is (semi)instantaneous ⇒ n must be below 4. (ii) the PLM micrographs visualize 3D crystallization in the form of 2D projection and the z-dimension of the samples (~30 μm) is comparable to spherulite size ⇒ the observed crystallization is close to two-dimensional and we may expect n-coefficient to decrease well below 3, as observed in POM/0 and POM/TiNT samples. (iii) the thin layer of strong nucleating agent further decreases the dimensionality of the crystallization process toward one-dimensional, because great majority of the spherulites start to grow from a line, which results in transcrystallization or, in other words, linear growth from a line ⇒ n-coefficient should further decrease below 2, as observed in POM/mTalc and POM/nChalk samples. (iv) the SCRYST simulations (Figures 8–10) confirmed all above conclusions: semi-instantaneous nucleation in POM/0 and POM/TiNT sandwich composites with given geometry results in Avrami coefficient n = 2.13 ± 0.09, thin layer of strong nucleant decreased the n-coefficient to 1.50 ± 0.07, and average thickness of the nucleating agent layer observed in our samples (ca 100 μm) resulted in the values of n around 1.9, which was in perfect agreement with both experimental observations (Table 1) and theoretical estimates (Table 3 and the discussion above).
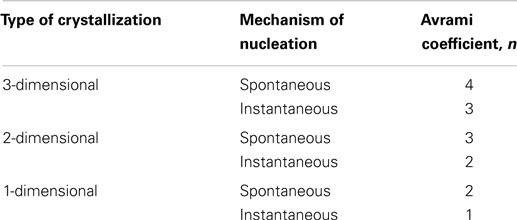
Table 3. Theoretical values of Avrami coefficients n (Sperling, 1992).
Conclusion
We introduced the sandwich method – a new technique based on polarized light microscopy (PLM), focused on evaluation of overall crystallization kinetics and nucleating activity of micro- or nanoparticles in semicrystalline polymers. The sandwich method comprises a well-defined microscopic-scale preparation of specimens, called sandwich composites, in which a nucleating agent layer is deposited between two thin polymer films. We applied the sandwich method on POM composites and compared the nucleating activity of three nucleating agents: talc micropowder (mTalc), chalk nanopowder (nChalk), and laboratory-prepared titanate nanotubes (TiNT). The results showed that the nucleation activity increases in the following order: POM/TiNT < POM/mTalc < POM/nChalk. We have demonstrated several advantages of the sandwich method: reliability and reproducibility of the results, direct control of crystallization process during in situ PLM measurements, easy sample preparation, low consumption of polymers and nucleants due to microscopic nature of the method, possibility to prepare multi-layered sandwiches that can be employed in verifying the results by means of DSC, and excellent agreement of the experimental results with computer simulations.
Conflict of Interest Statement
The authors declare that the research was conducted in the absence of any commercial or financial relationships that could be construed as a potential conflict of interest.
Acknowledgments
This work was supported through grants GACR P205/10/0348, GA14-17921S (Czech Science Foundation), and TACR TE01020118 (Technology Agency of the Czech Republic).
References
Annunziata, L., Monasse, B., Rizzo, P., Guerra, G., Duc, M., and Carpentier, J.-F. (2013). On the crystallization behavior of syndiotactic-b-atactic polystyrene stereodiblock copolymers, atactic/syndiotactic polystyrene blends, and aPS/sPS blends modified with sPS-b-aPS. Mater. Chem. Phys. 141, 891–902. doi: 10.1016/j.matchemphys.2013.06.020
Pubmed Abstract | Pubmed Full Text | CrossRef Full Text | Google Scholar
Balta Calleja, F. J., and Fakirov, S. (2009). “Crystallization kinetics as revealed by microhardness,” in Microhardness of Polymers’ (Cambridge: Cambridge University Press), 113–117.
Bernland, K., and Smith, P. (2009). Nucleating polymer crystallization with poly(tetrafluoroethylene) nanofibrils. J. Appl. Polym. Sci. 114, 281–287. doi:10.1002/app.30425
Castillo, R. V., Müller, A. J., Raquez, J.-M., and Dubois, P. (2010). Crystallization kinetics and morphology of biodegradable double crystalline PLLA-b-PCL diblock copolymers. Macromolecules 43, 4149–4160. doi:10.1021/ma100201g
Ding, Q., Dai, W.-L., and Zhang, P. (2007). The effect of polyvinylidene fluoride on nonisothermal crystallization behavior of polyoxymethylene. Polym. Eng. Sci. 47, 2034–2040. doi:10.1002/pen.20916
Hu, Y., and Ye, L. (2005). Nucleation effect of polyamide on polyoxymethylene. Polym. Eng. Sci. 45, 1174–1179. doi:10.1002/pen.20377
Huang, X., Li, C., Guan, G., Zhang, D., and Xiao, Y. (2010). Crystallization kinetics, melting behavior, and morphologies of poly(butylene succinate) and poly(butylene succinate)-block-poly(propylene glycol) segmented copolyester. J. Appl. Polym. Sci. 118, 2225–2235. doi:10.1002/app.32585
Jiang, L., Jiang, F., Yang, J., Li, R., and Hu, Y. (2012). Influence of novel nucleating agent on the mechanical properties and crystallinity of polyoxymethylene. Adv. Mater. Res. 466-467, 31–35. doi:10.4028/www.scientific.net/AMR.466-467.31
Kobayashi, M. (1992). “Polymorphism and morphologies of linear and macrocyclic poly(oxymethylene),” in Crystallization of Polymers, ed. M. Dosiere (Dodrecht: Kluwer Academic Publishers), 283–299.
Kralova, D., Slouf, M., Klementova, M., Kuzel, R., and Kelnar, I. (2010). Preparation of gram quantities of high-quality titanate nanotubes and their composites with polyamide 6. Mater. Chem. Phys. 124, 652–657. doi:10.1016/j.matchemphys.2010.07.029
Krumme, A. (2004). Measuring crystallization kinetics of high density polyethylene by improved hot-stage polarized light microscopy. Polym. Test 24, 29–34. doi:10.1016/S0142-9418(03)00058-8
Lednický, F., and Muchová, M. (1993). Revival of the induction time concept in the theory of polymer crystallization. Collect. Czech. Chem. Commun. 58, 2444–2450. doi:10.1135/cccc19932444
Löhman, A.-K., Henze, T., and Thurn-Albrech, T. (2014). Direct observation of prefreezing at the interface melt–solid in polymer crystallization. Proc. Natl. Acad. Sci. U.S.A. 111, 17368–17372. doi:10.1073/pnas.1408492111
Pubmed Abstract | Pubmed Full Text | CrossRef Full Text | Google Scholar
Lorenzo, A. T., Arnal, M. L., Albuerne, J., and Müller, A. J. (2007). DSC isothermal polymer crystallization kinetics measurements and the use of the Avrami equation to fit the data: guidelines to avoid common problems. Polym. Test 26, 222–231. doi:10.1016/j.polymertesting.2006.10.005
Malwela, T., and Ray, S. S. (2014). Investigating the crystal growth behavior of biodegradable polymer blend thin films using in situ atomic force microscopy. Macromol. Mater. Eng. 299, 689–697. doi:10.1002/mame.201300281
Masirek, R., and Piorkowska, E. (2010). Nucleation of crystallization in isotactic polypropylene and polyoxymethylene with poly(tetrafluoroethylene) particles. Eur. Polym. J. 46, 1436–1445. doi:10.1016/j.eurpolymj.2010.04.021
Masirek, R., Szkudlarek, E., Piorkowska, E., Slouf, M., Kratochvil, J., and Baldrian, J. (2010). Nucleation of isotactic polypropylene crystallization by gold nanoparticles. J. Polym. Sci. B Polym. Phys. 48, 469–478. doi:10.1002/polb.21908
Mazzobre, M. F., Aguilera, J. M., and Buera, M. P. (2003). Microscopy and calorimetry as complementary techniques to analyze sugar crystallization from amorphous systems. Carbohydr. Res. 338, 541–548. doi:10.1016/S0008-6215(02)00495-0
Pubmed Abstract | Pubmed Full Text | CrossRef Full Text | Google Scholar
Michell, R. M., Müller, A. J., Boschetti-de-Fierro, A., Fierro, D., Lison, V., Raquez, J.-M., et al. (2012). Novel poly(ester-urethane)s based on polylactide: From reactive extrusion to crystallization and thermal properties. Polymer 53, 5657–5665. doi:10.1016/j.polymer.2012.10.021
Mikešová, J., Slouf, M., Gohs, U., Popelková, D., Vacková, T., Vu, N. H., et al. (2013). Nanocomposites of polypropylene/titanate nanotubes: morphology, nucleation effects of nanoparticles and properties. Polym. Bull. 71, 795–818. doi:10.1007/s00289-013-1093-y
Misztal-Faraj, B., Sajkiewicz, P., Savytskyy, H., Bonchyk, O., Gradys, A., and Ziabicki, A. (2009). Following phase transitions by depolarized light intensity. The experimental setup. Polym. Test 28, 36–41. doi:10.1016/j.polymertesting.2008.09.012
Muchová, M., and Lednický, F. (1996). Investigation of heterogeneous nucleation by the induction time of crystallization: 2. Comparison of the theory and experimental measurement. Polymer 37, 3037–3043. doi:10.1016/0032-3861(96)89402-X
Muck, K. F. (1999). “Physical constants of poly(oxymethylene),” in Polymer Handbook, eds J. Brandrup, E. H. Immergut, and E. A. Grulke (New York, NY: Wiley), 97–112.
NiS-Elements. (2012). Ar, User Manual Version 4.00, Laboratory Imaging. Prague. Available at: http://www.laboratory-imaging.com
Nowacki, R., and Piorkowska, E. (2007). Influence of solid particles on cavitation in poly(methylene oxide) during crystallization. J. Appl. Polym. Sci. 105, 1053–1062. doi:10.1002/app.26186
Pavlova, E., Slouf, M., Sandova, H., Baldrian, J., Sikora, A., Lednicky, F., et al. (2010). Nucleation of polypropylene with gold nanoparticles. Part 1: introduction of sandwich method for evaluation of very weak nucleation aktivity. J. Macromol. Sci. B Phys. 49, 392–404. doi:10.1080/00222340903546812
Perez, R. A., Lopez, J. V., Hoskins, J. N., Zhang, B., Grayson, S. M., Casas, M. T., et al. (2014). Nucleation and antinucleation effects of functionalized carbon nanotubes on cyclic and linear poly(∊-caprolactones). Macromolecules 47, 3553–3566. doi:10.1021/ma5005869
Piorkowska, E., Billon, N., Haudin, J. M., and Gadzinowska, K. (2005). Spherulitic structure development during crystallization in confined space II. Effect of spherulite nucleation at borders. J. Appl. Polym. Sci. 97, 2319–2329. doi:10.1002/app.21802
Plummer, C. J. G., and Kausch, H.-H. (1995). Real-time image analysis and numerical simulation of isothermal spherulite nucleation and growth in polyoxymethylene. Colloid Polym. Sci. 273, 719–732. doi:10.1007/BF00658750
Runt, J., and Harrison, I. R. (1980). “Thermal analysis of polymers,” in Methods of Experimental Physics, Vol. 16, ed. R. A. Fava (New York, NY: Academic Press), 336–337.
Sencadas, V., Costa, C. M., Gómez Ribelles, J. L., and Lanceros-Mendez, S. (2010). Isothermal crystallization kinetics of poly(vinylidene fluoride) in the a-phase in the scope of the Avrami equation. J. Mater. Sci. 45, 1328–1335. doi:10.1007/s10853-009-4086-3
Shu, Y., Ye, L., and Zhao, X. (2006). High efficiency nucleating agents of polyoxymethylene. Polym. Plast. Technol. Eng. 45, 963–970. doi:10.1080/03602550600718381
Sinker, S. M. (1985). “Homopolymer and Copolymer Acetals,” in Engineered Materials Handbook, Vol. 2, (Metals Park: OH ASM International), 100–102.
Sinker, S. M. (1990). “Acetals,” in Handbook of Plastic Materials and Technology, ed. I. I. Rubin (New York, NY: Wiley), 11–24.
Slouf, M., Sikora, A., Pavlova, E., Vlkova, H., Baldrian, J., Base, T., et al. (2012). Nucleated crystallization of isotactic polypropylene in multilayered sandwich nanocomposites with gold particles. J. Appl. Polym. Sci. 125, 4338–4346. doi:10.1002/app.36589
Sperling, L. H. (1992). Introduction to Physical Polymer Science. London: John Wiley & Sons, 232–235.
Sun, T. J., Ye, L., and Zhao, X. W. (2007). Thermostabilising and nucleating effect of montmorillonite on polyoxymethylene. Plast. Rubber Compos. 36, 350–359. doi:10.1179/174328907X237548
Takanashi, Y., and Kumaki, J. (2013). Significant melting point depression of two-dimensional folded-chain crystals of isotactic poly(methyl methacrylate)s observed by high-resolution in situ atomic force microscopy. J. Phys. Chem. B 117, 5594–5605. doi:10.1021/jp401284t
Pubmed Abstract | Pubmed Full Text | CrossRef Full Text | Google Scholar
Vacková, T., Slouf, M., Nevoralová, M., and Kapralková, L. (2011). Processing-improved properties and morphology of PP/COC blends. J. Appl. Polym. Sci. 122, 1168–1175. doi:10.1102/app.34258
Xu, W., and He, P. (2001). Isothermal crystallization behavior of polyoxymethylene with and without nucleating agents. J. Appl. Polym. Sci. 80, 304–310. doi:10.1002/1097-4628(20010411)80:2<304::AID-APP1100>3.0.CO;2-N
Yao, S., Hada, B., Mingyin, J., Zhaoxia, G., and Jian, Y. (2009). Effect of multi-walled carbon nanotubes on the properties of polyoxymethylene. Acta Polym. Sin. 7, 684–688. doi:10.3724/SP.J.1105.2009.00684
Pubmed Abstract | Pubmed Full Text | CrossRef Full Text | Google Scholar
Zeng, A., Zheng, Y., Qiu, S., and Guo, Y. (2011). Isothermal crystallization and melting behavior of polypropylene with lanthanum complex of cyclodextrin derivative as a β-nucleating agent. J. Appl. Polym. Sci. 121, 3651–3661. doi:10.1002/app.34183
Zhang, Y., Yonglai, L., Duan, Y., Zhang, J., Yan, S., and Shen, D. (2004). Reflection–absorption infrared spectroscopy investigation of the crystallization kinetics of poly(ethyleneterephthalate) ultrathin films. J. Polym. Sci. B Polym. Phys. 42, 4440–4447. doi:10.1002/polb.20306
Zhao, X., and Ye, L. (2011). Structure and mechanical properties of polyoxymethylene/multi-walled carbon nanotube composites. Compos. B Eng. 42, 926–933. doi:10.1016/j.compositesb.2011.01.002
Keywords: polyoxymethylene, nucleated crystallization, sandwich composites, titanate nanotubes, crystallization kinetics, Avrami equation, polarized light microscopy
Citation: Slouf M, Krejcikova S, Vackova T, Kratochvil J and Novak L (2015) In situ observation of nucleated polymer crystallization in polyoxymethylene sandwich composites. Front. Mater. 2:23. doi: 10.3389/fmats.2015.00023
Received: 09 December 2014; Accepted: 04 March 2015;
Published online: 19 March 2015.
Edited by:
Yves Leterrier, EPFL, SwitzerlandCopyright: © 2015 Slouf, Krejcikova, Vackova, Kratochvil and Novak. This is an open-access article distributed under the terms of the Creative Commons Attribution License (CC BY). The use, distribution or reproduction in other forums is permitted, provided the original author(s) or licensor are credited and that the original publication in this journal is cited, in accordance with accepted academic practice. No use, distribution or reproduction is permitted which does not comply with these terms.
*Correspondence: Miroslav Slouf, Institute of Macromolecular Chemistry, Academy of Sciences of the Czech Republic, Heyrovsky Sq. 2, 162 06 Prague 6, Czech Republic e-mail: slouf@imc.cas.cz