Silicon-nitride-based integrated optofluidic biochemical sensors using a coupled-resonator optical waveguide
 Jiawei Wang
 Zhanshi Yao
 Andrew W. Poon
- Photonic Device Laboratory, Department of Electronic and Computer Engineering, The Hong Kong University of Science and Technology, Hong Kong, China
Silicon nitride (SiN) is a promising material platform for integrating photonic components and microfluidic channels on a chip for label-free, optical biochemical sensing applications in the visible to near-infrared wavelengths. The chip-scale SiN-based optofluidic sensors can be compact due to a relatively high refractive index contrast between SiN and the fluidic medium, and low-cost due to the complementary metal-oxide-semiconductor (CMOS)-compatible fabrication process. Here, we demonstrate SiN-based integrated optofluidic biochemical sensors using a coupled-resonator optical waveguide (CROW) in the visible wavelengths. The working principle is based on imaging in the far field the out-of-plane elastic-light-scattering patterns of the CROW sensor at a fixed probe wavelength. We correlate the imaged pattern with reference patterns at the CROW eigenstates. Our sensing algorithm maps the correlation coefficients of the imaged pattern with a library of calibrated correlation coefficients to extract a minute change in the cladding refractive index. Given a calibrated CROW, our sensing mechanism in the spatial domain only requires a fixed-wavelength laser in the visible wavelengths as a light source, with the probe wavelength located within the CROW transmission band, and a silicon digital charge-coupled device/CMOS camera for recording the light scattering patterns. This is in sharp contrast with the conventional optical microcavity-based sensing methods that impose a strict requirement of spectral alignment with a high-quality cavity resonance using a wavelength-tunable laser. Our experimental results using a SiN CROW sensor with eight coupled microrings in the 680 nm wavelength reveal a cladding refractive index change of ~1.3 × 10⁻⁴ refractive index unit (RIU), with an average sensitivity of ~281 ± 271 RIU−1 and a noise-equivalent detection limit of 1.8 × 10⁻⁸ ~ 1.0 × 10⁻⁴ RIU across the CROW bandwidth of ~1 nm.
Introduction
In recent years, the increasing demands of medical diagnostics outside a clinic or a laboratory and self-monitoring for personal healthcare have highly motivated the rapid research and development of portable, low-cost biochemical sensors (Estevez et al., 2012). Particularly, miniaturized, label-free biochemical sensors are highly desired in order to be readily deployed at or carried to the sensing environment and to readout in real-time, quantitative biochemical information about the environment (Vollmer et al., 2008). Among various demonstrated chip-scale photonic biochemical sensors, optical microresonator-based biosensors featuring optical resonances with a high quality (Q) factor (103 ~ 104) promise a high sensitivity [few tens to hundreds of nanometer resonance shift per refractive index unit (RIU)], a low detection limit (10−7 ~ 10−4 RIU) and a compact footprint (few to hundreds of micrometer square) (De Vos et al., 2007; Ciminelli et al., 2013; Sedlmeir et al., 2014). However, such high-Q microcavity-based sensors working in the spectral domain are constrained by a narrow resonance bandwidth as the sensing window, which requires a strict resonance alignment and thus may compromise the reliability of the sensor system. Besides, the sensing implementation typically requires a precision wavelength-scanning setup, such as a wavelength-tunable laser, which may limit the portability of the sensor system.
Other than microcavity-based biochemical sensors, integrated interferometric optical biochemical sensors also attract increasing attentions. Various kinds of interferometer structures, including Mach–Zehnder interferometers (MZI) (Densmore et al., 2008; Kozma et al., 2009; Duval et al., 2013; Halir et al., 2013; Dante et al., 2015), Young interferometers (Ymeti et al., 2007), and Hartman interferometers (Xu et al., 2007) have been adopted as integrated interferometric biochemical sensors, demonstrating a high sensitivity (102 ~ 104 rad/RIU) along with a low detection limit (10−7 ~ 10−5 RIU). One key merit of such integrated interferometric sensors is that they require a relatively simple configuration, which typically comprises a fixed-wavelength laser source and a photodetector. However, these interferometric sensors are not tolerant to equipment noises that cause output intensity variations, such as laser intensity variations.
Previously, our research group has proposed a coupled-resonator optical waveguide (CROW)-based biochemical sensing scheme using what we termed “pixelized pattern detection” in the spatial domain (Lei and Poon, 2011). The scheme employs the discrete transition of the CROW eigenstate excited at a fixed laser wavelength upon a small change in the cladding refractive index, Δn, and detects the resulting change in mode-field-intensity distribution by far-field measurement of the out-of-plane elastic-light-scattering intensity patterns. Such a sensing scheme in principle only requires relatively simple optical sources and imaging systems including a fixed-wavelength laser and a camera. Recently, we have experimentally demonstrated a proof of concept of such a chip-scale CROW-based sensor on the silicon-on-insulator (SOI) platform in the 1550 nm telecommunication wavelengths (Wang et al., 2014). We have extended the scheme by detecting the continuous modulation of the CROW mode-field-intensity distribution at a fixed wavelength upon a Δn by correlating the elastic-light-scattering patterns with reference patterns at the CROW eigenstates. Compared with interferometric sensors, the correlation analysis allows our sensing scheme to be more tolerant to equipment noises that are common to all pixels of the CROW sensor yet do not cause a spectral shift, including laser intensity variations. Our previous experiment demonstrated a Δn of ~1.5 × 10⁻⁴ RIU and a noise-equivalent detection limit (NEDL) of 2 × 10⁻⁷ ~ 9 × 10⁻⁴ RIU. However, the choice of the SOI platform and the experimental setup configuration (including a 1550 nm laser, an optical amplifier and an InGaAs camera) render our previous work not practical for point-of-care optical biochemical sensing applications. Particularly, in order to leverage the wide availability of smartphones for biochemical sensing (Lakshminarayanan et al., 2015), it would be advantageous to switch the operational wavelength of the sensor from the telecommunication wavelengths to the visible or near-infrared wavelengths that can be readily recorded using high-resolution silicon charge-coupled device (CCD)/complementary metal-oxide-semiconductor (CMOS) cameras.
In this paper, we report our experimental demonstration of the CROW-based biochemical sensors in the visible wavelengths in the silicon-nitride (SiN) platform. The SiN platform is transparent to the visible and near-infrared wavelengths (Gorin et al., 2008; Subramanian et al., 2013) and its fabrication process is CMOS-compatible. After the CROW calibration steps, our sensing scheme in principle only requires a fixed-wavelength, low-output-power, visible laser source, and a silicon CCD/CMOS camera for recording out-of-plane light-scattering patterns from the top-view. This offers a promising opportunity to integrate the CROW sensor with a smartphone that is equipped with a compact laser source and a high-resolution camera with a properly designed optical interface for future smartphone-based point-of-care applications.
Principle and Methods
Principle and the Sensing Algorithm
Figure 1 illustrates the principle of the CROW-based biochemical sensor following our previous work (Wang et al., 2014). Here, we outline the key concepts of the principle for understanding this work. Figure 1A schematically shows a SiN CROW sensor comprising eight coupled microring resonators with identical design, coupled to input and output bus waveguides in an add-drop filter configuration. For a perfect CROW comprising C coupled identical single-mode resonators, the inhomogeneously broadened transmission spectrum features a combination of split mode resonances, with each mode slightly shifted from the original resonance frequency due to inter-cavity-coupling effect. Therefore, the eigenstate number N within each transmission band always equals to the resonator number C. While a perfect CROW exhibits distinctive mode-field-amplitude distributions at eigenstates, the pair of symmetric and anti-symmetric split-modes at different eigenfrequencies have non-distinctive mode-field-intensity distributions. In practice, a CROW inevitably suffers from fabrication imperfections. The coupled resonators are no longer identical nor are identically coupled. The symmetry breaking between the pair of symmetric and anti-symmetric split-modes therefore results in distinctive mode-field-intensity distributions at all discernable eigenstates. The resulting phase disorders and coupling disorders can result in the split mode resonances to be spectrally overlapped. Therefore, in the presence of structural non-uniformity, N could be equal to or smaller than C (N ≤ C).
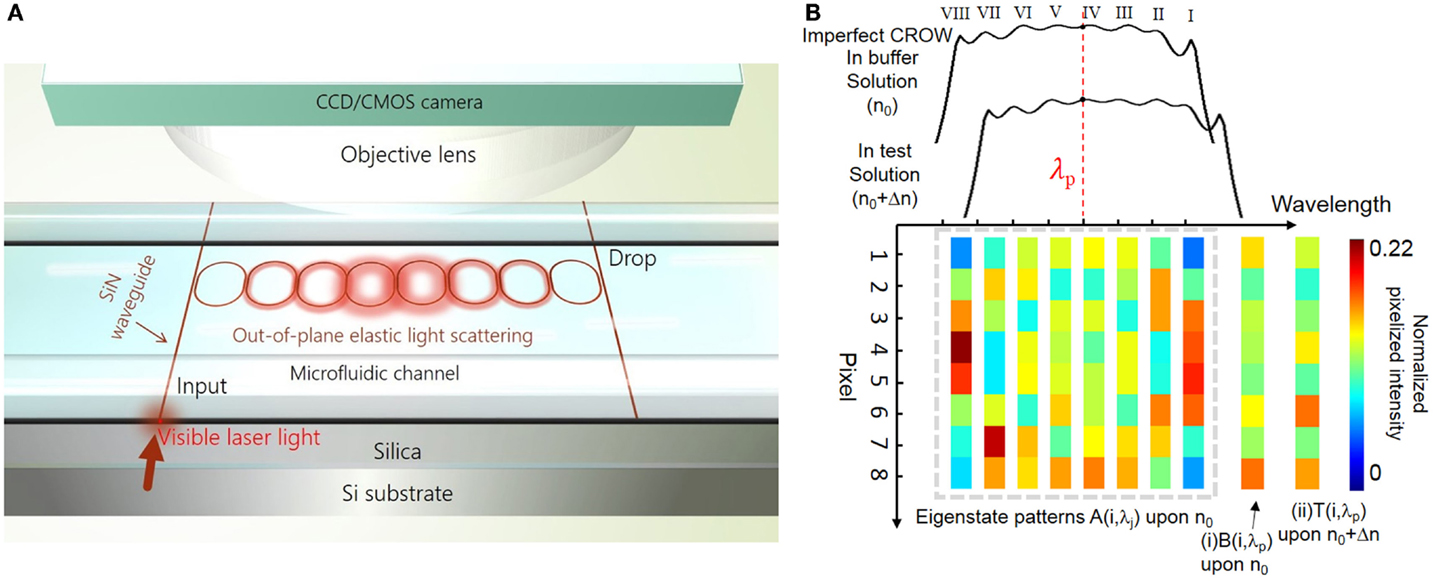
Figure 1. Principle of SiN CROW-based biochemical sensors using out-of-plane elastic light scattering at the visible wavelengths. (A) Schematic of a SiN CROW-based sensor integrated with a microfluidic channel. An objective lens and a CMOS/CCD camera are applied on top of the optofluidic chip in order to image the out-of-plane elastic-light-scattering pattern. (B) Illustration of characterizing an imperfect eight-microring CROW, including the inhomogeneously broadened transmission bands upon a buffer solution (n0) and a test solution (n0 + Δn), and pixelized mode-field-intensity distributions at eigenstate wavelength λj upon n0, A(λj). Insets: pixelized mode-field-intensity distributions at probe wavelength, λp, (i) upon n0 [B(λp)]; and (ii) upon n0 + Δn [T(λp)].
Figure 1B schematically illustrates the inhomogeneously broadened transmission bands upon applying cladding refractive indices n0 and n0 + Δn, for an imperfect eight-microring CROW exhibiting a complete set of eight distinctive eigenstate mode-field-intensity distributions. With the mode-field intensity of each microring integrated as a pixel, we denote the pixelized one-dimensional pattern at the eigenstate as {Aj}, with j indexing the eigenstate. Any mode-field-amplitude distribution at an arbitrary wavelength, λp, within the CROW transmission band upon n0 can be expressed by a linear superposition of the complete set of eigenstate mode-field-amplitude distributions upon n0. Therefore, we are able to uniquely identify any pixelized mode-field-intensity profile at λp upon n0, B(λp), as shown in inset (i), with {Aj} by a correlation analysis. Upon a small Δn applied homogenously to the cladding, we can uniquely identify by the correlation analysis any pixelized mode-field-intensity distribution at λp upon n0 + Δn, T(λp), as shown in inset (ii), with {Aj}.
As in our previous work (Wang et al., 2014), we adopt the Pearson’s correlation coefficient, ρ, in order to analyze the degree of correlation between a pixelized pattern at an arbitrary probe wavelength λp, B(λp), and the pixelized patterns at the eigenstate wavelengths λj, A(λj). For a CROW with a number of coupled single-mode cavities, C, and a number of discernable eigenstates, N (≤C), we define ρ at λp for A(λj) as follows:
where j = 1, 2, …, N is the eigenstate number, and i = 1, 2, …, C is the cavity (pixel) number. A(i, λj) and B(i, λp) are the pixel values normalized to the total intensity of the entire patterns, respectively. The bar sign denotes the mean of the entire pixelized pattern over C pixels.
We adopt the Pearson’s correlation coefficient approach to describe the linear dependence of the measured and calibrated intensity distributions. The Pearson’s correlation approach is insensitive to both level and scale variations of the intensity distributions. Therefore, the approach is tolerant to equipment noise sources, such as uniform background light imaged onto the camera and the intensity variation of the laser source, which are common to all pixels and do not cause a spectral shift. However, this approach still suffers from the noises that cause a spectral shift, such as a wavelength drift of the laser source and thermal variations in the test environment.
Here, we detail our sensing algorithm following our previous work (Wang et al., 2014). Figure 2 shows a flow chart illustrating our sensing algorithm including calibration. We first generate a library of correlation coefficients , defined at a fixed reference wavelength λ0 centered at the CROW transmission band. The library is calibrated over a range of Δn values, Δnd, given by an integer multiple of a minimum refractive index change interval Δni. The thus comprises a library of data array of N (rows) × M (columns), where M is given by Δnd/Δni.
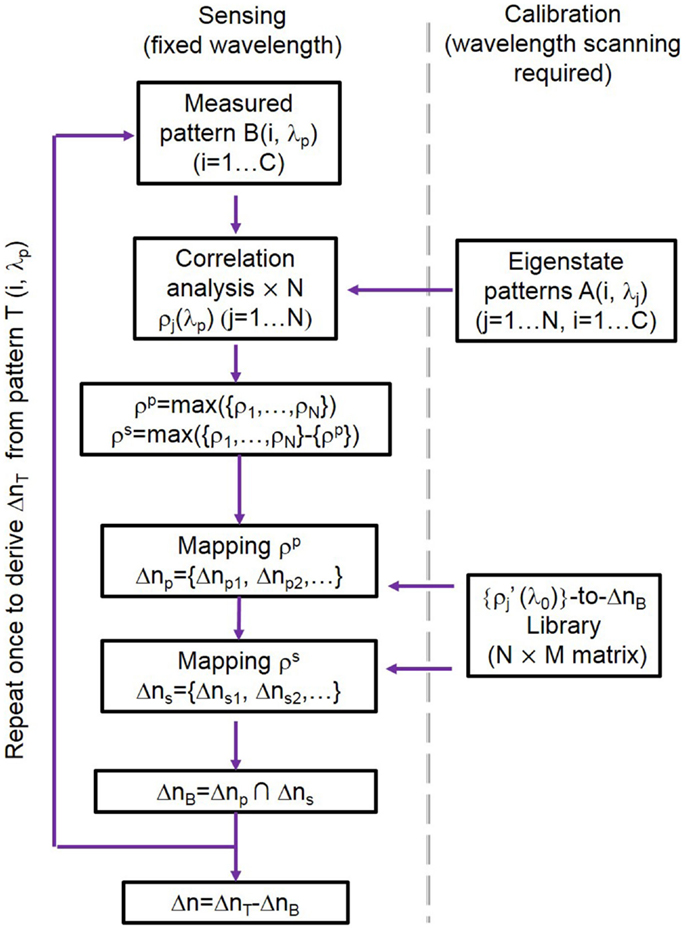
Figure 2. A flow chart showing the sensing algorithm including calibration of CROW-based sensors.
For sensing, we first measure the pixelized mode-field-intensity pattern in a buffer solution at a fixed probe wavelength λp (which is generally offset from λ0) as B(λp) (Figure 1B). We correlate B(λp) with the eigenstate patterns {Aj} in order to extract {ρj(λp)}. We look for the closest match of {ρj(λp)} with the library , using only the principal (largest) component, ρp, and the second-principal (second-largest) component, ρs, of {ρj(λp)} in order to streamline the pattern recognition process (Wang et al., 2014). We thus obtain a unique equivalent refractive index change for the buffer solution, ΔnB, which is only due to the offset between λp and λ0. We repeat the same procedure for measuring the pattern at λp upon the test solution, T(λp), and obtain another unique equivalent refractive index change ΔnT. Finally, we obtain Δn = ΔnT − ΔnB.
Transfer-Matrix Modeling of Imperfect CROW Sensors
We model imperfect SiN CROWs in 680 nm wavelengths using transfer-matrix method with empirical inputs (Wang et al., 2014) (see Supplementary Materials S1 and S2). We measure and accumulate statistics of the measured waveguide widths and coupling gap widths from scanning-electron microscope (SEM) characterization of our fabricated devices. We sample six waveguide widths and three coupling gap width in one coupling region, and measure a total of eighteen coupling regions in two representative eight-microring CROW devices (see Supplementary Material S3). The statistics of the waveguide widths and the coupling gap widths approximately follow two Gaussian distributions. We extract the fabricated waveguide width of 427.5 ± 1.1 nm and coupling gap spacing of 129.1 ± 1.0 nm. In the modeling, we assume that the two Gaussian distributions are independent, and we generate a set of varied waveguide widths and coupling gap spacing randomly distributed across the CROW using the Gaussian number generator in Matlab.
We study the effects of these empirical inputs on the device parameters, including the waveguide effective refractive index, neff, and the inter-cavity coupling coefficient, κ. We calculate using the numerical finite-element method (FEM) (COMSOL RF module) the neff of a SiN channel ridge waveguide for the transverse-magnetic (TM)-polarized mode, as a function of waveguide width around 427.5 nm at a fixed waveguide height of 300 nm upon a water upper-cladding. We adopt the measured material refractive index of the deposited 300 nm-thick SiN film as a function of wavelength using ellipsometry. The mean value of the calculated neff is 1.5994 ± 0.0003 at 686 nm. We choose the TM polarization mode in order to obtain a large evanescent field exposure near the waveguide top surface for better light–analyte interaction. We calculate the coupling coefficient in each directional coupling region as a function of the coupling gap spacing, assuming the waveguide width is fixed at 427.5 nm. We estimate the waveguide propagation loss upon a water upper-cladding to be relatively high at ~17 dB/cm based on our measurements. We attribute this primarily to surface-roughness-induced scattering losses from the waveguide sidewall. We apply the designed racetrack arc radius and interaction length into the modeled CROW. We find from our FEM calculations a linear relationship between Δn and the resulting effective refractive index change Δneff, which we apply to our transfer-matrix modeling (see Supplementary Materials S1 and S2).
Device Fabrication
We fabricate the CROW devices in a 4″ silicon wafer. The silicon wafer is first grown with a ~2 μm-thick thermal oxide. We grow nitrogen-rich SiN by plasma-enhanced chemical vapor deposition (PECVD) (SiH4:NH3 = 25:40 (sccm), 300°C, 13.56 MHz). The thickness of SiN layer is ~300 nm. We fabricate the CROW device pattern by electron-beam lithography (JEOL JBX-6300FS) using a positive electron-beam resist ZEP-520A. We transfer the device pattern to the SiN layer by inductively coupled plasma etching with C4F8 and SF6 gases (STS ICP DRIE Silicon Etcher). Figure 3A shows the optical micrograph of the fabricated SiN eight-microring CROW device. The racetrack microring comprises two half circles with a radius of 20 μm and two straight waveguides with an interaction length (Lc) of 4 μm. We design the waveguide width to be 450 nm and the coupling gap spacing to be 100 nm. Figure 3B shows a zoom-in-view optical microscope image of the CROW. Figure 3C shows a SEM picture of the coupling region.
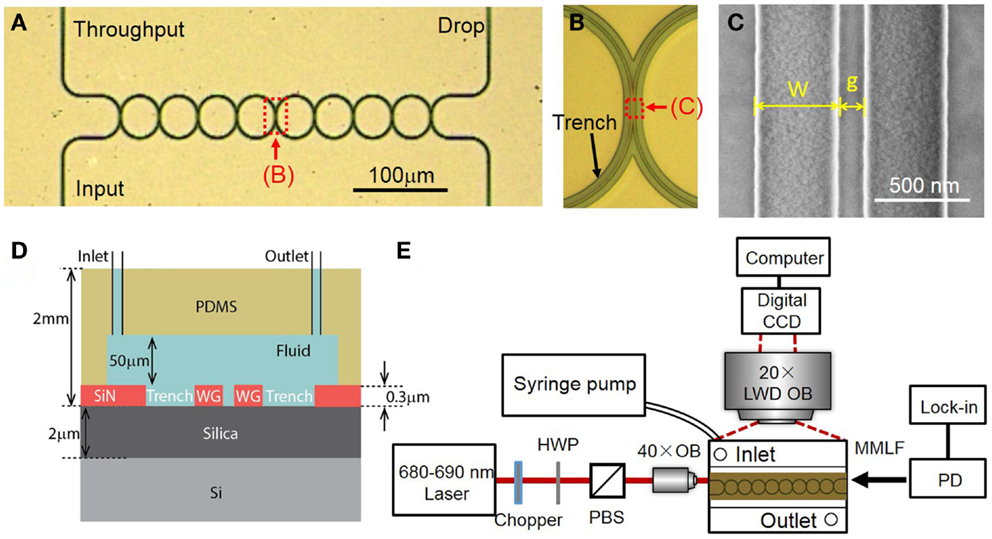
Figure 3. (A) Optical micrograph of the fabricated eight-microring CROW. (B) Zoom-in-view picture of the CROW. (C) Scanning-electron microscope image of an inter-cavity coupling region of the CROW. (D) A cross-sectional view of the SiN chip integrated with a microfluidic channel. (E) Schematic of the experimental setup. HWP, half-wave plate; PBS, polarizing beam splitter; LWD OB, long-working-distance objective lens; OB, objective lens; PD, photodetector; MMLF, multimode lensed fiber.
We fabricate a microfluidic chamber on a polydimethylsiloxane (PDMS) layer. We pattern a SU8 film by contact photolithography as a mold in order to form the PDMS microfluidic channel by imprinting. The designed dimension of microfluidic channel is 8 mm × 2 mm × 50 μm (length, width, and height). We use a puncher to make two holes, each with a diameter of 1 mm, as an inlet and outlet for solution delivery. The diced silicon chip and the PDMS microfluidic layer are treated with oxygen plasma and directly bonded, with the microfluidic channel encompassing the CROW sensor. The bonded PDMS–SiN interface is stable enough for repeating the sensing experiments for many times under a relatively high fluidic pump pressure. Figure 3D schematically shows the cross-sectional view of the optofluidic chip.
Experimental Method
Figure 3E schematically shows the experimental setup. The wavelength-tunable laser light in the 680 nm wavelengths is end-fired into a tapered 3 μm-wide SiN waveguide through an objective lens (NA = 0.65). The laser power before coupling into the chip is ~2 mW. The polarization is controlled by a half-wave plate before a polarizing beam splitter. The output light from the throughput- or drop-port is collected using a multimode lensed fiber to a silicon power meter and a lock-in amplifier.
For elastic-light-scattering pattern imaging from the top view, we use a long-working-distance microscope objective lens (20× Mitutoyo Plan Apo, NA = 0.42) and a CCD camera (Diagnostic Instruments, Inc., RT3) with 1600 × 1200 pixels (7.4 μm-sized pixels). The camera has an effective differential cooling of −43°C and an 8-bit analog-to-digital conversion in data readout. We fix the exposure time as 60 ms and the gain of ~1. For background subtraction, we set the probe wavelength in between the CROW transmission bands in order to obtain a background image.
In order to acquire the library of calibrated correlation coefficients, we scan the laser wavelength in steps of 0.02 nm over ~2 free spectral ranges (FSRs) of the CROW sensor. We record at each wavelength eight successive images over a time period of 4 s (at 2 frames/s). We take average of these successive images in order to reduce the systematic equipment noise contribution. In the sensing tests, we inject the buffer and test solutions, and start recording the images after the scattering pattern is stabilized upon an essentially static fluidic medium. We record over 50 successive images during a time period of 25 s at a fixed probe wavelength.
In order to calibrate the spectral sensitivity of the CROW, we prepare NaCl solutions with mass concentrations from 1 to 5% (in steps of 1%) and test the transmission band spectral shifts upon a Δn. Between each measurement, we rinse the chip by injecting deionized (DI) water using a fluidic pump. We obtain the resonance spectral shifts by fitting the throughput-transmission spectra with a sum of multiple inverted Lorentzian lineshapes, each centered at the resonance (eigenstate) wavelength. The overall transmission band shift is taken as the average value of the spectral shifts of all the eigenstates.
Results
Modeling Results
Figure 4 shows the modeling results for N = C (see Supplementary Material S4 for modeling results corresponding to the case N < C). Figure 4A schematically shows an imperfect SiN CROW with varied waveguide width and coupling gap width of each microring. Inset shows the numerically calculated waveguide mode-field-amplitude profile in the TM mode at 686 nm wavelength. Figure 4B shows the modeled throughput- and drop-transmission spectra of an imperfect eight-microring CROW. We define the CROW transmission bandwidth, ΔλBW, as the spectral range between the first and last discernable eigenstates within the transmission band. Figure 4C shows the modeled pixelized patterns at the eight eigenstates. Figure 4D shows the calculated library as a function of Δn, with Δnd = 2.523 × 10⁻² and Δni = 3.6 × 10⁻⁴ RIU. Figure 4E shows the calculated differential correlation coefficients per unit Δn, given as .
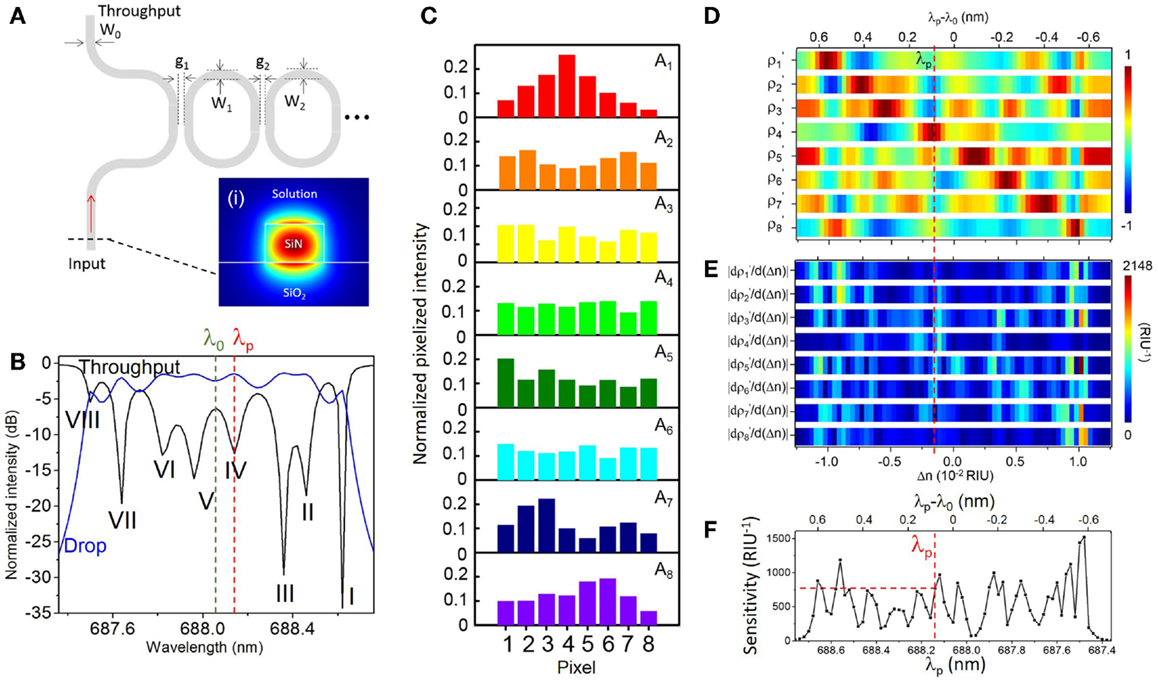
Figure 4. (A) Schematic of an imperfect CROW model with non-uniform waveguide widths (W0, W1, W2, … WN+1) and coupling gap spacing (g1, g2, … gN+1). Inset (i): numerically calculated waveguide mode-field amplitude profile in the TM mode. (B) Modeled throughput- and drop-port transmission spectra of an imperfect eight-microring CROW using transfer-matrix modeling. Green and red dashed-lines indicate the reference wavelength λ0 of 688.06 nm and the probe wavelength λp of 688.14 nm, respectively. (C) Modeled normalized pixelized intensity patterns at the eight eigenstates, I–VIII. (D) Calculated library of the correlation coefficients ρ1′− ρ8′ as a function of Δn at λ0, with Δnd = 2.523 × 10⁻² and Δni = 3.6 × 10⁻⁴ RIU. (E) Calculated library of the differential correlation coefficients as a function of Δn at λ0, given as . (F) Calculated sensitivity as a function of λp. The red dashed-line indicates a sensitivity of 772 RIU−1 at λp = 688.14 nm.
We define the CROW sensitivity (in units of RIU−1) at an arbitrary λp within the transmission band as the larger of the ρp and ρs. Figure 4F shows the modeled sensitivity as a non-linear function of λp. The sensitivity in the transmission band spans a range from ~73 to ~1440 RIU−1, with an average sensitivity of ~553 ± 290 RIU−1. We quantify the non-uniformity of the sensitivity by the ratio of SD value to average sensitivity value. A lower ratio value suggests a more uniform sensitivity. The extracted non-uniformity ratio from Figure 4F is ~0.52. Although such a sensitivity variation is not ideal, we can obtain a practical sensitivity within a wide enough wavelength window without fine-tuning the probe wavelength. As an example, we can set a practical sensitivity of ~100 RIU−1 in order to sense a Δn down to 10−5 RIU (assuming a noise-induced uncertainty of correlation coefficients of ~±10−3). From Figure 4F, the width of the probe wavelength window with a sensitivity >100 RIU−1 is 1.1 nm. We consider this sufficiently wide for sensing with a practical sensitivity at an arbitrarily set probe wavelength. If a higher practical sensitivity of, say, 200 RIU−1 is desired, the width of the probe wavelength window with a sensitivity >200 RIU−1 narrows to ~1.06 nm.
Here, we arbitrarily choose λp at 688.14 nm near the center of the CROW transmission band (Figure 4B) in order to model the sensing test. The sensitivity at λp is ~772 RIU−1. Figure 5 illustrates the modeled sensing results. Figure 5A shows the modeled pixelized patterns at λp, B(λp) and T(λp), assuming a water buffer (n0 = 1.331) and an arbitrarily chosen Δn value of 2.50 × 10⁻³ RIU, respectively. Figure 5B shows the two sets of correlation coefficients extracted from the two modeled pixelized patterns without and with Δn. The ρp and ρs without Δn are ρ4 and ρ5, respectively. The ρp and ρs with Δn are ρ5 and ρ3, respectively. Figures 5C,D show the zoom-in view of the calculated library as a function of Δn. Insets show the detailed mappings of ρp and ρs with the library. We extract using linear interpolation from the library Δn = ΔnT − ΔnB = 2.52 × 10⁻³ RIU, which agrees with the arbitrarily chosen Δn value. We attribute the deviation of 2 × 10⁻⁵ RIU to the interpolation error. In principle, the maximum error upon the sampling interval in the library is given by ± Δni/2, which is ~1.8 × 10⁻⁴ RIU given the assumed Δni value.
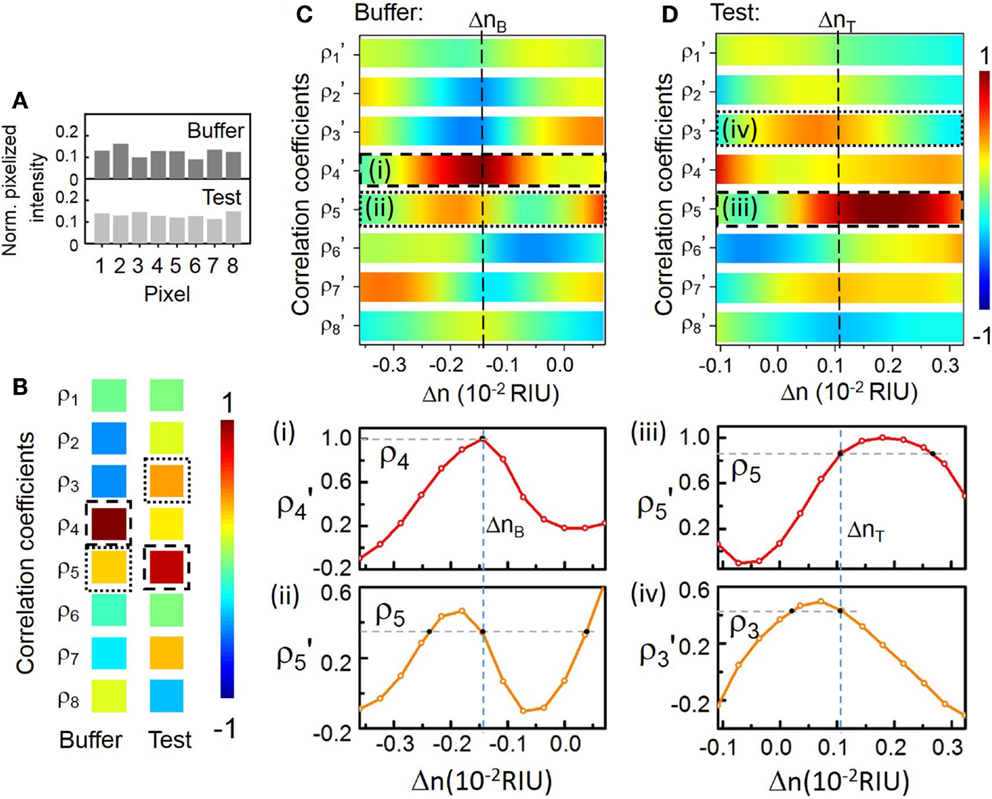
Figure 5. (A) Modeled normalized pixelized patterns at λp (688.14 nm) upon n0 and n0 + Δn. (B) Calculated correlation coefficients at λp = 688.14 nm upon n0 and n0 + Δn. The dashed-line and the dotted-line boxes indicate ρp and ρs, respectively. (C,D) Zoom-in view of the calculated library of ρj′ as a function of Δn. Dashed-lines indicate the mapping of ΔnB, ΔnT for buffer solution and test solution, respectively. Insets (i)–(iv): Mapping of ρp and ρs with the library to extract ΔnB and ΔnT.
Calibrating the CROW Sensor in a Buffer Solution
Figure 6 summarizes the characterization results upon a buffer solution (DI water). Figure 6A shows the measured TM-polarized transmission spectra with DI water upper-cladding. The measured FSR of ~1.80 nm is consistent with the microring circumference. The CROW exhibits an inhomogeneously broadened transmission band, with a ΔλBW of ~1.10 nm. We discern eight eigenstates within each transmission band (labeled by I to VIII for the first transmission band, and I′–VIII′ for the second transmission band in Figure 6A).
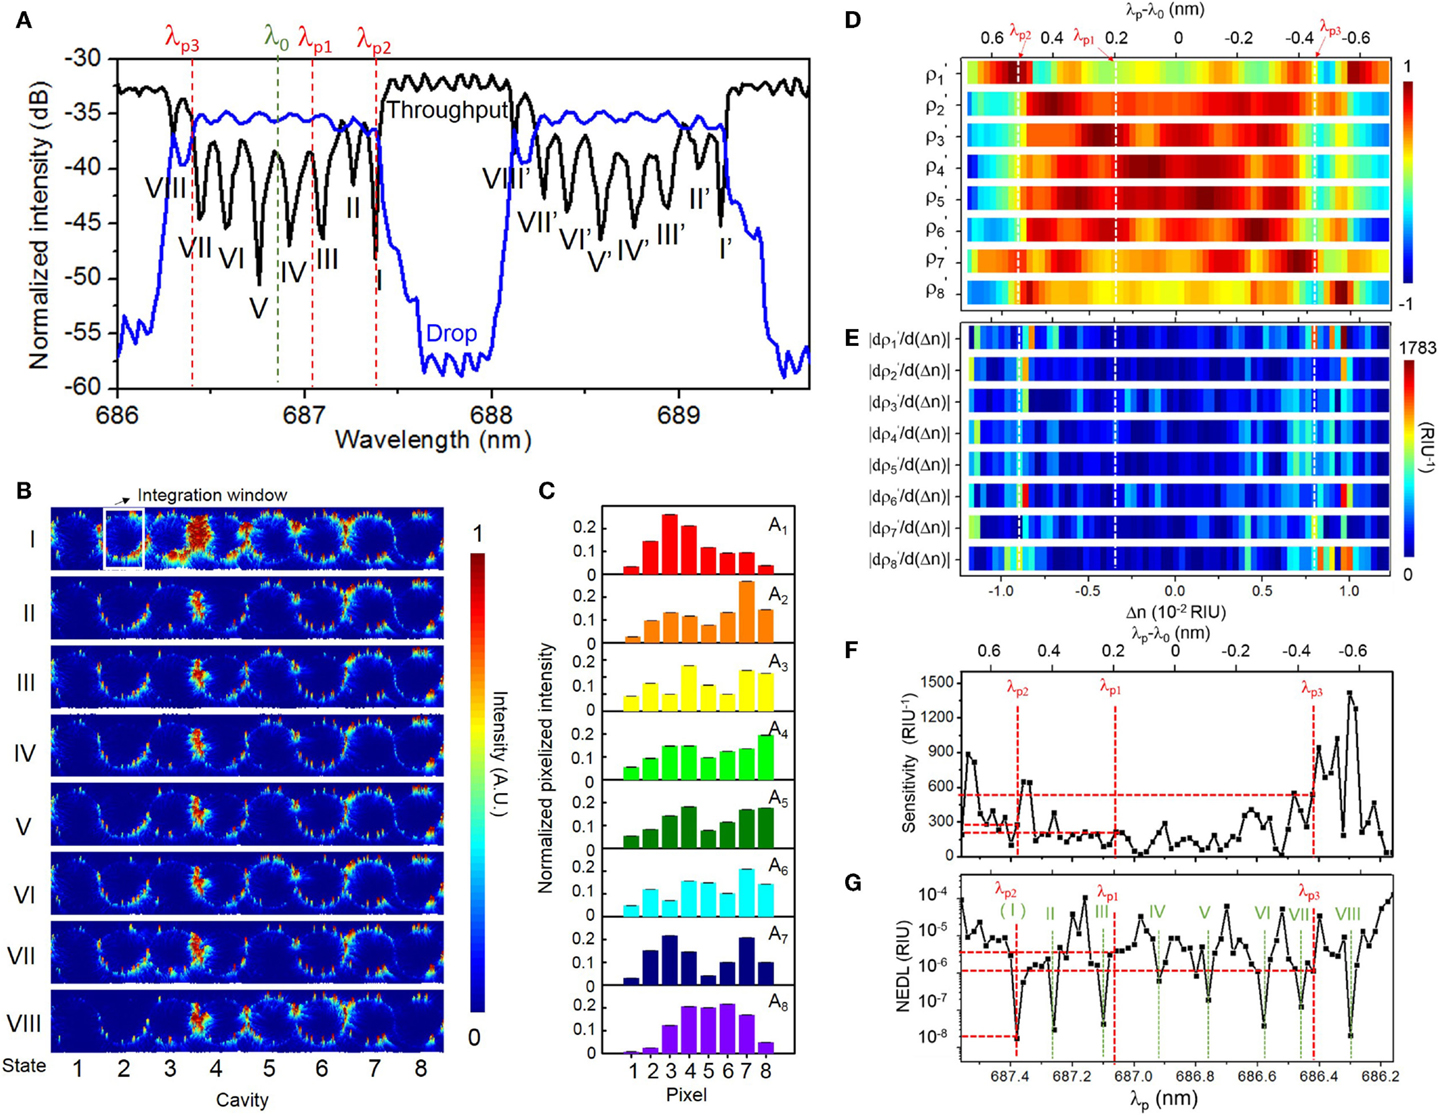
Figure 6. (A) Measured TM-polarized throughput- and drop-port transmission spectra of the eight-microring SiN CROW with DI water upper-cladding. Green and red dashed-lines indicate the reference wavelength λ0 (686.86 nm) and three probe wavelengths, λp1 (687.06 nm), λp2 (687.38 nm), and λp3 (686.42 nm). (B) Measured elastic-light-scattering images with DI water upper-cladding at the eight eigenstates I–VIII. The white-line box indicates the integration window for pixelization. (C) Normalized pixelized mode-field intensity patterns at the eight CROW eigenstates I–VIII. (D) Calculated library of the calibrated correlation coefficients as a function of Δn. White dashed-lines indicate the ΔnB values at λp1, λp2, and λp3. (E) Calculated differential correlation coefficients as a function of Δn, given as . (F) Calculated sensitivity as a function of λp. Red dashed-lines indicate sensitivities of 214, 279, and 541 RIU−1 at probe wavelengths λp1, λp2, and λp3, respectively. (G) Extracted noise-equivalent detection limit (NEDL) as a function of λp. Red dashed-lines indicate NEDL values of ~4 × 10⁻⁶, ~2 × 10⁻⁸, and ~1 × 10⁻⁶ RIU at λp1, λp2, and λp3, respectively. Green dashed-lines indicate the eight eigenstate wavelengths λj.
Figure 6B shows the measured elastic-light-scattering images at eigenstates I–VIII. We observe a non-uniform scattering image profile across each microring. We attribute this to the extra modulation of the surface roughness and local defects to the intrinsic mode-field-intensity distributions. We notice an obvious “local hotspot” in the coupling region between microring 3 and microring 4 in all the light-scattering images. We attribute that to the larger surface roughness localized in the coupling region between microring 3 and microring 4. We integrate within a certain window the elastic-light-scattering intensity of each microring to form a single pixel. The window excludes the coupling region in order to avoid scattering-induced crosstalks between the coupled waveguides and local hotspots. Here we normalize the patterns with the estimated contributions of the surface-roughness-induced scattering as a step for pattern correction (see Supplementary Material S5). Figure 6C shows the corrected pixelized mode-field-intensity patterns at the eight eigenstates. We use the corrected pixelized patterns for sensing.
Figure 6D shows the measured library of the calibrated correlation coefficients as a function of Δn. Here, we calibrate the sensor by scanning the laser wavelength over ±Δλ (Δλ = 0.7 nm) about the center of the CROW transmission band spanning a FSR upon a fixed buffer solution (DI water), with a minimum wavelength step of 0.02 nm. This interval corresponds to a Δni of ~3.5 × 10⁻⁴ RIU, based on the calibrated linear spectral sensitivity of ~57.30 nm/RIU of the CROW sensor (see Supplementary Material S6). We also convert Δλ back to Δn using the calibrated linear spectral sensitivity. The corresponding range of Δnd is ~±1.2 × 10⁻² RIU.
Figure 6E shows the calculated as a function of Δn. Figure 6F shows the calculated sensitivity as a function of λp over the λ0 ± Δλ range. The calculated sensitivity value shows highly non-uniform profiles. The sensitivity ranges from ~15 to ~1420 RIU−1, with an average value of ~281 ± 271 RIU−1. The extracted non-uniformity ratio from Figure 6F is ~0.96. The width of the probe wavelength window with a sensitivity >100 RIU−1 is 0.88 nm. Whereas, the width of the probe wavelength window with a sensitivity >200 RIU−1 narrows to ~0.48 nm, which is still relatively tolerant to set a probe wavelength. In conventional microcavity-based sensing methods, the sensitivity is only applicable within the high-Q transmission band (~0.1 nm in De Vos et al., 2007), which is generally much narrower than our probe wavelength window.
We define the NEDL at λp as the uncertainty of extracted Δn. We repeat the extraction of Δn values based on ρp and ρs at each λp for eight times and calculate the SD of the eight extracted Δn values. Figure 6G shows the extracted NEDL values as a function of λp, which shows a high dependence on the choice of λp. The NEDL values range from ~2 × 10⁻⁸ to ~1 × 10⁻⁴ RIU. We observe particularly low NEDL values (~10−8 RIU) at λp aligning with the eigenstate wavelengths. We attribute the low NEDL at each eigenstate to the particularly low uncertainty of ρp (~±10−6 − 10−4) close to 1 at each eigenstate. Upon eight repeated tests at a fixed probe wavelength at each eigenstate, the measured pixelized patterns only slightly deviate from the calibrated eigenstate distributions due to the low noise in the cooled silicon CCD camera and the low thermo-optic coefficient of SiN. The low uncertainties of ρp at each eigenstate are converted into particularly low NEDL values.
In order to quantify the sensing resolution, here we define the resolution of the CROW sensor as the lowest refractive index change that can be sensed reliably and repeatedly. In practice, there are two main limiting factors to the resolution. One is the interpolation error in extracting Δn. The other is the NEDL taking into account all the noise sources that our correlation approach is not tolerant to. Therefore, given a calibration interval of Δni (3.5 × 10⁻⁴ RIU), the worst resolution is ~1.8 × 10⁻⁴ RIU given ± Δni/2 (1.8 × 10⁻⁴ RIU) and the NEDL (~1.8 × 10⁻⁸ − 1.0 × 10⁻⁴ RIU in Figure 6G). The interpolation-error-limited resolution (±Δni/2) suggests that a Δn below Δni/2 may not be tested reliably or repeatedly. The resolution can be improved by adopting a finer Δni.
We also calibrate the CROW sensor in the adjacent transmission band (see Supplementary Material S7). The pixelized mode-field intensity patterns at eigenstates I′–VIII′ show a high similarity with the corresponding patterns at eigenstates I–VIII, respectively. The extracted sensitivity and NEDL range are both close to the calibrated results of the first transmission band.
Blind Sensing Test Results
We implement blind sensing tests at three different probe wavelengths (λp1, λp2, and λp3) within the CROW transmission band. We prepare one buffer solution (DI water) and three NaCl solutions, X, Y, and Z, with different mass concentration values unknown to the researcher conducting the sensing tests. We study the images upon the buffer solution at the initial stage and upon rinsing after each sensing test. We confirm that the pixelized pattern returns to the baseline pattern (see Supplementary Material S8). Table 1 summarizes the experimental sensing results.
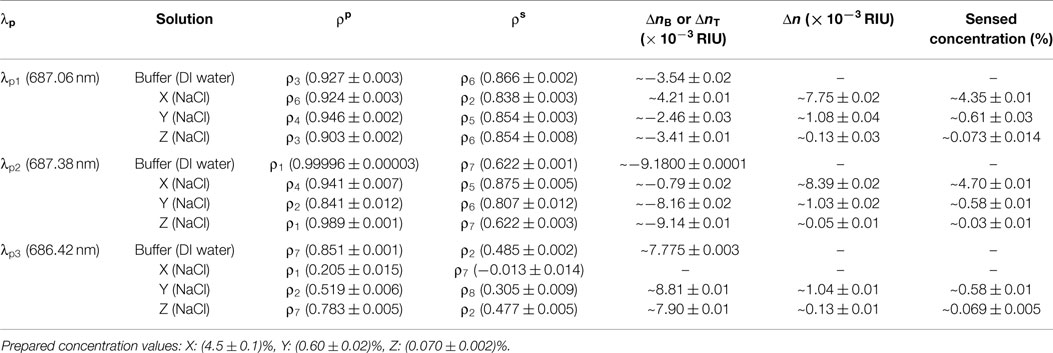
Table 1. Sensing results at the three probe wavelengths upon the buffer solution and the three test solutions.
Sensing at an Arbitrarily Set Probe Wavelength λp1
Figure 7 shows the sensing results at an arbitrarily set probe wavelength λp1 (687.06 nm) near the center of the CROW transmission band. The sensitivity at λp1 is ~214 RIU−1 (see Figure 6F). The NEDL at λp1 is ~4 × 10⁻⁶ RIU (see Figure 6G). Figure 7A shows the measured elastic-light-scattering images of the CROW upon the buffer solution and the three test solutions at λp1. Figure 7B shows the corresponding pixelized patterns. Figure 7C shows the corresponding calculated correlation coefficients. Figures 7D–G show the mapping of ρp and ρs in the buffer solution and the three test solutions with the library. Insets (i)–(viii) show the mapping ρp and ρs to the corresponding ΔnB or ΔnT using linear interpolations in between Δni.
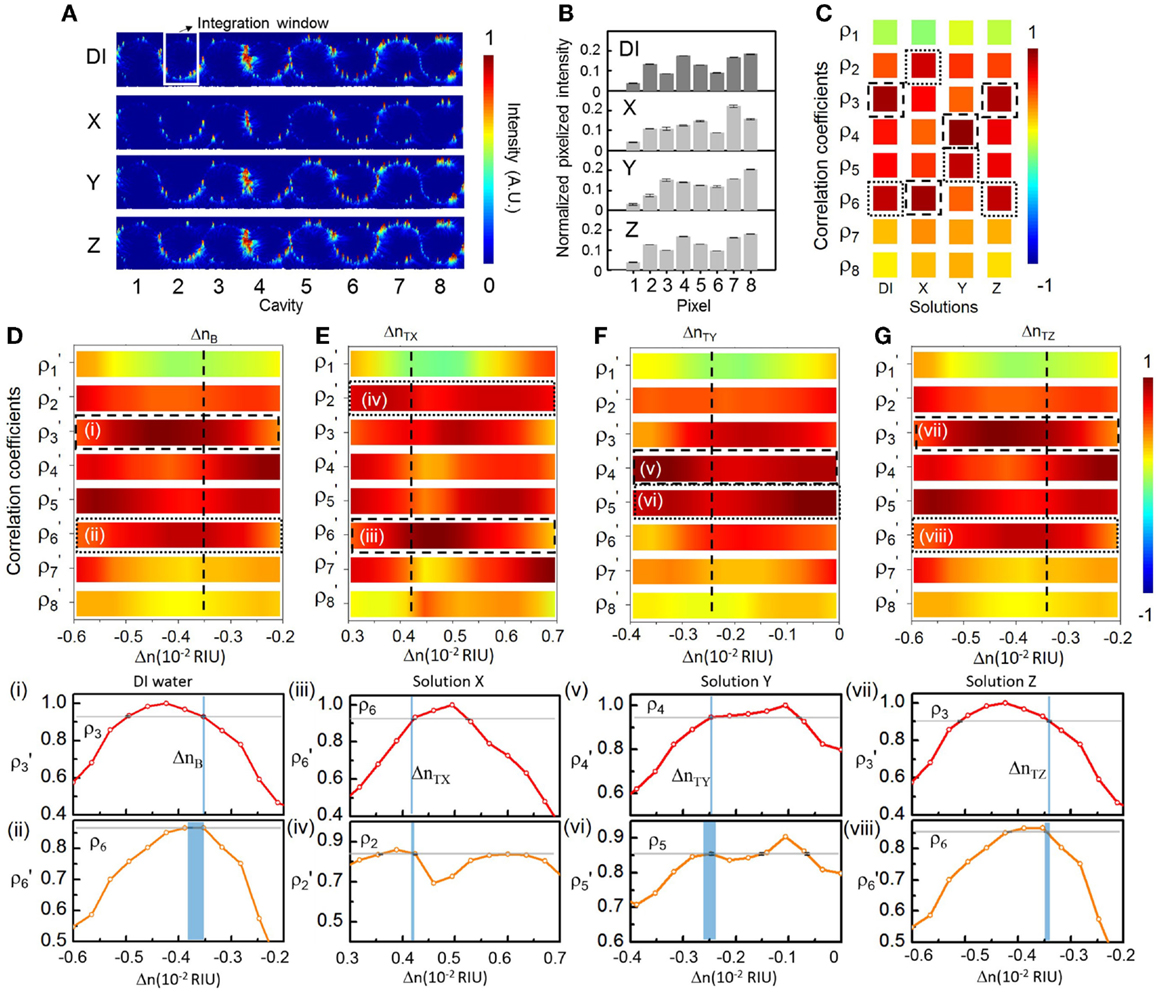
Figure 7. (A) Measured elastic-light-scattering images of CROW upon the buffer solution and the three blind-test solutions X, Y, and Z at an arbitrarily set probe wavelength λp1. The white-line box indicates the integration window for pixelization. (B) Normalized pixelized patterns upon the buffer solution and solutions X, Y, and Z at λp1. (C) Calculated correlation coefficients upon the buffer solution and solutions X, Y and Z at λp1. Dashed-line and dotted-line boxes indicate ρp and ρs, respectively. (D–G) Zoom-in view of the library to extract Δn. (D) Upon the buffer solution. (E) Upon solution X. (F) Upon solution Y. (G) Upon solution Z. Insets (i)–(viii): Mapping of ρp and ρs upon the buffer solution and solutions X, Y, and Z.
We acquire for solution X a ΔnX of ~(7.75 ± 0.02) × 10−3 RIU and for solution Y a ΔnY of ~(1.08 ± 0.04) × 10−3 RIU, both corresponding to a relatively large Δn but still within Δnd. We acquire for solution Z (Figure 7G) a ΔnZ of ~(1.3 ± 0.3) × 10−4 RIU. For all three solutions, we convert from the measured Δn values the sensed concentration values (see Table 1), which show a good agreement with the prepared values.
Sensing at λp2 Aligned with Eigenstate I
Figure 8 shows the sensing results at a specifically chosen probe wavelength λp2 (687.38 nm) aligned with eigenstate I. The sensitivity at λp2 is ~279 RIU−1 (see Figure 6F). The NEDL at λp2 is ~2 × 10⁻⁸ RIU (see Figure 6G), which is much lower compared with that at λp2. Figure 8A shows the measured elastic-light-scattering images upon the buffer solution and the three test solutions. Figure 8B shows the corresponding pixelized patterns. Figure 8C shows the corresponding calculated correlation coefficients. Figures 8D–G show the mapping of ρp and ρs values in the buffer solution and the three test solutions with the library (see Supplementary Material S9 for detailed mappings).
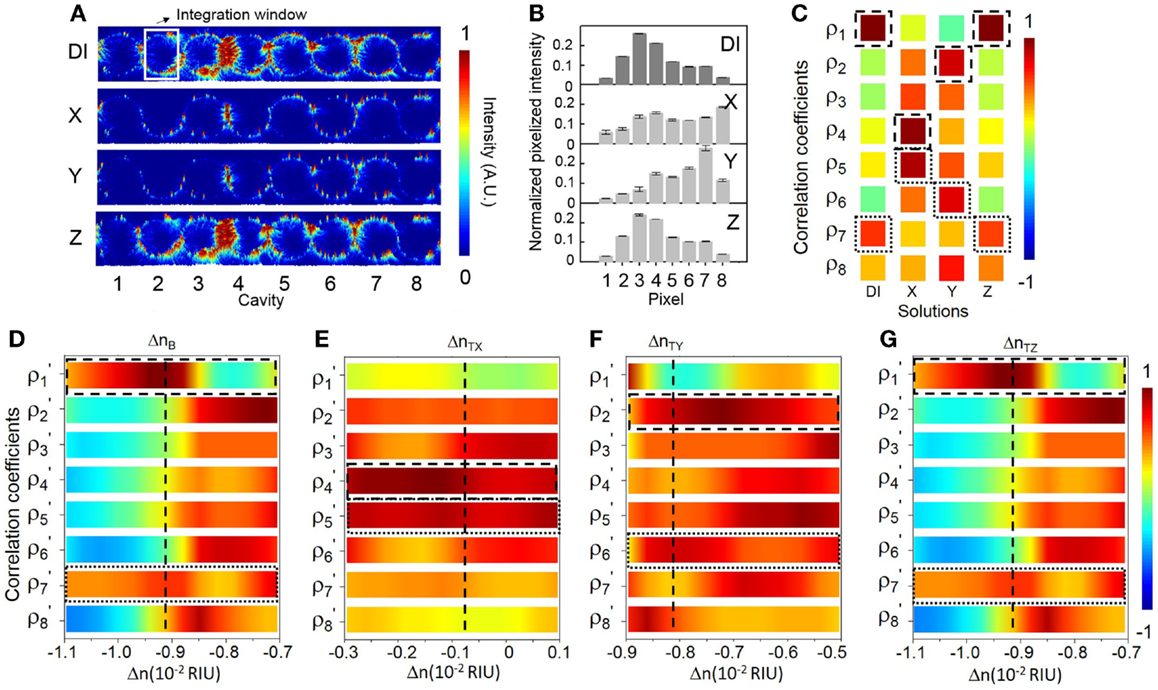
Figure 8. (A) Measured elastic-light-scattering images of CROW upon the buffer solution and the three blind-test solutions X, Y, and Z at a specifically chosen probe wavelength λp2 at eigenstate I. The white-line box indicates the integration window for pixelization. (B) Normalized pixelized patterns upon the buffer solution and solutions X, Y, and Z at λp2. (C) Calculated correlation coefficients upon the buffer solution and solutions X, Y, and Z at λp2. Dashed-line and dotted-line boxes indicate ρp and ρs, respectively. (D–G) Zoom-in view of the library to extract Δn. (D) Upon the buffer solution. (E) Upon solution X. (F) Upon solution Y. (G) Upon solution Z.
We acquire for solution X a ΔnX of ~(8.40 ± 0.02) × 10−3 RIU and for solution Y a ΔnY of ~(1.03 ± 0.02) × 10−3 RIU. Both sensing results agree with the prepared concentrations of solutions X and Y. For solution Z (Figure 8G), we acquire a ΔnZ of ~(0.5 ± 0.1) × 10−4 RIU, corresponding to a mass concentration of ~(0.03 ± 0.01)%. This, however, shows a significant deviation from the prepared concentration [~(0.070 ± 0.002)%]. We attribute this deviation to a not sufficiently fine calibration of the library and the error from linear interpolation. The calibrated response of ρp around the eigenstate is in the proximity to the maximum (unity). The limited sampling resolution of Δni may not be sufficient to describe the response around an extremum.
Sensing at λp3 Near Eigenstate VII
Figure 9 shows the sensing results at another specifically chosen probe wavelength λp3 (686.42 nm). We specifically set λp3 at the blue-edge of the transmission band near eigenstate VII. The sensitivity at λp3 is ~541 RIU−1 (see Figure 6F). The NEDL at λp3 is ~1 × 10⁻⁶ RIU (see Figure 6G). We consider λp3 as a near optimized choice with a relatively high sensitivity and a low NEDL. Figure 9A shows the measured elastic-light-scattering images upon the buffer solution and the three test solutions. Figure 9B shows the corresponding pixelized patterns. Figure 9C shows the corresponding calculated correlation coefficients. Figures 9D–F show the mapping of ρp and ρs values with the library (see Supplementary Material S9 for detailed mappings).
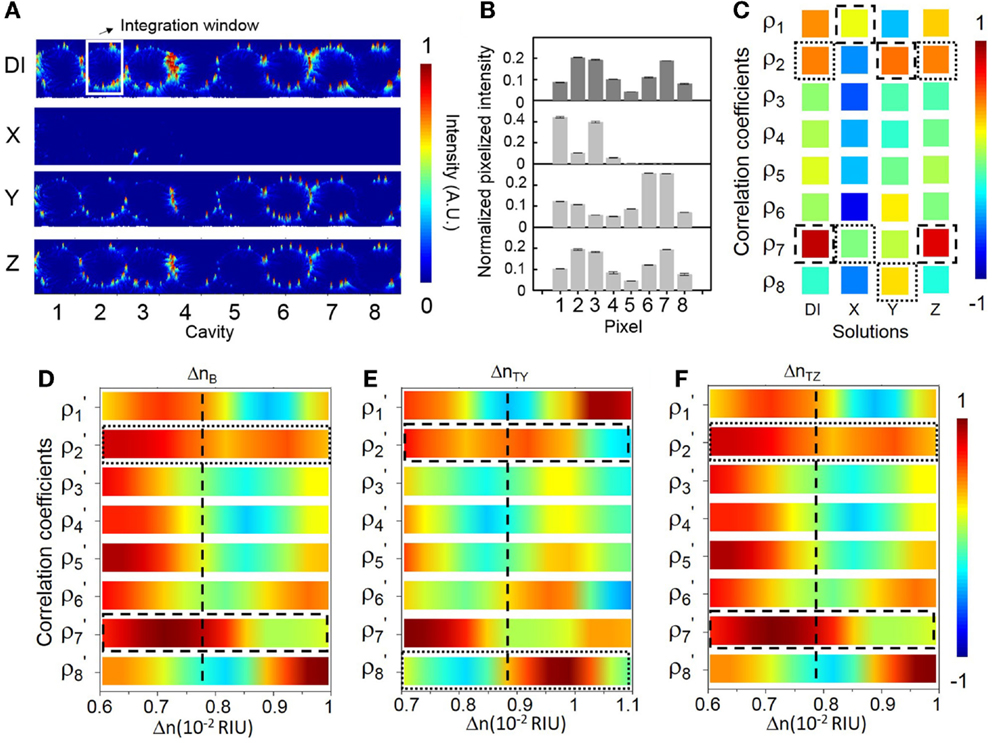
Figure 9. (A) Measured elastic-light-scattering images of CROW upon the buffer solution and the three blind-test solutions X, Y, and Z at a specifically chosen probe wavelength λp3 near eigenstate VII. The white-line box indicates the integration window for pixelization. (B) Normalized pixelized patterns upon the buffer solution and solutions X, Y and Z at λp3. (C) Calculated correlation coefficients upon the buffer solution and solutions X, Y, and Z at λp3. Dashed-line and dotted-line boxes indicate ρp and ρs, respectively. (D–F) Zoom-in view of the library to extract Δn. (D) Upon the buffer solution. (E) Upon solution Y. (F) Upon solution Z.
For solution X, however, we observe an almost dark scattering pattern, which suggests that λp3 upon solution X is relatively shifted out of the transmission band. Both the extracted ρp and ρs values out of ρj(λp3) upon solution X are particularly low. By mapping the extracted ρj(λp3) values with the library, we find no match to indicate the corresponding Δnx. Therefore, in the case that there is a chance to measure a large Δn near Δnd (in the order of 10−2 ~ 10−3 RIU in this case), it is better to position λp close to the red-side of the transmission band in order to leverage the dynamic range given by ΔλBW in full.
For solution Y, we acquire a ΔnY of ~(1.04 ± 0.02) × 10−3 RIU. For solution Z, we acquire a ΔnZ of ~(1.24 ± 0.1) × 10−4 RIU. Both sensing results agree with the prepared concentrations of solutions Y and Z. Compared with the sensing result of solution Z at λp1, we obtain a more accurate value of ΔnZ with a much improved uncertainty. We attribute this to a higher sensitivity and a lower NEDL at λp3 than those at λp1.
Discussion
Here, we benchmark our work with other silicon- and SiN-based on-chip optical biochemical sensors that have been demonstrated in recent years, including our previous work (Wang et al., 2014), as summarized in Table 2. All of the work including this work have attained a detection limit of 10−7 ~ 10−4 RIU. Two of the microcavity-based sensors (Ghasemi et al., 2013; Doolin et al., 2015) and three of the MZI-based sensors (Duval et al., 2013; Misiakos et al., 2014; Dante et al., 2015) operate on the SiN-based platform in the visible wavelengths.
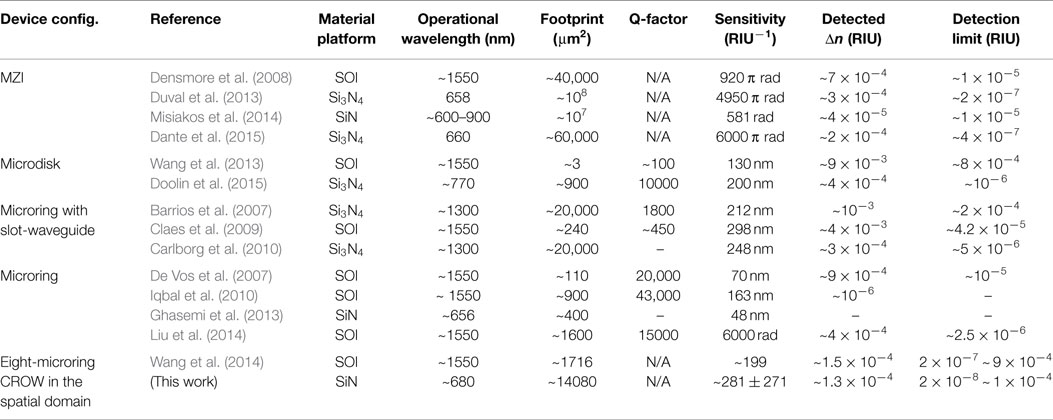
Table 2. Summary of silicon- and silicon-nitride-based on-chip optical biochemical sensors.
Most of the reported microcavity-based sensors in the literature (except Ghasemi et al., 2013; Doolin et al., 2015) operate in the telecommunication wavelengths (1.3/1.55 μm) and require a wavelength-tunable laser and a non-silicon photodetector. Whereas, our CROW sensor operating in the visible wavelengths only requires in principle a fixed-wavelength visible laser diode and a silicon CCD/CMOS camera after the library preparation.
In terms of the sensor calibration, the main difference between our library preparation and the conventional calibration process for a microcavity-based sensor is the recording of the pixelized patterns instead of single intensity values. A typical calibration for a conventional microcavity-based sensor [e.g., De Vos et al. (2007) and Iqbal et al. (2010)] involves scanning laser wavelength across a narrow transmission band. As an example, in the work of De Vos et al., calibrating the spectral sensitivity of a microring sensor of Q ~ 20,000 involved measuring the microring transmission spectrum three times for each of the four given NaCl solutions with different concentrations (De Vos et al., 2007). In contrast, our library preparation involves scanning laser wavelength across the CROW transmission band, recording the pixelized patterns at each wavelength step corresponding to the refractive index interval Δni and deriving the corresponding correlation coefficients with the eigenstate patterns. The pattern recording and additional computation of the correlation coefficients render our library preparation more reliable and tolerant to the equipment noises that are common to all pixels compared with recording single intensity values multiple times.
A major issue requiring further developments is the significant variation of sensitivity values upon different probe wavelengths. We can modify the CROW design in order to attain a more uniform sensitivity (see Supplementary Material S10). Our modeling results suggest that an imperfect CROW with a reduced cavity size along with an enhanced inter-cavity coupling coefficient offers a more uniform sensitivity. Upon a small cavity radius R = 10 μm and a strong inter-cavity coupling coefficient κ ~ 0.9, we obtain for an imperfect eight-microring CROW a modeled sensitivity of ~384 ± 153 RIU−1, with an improved non-uniformity ratio of ~0.40 compared to the modeled ratio of ~0.52 following our experimental device parameters. Assuming a practical sensitivity of ~100 RIU−1, the width of the modeled probe wavelength window with a sensitivity >100 RIU−1 is 2.2 nm, which is much improved compared to the modeled width of 1.1 nm following the experimental device parameters. If a higher practical sensitivity of 300 RIU−1 is desired, the modeled probe wavelength window width with a sensitivity >300 RIU−1 is ~1.56 nm, which is still sufficiently wide for practical applications. Based on our current imperfect CROW model, we can further design the CROW with tailored non-uniform parameters to optimize the sensitivity and sensitivity variation.
In summary, we demonstrated a SiN CROW-based sensing scheme in the spatial domain in the visible wavelengths. Given a calibrated CROW sensor, this sensing scheme in principle only requires a low-power, fixed-wavelength laser source in the visible wavelengths and a silicon CCD or CMOS camera to image the elastic-light-scattering patterns in the far field. Our proof-of-concept experiment using an eight-microring CROW on the SiN-on-silica platform showed an average sensitivity of ~281 ± 271 RIU−1 and a NEDL of 2 × 10⁻⁸ ~ 1 × 10⁻⁴ RIU. Our blind sensing tests using NaCl solutions showed a detection of ~1.26 × 10⁻⁴ RIU. Therefore, we have shown that such a chip-scale, microresonator-based SiN CROW sensor operating in the visible wavelengths is promising as a potentially high-performance, portable, and low-cost optical biochemical sensor for applications such as point-of-care biochemical analyses and self-monitoring of personal healthcare using smartphones.
Conflict of Interest Statement
The authors declare that the research was conducted in the absence of any commercial or financial relationships that could be construed as a potential conflict of interest.
Acknowledgments
This work is supported by grants from the Research Grants Council of the Hong Kong Special Administrative Region, China (Project No. 618010, 617612, and 617913). The authors acknowledge the HKUST Nanoelectronics Fabrication Facility for fabricating the optofluidic chip.
Supplementary Material
The Supplementary Material for this article can be found online at http://www.frontiersin.org/Journal/10.3389/fmats.2015.00034/abstract
References
Barrios, C. A., Gylfason, K. B., Sánchez, B., Griol, A., Sohlström, H., Holgado, M., et al. (2007). Slot-waveguide biochemical sensor. Opt. Lett. 32, 3080–3082. doi: 10.1364/ol.32.003080
Pubmed Abstract | Pubmed Full Text | CrossRef Full Text | Google Scholar
Carlborg, C. F., Gylfason, K. B., Kazmierczak, A., Dortu, F., Polo, M. B., Catala, A. M., et al. (2010). A packaged optical slot-waveguide ring resonator sensor array for multiplex label-free assays in labs-on-chips. Lab. Chip 10, 281–290. doi:10.1039/b914183a
Pubmed Abstract | Pubmed Full Text | CrossRef Full Text | Google Scholar
Ciminelli, C., Campanella, C. M., Dell’olio, F., Campanella, C. E., and Armenise, M. N. (2013). Label-free optical resonant sensors for biochemical applications. Prog. Quant. Electron. 37, 51–107. doi:10.1016/j.pquantelec.2013.02.001
Claes, T., Molera, J. G., De Vos, K., Schachtb, E., Baets, R., and Bienstman, P. (2009). Label-free biosensing with a slot-waveguide-based ring resonator in silicon on insulator. Photonics J. IEEE 1, 197–204. doi:10.1109/jphot.2009.2031596
Dante, S., Duval, D., Fariña, D., González-Guerrero, A. B., and Lechuga, L. M. (2015). Linear readout of integrated interferometric biosensors using a periodic wavelength modulation. Laser Photon. Rev. 9, 248–255. doi:10.1002/lpor.201400216
De Vos, K., Bartolozzi, I., Schacht, E., Bienstman, P., and Baets, R. (2007). Silicon-on-insulator microring resonator for sensitive and label-free biosensing. Opt. Express 15, 7610–7615. doi:10.1364/oe.15.007610
Pubmed Abstract | Pubmed Full Text | CrossRef Full Text | Google Scholar
Densmore, A., Xu, D.-X., Janz, S., Waldron, P., Mischki, T., Lopinski, G., et al. (2008). Spiral-path high-sensitivity silicon photonic wire molecular sensor with temperature-independent response. Opt. Lett. 33, 596–598. doi:10.1364/ol.33.000596
Pubmed Abstract | Pubmed Full Text | CrossRef Full Text | Google Scholar
Doolin, C., Doolin, P., Lewis, B. C., and Davis, J. P. (2015). Refractometric sensing of Li salt with visible-light Si3N4 microdisk resonators. Appl. Phys. Lett. 106, 081104. doi:10.1063/1.4913618
Duval, D., Osmond, J., Dante, S., Dominguez, C., and Lechuga, L. M. (2013). Grating couplers integrated on Mach-Zehnder interferometric biosensors operating in the visible range. Photonics J. IEEE 5, 3700108. doi:10.1109/jphot.2013.2251873
Estevez, M.-C., Alvarez, M., and Lechuga, L. M. (2012). Integrated optical devices for lab-on-a-chip biosensing applications. Laser Photon. Rev. 6, 463–487. doi:10.1002/lpor.201100025
Ghasemi, F., Eftekhar, A. A., Gottfried, D. S., Song, X., Cummings, R. D., and Adibi, A. (2013). “Self-referenced silicon nitride array microring biosensor for toxin detection using glycans at visible wavelength,” in SPIE BiOS (San Francisco, CA: International Society for Optics and Photonics).
Gorin, A., Jaouad, A., Grondin, E., Aimez, V., and Charette, P. (2008). Fabrication of silicon nitride waveguides for visible-light using PECVD: a study of the effect of plasma frequency on optical properties. Opt. Express 16, 13509–13516. doi:10.1364/oe.16.013509
Pubmed Abstract | Pubmed Full Text | CrossRef Full Text | Google Scholar
Halir, R., Vivien, L., Le Roux, X., Xu, D.-X., and Cheben, P. (2013). Direct and sensitive phase readout for integrated waveguide sensors. Photonics J. IEEE 5, 6800906. doi:10.1109/jphot.2013.2276747
Iqbal, M., Gleeson, M. A., Spaugh, B., Tybor, F., Gunn, W. G., Hochberg, M., et al. (2010). Label-free biosensor arrays based on silicon ring resonators and high-speed optical scanning instrumentation. IEEE J. Sel. Top. Quantum Electron. 16, 654–661. doi:10.1109/jstqe.2009.2032510
Kozma, P., Hamori, A., Cottier, K., Kurunczi, S., and Horvath, R. (2009). Grating coupled interferometry for optical sensing. Appl. Phys. B 97, 5–8. doi:10.1007/s00340-009-3719-1
Lakshminarayanan, V., Zelek, J., and Mcbride, A. (2015). “Smartphone Science” in eye care and medicine. Opt. Photonics News 26, 44–51. doi:10.1364/opn.26.1.000044
Lei, T., and Poon, A. W. (2011). Modeling of coupled-resonator optical waveguide (CROW) based refractive index sensors using pixelized spatial detection at a single wavelength. Opt. Express 19, 22227–22241. doi:10.1364/oe.19.022227
Liu, J., Zhou, X., Qiao, Z., Zhang, J., Zhang, C., Xiang, T., et al. (2014). Integrated optical chemical sensor based on an SOI ring resonator using phase-interrogation. Photonics J. IEEE 6, 1–7. doi:10.1109/jphot.2014.2352973
Misiakos, K., Raptis, I., Makarona, E., Botsialas, A., Salapatas, A., Oikonomou, P., et al. (2014). All-silicon monolithic Mach-Zehnder interferometer as a refractive index and bio-chemical sensor. Opt. Express 22, 26803–26813. doi:10.1364/OE.22.026803
Pubmed Abstract | Pubmed Full Text | CrossRef Full Text | Google Scholar
Sedlmeir, F., Zeltner, R., Leuchs, G., and Schwefel, H. G. (2014). High-Q MgF2 whispering gallery mode resonators for refractometric sensing in aqueous environment. Opt. Express 22, 30934–30942. doi:10.1364/oe.22.030934
Pubmed Abstract | Pubmed Full Text | CrossRef Full Text | Google Scholar
Subramanian, A., Dhakal, A., Peyskens, F., Selvaraja, S., Baets, R., Neutens, P., et al. (2013). Low-loss singlemode PECVD silicon nitride photonic wire waveguides for 532–900 nm wavelength window fabricated within a CMOS pilot line. Photonics J. IEEE 5, 2202809. doi:10.1109/jphot.2013.2292698
Vollmer, F., Arnold, S., and Keng, D. (2008). Single virus detection from the reactive shift of a whispering-gallery mode. Proc. Natl. Acad. Sci. U.S.A. 105, 20701–20704. doi:10.1073/pnas.0808988106
Pubmed Abstract | Pubmed Full Text | CrossRef Full Text | Google Scholar
Wang, J., Yao, Z., Lei, T., and Poon, A. W. (2014). Silicon coupled-resonator optical-waveguide-based biosensors using light-scattering pattern recognition with pixelized mode-field-intensity distributions. Sci. Rep. 4, 07528. doi:10.1038/srep07528
Wang, X., Guan, X., Huang, Q., Zheng, J., Shi, Y., and Dai, D. (2013). Suspended ultra-small disk resonator on silicon for optical sensing. Opt. Lett. 38, 5405–5408. doi:10.1364/ol.38.005405
Pubmed Abstract | Pubmed Full Text | CrossRef Full Text | Google Scholar
Xu, J., Suarez, D., and Gottfried, D. S. (2007). Detection of avian influenza virus using an interferometric biosensor. Anal. Bioanal. Chem. 389, 1193–1199. doi:10.1007/s00216-007-1525-3
Pubmed Abstract | Pubmed Full Text | CrossRef Full Text | Google Scholar
Ymeti, A., Greve, J., Lambeck, P. V., Wink, T., Van Hövell, S. W., Beumer, T. A., et al. (2007). Fast, ultrasensitive virus detection using a Young interferometer sensor. Nano Lett. 7, 394–397. doi:10.1021/nl062595n
Pubmed Abstract | Pubmed Full Text | CrossRef Full Text | Google Scholar
Keywords: silicon nitride, biochemical sensor, integrated optofluidics, coupled-resonator optical waveguide, microring resonators, CMOS-compatible, elastic light scattering, visible wavelengths
Citation: Wang J, Yao Z and Poon AW (2015) Silicon-nitride-based integrated optofluidic biochemical sensors using a coupled-resonator optical waveguide. Front. Mater. 2:34. doi: 10.3389/fmats.2015.00034
Received: 31 January 2015; Accepted: 01 April 2015;
Published: 27 April 2015
Edited by:
Dan-Xia Xu, National Research Council Canada, CanadaReviewed by:
Koji Yamada, Nippon Telegraph and Telephone Corporation, JapanWeidong Zhou, University of Texas at Arlington, USA
Robert Halir, Universidad de Málaga, Spain
Copyright: © 2015 Wang, Yao and Poon. This is an open-access article distributed under the terms of the Creative Commons Attribution License (CC BY). The use, distribution or reproduction in other forums is permitted, provided the original author(s) or licensor are credited and that the original publication in this journal is cited, in accordance with accepted academic practice. No use, distribution or reproduction is permitted which does not comply with these terms.
*Correspondence: Andrew W. Poon, Photonic Device Laboratory, Department of Electronic and Computer Engineering, The Hong Kong University of Science and Technology, Clear Water Bay, Kowloon, Hong Kong, China, eeawpoon@ust.hk