Coating of carbon nanotube fibers: variation of tensile properties, failure behavior, and adhesion strength
 Edith Mäder
 Jianwen Liu
 Janett Hiller1
 Serge Zhandarov
- 1Leibniz-Institut für Polymerforschung Dresden e. V., Dresden, Germany
- 2Institut für Werkstoffwissenschaft, Technische Universität Dresden, Dresden, Germany
- 3Advanced Materials Division, Suzhou Institute of Nano-Tech and Nano-Bionics, Suzhou, China
- 4“V. A. Bely” Metal-Polymer Research Institute, National Academy of Sciences of Belarus, Gomel, Belarus
- 5Center for Composite Materials, University of Delaware, Newark, DE, USA
An experimental study of the tensile properties of CNT fibers and their interphasial behavior in epoxy matrices is reported. One of the most promising applications of CNT fibers is their use as reinforcement in multifunctional composites. For this purpose, an increase of the tensile strength of the CNT fibers in unidirectional composites as well as strong interfacial adhesion strength is desirable. However, the mechanical performance of the CNT fiber composites manufactured so far is comparable to that of commercial fiber composites. The interfacial properties of CNT fiber/polymer composites have rarely been investigated and provided CNT fiber/epoxy interfacial shear strength (IFSS) of 14.4 MPa studied by the microbond test. In order to improve the mechanical performance of the CNT fibers, an epoxy compatible coating with nano-dispersed aqueous-based polymeric film formers and low viscous epoxy resin, respectively, was applied. For impregnation of high homogeneity, low molecular weight epoxy film formers and polyurethane film formers were used. The aqueous-based epoxy film formers were not crosslinked and able to interdiffuse with the matrix resin after impregnation. Due to good wetting of the individual CNT fibers by the film formers, the degree of activation of the fibers was improved, leading to increased tensile strength and Young’s modulus. Cyclic tensile loading and simultaneous determination of electric resistance enabled to characterize the fiber’s durability in terms of elastic recovery and hysteresis. The pull-out tests and SEM study reveal different interfacial failure mechanisms in CNT fiber/epoxy systems for untreated and film former treated fibers, on the one hand, and epoxy resin treated ones, on the other hand. The epoxy resin penetrated between the CNT bundles in the reference or film former coated fiber, forming a relatively thick CNT/epoxy composite layer and thus shifting the fracture zone within the fiber. In contrast to this, shear sliding along the interface between the matrix and the outer fiber layer impregnated with the resin was observed for epoxy resin-coated fibers. These fibers have been successfully pulled out of the matrix droplets and shown that the average local interfacial shear stress value was 63 MPa (with apparent IFSS values 33–60 MPa). The interfacial frictional stress between the fiber and the matrix was rather high (9.5 MPa), which can be attributed to the complex structure of the interface and the fiber twisting.
Introduction
There exist reports of very high CNT fiber strength which make us assume them as very exciting materials. On the other hand, there is the necessity to further develop new and innovative processing methods in order to gain improved mechanical, electrical, chemical, thermal, and optical properties (Wu et al., 2012a). These multifunctions will make CNT fibers an attractive choice as reinforcement in composites, particularly in the development of electrically conductive structures. Therefore, investigations are concerned with the improvement of both fiber tensile strength and adhesion strength toward polymeric matrices. Besides, it is well known that the ideal internal structure of high-performance fibers for optimum tensile properties consists of perfectly aligned, infinitely long axial fibrils (Chae and Kumar, 2008). Figure 1 shows a few original images of fibrillated fracture surfaces of very strong organic fibers, such as poly-p-phenylbenzobisoxazol (PBO) fibers, aramid fibers (AR) together with CNT fibers. The tensile strengths of PBO and AR are 6 GPa and 3.2 GPa, respectively, whereas the tensile strength of CNT fibers strongly depends on the processing method. Aerogel-spun fibers spun directly from the chemical vapor deposition synthesis region of a furnace are produced for electrical purposes and possess moderate strength of only 0.19 GPa (Wu et al., 2012a). Continuous CNT fibers spun from CNT carpet, consisting of mainly double- and triple-walled tubes, achieve average tensile strength of 1.2 ± 0.3 GPa (Zu et al., 2012). Chemical vapor produced CNT continuous fibers made of single and dual wall CNTs could improve the tensile strength to 3–5 GPa by post-process stretching and increase of alignment (Wu et al., 2012b). Besides the processing conditions, the objective of this work is to activate the CNTs within the fiber cross section in order to improve the stress transfer ability between the single CNTs or CNT bundles within the fiber and in the interphase, i.e., between the sheath CNTs and the composite matrix. The experimental work focuses on coating the as-received fibers with different aqueous-based film formers and low viscous epoxy resin. Both fiber properties and adhesion strength determinations were performed in order to reveal the variations of tensile, failure, and adhesion features. Furthermore, the resistance changes were investigated simultaneously with the stress–strain behavior and the durability after cyclic loading.
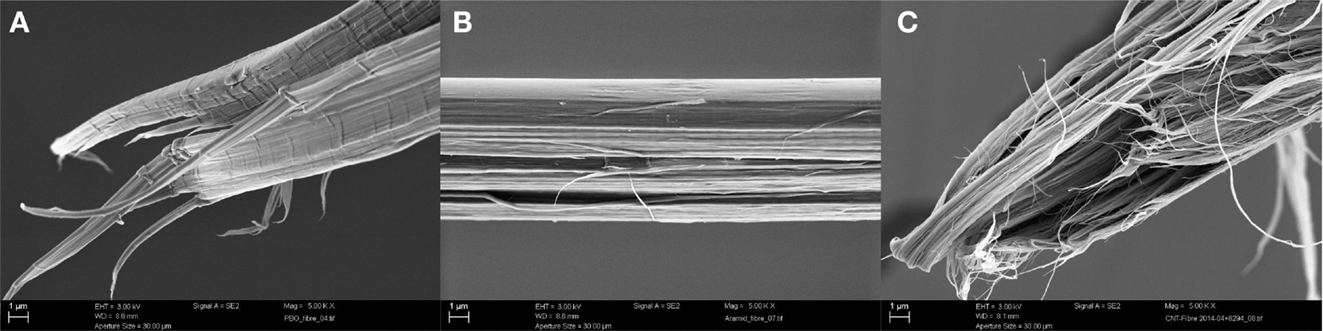
Figure 1. Fracture surfaces of PBO (A), AR (B), and CNT (C) fibers.
Materials and Methods
Materials
Untreated dry-spun CNT fibers were provided by Advanced Materials Division, Suzhou Institute of Nano-Tech and Nano-Bionics, Suzhou, PR China. Table 1 shows the characteristics of the CNT fibers used. They were produced at different twisting rates and were differently densified. A 1-cm-wide CNT film was pulled out from the CNT array pre-grown on a silicon substrate, at a constant take-up speed of 20 cm/min. The diameter of the fiber is mainly determined by the twisting rate of the fiber and densification. With higher twisting rate, the diameter gets usually smaller. Also the surface twist angle is determined by the twisting rate. The higher the twisting rate, the higher is the fiber twist angle. The diameter and length of the CNTs are usually the same in all the fibers. The CNT fiber diameters given in Table 1 are average values determined by digital microscopy and from SEM images.
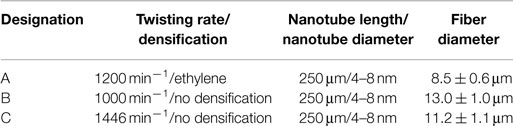
Table 1. Characteristics of CNT fibers.
Three aqueous-based epoxy resin emulsions of different glass transition temperatures (Tg) and epoxy equivalent weights (g/eq), one aqueous-based polyurethane film former, and one low viscous epoxy resin were selected for a dip coating of the CNT fibers in order to achieve coatings of different hardnesses and different impregnations. The concentration of the aqueous epoxy dispersions and polyurethane dispersion, respectively, was kept constant at 2.75 wt%. The low viscous epoxy resin was applied as recommended by the manufacturer. The characteristics of the coating agents as well as the manufacturers are given in detail in Table 2.
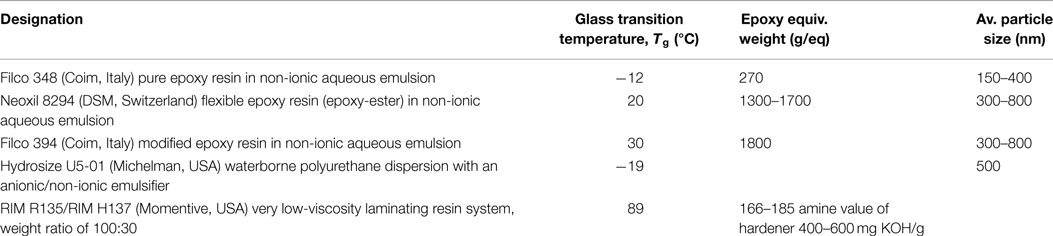
Table 2. Characteristics of aqueous emulsions and epoxy resin used for surface modification of CNT fibers.
Methods
Preparation of Coated CNT Fibers
Each CNT fiber piece of about 30 cm length was dipped in the aqueous coating dispersion (for RIM R135 resin, the liquid stoichiometric resin/hardener mixture) with the help of a pair of plastic tweezers and kept in the aqueous emulsion for 1 min. A heat treatment of the fibers was done in an oven for 2 h at 130°C.
Single Fiber Tensile Tests and Characterization of Sensing Abilities
Using the Favigraph semiautomatic fiber tensile tester (Textechno, Germany) equipped with a 1 N force cell, the mechanical tensile stress/strain behavior was tested in accordance with EN ISO 5079 with a test velocity of 0.1 mm/min at a gage length of 2 mm by using special clamp combination of soft and hard elastomers.
The electrical resistance of the coated CNT fibers was measured simultaneously with a Keithley 2001 electrometer having a measurement range from 10−6 to 109 Ω (Keithley Instruments GmbH, Germany) at 23°C and 50% relative humidity (RH). The mean values of at least 10 measurements for every fiber were calculated. To investigate the piezoresistive effect, the electrical resistance was recorded as the specimen underwent either uniaxial tensile or cyclic loading using the semiautomatic equipment described above. The specimen was fixed between two clamps which were coated with conductive silver paste (Acheson Silver DAG 1415M) and served as electrodes. The cyclic loading and unloading tension tests were conducted at a gage length of 2 mm, a cross-head velocity of 0.2 mm/min, and a 1% stepwise increase of the strain amplitude from 1 to 5%. The cyclic loading tests were performed as either load increasing tests with the same specimen to decrease the data scattering or by using different specimens. The deformations were divided into an elastic part, which is recovered when the stress is removed, and a plastic or permanent part. Quantitatively, we used the elastic recovery as elastic extension divided by total extension, which may be plotted against stress or strain. Instead of studying dimensional recovery, one may study and define work recovery (resilience) in a similar manner. It should be noted that hysteresis = (1– work recovery) gives the proportion of the total work that is dissipated as heat (Morton and Hearle, 2008). Simultaneous resistance, strain, and load measurements were integrated with the time scale in a customized data acquisition package TestPoint 2.0.
Scanning Electron Microscopy
The fiber surface morphologies, fracture surfaces after tensile test, and fracture surfaces after pull-out test were studied using the scanning electron microscope (FE–SEM Ultra 55, Carl Zeiss SMT AG, Germany). The samples for SEM observation were coated by ~5-nm-thick platinum layer.
Single Fiber Pull-Out Tests
The single CNT fibers were embedded under PC control in matrix resin mixture RIM R135/RIM H137 (100/30 weight parts) to embedded lengths (le) ranging from 40 to 100 μm and cured for 60 min at 85°C. Then the specimens were taken from the embedding device and cured for 6 h at 80°C in an oven. After curing, the specimens were stored in a desiccator (silica gel) before pull-out test.
Different interphases in the vicinity of the epoxy matrix/CNT fiber interface were investigated using the single fiber pull-out test. The self-made sample preparation equipment and pull-out apparatus allowed us to record force–displacement curves under quasi-static conditions with the loading rate of 0.01 μm/s at 23°C and 50% RH. The free fiber lengths were kept as short as possible (<50 μm). The diameter of each pulled-out fiber was measured in several cross-sections along the fiber using an optical microscope, and its mean value, df, was used in further calculations.
From the experimental data, the following interfacial strength parameters were determined: the apparent interfacial shear strength (IFSS), τapp = Fmax/(πdf le), where Fmax is the maximum force recorded during the test; the local IFSS, τd, at which interfacial debonding is assumed to start in stress-based models of the pull-out test (Zhandarov and Mäder, 2005); and the critical energy release rate for debonding, Gic, derived in energy-based models (Nairn, 2000; Zhandarov and Mäder, 2003). In addition, we calculated the interfacial frictional stress, τf, between the fiber and the matrix. In our calculations, we used the latest approach which relates τd and τf values to experimentally measured values of Fmax, the maximum force, and Fb, the force corresponding to the debonding completion. This approach is very useful when the “kink” in a force–displacement curve associated with the debonding onset is hardly discernible; it was described in details elsewhere (Zhandarov and Mäder, 2014). We also used a similar method in the energy-based approach to calculate Gic from Fmax and Fb.
Atomic Force Microscopy
An atomic force microscope (Digital Instruments D3100, USA) was used as a surface imaging tool. The topography images of samples were studied in tapping mode, while phase shifts, i.e., changes in the phase angle of vibration with respect to the phase angle of the freely oscillating cantilever, recorded simultaneously with height changes, are present as a phase image.
Roughness parameters derived from ASME B46 were calculated: Ra, arithmetic average of the absolute values of the surface height deviations measured from the mean plane within the box cursor (5 μm × 5 μm); Rmax, maximum vertical distance between the highest and the lowest data points within the cursor box (5 μm × 5 μm). At least three images of one sample were used for calculation.
Results
Single Fiber Tensile Test on Coated CNT Fibers
Table 3 summarizes results of the single fiber tensile tests for the reference samples in comparison to coated ones. The three reference fibers are characterized by different tensile strengths (σmax) and corresponding strains (εmax) as well as Young’s moduli (E) which is due to the different treatment of the CNT fibers within the processing. Fibers A and B achieved much greater strengths and Young’s moduli than fiber C. The reason for this difference is due to somewhat overtwisted fiber C. The twisting has both positive and negative effects on the fiber strength. As the positive effect, the twisting would densify the fiber and enhance the load transfer efficiency between CNTs in the fiber. The negative effect is that upon twisting, the CNTs initially aligned in the fiber direction are forced to be inclined to the fiber direction, which degrades the fiber strength. There should be an optimal twisting angle for the fiber strength, which depends upon several factors such as CNT length and diameter, fiber diameter, and others. Therefore, it is not unexpected that fiber C is less strong than fibers A and B.
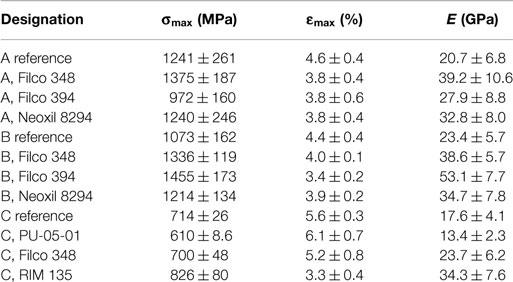
Table 3. CNT fiber tensile test results as a function of coatings.
In dependence of their characteristics, the coatings cause different changes in the tensile properties. Among the three different aqueous-based epoxy film formers, Filco 348 has the lowest Tg and the lowest average particle size. It performs best, which can be explained by improved impregnation and thus increased stress transfer ability between the CNTs or CNT bundles within the CNT fiber due to preferable mechanical interlocking. Figure 2 shows selected AFM height and phase images of untreated reference and Filco 348 treated CNT fibers which confirm decrease of alignment after coating and significant increase of surface roughness (Ra from 20 to 47 nm, Rmax from 263 to 534 nm) which can contribute to mechanical interlocking. The better the impregnation, the more CNTs can be activated and participate in the stress transfer. It is noted that the AFM phase images (Figure 2, top line) do not indicate material inhomogeneity. Furthermore, the stiffness, determined by Young’s modulus, increases due to the impregnation. The other epoxy film formers also show moderate increase of tensile strength and Young’s modulus. In contrast, the rather “weak” polyurethane film former leads to a drop in tensile strength and modulus because of the weak interphase created by impregnation between CNTs or CNT bundles. A considerable increase in strength and modulus was detected for CNT fibers with an epoxy resin coating. This is inferred by curing of the reactive system in addition to mechanical interlocking. On the other hand, the brittleness could increase.
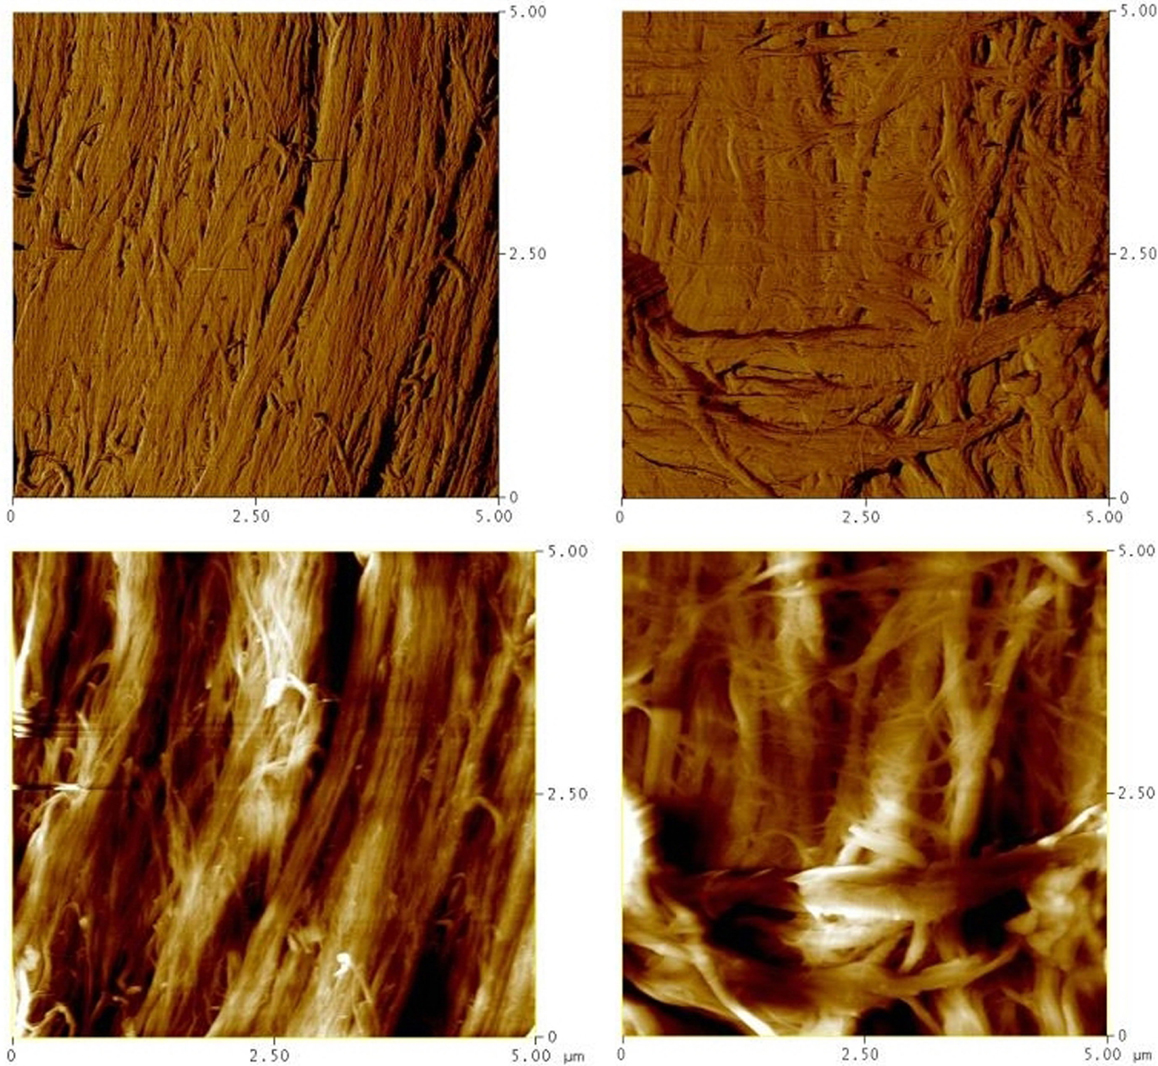
Figure 2. Selected AFM phase and height images (top/bottom), respectively, of reference fibers (left) and Filco 394 treated ones (right).
Stress–Strain Behavior and Electrical Resistance Change of Coated CNT Fibers
Besides the stress–strain behavior, the electrical resistance change of the CNT fibers was determined. Figure 3 shows exemplarily the stress–strain and resistance–strain curves of a reference CNT fiber in comparison with an epoxy treated fiber. The epoxy treated fibers (Figures 3D–F) are characterized by much higher stresses at comparable strains related to the reference fibers, as was discussed in Section “Single Fiber Tensile Test on Coated CNT Fibers.” The resistance of the reference fiber is 530 Ω, whereas the resistance of the epoxy resin treated fiber increased to 703 Ω due to the polymeric coating. It is interesting to note that the resistance change follows the stress–strain behavior at low strains (Figures 3A,D). With increasing strain the resistances deviate to lower resistance changes, which might be due to the increased friction and compression of CNT bundles, resulting in closer contact with increasing strain. Some scatter is visible due to different alignments of CNTs and occurrence of CNT breaks increased with increasing strain. Cyclic loadings at 3% strain achieve a rather slight gradual decay of the resistance change which can be explained again by increasing compression of the CNTs or CNT bundles in the yarn. At 4% strain (near the failure of the CNT fiber), the resistance change of the reference fiber dropped to zero resistance change, whereas the resistance of the epoxy resin treated fiber is characterized by a negative resistance change, i.e., due to further compression and improved cohesion with epoxy treatment, the conductivity of the CNT fiber is improved.
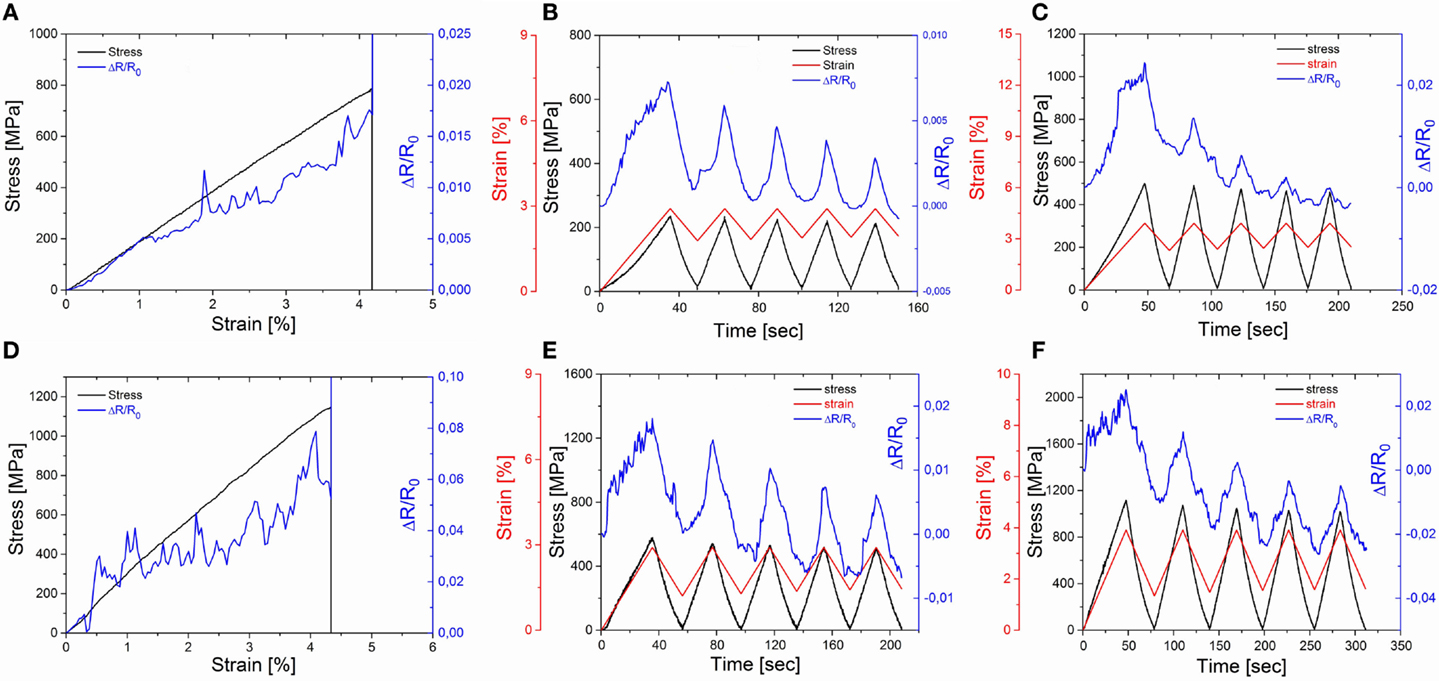
Figure 3. Stress–strain behavior and electrical resistance change of reference CNT fiber (A–C) and epoxy resin treated CNT fiber (D–F). (A,D): stress, strain, and electrical resistance change plots as a function of time, (B,E): cyclic loading for 3% strain. (C,F): cyclic loading for 4% strain.
Elastic Recovery and Hysteresis for Coated CNT Fibers
Typical records of stress–strain curves upon cyclic loading of untreated CNT fiber and epoxy resin treated CNT fiber are shown in Figure 4. After data evaluation, the elastic recovery and the hysteresis as functions of strain and stress, respectively, are displayed in Figure 5. The figures are compared for one specimen and different specimens show a bit greater scatter (<10%), but sufficient reproducibility. Highest elastic recoveries combined with lowest hysteresis values were determined for epoxy resin treated fibers, while the other treated fibers were very close to the reference samples. This evidences that the epoxy resin treated CNT fiber is more uniform than other fibers; due to resin infiltration between CNT bundles and its subsequent crosslinking, the bundles are bonded with each other and their displacements under loading are more coherent. Consequently, internal friction within this fiber is lower than that in the others, which, in turn, results in lower hysteresis and higher elastic recovery under cyclic loading.
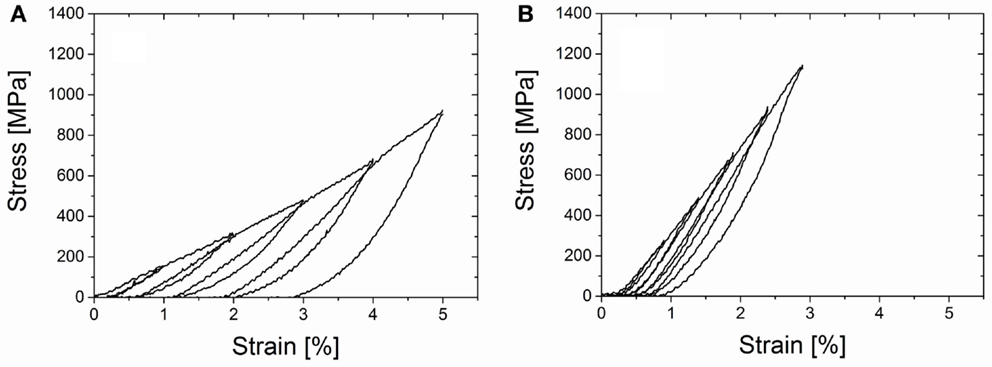
Figure 4. Typical records of stress–strain curves after cyclic loading of untreated (A) and epoxy resin treated (B) CNT fiber.
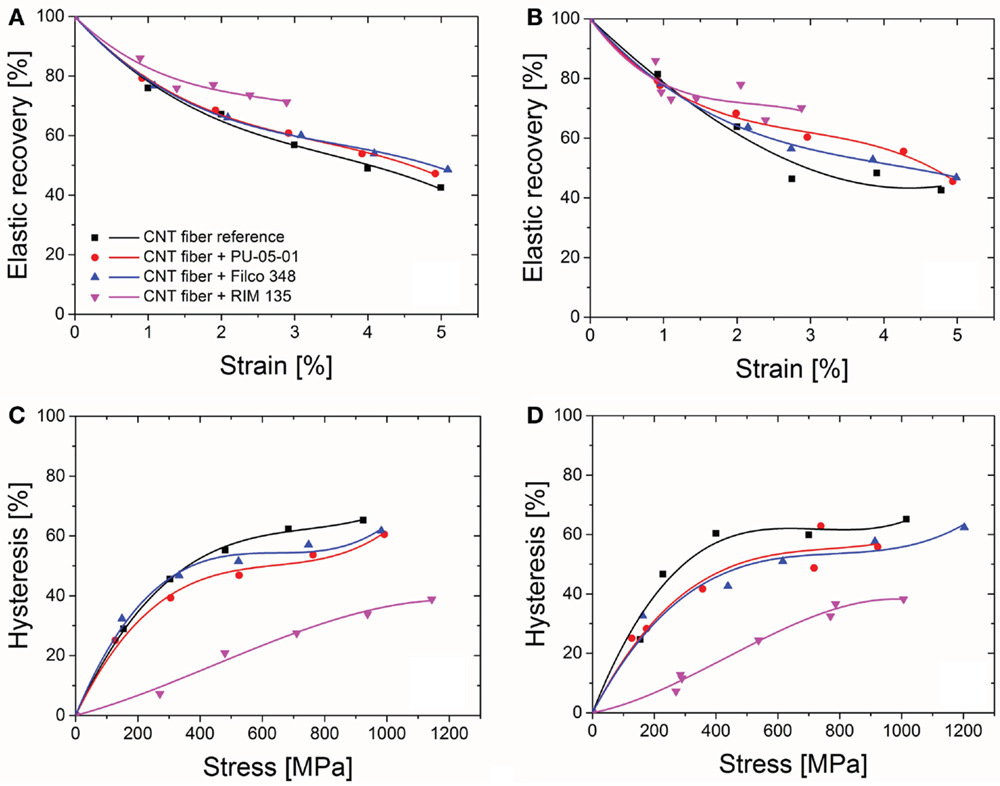
Figure 5. Elastic recovery (A,B) and hysteresis (C,D) plots as a function of strain and stress, respectively, for differently surface treated CNT fibers. (A,C): load increasing tests performed on one specimen; (B,D): different specimens.
Interfacial Adhesion Strength of CNT Fibers with Epoxy Matrix
The comparison of SEM images of fracture surfaces after the pull-out test for untreated CNT fibers and those coated with RIM 135 resin demonstrated substantial difference in the failure mechanisms. Figure 6A shows the fracture surfaces for uncoated fibers. It can be seen that the epoxy resin had penetrated into the CNT fiber forming a relatively thick (~1 μm) CNT/epoxy composite layer, and the fracture surface located, in part, between this layer and the “core” of the fiber which remained without resin infiltration (radial “steps” in the photographs). Similar behavior was reported by Zu et al. (2012) for continuous CNT fibers in DER 353 epoxy resin. This localization of the fracture zone as well as probably too large embedded lengths (about 70 μm) resulted in fiber breakage before debonding completion, which can easily be seen in Figure 6A. It should be noted that pull-out tests of CNT fibers treated with aqueous-based film formers embedded in the same epoxy matrix (results not shown here) also failed in the same mechanism, such as stepwise fracture.
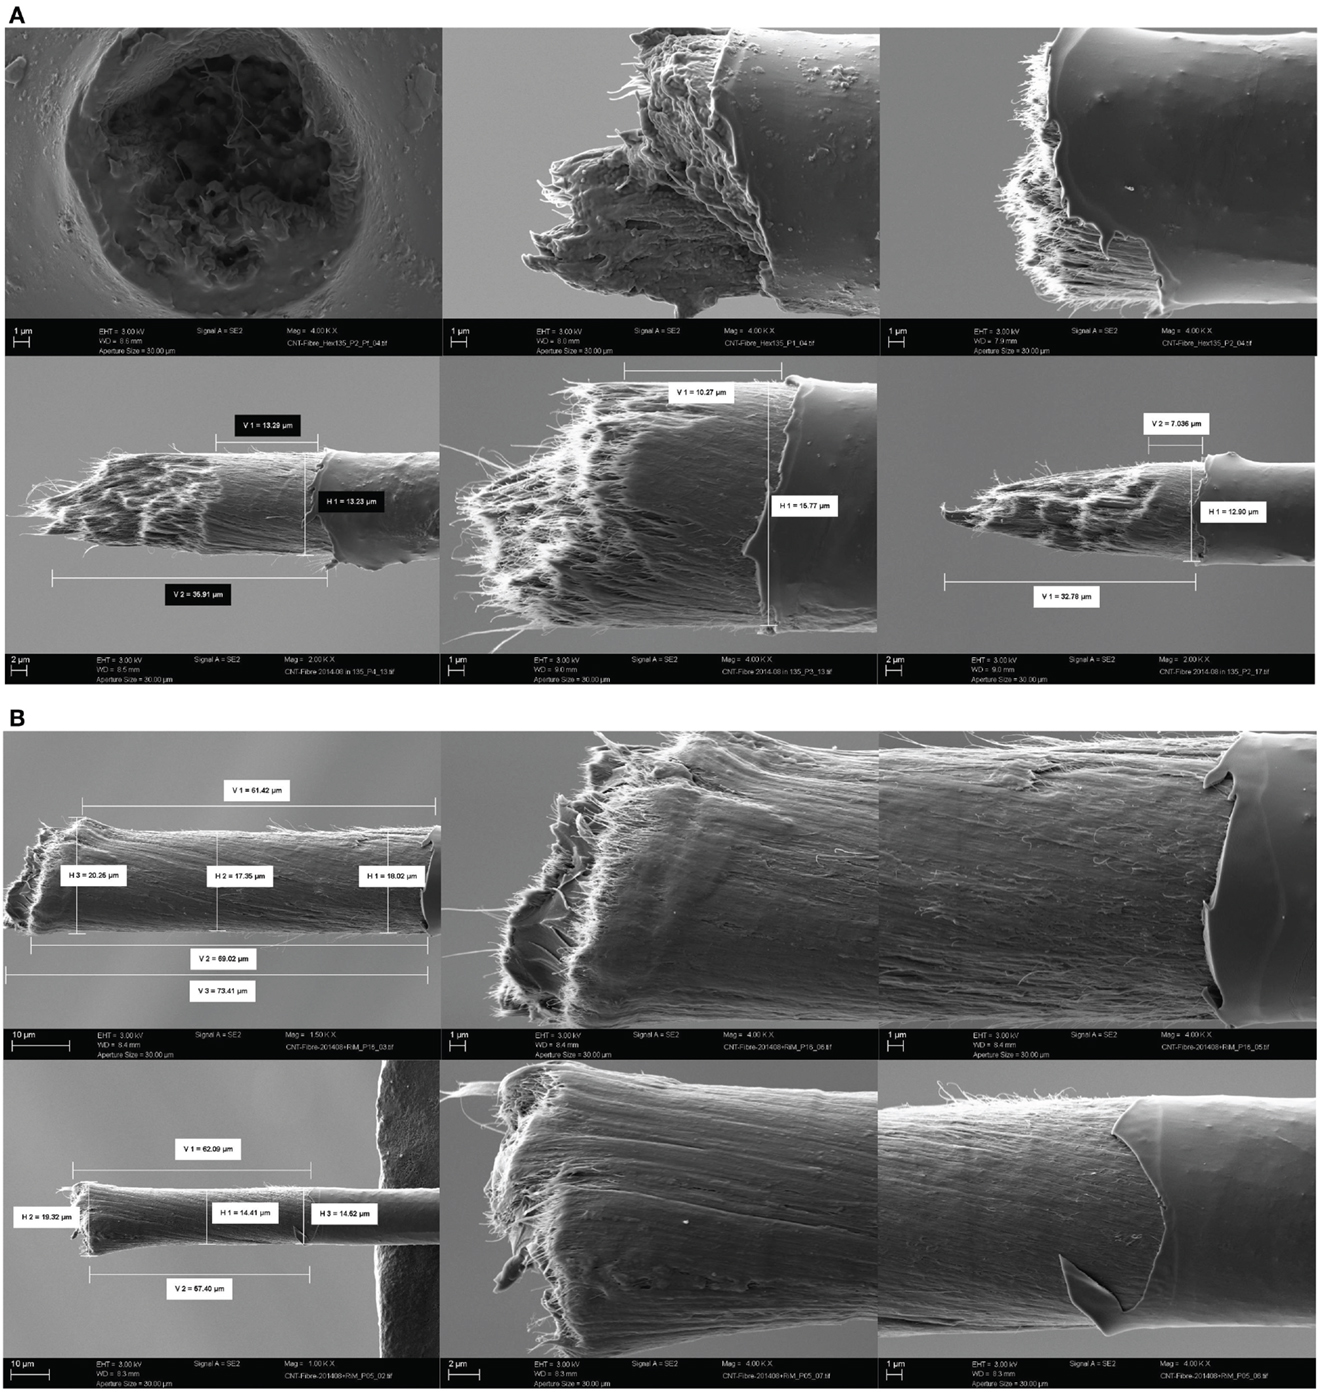
Figure 6. SEM images of fracture surfaces after pulling untreated (A) and coated with RIM 135 resin (B) CNT fibers out of the epoxy matrix.
In contrast to this, most CNT fibers coated with RIM 135 resin have been successfully pulled out of the epoxy matrix droplet. SEM images of fracture surfaces after interfacial debonding (Figure 6B) clearly show that shear sliding occurred in this case along the interface between the matrix and the outer fiber layer impregnated with the resin. For coated fibers, resin penetration into a continuous CNT fiber took place at the stage of coating (dipping the fiber in the resin–hardener mixture and subsequent thermal treatment). The conditions of this thermal treatment (relatively short time but the temperature higher than recommended by the manufacturer for this resin) gave rise to the formation of a rather thin surface layer consisting of CNT bundles in partly cured resin with a Tg of 89°C compared to a Tg of 96°C for the cured matrix. Thus, the interface between it and the bulk matrix in the droplet, formed during the fiber embedment in the matrix and subsequent resin curing, appeared to be the “weak point” of the specimen. The fracture surface basically replicates the structure of the continuous CNT fiber surface, though some particular CNT micro-bundles separated from the fiber can be seen on it. In all probability, the interfacial failure included a cohesive part through the breakage of the weakest outer CNT fascicules.
A typical force–displacement curve for this system is shown in Figure 7. Both force values, Fmax and Fb, required for the calculation of interfacial strength parameters according to our new approach, are easily measurable from this curve, while the “kink” position in the ascending part of the curve, on which the traditional approach is based, cannot be determined reliably. We calculated interfacial strength parameters for 10 successfully tested specimens and determined their mean values and SD: the apparent IFSS τapp = 45.5 ± 9.4 MPa; the local IFSS τd = 62.7 ± 10.5 MPa; the critical energy release rate for interfacial debonding Gic = 17.0 ± 6.2 J/m2; and the frictional interfacial stress, τf = 9.5 ± 3.0 MPa. The obtained τapp value is much greater than that presented by Zu et al. (2012) (14.4 MPa) but is typical for carbon fibers/epoxy composites [e.g., 30–75 MPa for T300 fibers in the mixture of DER 331 and DER 732 epoxies (Nakamura et al., 2012)]. The values of the local IFSS and the critical energy release rate are also typical for carbon fiber/epoxy systems. However, we should mention that the interfacial frictional stress between the CNT fiber and the epoxy matrix (9.5 MPa) is rather high; in all probability, this can be attributed to the complex structure of the fiber surface, which is formed by a large number of individual CNTs which make finite angles with the fiber axis due to fiber twisting during its spinning from a CNT array.
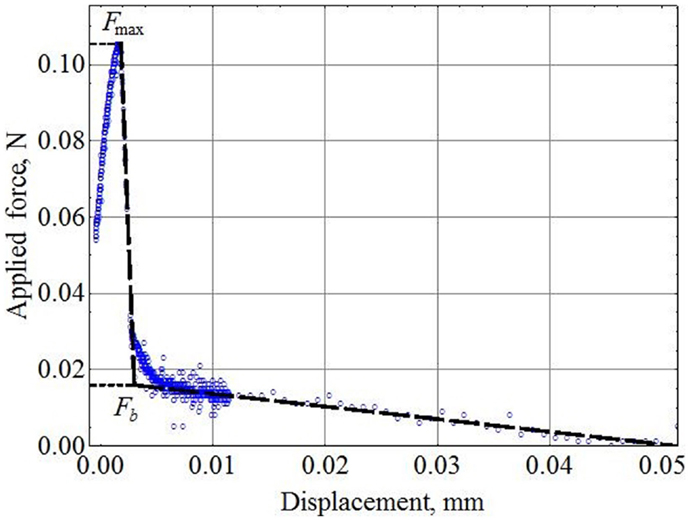
Figure 7. Typical force–displacement curve for a RIM 135 resin-coated CNT fiber pulled out of epoxy matrix droplet.
Conclusion
Three reference CNT fibers, characterized by different twisting rates and densities due to fiber processing, revealed average tensile strength and Young’s modulus variations up to 73 and 33%, respectively. The aqueous-based film former coatings lead to considerable changes of strength and modulus values compared to the untreated reference fibers.
Depending on the chemistry of the aqueous-based film former coatings, particle size distribution, and the glass transition temperature, the film formers differently affected the mechanical properties of the CNT fibers. A very weak polyurethane dispersion (PU-05-01) decreased both fiber’s tensile strength and modulus to 85 and 76%, respectively, because of the weak interphases created by impregnation between CNTs or CNT bundles. In contrast to this, especially the epoxy film former Filco 348 (lowest Tg and average particle size) could achieve average strength and modulus improvements of 24 and 65%, respectively. Besides the improved impregnation and thus increased stress transfer efficiency, a mechanical interlocking and misalignment together with an increased surface roughness was revealed by AFM tapping mode images.
An increase of strength (15%) and modulus (95%) related to the reference fibers was found with an epoxy resin coating caused by curing of the reactive system in addition to mechanical interlocking. It should be noted that the electrical resistance increased from 530 to 703 Ω due to the resin coating. Upon tensile loading, the electrical resistance deviated to lower values with increasing strain caused by the closer contact of the CNTs. Cyclic loadings achieved a gradual decay of the resistance change depending on the strain due to increasing compression of the CNTs. Again, the epoxy resin treated fibers lead to lowest resistances due to improved cohesion between the CNTs. The epoxy treated fibers exhibited the greatest elastic recovery and the lowest hysteresis during the cyclic loading.
Interfacial adhesion strength determinations of CNT fibers with epoxy matrix showed different failure mechanisms after pull-out tests for epoxy resin treated fibers compared to untreated and film former coated ones. SEM fracture surfaces revealed about 1-μm-thick CNT/epoxy composite layer for uncoated fibers which shifted the fracture zone inside the fiber and resulted in stepwise fiber fracture before debonding completion.
In contrast, epoxy resin-coated fibers were successfully pulled out of the epoxy resin matrix after interfacial debonding, and clear shear sliding along the interface between the matrix and the outer CNT layer of the fiber impregnated with the resin was observed. Due to the curing conditions of the resin coating, the interphase became the “weak point” of the single fiber model composite.
The determination of the interfacial strength parameters according to our new approach revealed apparent and local IFSS values of 45 and 63 MPa, respectively. Compared with literature data, these values are typical for carbon fiber/epoxy composites. However, the evaluated interfacial frictional stress between the CNT fiber and the epoxy resin matrix (9.5 MPa) is rather high and can be attributed to the complex structure of the fiber surface, which is formed by a large number of individual CNTs having a distinct density and a finite angle with the fiber axis due to the manufacturing process.
Conflict of Interest Statement
The authors declare that the research was conducted in the absence of any commercial or financial relationships that could be construed as a potential conflict of interest.
References
Chae, H. G., and Kumar, S. (2008). Making strong fibers. Science 319, 908–909. doi: 10.1126/science.1153911
Morton, W. E., and Hearle, J. W. S. (2008). Physical Properties of Textile Fibres, 4th Edn. Boca Raton, FL: Woodhead Publishing Limited and CRC Press LLC.
Nairn, J. A. (2000). Analytical fracture mechanics analysis of the pull-out test including the effects of friction and thermal stresses. Adv. Compos. Lett. 9, 373–383.
Nakamura, R., Netravali, A. N., and Hosur, M. V. (2012). Effect of halloysite nanotube incorporation in epoxy resin and carbon fibre ethylene/ammonia plasma treatment on their interfacial property. J. Adhes. Sci. Technol. 26, 1295–1312. doi:10.1163/156856111X593612
Wu, A. S., Chou, T. W., Gillespie, G. W., Lashmore, D., and Rioux, J. (2012a). Electromechanical response and failure behavior of aerogel-spun carbon nanotube fibres under tensile loading. J. Mater. Chem. 22, 6792–6798. doi:10.1039/c2jm15869h
Wu, A. S., Nie, X., Hudspeth, M. C., Chen, W. W., Chou, T. W., Lashmore, D. S., et al. (2012b). Strain rate-dependent tensile properties and dynamic electromechanical response of carbon nanotube fibres. Carbon N. Y. 50, 3876–3881. doi:10.1016/j.carbon.2012.04.031
Zhandarov, S., and Mäder, E. (2003). Indirect estimation of fibre/polymer bond strength and interfacial friction from maximum load values recorded in the microbond and pull-out tests. Part II: critical energy release rate. J. Adhes. Sci. Technol. 17, 967–980. doi:10.1163/156856103322112879
Zhandarov, S., and Mäder, E. (2005). Characterization of fibre/matrix interface strength: applicability of different tests, approaches and parameters. Compos. Sci. Technol. 65, 149–160. doi:10.1016/j.compscitech.2004.07.003
Zhandarov, S., and Mäder, E. (2014). An alternative method of determining the local interfacial shear strength from force-displacement curves in the pull-out and microbond tests. Int. J. Adhes. Adhes. 55, 37–42. doi:10.1016/j.ijadhadh.2014.07.006
Keywords: carbon nanotube fibers, coatings, single fiber tensile test, interphase, single fiber pull-out test, fracture surface
Citation: Mäder E, Liu J, Hiller J, Lu W, Li Q, Zhandarov S and Chou T-W (2015) Coating of carbon nanotube fibers: variation of tensile properties, failure behavior, and adhesion strength. Front. Mater. 2:53. doi: 10.3389/fmats.2015.00053
Received: 01 December 2014; Accepted: 06 July 2015;
Published: 22 July 2015
Edited by:
Alexander Bismarck, University of Vienna, AustriaReviewed by:
Chung Hae Park, Ecole Nationale Supérieure des Mines de Douai, FranceClaudia Merlini, Federal University of Santa Catarina, Brazil
Tomi Herceg, Imperial College London, UK
Copyright: © 2015 Mäder, Liu, Hiller, Lu, Li, Zhandarov and Chou. This is an open-access article distributed under the terms of the Creative Commons Attribution License (CC BY). The use, distribution or reproduction in other forums is permitted, provided the original author(s) or licensor are credited and that the original publication in this journal is cited, in accordance with accepted academic practice. No use, distribution or reproduction is permitted which does not comply with these terms.
*Correspondence: Edith Mäder, Department of Composite Materials, Leibniz-Institut für Polymerforschung Dresden e.V., Hohe Strasse 6, Dresden D-01069, Germany, emaeder@ipfdd.de