New creep-resistant cast alloys with improved oxidation resistance in water vapor at 650–800°C
 Sebastien Dryepondt
 Bruce A. Pint
- Materials Science and Technology Division, Oak Ridge National Laboratory, Oak Ridge, TN, USA
Cast stainless steel CF8C-Plus (19wt%Cr/12%Ni) has excellent creep properties, but limited oxidation resistance above 700°C in environments containing H2O. One strategy to improve the alloy oxidation performance is to increase the Cr and Ni concentration. Two new alloys, with, respectively, 21wt%Cr–15wt%Ni and 22wt%Cr–17.5wt%Ni were therefore developed and their long-term oxidation behaviors in humid air were compared with the oxidation behavior of five other cast alloys. At 650°C and 700°C, all the alloys formed internal Cr-rich nodules, and outer nodules or layers rich in Fe and Ni, but they grew a protective Cr-rich inner layer over time. At 750°C, the lower alloyed steels such as CF8C-Plus showed large metal losses, but the two new alloys still exhibited a protective oxidation behavior. The 21Cr–15Ni alloy was severely oxidized in locations at 800°C, but that was not the case for the 22Cr–17.5Ni alloy. Therefore, the two new modified alloys represent a potential operating temperature gain of, respectively, 50°C and 100°C in aggressive environments compared with the CF8C-Plus alloy.
Introduction
Increasing the operating temperature and pressure of internal combustion engines is a straightforward solution to improve the engine efficiency and decrease air pollutant emission. There is therefore a growing need for new cost-effective alloys with enhanced mechanical properties and oxidation resistance at 650°C and above (Davis et al., 2012). CF8C-Plus (CF8CP) is a cast stainless steel with improved high-temperature creep strength that was developed in 2002 by ORNL in collaboration with Caterpillar. The composition of the alloy is based on the standard CF8C steel, which is a cast version of the wrought type 347 alloy, but with the addition of Mn and N to form strengthening Nb-nano-carbonitride, and careful balancing of the other alloying elements to avoid the formation of the detrimental ferrite phase (Shingledecker et al., 2005, 2006; Evans et al., 2010). The alloy won in 2003 an R&D100 award and is commercially used to fabricate diesel exhaust components (Maziasz and Pint, 2010).
Creep properties of CF8CP steel can be further improved as is found in some stainless steels by adding Cu to form nanoscale Cu precipitates (Sawaragi and Hirano, 1990; Swindeman et al., 1990; Wu et al., 2005; Chi et al., 2012; Ha and Jung, 2012). The new version of CF8CP, called CF8CWCu, with ~3% of Cu and ~1% of W for solution strengthening, has demonstrated even better creep properties, similar to more expensive Ni-based alloys such as alloy 625 and 617 (Shingledecker et al., 2005; Maziasz and Pint, 2011). However, the oxidation resistance of these two alloys is degraded in the presence of water vapor (Maziasz and Pint, 2011), which will limit their use in aggressive atmospheres such as exhaust gas and steam. The effect of water vapor on the oxidation of ferritic and austenitic steels has been the focus of many studies (Quadakkers et al., 2009), and several mechanisms have been proposed to explain the detrimental impact of H2O, including higher Cr2O3 growth rate (Henry et al., 2000; Hultquist et al., 2000), formation and evaporation of oxy-hydroxide (Asteman et al., 2000; Schutze et al., 2004; Young and Pint, 2006), and enhanced internal oxidation of Cr (Essuman et al., 2008; Quadakkers et al., 2009).
One straightforward route to improve oxidation resistance is to increase the level of Cr in the alloy to better promote the formation of an external Cr2O3 scale (Peraldi and Pint, 2004; Saunders et al., 2008; Meier et al., 2010), but increasing the Cr content alone could have a detrimental impact on the alloy mechanical properties. However, Peraldi and Pint demonstrated with a series of Fe–Cr–Ni model alloys that increasing Ni content can also improve oxidation performance in water vapor (Peraldi and Pint, 2004). Two new cast alloys have therefore been developed based on the CF8CWCu composition, with significant increases in Cr and Ni, to 21 wt% Cr and 15 wt% Ni for one alloy, and to 22 wt% Cr and 17.5 wt% Ni for the other alloy, compared with ~19 wt% Cr and 12 wt% Ni for the base CF8CP steel. Tensile and creep testing were conducted on the two newly developed alloys, and the results indicate that the mechanical properties of these alloys are modestly lower than alloy CF8CWCu, but still better than CF8CP and suitable for high-temperature structural applications (Unocic et al., submitted). The goal of this paper is to compare the long-term oxidation behavior in humid air at temperature ranging from 650°C to 800°C of these two new alloys with five other cast alloys, CF8C, CF10M (cast type 316 stainless steel), CF8CP, and two heats of CF8CWCu. The effect of Ni and Cr concentrations on the alloys oxidation performance is discussed in detail.
Experimental Procedure
Seven alloys were cast by Stainless Foundry and Engineering Inc., including three commercial cast alloys, CF8C, CF8C-Plus (CF8CP), and CF10M, two versions of the CF8CWCu alloy (different batches), and the two new modified alloys with higher levels of Cr and Ni compared to CF8CWCu, alloy 21Cr–15Ni and alloy 22Cr–17.5Ni. The composition of these alloys, as measured by inductively coupled plasma (ICP), combustion, and inert gas fusion (IGF) analyses, are given in Table 1.
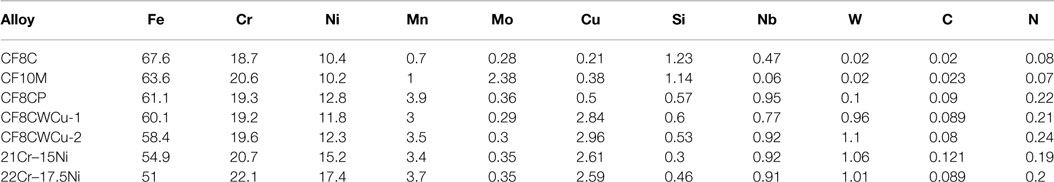
Table 1. Composition of the cast alloys measured by inductively coupled plasma (ICP), combustion, and inert gas fusion (IGF) analyses.
Rectangular oxidation coupons, ~20 mm × 10 mm × 2 mm were machined from plates or Kiel blocks, polished to a 600 grit surface finish, and cleaned in an ultrasonic bath with acetone, and then methanol. Cyclic oxidation testing was conducted at 650°C, 700°C, 750°C, and 800°C for 1000 and 5000 h in air + 10% Vol. H2O using four horizontal tube furnaces with sealed alumina chambers. Distilled water was atomized above its condensation temperature into dry air flowing at a rate of 850 cc/min (1.6–1.9/cm/s). Every 100 h, the oxidation coupons were removed from the furnace and weighted using a Mettler model XP205 balance with an accuracy of ±0.04 mg (~0.01 mg/cm2).
Specimens were cross-sectioned after exposure using conventional metallography techniques and observed by optical microscopy. Cu-plating was used to protect the oxide scale during specimen preparation. For selected specimens, the composition of the oxide layer and the alloy beneath the scale was measured using a JEOL JXA-8200 electron probe microanalyzer (EPMA) equipped with five vertical spectrometers. Only one CF8C and one CF10M oxidation coupons were exposed at each temperature, and the microstructure of these specimens was not characterized.
Results
Oxidation at 650°C
Specimen mass gains for the seven cast alloys exposed in air + 10% H2O at 650°C and 700°C are displayed in Figure 1. At 650°C, the CF8CP, CF10M, CF8CWCu-1, and CF8CWCu-2 alloys all exhibit first a transient oxidation stage for ~500 h with faster oxidation rates, before reaching a steady slow-growing oxidation stage. The mass gains reached after the transient stage were slightly different for the two coupons of the same alloy, but the oxidation behaviors were similar. For the 21Cr and 22Cr alloys, an incubation period was observed for, respectively, ~1000 and 2000 h, with very low mass gain, followed by a nearly linear increase of the mass gain. For the 21Cr alloy, the mass gain rate decreased after 3000 h, to a rate similar to the rates measured for the other alloys. Alloy CF8C was the only alloy showing a constant decrease of the specimen mass for the 5000 h of exposure at 650°C (final mass loss of −2.9 mg/cm2), and spallation of the oxide scale was visually observed.
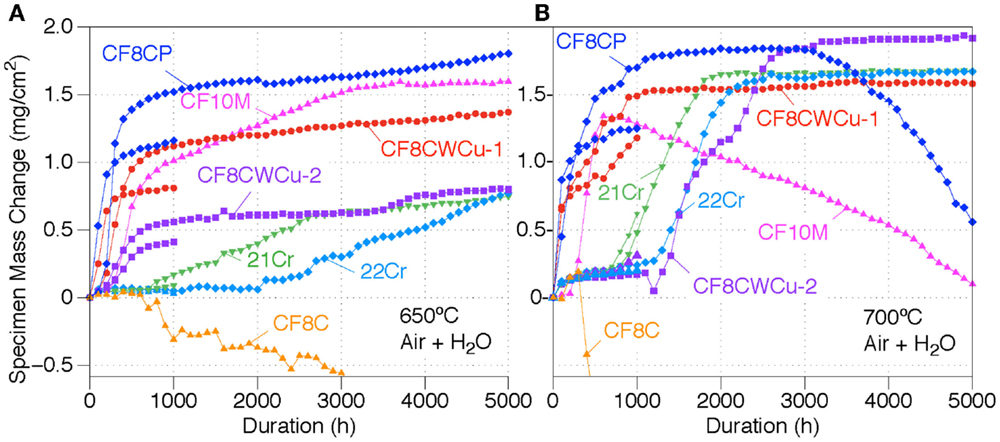
Figure 1. Mass change curves for alloys CF8C, CF8CP, CF10M, CF8CWCu-1, CF8CWCu-2, 21Cr–15Ni, and 22Cr–17.5Ni exposed in air + 10% H2O for 1000 and 5000 h at (A) 650°C and (B) 700°C.
Cross-section images of the oxidation coupons after 1000 and 5000 h of exposure are shown in Figure 2. For the CF8CP, CF8CWCu-1, and CF8CWCu-2 alloys, an inhomogeneous ~10 μm bi-layer scale was observed after 1000 h, with thinner areas often related to interdendritic regions from the cast alloy microstructure. After exposure for 5000 h, large inner nodules were observed for alloys CF8CP and CF8CWCu-1, up to ~20 μm deep. For alloy CF8CWCu-2, the scale thickness increased only slightly from 1000 to 5000 h of exposure. For the 21Cr and 22Cr alloys, the thin oxide scale observed after 1000 h is consistent with the very low mass gain measured at the beginning of the test. However, small nodules appeared all over the specimens after 5000 h of exposure, Figures 2H,J, which explains the higher reaction rate later in the 5000 h experiment.
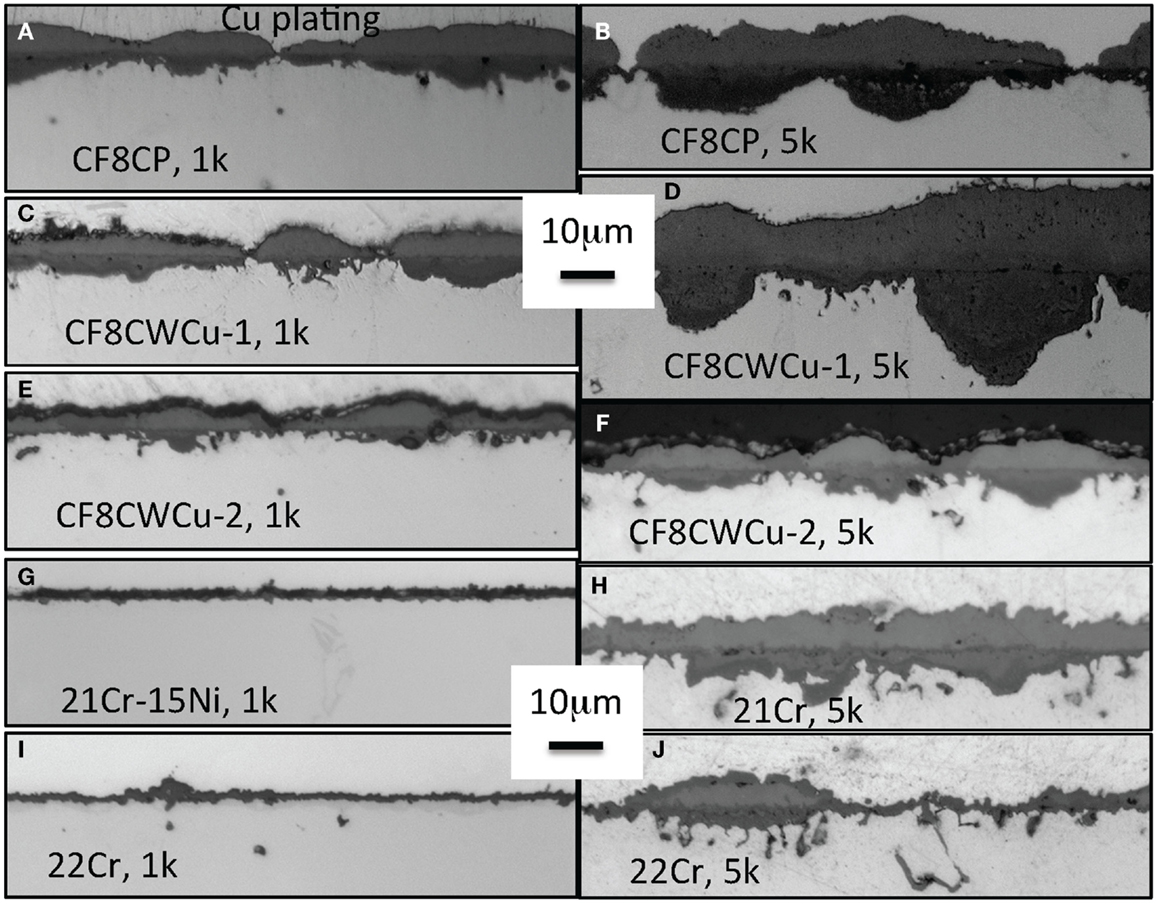
Figure 2. Cross-section optical micrographs after exposure in air + 10% H2O at 650°C, (A) CF8CP, 1000 h, (B) CF8CP, 5000 h, (C) CF8CWCu-1, 1000 h, (D) CF8CWCu-1, 5000 h, (E) CF8CWCu-2, 1000 h, (F) CF8CWCu-2, 5000 h, (G) 21Cr-15Ni, 1000 h, (H) 21Cr-15Ni, 5000 h (I) 22Cr-17.5Ni, 1000 h, and (J) 22Cr-17.5Ni, 5000 h.
Oxidation at 700°C
As can be seen in Figure 1B, a fast initial oxidation stage for alloy CF8CP and alloy CF8CWCu-1 at 700°C was again followed by a slow-growing steady-state stage. A third oxidation stage was observed for alloy CF8CP after ~3000 h, with constant mass losses. Alloy CF10M showed the same initial fast oxidation stage followed by a constant mass decrease for the remaining 4300 h. The CF8C coupon initially gained some weight, but then started to lose weight rapidly after only 400 h (final mass loss of −10.5 mg/cm2), again because of scale spallation.
In the case of alloys, 21Cr, CF8CWCu-1, and 22Cr, slow mass gains again were initially observed, followed by a fast acceleration of the oxidation rate for ~1000 h to reach a new steady oxidation stage suggesting slow growth of the scale. The cross-section micrographs displayed in Figure 3 show oxide scales at 700°C that are very consistent with the 700°C mass gains data. After 1000 h, a very thin oxide scale was observed for alloy CF8CWCu-2 and 22Cr, because the two alloys were still in the slow growth oxidation stage. A slightly thicker oxide scale was observed for the 21Cr alloy because the accelerated oxidation stage had already started. A significantly thicker oxide scale was already present for alloy CF8CP and CF8CWCu-1 after 1000 h, with deep internal nodules. After 5000 h, a thick duplex oxide was observed for all the alloys, with a wavy alloy/scale interface and a more uniform outer layer. Scale spallation was visually noticed for the CF8CP specimens exposed for 5000 h, consistent with the mass loss exhibited in Figure 1B.
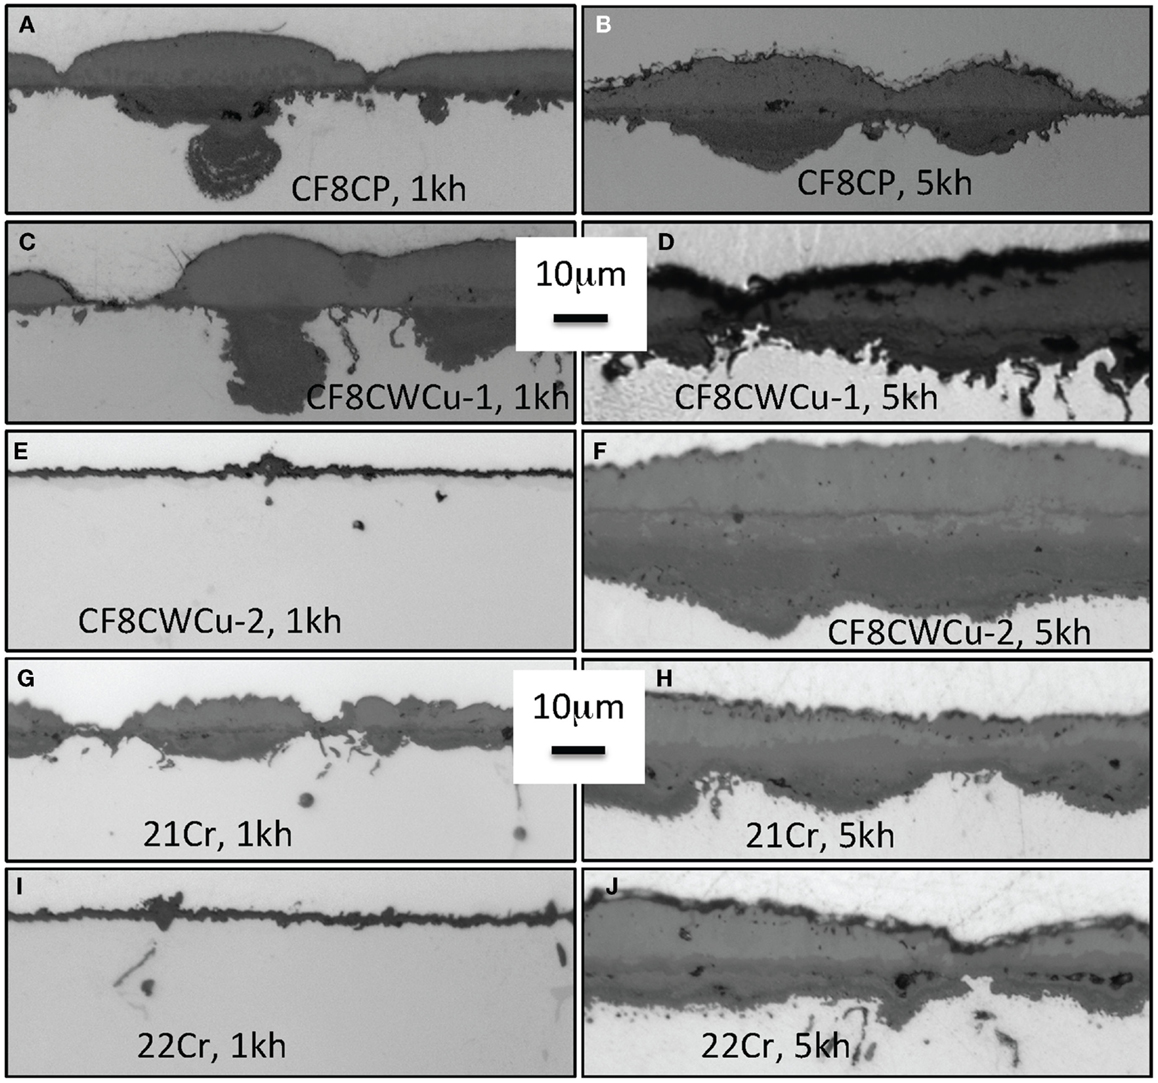
Figure 3. Cross-section optical micrographs after exposure in air + 10% H2O at 700°C, (A) CF8CP, 1000 h, (B) CF8CP, 5000 h, (C) CF8CWCu-1, 1000 h, (D) CF8CWCu-1, 5000 h, (E) CF8CWCu-2, 1000 h, (F) CF8CWCu-2, 5000 h, (G) 21Cr–15Ni, 1000 h, (H) 21Cr–15Ni, 5000 h, (I) 22Cr–17.5Ni, 1000 h, and (J) 22Cr–17.5Ni, 5000 h.
The EPMA elemental maps presented in Figure 4 show that the oxide scale formed on alloy CF8CP was composed of three distinct layers; an outer Fe-rich oxide layer, a thin intermediate (Fe,Ni) layer consistent with spinel, and an inner layer of Cr-rich nodules with small additions of Si. Areas where the oxide scale is thinner are again related to the interdendritic zone of the alloy intersecting the surface, and it is easily identified by the characteristic enrichments in Mo and Nb. Traces of Mn were detected at the very outer surface of the oxide scale and in the inner Cr layer.
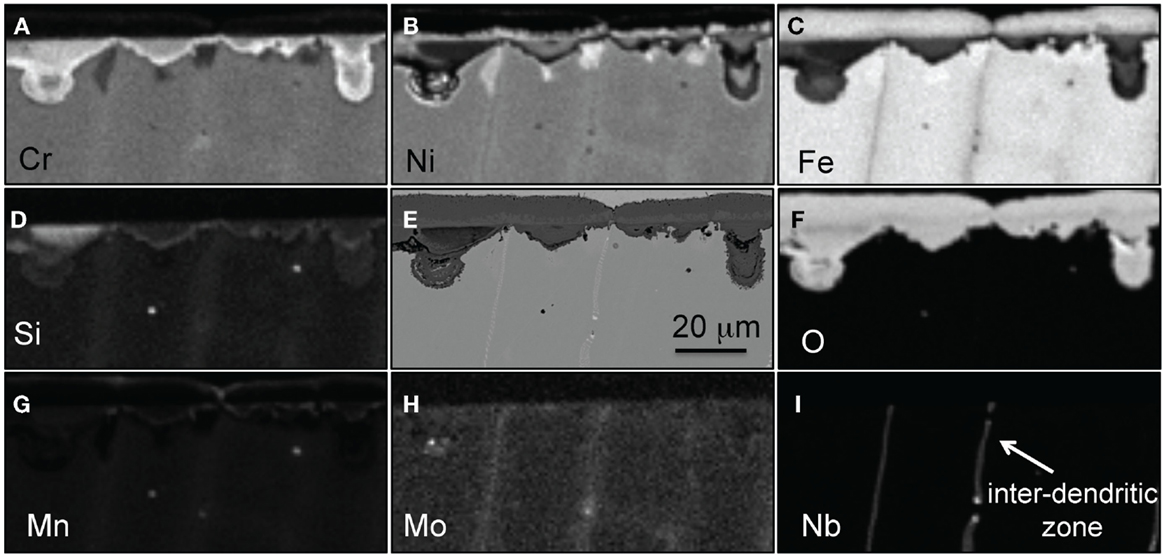
Figure 4. EPMA mapping for alloy CF8CP after exposure for 1000 h in air + 10% H2O at 700°C, (A) Cr, (B) Ni, (C) Fe, (D) Si, (E) SEM picture, (F) O, (G) Mn, (H) Mo, and (I) Nb.
Similar chemical maps are displayed in Figure 5, this time for alloy 22Cr–17.5Ni after only 1000 h. The thin protective scale formed after 1000 h consists of an Cr–Mn–Si rich zone consistent with spinel or multi-layer structure (Mn-rich outer layer, Cr-rich oxide, and SiO2 at metal–scale interface). Below the oxide scale, a zone depleted in Cr and Mn has formed that appears to be rich in Fe and Ni. This depleted zone is in general very thin, <7 μm, but larger local areas are observed, most likely because of the original chemical heterogeneity of the cast alloy. The Cr depletion is accelerated by the loss of Cr from the formation of oxy-hydroxide and once the depletion becomes large enough, this layer will be consumed, resulting in a faster reaction rate.
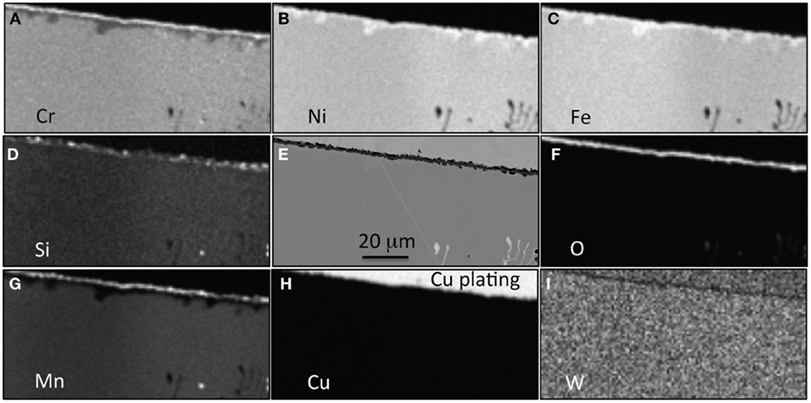
Figure 5. EPMA mapping for alloy 22Cr–17.5Ni after exposure for 1000 h in air + 10% H2O at 700°C, (A) Cr, (B) Ni, (C) Fe, (D) Si, (E) SEM picture, (F) O, (G) Mn, (H) Cu, and (I) W.
After exposure for 5000 h at 700°C, in Figure 6, four different oxide layers were present at the surface of alloy 22Cr: an outer Fe-rich layer (1), a thin and flat Cr-rich oxide layer that may be a remnant of the Cr-rich oxide seen in Figure 5 (2), internal Ni-rich nodule-like regions (3), and a thin Cr-rich oxide layer following the nodule outlines (4). Si has segregated mostly in the two Cr-rich layers. Mn was also present in the Cr-rich layers, but Mn was also found at the oxide scale surface in the Fe-rich oxide layer. Again, the metal alloy beneath the second inner Cr-rich oxide layer was depleted in Cr and Mn and enriched in Ni and Fe. It is worth noting that elongated precipitates rich in Cr, Mo, and Si have formed after 5000 h in the bulk of the 22Cr alloy.
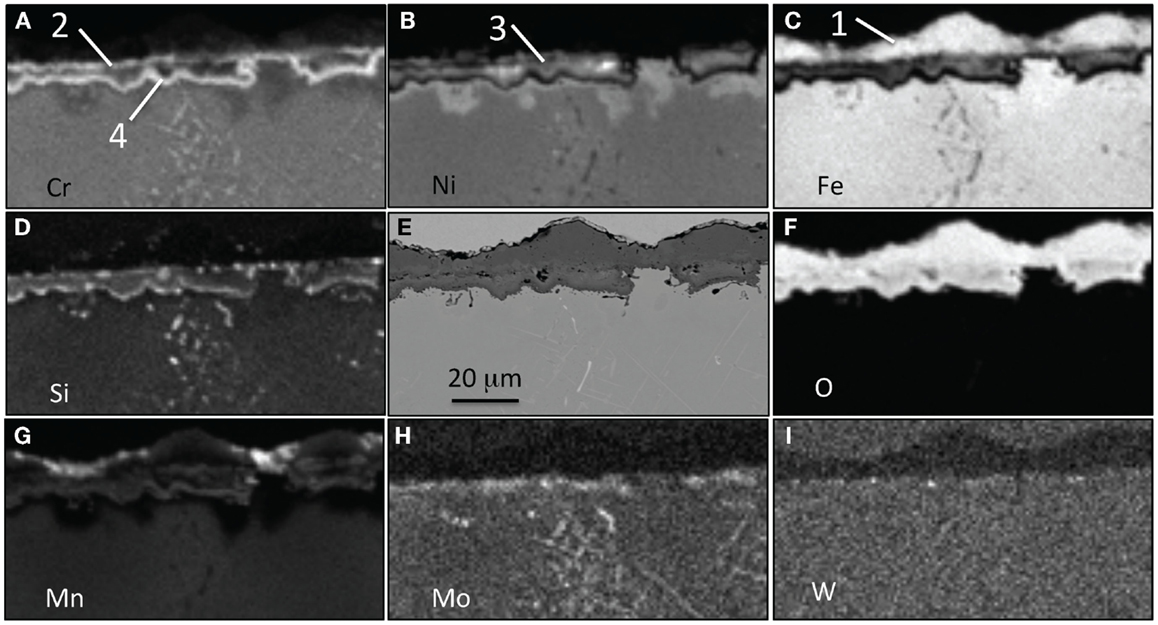
Figure 6. EPMA mapping for alloy 22Cr–17.5Ni after exposure for 5000 h in air + 10% H2O at 700°C, (A) Cr, (B) Ni, (C) Fe, (D) Si, (E) SEM picture, (F) O, (G) Mn, (H) Mo, and (I) W. Four different oxide layers are labels.
Oxidation at 750°C
The mass changes for the CF8C, CF10M, CF8CP, CF8CW, CF8CWM, 21Cr, and 22Cr alloys at 750°C in air + 10% H2O are shown in Figure 7. Significant mass losses were observed for alloys CF8C and CF8CP, reaching, respectively, −11 and −55 mg/cm2 after only 1000 h. Such rapid mass loss is typically associated with massive scale spallation. The oxidation behaviors of the CF8CWCu-1 and CF8CWCu-2 alloys were clearly superior, with four different oxidation stages suggested by the mass change data. Small mass gains were measured at the beginning, followed by sudden mass losses. The specimen weights then remained the same for up to ~2500 h, and progressive mass decreases were observed during the final oxidation stage. In contrast, both the 21Cr and 22Cr alloys exhibited relatively protective oxidation behaviors at 750°C, with small mass gains for the first ~1000 h and subsequent slow mass loss for the remaining ~4000 h, consistent with small amounts of scale spallation or Cr oxy-hydroxide evaporation. As will be explained later, localized spallation is likely to be predominant. The CF10M alloy behaved in a similar manner, but the specimen loss rate was significantly higher.
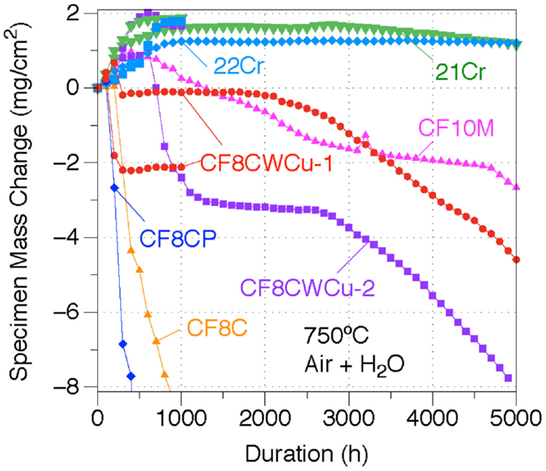
Figure 7. Mass change curves for alloys CF8C, CF8CP, CF10M, CF8CWCu-1, CF8CWCu-2, 21Cr–15Ni, and 22Cr–17.5Ni exposed in air + 10% H2O at 750°C for 1000 and/or 5000 h.
Cross-section micrographs of the oxidation coupons exposed for 1000 and 5000 h at 750°C are presented in Figure 8. The CF8CP alloy exhibited a thick porous oxide scale after 1000 h composed of deep inner nodules and an inhomogeneous outer layer with numerous cracks and obvious signs of spallation. The bi-layer oxide scale formed on alloy CF8CWCu-2 after 1000 h appeared similar to what was observed after 5000 h of exposure at 700°C. After 5000 h, the oxide scale was quite inhomogeneous, with many areas with large inner nodules below a thick outer layer, but locally a relatively thin oxide scale was still present, as seen in Figure 8C. Spallation of the outer layer was often observed in the areas with deep internal oxide nodules.
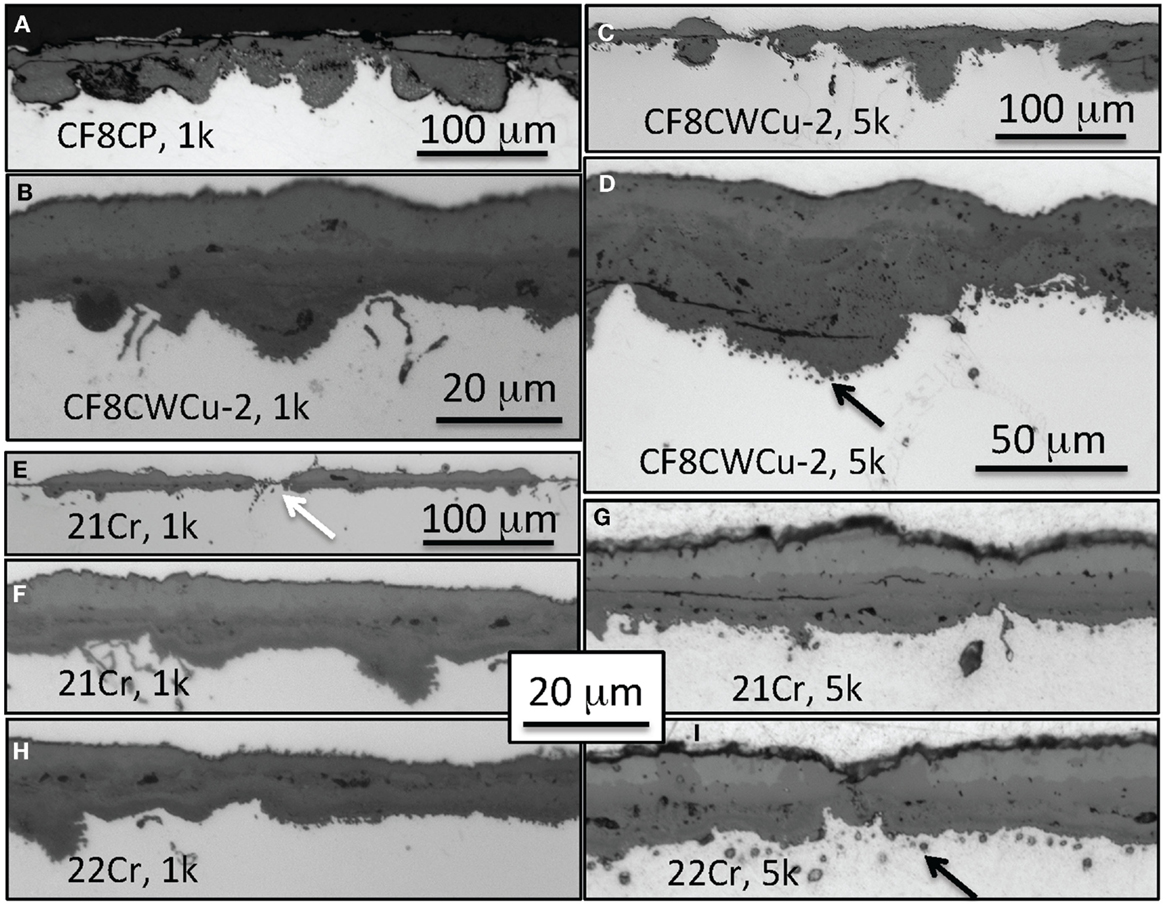
Figure 8. Cross-section optical micrographs after exposure in air + 10% H2O at 750°C, (A) CF8CP, 1000 h, (B) CF8CWCu-2, 1000 h, (C,D) CF8CWCu-2, 5000 h, (E,F) 21Cr–15Ni, 1000 h, (G) 21Cr–15Ni, 5000 h (H) 22Cr–17.5Ni, 1000 h, and (I) 22Cr–17.5Ni, 5000 h.
In the case of alloy, 21Cr and 22Cr, a ~15 μm multi-layer scale was mainly observed after 1000 h at 750°C, but a thin ~5 μm thick scale was also present locally (see white arrow in Figure 8E). After 5000 h of exposure, a slightly thicker multi-layer scale grew all over the specimen. Black arrows in Figures 8D,F highlight the presence of small voids for alloys CF8CWCu-2, 21Cr, and 22Cr observed beneath the inner oxide scale after exposure for 5000 h.
Oxidation at 800°C
The mass gain curves for the different alloys at 800°C are shown in Figure 9. For alloys CF8C, CF8CP, and CF8CWCu-1, rapid mass losses were measured and only 1000 h experiments were conducted. The two CF8CWCu-2 coupons gained weight during the first 100 h cycle and then lost weight for the remainder of the test, reaching −17 mg/cm2 for the coupon tested for 5000 h. The oxidation resistance of alloy 21Cr was superior, with only a small mass gain for the first ~1000 h. However, the specimen exposed for a longer duration started to lose mass nearly linearly after 1000 h with a final mass loss of ~ −8 mg/cm2 after 5000 h. Only alloy 22Cr exhibited a protective oxidation behavior at 800°C, with again small mass gains for the first ~1000 h, and then slow mass losses down to only ~ −0.37 mg/cm2 after 5000 h.
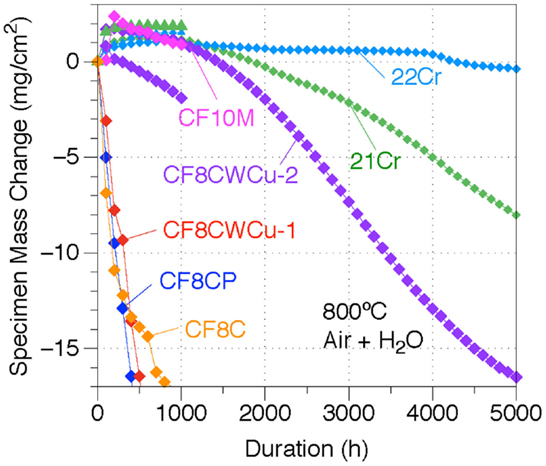
Figure 9. Mass change curves for alloys CF8C, CF8CP, CF10M, CF8CWCu-1, CF8CWCu-2, 21Cr–15Ni, and 22Cr–17.5Ni exposed in air0 + 10% H2O at 800°C for 1000 h for alloys CF8C and CF10M and 1000 and 5000 h for all the other alloys.
Optical plan views and cross-sections of alloys CF8CWCu-2, 21Cr, and 22Cr after exposure for 5000 h at 800°C are presented in Figure 10. The oxidation degradation was clearly not homogeneous for the CF8CWCu-2 and 21Cr alloys, and red arrows highlight areas with nodule formation and spallation.
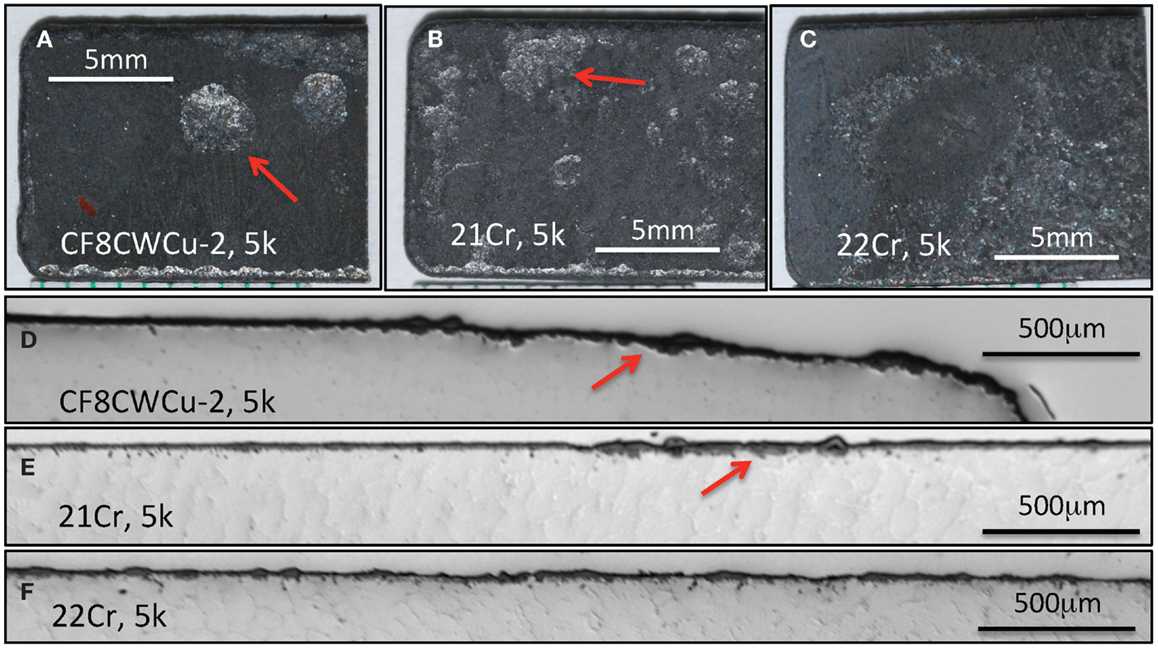
Figure 10. Optical images of specimens exposed for 5000 h at 800°C in air + H2O, (A) top view, alloy CF8CWCu-2, (B) top view, alloy 21Cr, (C) top view, alloy 22Cr, (D) Cross-section, alloy CF8CWCu-2, (E) Cross-section, alloy 21Cr, and (F) Cross-section, alloy 22Cr. Red arrows highlight areas with localized high rate corrosion attack.
Details of the scale cross-section structures are given in Figure 11 for alloys CF8CP, CF8CWCu-1, CF8CWCu-2, 21Cr, and 22Cr. After 1000 h at 800°C, a nodular inner subscale was observed for alloys CF8CP and CF8CWCu-1, beneath a thick inner oxide layer. Most of the outer oxide layer had spalled away. Figure 11C clearly shows that after 1000 h at 800°C, the oxide scale at the surface of the CF8CWCu-2 sample was inhomogeneous, with some areas having a relatively thin oxide scale, while other areas exhibited large internal oxide nodules.
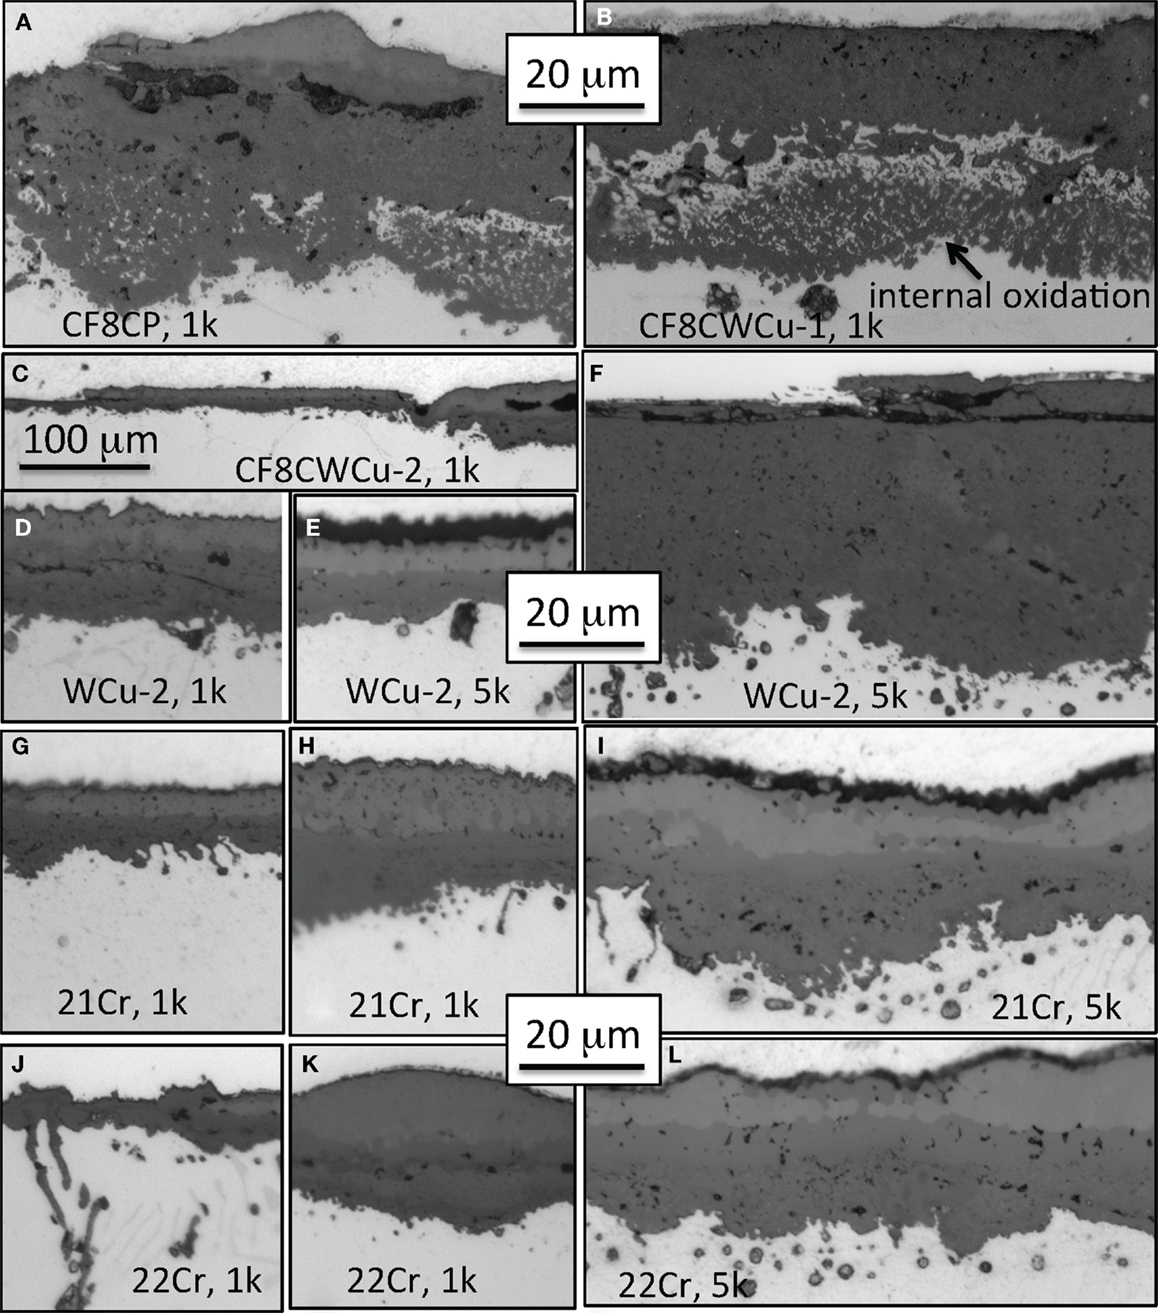
Figure 11. Cross-section optical micrographs after exposure in air + 10%H2O at 800°C, (A) CF8CP alloy for 1000 h, (B) CF8CWCu-1 alloy for 1000 h, (C,D) CF8CWCu-2 alloy for 1000 h, (E,F) CF8CWCu-2 alloy for 5000 h, (G,H) 21Cr–15Ni alloy for 1000 h, (I) 21Cr–15Ni alloy for 5000 h, (J,K) 22Cr–17.5Ni alloy for 1000 h, and (L) 22Cr–17.5Ni alloy for 5000 h.
After 5000 h, the observations were similar, but now the nodular oxide areas grew in size and number. Figures 11E,F show, respectively, a thin oxide scale and a region of thick internal subscale, the external layer having spalled away. The thin scale after 5000 h looks very similar to the scale observed after 1000 h, in a similar low-corrosion area (Figure 11D). For the 21Cr specimens, the scale grown after 1000 h at 800°C was relatively homogeneous with a thickness varying from 10 to 20 μm (Figures 11G,H). However, after 5000 h, internal nodules became larger, Figure 11I, and, in some high-corrosion areas, very deep nodules and spallation of the outer scale were observed, similar to the observation for the CF8CWCu-2 specimen. The oxide scale formed on alloy 22Cr was similar to the scale grown on alloy 21Cr, both after 1000 and 5000 h, except that no high-corrosion/nodular oxide areas were observed (Figures 11J–L).
EPMA elemental maps for the CF8CP specimen exposed for 1000 h at 800°C are shown in Figure 12. A 25 μm thick Cr-rich inner oxide was observed. In this particular region, it appeared that there was a region of newly formed inner oxide with a lower Cr content and a center rich in Ni and Fe, likely because of metal entrapment. Note that where the inner layer is well-established, the adjacent metal is depleted in Cr and enriched in Ni. To the right where the new oxide nodule has formed, less Cr depletion is evident. Silicon was randomly distributed in the oxide scale and no Mn was detected. The outer layer containing Fe and Ni oxides had certainly spalled away. Similar elemental maps are presented in Figure 13, this time for alloy CF8CWCu-2, in a typical lower-corrosion area. Four or five different layers seem to be present: an outer discontinuous (Ni, Mn) spinel layer with a small amount of Cr (1), an Fe-rich layer (2), a Cr-rich layer containing some Fe (3), an Ni-rich layer with again some Fe (4), and then finally a Cr-rich inner layer (5). Silicon and Mn were present in the Cr and Ni layers. A very similar multi-layered scale was observed at the CF8CWCu-2 surface after exposure for 5000 h at 800°C, Figure 14. The only difference is the absence of an intermediate Cr-rich layer, but Cr was detected in the Ni-rich layer. EDX mapping of the scale grown on alloy 21Cr revealed a very similar oxide scale structure.
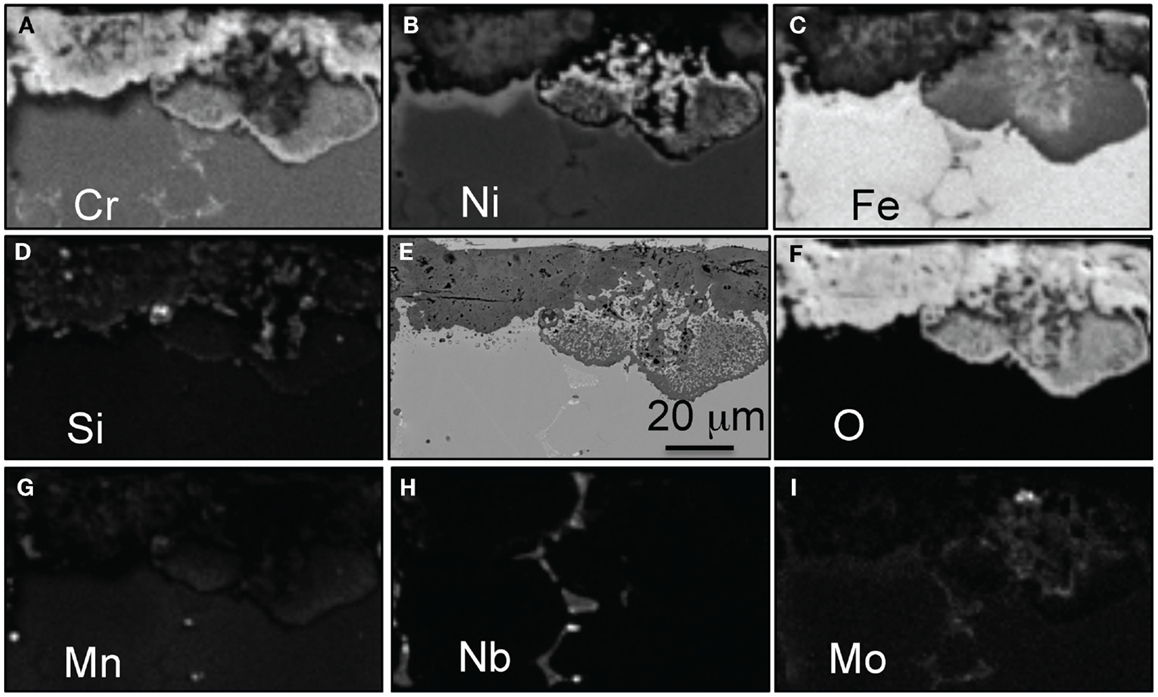
Figure 12. EPMA mapping for alloy CF8CP exposed for 1000 h in air + 10% H2O at 800°C, (A) Cr, (B) Ni, (C) Fe, (D) Si, (E) SEM picture, (F) O, (G) Mn, (H) Nd, and (I) Mo.
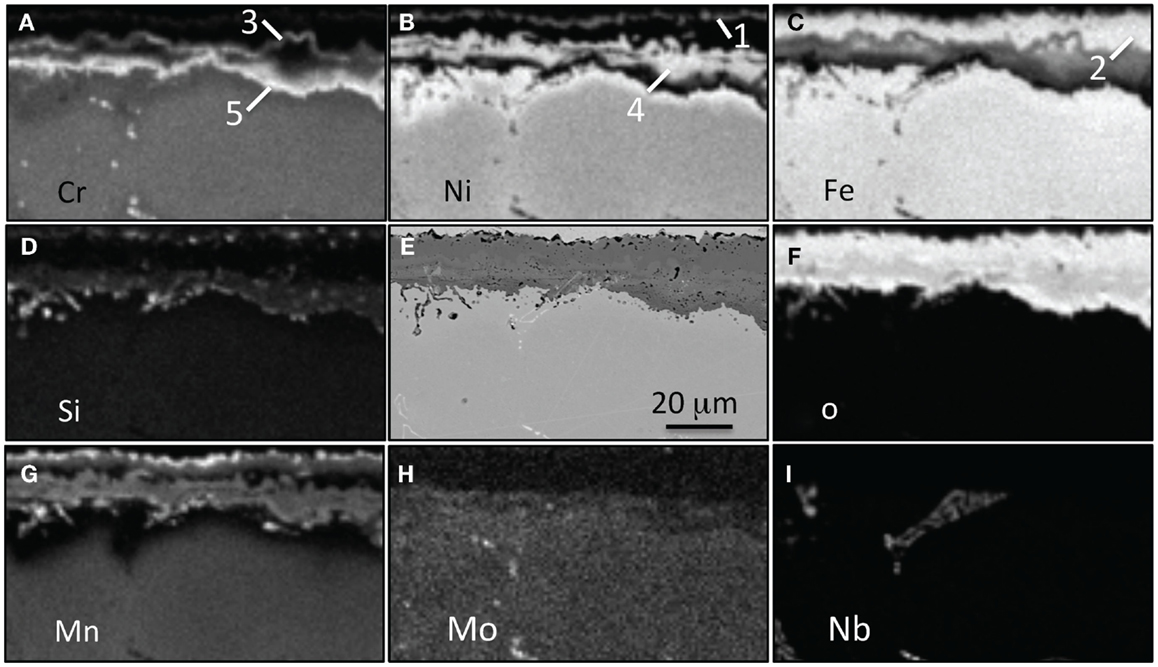
Figure 13. EPMA mapping for alloy CF8CWCu-2 exposed for 1000 h in air + 10% H2O at 800°C, (A) Cr, (B) Ni, (C) Fe, (D) Si, (E) SEM picture, (F) O, (G) Mn, (H) Mo, and (I) Nb. Five different oxide scales are labels.
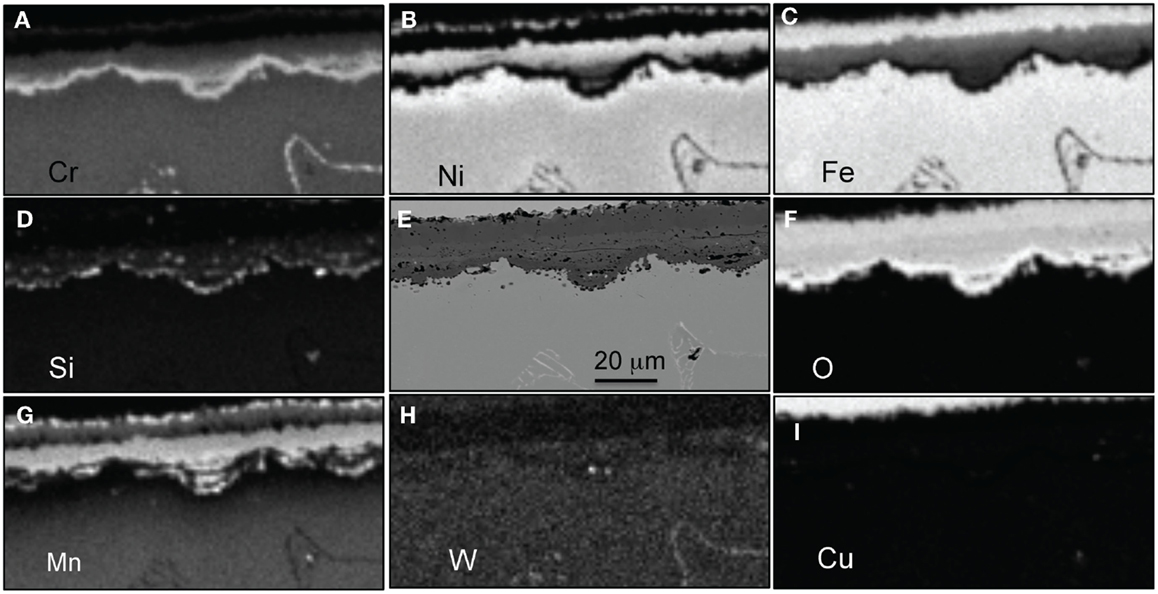
Figure 14. EPMA mapping for alloy CF8CWCu-2 exposed for 5000 h in air + 10%H2O at 800°C, (A) Cr, (B) Ni, (C) Fe, (D) Si, (E) SEM picture, (F) O, (G) Mn, (H) W, and (I) Cu.
Discussion
Loss of Protective Oxidation Behavior
It is well known that the selective oxidation of Cr in ferritic and austenitic steels to form a protective chromia (or Cr-rich) scale and maintain it long term requires two conditions. First, the Cr content in the alloy must be sufficient to ensure the formation of a continuous external scale and avoid internal oxidation (Wagner, 1952). Second, the diffusion of Cr from the bulk of the alloy must be sufficient to maintain the scale and avoid significant depletion of Cr beneath the scale. Recall that in the presence of water vapor, the Cr consumption includes Cr lost due to the formation of volatile CrO2(OH)2, which likely explains why this wet air environment is more aggressive than a similar test in dry or ambient air. The alloy composition, temperature, and oxidizing atmosphere can significantly affect the level of Cr required to meet these two criteria (Peraldi and Pint, 2004; Meier et al., 2010; Mu et al., 2013). At 650°C and 700°C, only the 21Cr and 22Cr alloys were able to form a (Cr,Mn)-rich layer during the first few hundred hours as shown in Figure 1. The exact structure of this thin scale has not been determined yet, but it was much more protective than the Fe and Ni-rich scale formed on the other alloys. Alloy CF8CWCu-2 formed a Cr-rich scale at 700°C but not at 650°C and alloys CF8CP and CF8CWCu formed non-protective mixed oxide layers. However, the formation of this mixed oxide layer may have sufficiently decreased the partial pressure of oxygen (PO2) at the alloy surface to promote the formation of a continuous and more protective inner Cr-rich oxide layer (Figure 4), resulting in a significant oxidation rate decrease after 500–1000 h (Figures 1 and 3). The formation of the Cr-rich oxide layer was also likely facilitated by a local increase of the Cr content at the alloy surface due to the fast consumption of Fe and Ni in the alloy to form the Fe- and Ni-rich scales. A third factor is that the Fe- and Ni-rich layer may inhibit formation of the CrO2(OH)2, thus reducing the flux of Cr needed to maintain the Cr-rich scale. Previously, it was shown that the Mn-rich oxide does not inhibit the loss of Cr from alloy foils of Fe- and Ni-base chromia-formers, i.e., Cr loss in wet air exposures was independent of alloy Mn content (Pint, 2005).
For the 21Cr and 22Cr alloys, the consumption of Cr and Mn to form a protective (Cr,Mn) oxide layer resulted in a ~5 μm alloy depleted zone in Cr and Mn after 1000 h at 700°C (Figure 5, 22Cr alloy). After longer exposure, the Cr content at the surface dropped below the critical content required for the (Cr,Mn)-rich layer to form, and an outer Fe-rich layer (Figure 6, layer 1) and an inner Ni-rich subscale layer (layer 3) grew, respectively, above and below the original Cr-rich layer (layer 2). This fast consumption of Fe and Ni led in return to a relative increase of the Cr concentration at the alloy surface, above the threshold to form a Cr-rich layer, so that a second inner Cr-rich layer formed beneath the Ni-rich inner subscale (Figure 6, layer 4). This succession of more protective/less protective oxidation stages can be clearly seen in the mass gain curves in Figure 1. The formation of the second (Cr,Mn,Si)-rich layer led again to a depleted zone at the specimen surface, which could result, for exposure time long enough to decrease the Cr content at the surface below the Cr threshold, again in the formation of Fe and Ni-rich oxide scales. It is not clear if the accelerated consumption of Cr due to the formation and evaporation of CrO2(OH)2 is hindered by the presence of the outer Fe-rich oxide layer. Similar depleted zones have been observed in austenitic steel superheater tubes (types 347H and 304H) after 4–30 kh in coal-fired boilers at ~550°C (Pint et al., Unpublished results)1.
At 650°C and 700°C, the diffusion of Cr and Mn from the bulk to the alloy surface appears to be the limiting factor for the continuous growth of a more protective Cr-rich oxide scale. One reason some alloys showed more attack at 650°C than at 700°C is that faster Cr diffusion at the higher temperature may enable maintenance of the Cr-rich scale at long times.
For alloy CF8CP at 750°C and alloys CF8CP and CF8CWCu-1 at 800°C, an inner subscale was observed beneath large oxide nodules (Figure 12). The outer oxide layers rich in Fe and Ni were poorly adherent and spalled frequently during cooling. Therefore, the level of Cr in these alloys was insufficient to form the more protective Cr-rich layer. For alloy CF8CWCu-1 at 750°C and alloys CF8CWCu-2, 21Cr, and 22Cr at 750°C and 800°C, multi-layered oxide scales were observed after 1000 h, but an inner, more protective Cr-rich layer (Figure 13, layer 5) was able to form in most cases. However, massive nodule formation caused by local accelerated oxidation attack was observed (Figures 10 and 11F) for alloys CF8CWCu-1 and CF8CWCu-2 at 750°C, and the same alloys plus the 21Cr alloy at 800°C. The significant mass losses measured for all these alloys (Figures 7 and 11) are related to the spallation occurring in these large nodular areas.
Effect of Alloy Composition on Oxidation Resistance
A summary of the specimen mass changes after 1000 or 5000 h in the 650–800°C range is shown in Figure 15. Considering low mass gain or low mass loss as acceptable after 5000 h for the desired application, the maximum operating temperature is ~650°C for alloy CF8C, 700°C for alloy CF8CP, between 700°C and 750°C for alloy CF10M, CF8CWCu-1, and CF8CWCu-2, between 750°C and 800°C for alloy 21Cr and ~800°C for alloy 22Cr.
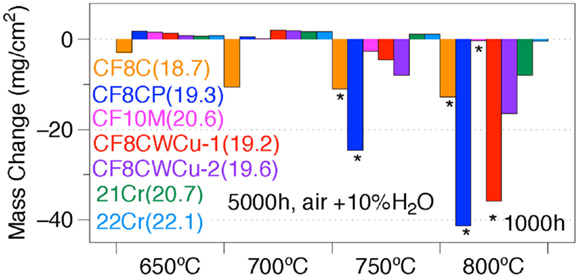
Figure 15. Specimen mass changes for alloys CF8C, CF8CP, CF10M, CF8CWCu-1, CF8CWCu-2, 21Cr–15Ni, and 22Cr–17.5Ni exposed in air + 10%H2O at 650–800°C for 1000 h or 5000 h. The Cr content of the alloys is indicated in parentheses.
The CF8C alloy did not perform as well as the other alloys because of its lower Cr and Ni contents, 18.7 and 10.4 wt%, respectively. Peraldi and Pint (2004) conducted 1 h cycle experiments at 650°C and 800°C in water vapor and showed, indeed, that increasing the Cr content from 12 to 20 wt% and/or the Ni content from 10% to 30% was beneficial for the alloy oxidation behavior. Similar results were shown for variations of Cr and Ni within the 347H specification, both higher Cr and higher Ni improved oxidation resistance (Pint and Dryepondt, 2014). Alloy CF10M has a similar composition as CF8C except for the addition of Mo and a higher level of Cr. Mo was not observed in the various oxide scales (Figures 6 and 13) and does not seem to play a role in the oxidation process, but the higher level of Cr, 20.6 wt%, is the likely reason for the better performance of alloy CF10M up to 750°C. The better oxidation behavior of alloys CF8CP, CF8CWCu-1, and CF8CWCu-2 compared with CF8C can be attributed to the higher levels of Ni and Mn. However, the reason for the superior performance of the WCu alloys compared with the CF8CP alloy is not clear. The only composition difference is the addition of Cu and W, but these two elements do not seem to participate in the oxidation process (Figures 5 and 14). The beneficial effect of Ni on oxidation resistance is not clearly understood, and Peraldi and Pint (2004) enumerated several potential explanations, including an effect of Ni on oxygen solubility, or on the activity of Cr and/or Fe at the oxide/alloy interface. Another plausible explanation is the stabilization of the austenite phase by Ni. In that case, the Cu addition is likely to play a similar austenite stabilizer role, which potentially enhances oxidation resistance. It is worth also noting that although both Mo and W are commonly used to strengthen alloys by solid solution, these two elements are chemically quite different. W is soluble in the austenite phase, is slow diffusing compared with Mo and Cr, and has a clear stabilizing effect on M23C6 carbides. W and Mo are, therefore, likely to have distinct effects on alloy oxidation resistance. Prior work with Fe–13at%Cr–5at% (W or Mo) alloys at 900°C (no H2O) found that both Mo and W additions improved oxidation resistance. Normally a 13%Cr alloy could not form a chromia scale at 900°C, but both W and Mo enabled formation (Pint, Unpublished results)2. Thus, there is some potential for refractory metal additions to have a beneficial effect on oxidation resistance.
Another explanation for the better oxidation behavior of CF8CWCu alloys is that these alloys are more homogeneous than the CF8CP alloy. These cast alloys do not require any heat treatment after fabrication for optimum creep performance, but the chemical inhomogeneity between the dendritic and interdendritic structure may affect the alloy oxidation, as can be seen for example in Figure 5. In the 700–750°C range, small local concentration variations could result in a transition from protective to non-protective oxidation behavior. Material inhomogeneity could also explain why the CF8CWCu-2 is more oxidation resistant at 800°C compared with alloy CF8CWCu-1, although the compositions of the two alloys are similar.
As expected, the higher levels of Cr and Ni in the two new alloys resulted in an improvement of the oxidation performance compared with the base CF8CWCu alloys. CF10M and the 21Cr alloys have the same Cr content but the higher content for the 21Cr alloy of austenite-stabilizing elements such as Ni, Mn, Cu, and N, likely explains the superior oxidation behavior of the 21Cr alloy. The best performing alloy was the 22Cr alloy, with only moderate mass change at 800°C and accelerated corrosion attack only at the specimen corners. The increase to 22Cr and 17.5Ni resulted, therefore, in a potential increase of ~100°C for the alloy operating temperature from the standpoint of oxidation resistance compared with the standard CF8CP, going from ~700°C to 800°C.
Conclusion
Three commercial cast alloys, CF8C, CF10M, and CF8C-Plus, and four newly developed cast stainless steels were tested in air + 10% H2O to simulate exhaust gas environments, at temperatures ranging from 650°C to 800°C for a duration of up to 5000 h. At 650°C and 700°C, a change in the oxidation behavior from protective to non-protective or non-protective to protective was observed due to depletion or enrichment beneath the oxide scale of elements such as Cr and Mn. For long-term exposure at 650° and 700°C, all the alloys, except for the CF8C, exhibited a relatively protective oxidation behavior due to the formation of an inner Cr, Mn-rich scale. Above 700°C, the alloys with the lower Cr and Ni contents, ~19 wt% Cr and less than 13 wt% Ni, started to locally form massive Fe-rich oxide nodules, and these alloys lost weight very rapidly when the outer portion of these nodules spalled. Increasing the Cr and Ni contents to, respectively, ~21 wt% Cr and 15 wt% Ni was sufficient to allow for the formation of an inner protective Cr-rich oxide layer at 750°C, but local highly corroded areas were observed at 800°C. This issue was solved by increasing the Cr and Ni level to 22 wt% Cr and 17.5 wt% Ni, and this newly developed cast alloy represents a potential gain of ~100°C in service temperature compared with the commercial CF8C-Plus alloy for operation in aggressive environments.
Conflict of Interest Statement
The Review Editor Guangling Song declares that, despite being affiliated to the same institution as the authors, the review process was handled objectively and no conflict of interest exists. The authors declare that the research was conducted in the absence of any commercial or financial relationships that could be construed as a potential conflict of interest.
Acknowledgments
The authors would like to thank M. Stephens for his help with the oxidation exposures, T. Lowe, H. Longmire, and T. Jordan for the metallography work, and D. Leonard for conducting the microprobe measurements. They want also to acknowledge M. Brady for reviewing the manuscript. This research was sponsored by the U.S. Department of Energy, Office of Energy Efficiency and Renewable Energy, Advanced Manufacturing Office.
Footnotes
References
Asteman, H., Svensson, J. E., Norell, M., and Johansson, L. G. (2000). Influence of water vapor and flow rate on the high-temperature oxidation of 304L; effect of chromium oxide hydroxide evaporation. Oxid. Met. 54, 11–26. doi: 10.1023/A:1004642310974
Chi, C., Yu, H., Dong, J., Liu, W., Cheng, S., and Liu, Z. (2012). The precipitation strengthening behavior of Cu-rich phase in Nb contained advanced Fe-Cr-Ni austenitic heat resistant steel for USC power plant application. Prog. Nat. Sci. 22, 175–185. doi:10.1016/j.pnsc.2012.05.002
Davis, P. B., Schutte, C. L., and Gibbs, J. L. (2012). Progress Report for Propulsion Materials. Washington, DC: US Department of Energy, Energy Efficiency and Renewable Energy.
Essuman, E., Meier, G. H., Zurek, J., Hansel, M., and Quadakkers, W. J. (2008). The effect of water vapor on selective oxidation. Oxid. Met. 69, 143–162. doi:10.1007/s11085-007-9090-x
Evans, N. D., Maziasz, P. J., Shingledecker, J. P., and Pollard, M. J. (2010). Structure and composition of nanometer-sized nitrides in a creep-resistant cast austenitic alloy. Met. Trans. 41, 3032–3041. doi:10.1007/s11661-010-0321-4
Ha, V. T., and Jung, W. S. (2012). Evolution of precipitate phases during long-term isothermal aging at 1083 K (810°C) in a new precipitation-strengthened heat-resistant austenitic stainless steel. Metall. Mater. Trans. 43A, 3366–3378. doi:10.1007/s11661-012-1150-4
Henry, S., Mougin, J., Wouters, Y., Petit, J. P., and Galerie, A. (2000). Characterization of chromia scales grown on pure chromium in different oxidizing atmospheres. Mater. High Temp. 17, 231. doi:10.1179/mht.2000.17.2.008
Hultquist, G., Tveten, B., and Hornlund, E. (2000). Hydrogen in chromium: influence on the high-temperature oxidation kinetics in H2O, oxide-growth mechanisms, and scale adherence. Oxid. Met. 54, 1. doi:10.1023/A:1004610626903
Maziasz, P. J., and Pint, B. A. (2010). “High temperature performance of cast CF8C-Plus austenitic stainless steel,” in Proceedings of the ASME Turbo Expo 2010, Glasgow.
Maziasz, P. J., and Pint, B. A. (2011). High temperature performance of cast CF8C-plus austenitic stainless steel. J. Eng. Gas Turbine Power 133, 1–5. doi:10.1115/1.4002828
Meier, G. H., Jung, K., Mu, N., Yanar, N. M., Pettit, F. S., Abellan, J. P., et al. (2010). Effect of alloy composition and exposure conditions on the selective oxidation behavior of ferritic Fe–Cr and Fe–Cr–X alloys. Oxid. Met. 74, 319–340. doi:10.1007/s11085-010-9215-5
Mu, N., Jung, K., Yanar, N. M., Pettit, F. S., Holcomb, G. R., Howard, B. H., et al. (2013). The effects of water vapor and hydrogen on the high- temperature oxidation of alloys. Oxid. Met. 79, 461–472. doi:10.1007/s11085-012-9349-8
Peraldi, R., and Pint, B. A. (2004). Effect of Cr and Ni contents on the oxidation behavior of ferritic and austenitic model alloys in air with water vapor. Oxid. Met. 61, 463–483. doi:10.1023/B:OXID.0000032334.75463.da
Pint, B. A. (2005). “The effect of water vapor on Cr depletion in advanced recuperator alloys,” in Proceedings of ASME Turbo Expo 2005 (Reno-Tahoe, NV: ASME), 1–8.
Pint, B. A., and Dryepondt, S. (2014). “Effect of alloy composition and surface engineering on steam oxidation resistance,” in Proc. 7th Inter. Conf. on Advances in Materials Technology for Fossil Power Plants, eds D. Gandy and J. Shingledecker (Materials Park, OH: ASM International), 803–814.
Quadakkers, W. J., Zurek, J., and Hansel, M. (2009). Effect of water vapor on high-temperature oxidation of FeCr alloys. JOM 61, 44. doi:10.1007/s11837-009-0102-y
Saunders, S. R. J., Monteiro, M., and Rizzo, F. (2008). The oxidation behavior of metals and alloys at high temperatures in atmospheres containing water vapour: a review. Prog. Mater. Sci. 53, 775–837. doi:10.1016/j.pmatsci.2007.11.001
Sawaragi, Y., and Hirano, S. (1990). “Development of a new 18-8 austenitic steel (0.1C-18Cr-9Ni-3Cu-Nb, N) with high elevated temperature strength for fossil fired boilers,” in American Society of Mechanical Engineers, Pressure Vessels and Piping Division (Publication) PVP, Vol. 201 (New York: ASME (American Society of Mechanical Engineers)), 141–146.
Schutze, M., Schorr, M., Renusch, D. P., and Vossen, J. P. T. (2004). The role of alloy composition, environment and stresses for the oxidation resistance of modern 9% Cr steels for fossil power stations. Mater. Res. 7, 111–123. doi:10.1590/S1516-14392004000100016
Shingledecker, J. P., Maziasz, P. J., Evans, N. D., and Pollard, M. J. (2005). “Alloy additions for improved creep-rupture properties of a cast austenitic alloy,” in Creep Deformation and Fracture, Design, and Life Extension, eds R. S. Mishra, J. C. Earthman, S. V. Raj, and R. Viswanathan (Warrendale, PA: MS&T Publications), 129–138.
Shingledecker, J. P., Maziasz, P. J., Evans, N. D., Santella, M. L., and Pollard, M. J. (2006). CF8C plus: a new high temperature austenitic casting alloy for advanced power systems. Energy Mater. 1, 25–32. doi:10.1179/174892306X99697
Swindeman, R. W., Bolling, E., and Li, C. Y. (1990). “Copper-bearing stainless steels for high temperature applications,” in Proceedings of the ASME 2013 Pressure Vessels and Piping Conference (Nashville, TN), 165–167.
Wagner, C. (1952). Theoritical analysis of the diffusion processes determining the oxidation rate of alloys. J. Electrochem. Soc. 99, 369–380. doi:10.1149/1.2779605
Wu, Q., Vasudevan, V. K., Shingledecker, J. P., and Swindeman, R.W. (2005). “Microstructure characterization of advanced boiler materials for ultra supercritical coal power plants,” Proceedings Fourth International Conference on Advances in Materials Technology for Fossil Power Plants (Materials Park, OH: ASM-International), 748–761.
Keywords: cast steels, oxidation, water vapor, CF8C, protective scale, creep
Citation: Dryepondt S, Pint BA and Maziasz PJ (2015) New creep-resistant cast alloys with improved oxidation resistance in water vapor at 650–800°C. Front. Mater. 2:55. doi: 10.3389/fmats.2015.00055
Received: 18 February 2015; Accepted: 27 July 2015;
Published: 13 August 2015
Edited by:
Her-Hsiung Huang, National Yang-Ming University, TaiwanReviewed by:
Ole Øystein Knudsen, SINTEF and NTNU, NorwayGuang-Ling Song, Oak Ridge National Laboratory, USA
Copyright: © 2015 Dryepondt, Pint and Maziasz. This is an open-access article distributed under the terms of the Creative Commons Attribution License (CC BY). The use, distribution or reproduction in other forums is permitted, provided the original author(s) or licensor are credited and that the original publication in this journal is cited, in accordance with accepted academic practice. No use, distribution or reproduction is permitted which does not comply with these terms.
*Correspondence: Sebastien Dryepondt, Materials Science and Technology Division, Oak Ridge National Laboratory, 1 Bethel Valley Road, MS6156, Oak Ridge, TN 37831, USA, dryepondtsn@ornl.gov