The Interfacial Transition Zone in Alkali-Activated Slag Mortars
 Rackel San Nicolas1,2*
  John L. Provis1,3*
- 1Department of Chemical and Biomolecular Engineering, University of Melbourne, Parkville, VIC, Australia
- 2Department of Infrastructure Engineering, University of Melbourne, Parkville, VIC, Australia
- 3Department of Materials Science and Engineering, University of Sheffield, Sheffield, UK
The interfacial transition zone (ITZ) is known to strongly influence the mechanical and transport properties of mortars and concretes. This paper studies the ITZ between siliceous (quartz) aggregates and alkali-activated slag (AAS) binders in the context of mortar specimens. Backscattered electron (BSE) images generated in an environmental scanning electron microscope (ESEM) are used to identify unreacted binder components, reaction products, and porosity in the zone surrounding aggregate particles, by composition and density contrast. X-ray mapping is used to exclude the regions corresponding to the aggregates from the BSE image of the ITZ, thus, enabling analysis of only the binder phases, which are segmented into binary images by gray level discrimination. A distinct yet dense ITZ region is present in the AAS mortars, containing a reduced content of unreacted slag particles compared to the bulk binder. The elemental analysis of this region shows that it contains a (C,N)-A-S-H gel that seems to have a higher content of Na (potentially deposited through desiccation of the pore solution) and a lower content of Ca than the bulk inner and outer products forming in the main binding region. These differences are potentially important in terms of long-term concrete performance, as the absence of a highly porous ITZ region is expected to provide a positive influence on the mechanical and transport properties of AAS concretes.
Introduction
The interfacial transition zone (ITZ) between aggregate and paste has long been a focus of study in Portland cement (PC) concrete. This zone is known to differ in chemistry and microstructure from the bulk binder phase, as the presence of aggregates introduces heterogeneity, and also because the relative movement of paste and aggregate during the mixing of concrete can induce variation in the microstructure of the ITZ (Scrivener and Pratt, 1996; Wasserman and Bentur, 1996; Tasong et al., 1999; Scrivener et al., 2004; Leemann et al., 2006; Mehta and Monteiro, 2006). This zone is known to generally measure 15–20 μm in width in PC-based materials, surrounding each aggregate particle (Breton et al., 1993; Ollivier et al., 1995). A key feature of the ITZ is that it often contains a deficit of large cement grains that cannot physically pack close to the aggregate, i.e., the “wall effect” (Scrivener et al., 2004), leading to a higher effective water/binder ratio than in the bulk paste, which induces differences in chemistry and porosity. The thickness of this zone can increase with the size of the aggregate, due to the increased water layer in the transition zone at beginning of mixing (Xie et al., 1991; Ma and Li, 2014).
The durability of any concrete structure, whether based on PC or an alkali-activated binder, depends strongly on its mass transport properties, which are controlled by the microstructural characteristics (particularly porosity, tortuosity, and pore size distribution) of the hardened binder (Mehta and Monteiro, 2006; Kovler and Roussel, 2011; Van Deventer et al., 2012). If an ITZ with higher porosity is present, this can also lead to pore percolation, allowing easier penetration of harmful species into the concrete and reducing its durability (Scrivener and Nemati, 1996; Cwirzen and Penttala, 2005; Leemann et al., 2006).
Backscattered electron (BSE) imaging in a scanning electron microscope (SEM) or environmental scanning electron microscope (ESEM), applied in parallel with compositional analysis [usually energy-dispersive X-ray (EDX) spectroscopy] is a key technique used to distinguish between porosity, reacted and unreacted particles in two dimensions (Scrivener et al., 1988, 2004). The main drawback of this technique is that it provides information regarding porosity on a length scale of a micron or even finer, but not three-dimensional data such as the connectivity, tortuosity, or permeability associated with a pore network. This information is essential in understanding durability phenomena (Van Deventer et al., 2012), but can only be accessed directly via three-dimensional analytical techniques such as focused ion beam tomography (Trtik et al., 2011), X-ray microtomography (Bentz et al., 2002; Promentilla et al., 2009; Provis et al., 2012), or nanotomography (Stampanoni et al., 2010; Provis et al., 2011), or by indirect methods such as computer simulation and reconstruction of binder microstructures and, thus, pore network parameters (Bentz and Martys, 1994; Gallucci et al., 2007; Ma et al., 2014, 2015). However, the power of electron microscopy in analyzing binder structures at high resolution means that it is the main analytical technique applied in this study. The literature available in this field highlights the need to quantify the different phases present in the binder, and to correlate them to observed microstructural features. The reproducible contrast of BSE images makes them well suited to use in achieving this aim. Scrivener et al. (1986) have shown that the amount of unreacted cement measured by BSE and image analysis corresponds well with independent measures of hydration, and this has also been demonstrated to be highly effective for determination of the extent of reaction of supplementary cementitious materials in blends containing PC (Wong et al., 2006; Scrivener et al., 2015). However, the situation is likely to be different for the study of porosity, which is usually present in discrete regions that are much smaller than the anhydrous cement (or slag) particles. Wong et al. (2006) also demonstrated the determination of the porosity threshold from the inflection point of the cumulative brightness histogram of the gray levels within a micrograph, and showed that this method provides reliable results for materials based on PC.
Alkali-activated slag (AAS) binders are currently the focus of many research studies, because concretes based on these binders may be environmentally preferable when compared to PC concrete, and can also provide attractive technical properties (Fernández-Jiménez et al., 1999; Shi et al., 2006; Bernal et al., 2011a; Van Deventer et al., 2012). Commercialization and industrial application of these products are becoming more widespread (Van Deventer et al., 2010, 2012), and the understanding of their chemical, mechanical, and durability behavior is becoming more advanced. The alkali-activation of slag leads to the formation of a C-(A)-S-H type gel (Douglas et al., 1991; Scrivener and Nemati, 1996), with a Ca/Si ratio between 0.7 and 1.4, along with the formation of secondary reaction products such as zeolites and layered double hydroxide type phases, depending on the nature of the activator and the chemical composition of the slag used (Provis and Van Deventer, 2014). In AAS concretes, it has also been observed that the ITZ between the matrix and the aggregate is highly dense and uniform (Brough and Atkinson, 2000; San Nicolas et al., 2014), which is likely to contribute to the improvement of the mechanical strength and durability of these materials. This is in contrast to observations for PC systems, where the ITZ is often the weakest part of the material and shows high porosity (Scrivener and Pratt, 1996; Scrivener et al., 2004).
The particular characteristics of the ITZ in alkali silicate-activated slag binders materials are attributed to factors such as the refinement of the porosity by condensation of the excess SiO2 supplied by the activator, and also to the partial reaction of the surfaces of siliceous aggregates with the alkali-aluminosilicate gel and pore solution, to form additional reaction products surrounding the aggregate particles (Škvára et al., 2006; Ismail et al., 2013). However, a detailed understanding of the reactions taking place in this region remains elusive for these materials. Brough and Atkinson (2000) have reported that AAS shows an ITZ as in OPC concrete, but the microstructural gradients of this zone are less distinct compared to the bulk paste than is the case for OPC systems in the case of sodium-activated slag mortar. Other authors (Shi et al., 2006; Škvára et al., 2006) did not observe any distinct ITZ in AAS, while Krivenko et al. (2014) noted that the addition of metakaolin to an AAS binder aided in achieving a dense ITZ due to chemical interactions between the binder (particularly the reactive alumina supplied by the metakaolin) and the aggregates. Thus, the lack of consensus related to this issue leads to open questions regarding the use of these binders in concretes, because this zone may contribute in an important way to diffusion processes and/or the general mechanical performance of these materials. This paper, therefore, presents analysis of the phase chemistry and porosity within these regions, as a function of aggregate size and with comparisons to PC-based materials, based primarily on the analysis of data obtained using SEM.
Materials and Methods
Sample Preparation
Mortar samples based on alkali-activated ground granulated blast furnace slag (GGBFS) were examined, using different sizes of quartz sand as aggregates. The GGBFS had an oxide composition as shown in Table 1. Its specific gravity was 2800 kg/m3, its Blaine fineness was 410 ± 10 m2/kg, and a d50 of 15 μm was determined by laser granulometry. The activating solution was prepared by dissolution of a commercial anhydrous sodium metasilicate powder (Na2SiO3, supplied by Zeobond Pty Ltd) into water, stirring, and allowing the solution to cool to room temperature before use.

Table 1. Composition of GBFS used. LOI is loss on ignition at 1000°C.
The binders were formulated with activator (Na2SiO3) contents of 8 g (“low”) and 13 g (“high”) per 100 g of slag. The effective water/binder solids (slag + activator) ratio was held constant at 0.30 across all samples, taking into account the effects of the different water absorption values of each of the sands (2.2, 1.9, and 1.8% for the <600 μm, 600 μm−3 mm and >3 mm size fractions, respectively). All sands were >99% quartz, supplied by Unimin Australia, and used as received. Each mortar was made with the addition of sand at a 2.75:1 volume ratio of sand to binder solids.
The slag was dry-mixed for 5 min in a mortar mixer to deagglomerate the particles before adding the mix water (which included the dissolved activator), and the paste was then mixed for 5 min. Finally, the sand (in saturated surface dry condition) was added to make mortars, and mixing continued for another 5 min. Samples were cured under sealed conditions in 50 mm tri-gang cube molds for compressive strength tests, and in ~10 mm diameter tubes for SEM analysis, at 40°C for 48 h and then at room temperature until being tested after 3, 7, and 28 days of curing. The samples were cast into centrifuge tubes in a vertical direction, then they were sectioned perpendicular to the vertical axis of the tubes, meaning that the polished surfaces analyzed were in a plane intersecting the casting direction at an angle of 90°. Tubes of mortar were cut into slices using a diamond saw with non-aqueous lubricant before being impregnated with epoxy resin, and then polished with progressively finer grades of grit paper and diamond pastes up to 1 μm, for microstructural analysis.
Instrumental Analysis
The samples were analyzed by ESEM, with BSE imaging and EDX spectroscopy mapping. Samples were not coated, and were studied in low vacuum (30 kPa total pressure) using an FEI Quanta instrument with an accelerating voltage of 15 keV.
Quantification of Data from BSE Images
A typical grayscale histogram computed from a BSE image of a 28-day-cured AAS mortar is shown in Figure 1.
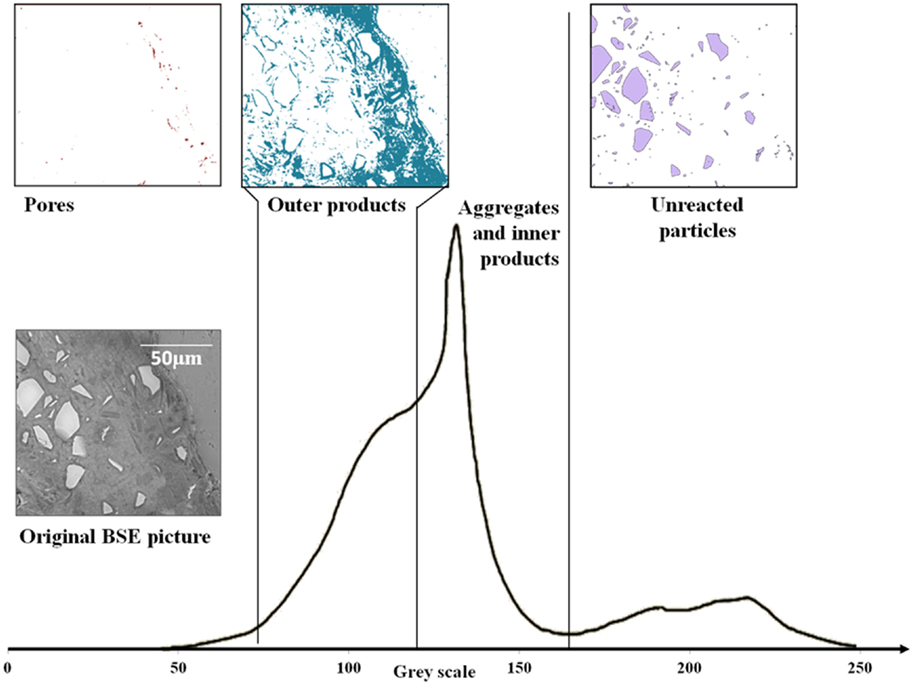
Figure 1. Typical gray level histogram of an alkali-activated slag mortar, plus binary images of different phases. From the left (darkest gray level), the first shoulder corresponds to porosity, the second shoulder is the outer products of slag reaction, the middle peak is associated with reacted material and aggregates, and the rightmost peak is associated with unreacted materials.
The first shoulder on the left of Figure 1 (dark pixels), corresponding to the porosity, could not easily be separated from the other phases, as it does not present a clear local minimum to select for use as a threshold value between pores and solid materials. However, comparative measures of porosity between different pastes, or between different areas within a paste, can be made by the comparison of grayscale histograms, even if the exact distinction between pores and reaction product is not immediately visible in an individual histogram due to the presence of structural features (including pores) on a length scale finer than the resolution of the images obtained. So, it was only possible to measure and compare pores of size between approximately 1 μm and 2 mm here, by choosing visually a threshold grayscale value that appeared consistent with the known microstructural features of the materials.
The second shoulder is associated with outer products of the reaction of slag; the C-A-S-H gel (intermixed with other phases such as hydrotalcite) forms in the space that was initially filled by interstitial solution (Song and Jennings, 1999; Brough and Atkinson, 2000; Xu et al., 2008; Ismail et al., 2013). The main peak in the middle of the histogram in Figure 1 corresponds both to reacted material (inner product C-A-S-H, formed in the spaces initially occupied by slag particles) and aggregate; the distinct gels of the inner product and outer product are distinguishable in the histogram as well as visually from the image. The differences in grayscale levels are not sufficient for the inner product and the siliceous (quartz) aggregate to be individually distinguished from each other by image analysis, as seen in the histogram in Figure 1, but the histogram of the region visually identifiable as being related to the quartz aggregate has also been plotted in Figure 1 and is seen to fall slightly on the higher grayscale side (value ~ 145–165) of the combined peak. Finally, the peak on the right corresponding to the unreacted slag is well separated from the other phases present because of its higher average atomic number due to the high content of calcium and absence of hydrates or porosity (Lloyd et al., 2009), and it is comparatively easy to distinguish this phase by thresholding the image at the local minimum which is, in the samples studied here, always present in the histogram due to sufficient unreacted slag remaining for analysis.
To be able to distinguish the aggregate from the reaction products, silicon elemental maps have been used to identify the aggregate regions, as presented in Figure 2. Figure 2C is the grayscale histogram of the silicon map (Figure 2B) associated with the BSE image (Figure 2A). This histogram shows an obvious difference between the two regions (aggregate and binder), which confirms the location of the aggregate particle, and thresholding of the image based on the Si map (Figure 2D) shows the identification of the aggregate (in white) and non-aggregate (in black) regions. Using these identified aggregate regions, the aggregate has been subtracted from the BSE picture, eliminating confusion between aggregate and reacted products in the phase quantification process (Brough and Atkinson, 2000).
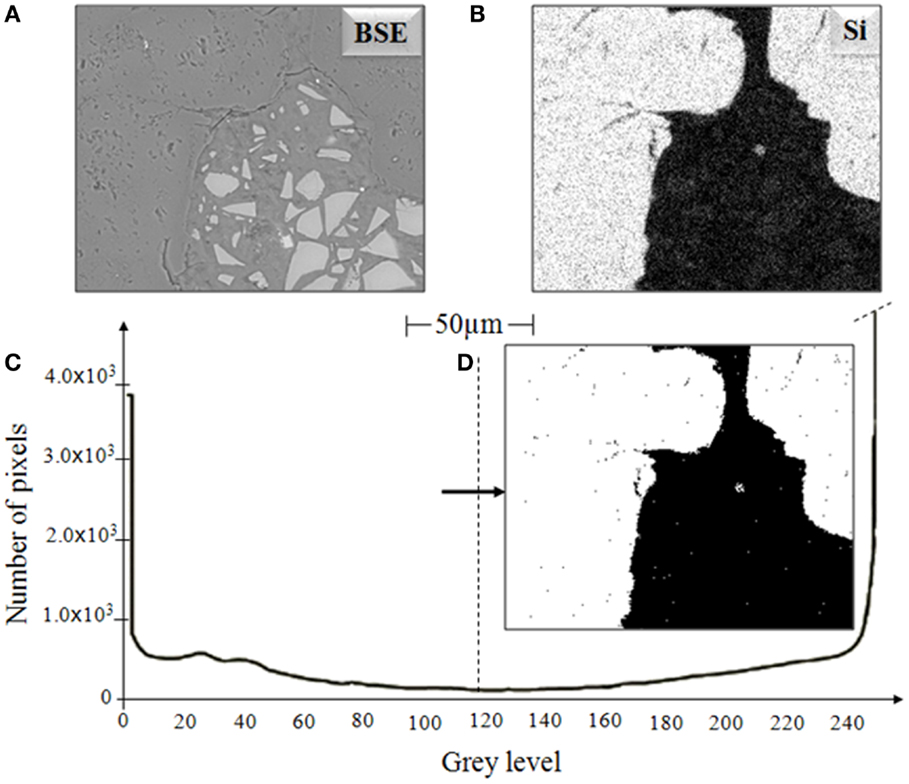
Figure 2. (A) BSE image of an AAS sample, (B) Si dot map, (C) histogram of (B) showing segmentation of aggregate, and (D) aggregate image obtained by thresholding of Si map.
As the binders studied here are heterogeneous, multiple regions (at least 40 in each sample and at a range of magnifications) have been imaged and analyzed to ensure that the results obtained are as representative as possible of the whole specimen. Volume fractions of phases are calculated as the average of 10 individual bands of 5-μm-thick scans per image, moving directly outwards from the visually identifiable surface of the aggregate particles in these images, repeated on 40 images for each specimen (i.e., data plotted represent the mean and SD of 400 data points). It is also important to note that the porosity measured here is only the macroporosity (Brough et al., 2000) – but because these are also the pores that are the most important in determining transport properties, it is likely that this is in fact a highly relevant measurement in a practical sense.
Results and Discussion
Mechanical Strength
Table 2 presents the compressive strength development of AAS mortars with three different sizes of aggregate.
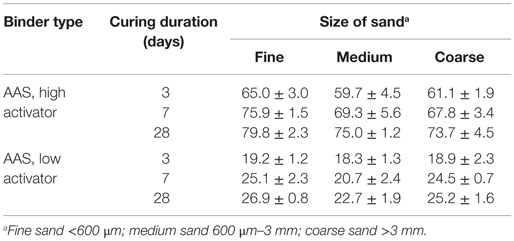
Table 2. Compressive strengths (MPa) of mortars; data are presented as the mean and SD of three replicate samples.
According to Table 2, the dosage of activator in the alkali-activated binder samples has a major influence on the compressive strengths of these mortars, with the high-activator AAS samples providing compressive strengths three times higher than the low-activator mix. Under the curing conditions examined here, and regardless of the alkali content, the AAS mortars reached between 70 and 80% of their 28-day compressive strength after 3 days. Figure 3 presents images, obtained at low magnification, of the high-alkali AAS formulation (Figure 3A) and the low-alkali AAS formulation (Figure 3B), each after 28 days of curing. The extent of reaction of the slag particles, as measured by the area fraction of unreacted slag in these and other comparable images, is approximately doubled in the high-alkali formulation in Figure 3A compared to the low-alkali formulation in Figure 3B.
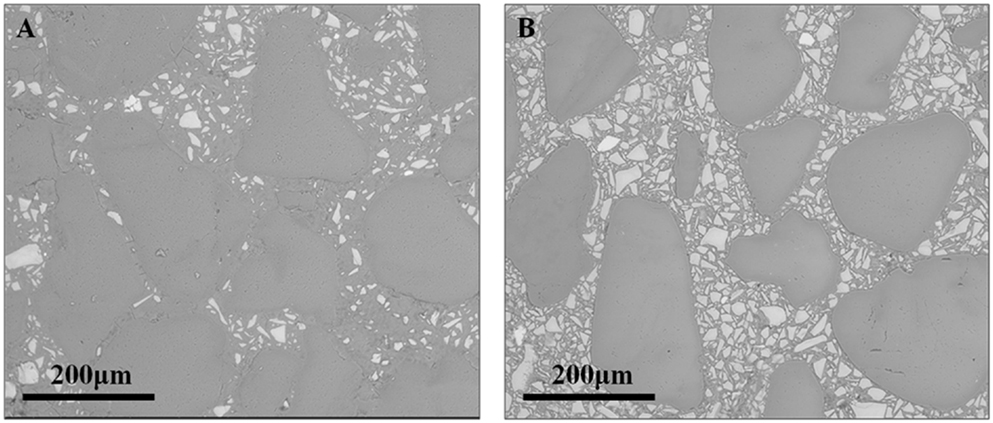
Figure 3. ESEM (BSE) images of fine sand mortars at 28 days of age: (A) high-alkali AAS formulation and (B) low-alkali AAS formulation.
The size of the aggregate has a relatively small, but consistent, influence on mechanical properties. For each binder type, the smallest size of aggregate gives higher strength by 5–15% compared to the medium and coarse aggregates, and this holds in spite of the higher total water/binder ratio that was used in the mortars with the finest sand. This phenomenon can be explained by the higher level of nucleation sites created by smaller aggregates (Ben Haha et al., 2011), or by a reduction of the characteristic thickness of the paste as in OPC (Ma and Li, 2014), and thus a thinner ITZ, due to the larger aggregate surface area. This theory is supported by the ESEM results presented below, in agreement with previous analysis of metakaolin-based alkali-activated mortars (Ravikumar and Neithalath, 2012).
SEM, BSE, and EDX Study
A comparison of the microstructural characteristics of the ITZ regions in AAS and PC mortars, as identified by ESEM (BSE) analysis and grayscale segmentation as outlined in Section “Quantification of Data from BSE Images,” is presented in Figure 4.
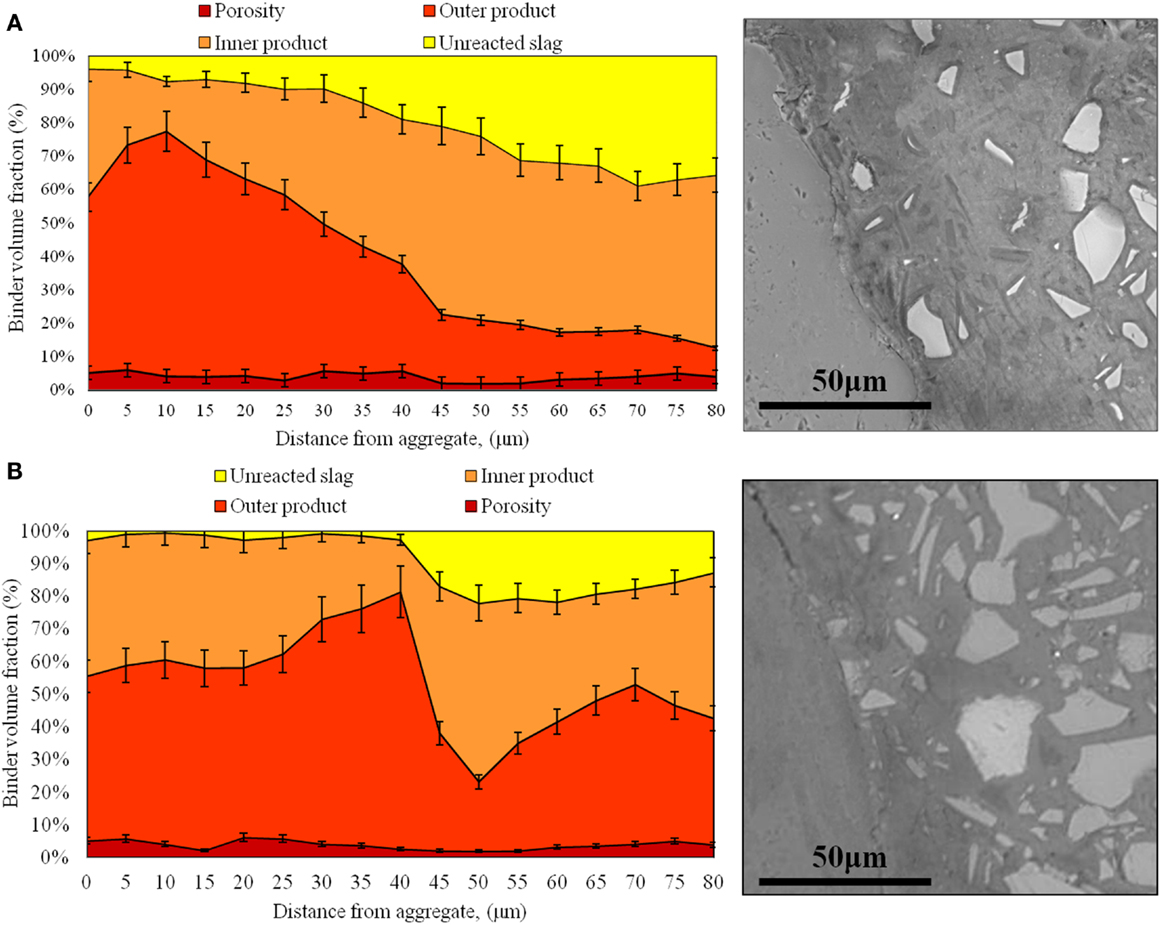
Figure 4. Characterization of the interfacial properties of the coarse sand mortars at 28 days of age: (A) high-alkali AAS formulation and (B) low-alkali AAS formulation.
In Figure 4, several phases have been quantified for each mortar. For AAS, it is possible to differentiate between pores >1 μm in size, outer products, inner products, and unreacted slag, as described in Section “Quantification of Data from BSE Images.” Similar analysis was also conducted for the samples with fine and medium aggregate sizes, and the trends in those samples are generally in good agreement with the data shown in Figure 4 and consistent with the discussion presented below.
A microstructurally distinct region identifiable as an ITZ is observed in each mortar. In the AAS mortars, the ITZ seems to be marked by a higher proportion of outer products and a reduced content of unreacted slag, due to the depletion of slag grains in this region during mixing via the wall effect observed previously in PC mortar samples (Scrivener et al., 2004). The interfacial zone is about 30–40 μm in width for each of the 6 AAS mortars, and is visible in the BSE images in Figure 4 particularly by the lower content of light gray angular (slag) particles in this region. So, moving along a line from the aggregate to the bulk paste as shown in the aggregated line scan data in Figure 4, in AAS mortar the proportion of outer products progressively decreases, while the inner products are less predominant than the outer product in the region close to the aggregate, increasing to reach nearly 70% in the bulk paste, consistent with the lower presence of slag particles remaining in this region. The width of the ITZ is larger than the usual size that is observed in PC-based mortars (~20 μm), which may be associated with a packing effect (Fernández-Jiménez et al., 1999) due to the slightly larger particle size distribution of the slag used here than most PCs.
The presence of an ITZ enriched in reaction products is caused by the higher effective local water/binder ratio in this zone. Because of this, the content of the most mobile ions supplied by the solid or solution precursors in AAS (Si and Na from the activating solution) is higher in this region, and so the chemistry and the microstructure of the ITZ will differ from that of the bulk binder. However, the degree of porosity in AAS mortar seems to be much more uniform than is the case for conventional PC-based mortars (Scrivener et al., 2004), regardless of the distance from the aggregate. Because portlandite is not formed in AAS binders due to the high availability of Si and the low Ca/Si ratio in these systems, there are no distinct large crystallites formed in the ITZ region.
Figure 4 also shows that the microstructurally distinct ITZ in AAS is larger than that in PC mortars, 30–40 μm in the samples analyzed here compared to 12–20 μm found in the literature for PC, and so it may be suggested that the aggregate particles could have a greater overall influence on mass transport through the material in the case of AAS. However, this does not appear to be the case: even though this zone is wider, it does not show a higher porosity than the bulk paste, which means that this region will not provide a preferred pathway of migration for aggressive species to pass through the AAS material. This difference may also contribute to the relatively high flexural/compressive strength ratio of AAS concretes (Brough et al., 2000; Ben Haha et al., 2011; Bernal et al., 2011b; Puertas et al., 2011); under a flexural load, the weakest part of a mortar or concrete is usually the paste (or specifically the ITZ in materials based on PC) rather than the aggregates, so if the paste is denser and more tightly bonded to the aggregate surfaces, as seen by the lower porosity in the ITZ regions, this can be correlated to a higher flexural strength.
Figure 5 presents EDX elemental maps of the locations of several elements present in the samples at 28 days of age. This mapping representation allows the observation of the chemical changes around the aggregates. In this way, an obvious ITZ is noted in each mortar. For both AAS mortars, the ITZ is marked by a reduction of the calcium content and a higher concentration of silicon and sodium in this region in the respective maps, consistent with the discussion presented above.
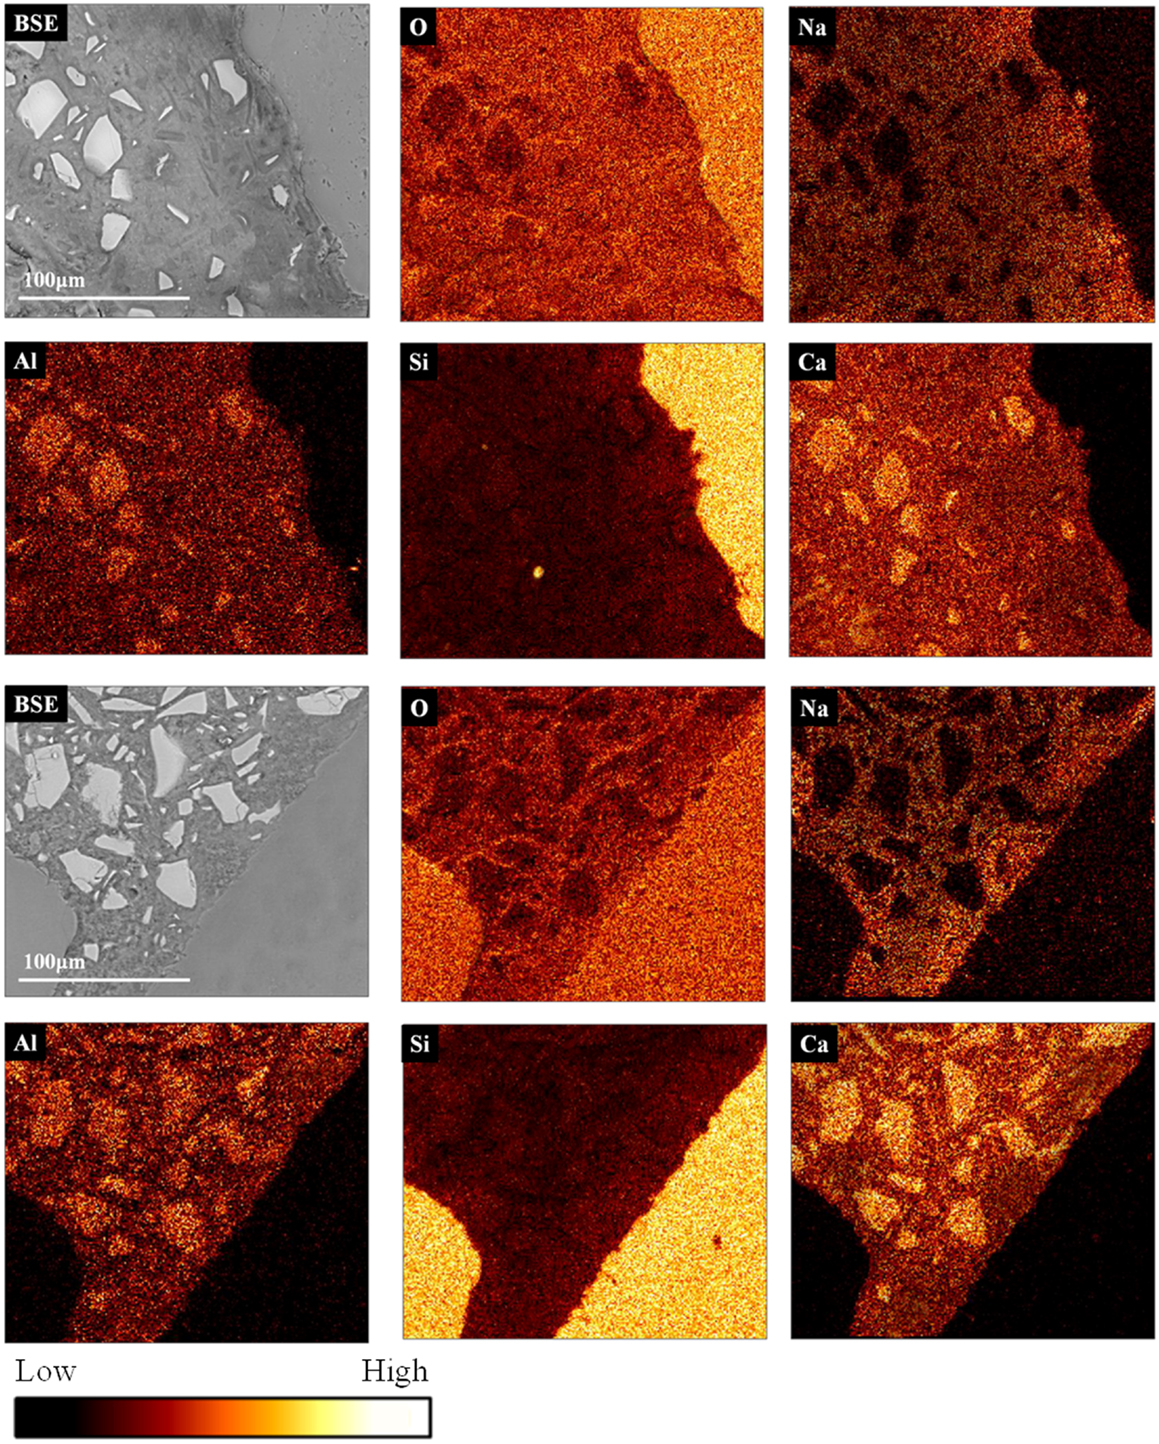
Figure 5. Backscattered electron images (BSE) and elemental maps (oxygen, sodium, aluminum, silicon, and calcium) for (top) high-alkali AAS formulation, (bottom) low-alkali AAS formulation and with medium sized sand aggregate, the color scale is comparative.
In the calcium maps for the AAS samples, the intensity is lower in the region close to the aggregate; the gel has a variable calcium content (and contains more sodium in the areas closer to the aggregate), as confirmed by the EDX spot analyses in Figure 6. This is consistent with the identification of less unreacted slag particles close to the interface, and thus more contribution to the gel composition from the activating solution, in this area.
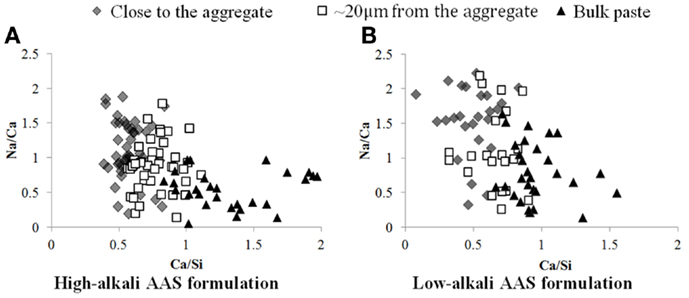
Figure 6. Plot of Na/Ca vs Ca/Si atomic ratios obtained from EDX analysis, as a function of location within the specimen, for AAS samples with high (A) and low (B) alkali contents.
In the sodium map for the AAS samples, the region of the binder close to the aggregate surface is richer in sodium, so rather than C-A-S-H the gel in this region may potentially be described as N-C-A-S-H, either as a single phase or as intimately intermixed C-A-S-H and N-A-S-H products (Myers et al., 2013, 2015). This observation is confirmed through EDX analysis of several points around the aggregate, as shown in Figure 6, which confirms quantitatively that the Na/Ca ratio is on average higher in the region close to the aggregate than in the bulk paste. The ITZ region seems, in terms of chemical composition, to join gradually to the bulk paste rather than showing a sharp edge, as seen by the fact that the points located ~20 μm from the aggregate surface are intermediate in composition between the points close to the aggregate and those in the bulk material. The same tendency is observed for the high and the low-alkali AAS formulations. Interestingly, there is not a clear difference in the Na/Ca ratios between the low-alkali and high-alkali formulations, which suggests that even the low-alkali AAS formulation contains sufficient alkalis to saturate the available sites in the C-A-S-H gel, and that the extra alkalis in the high-alkali formulation are likely to be in the pore solution and, thus, prone to elution during polishing.
In the silicon maps for AAS samples, Figure 5, the intensity decreases from the region close to the aggregate when moving into the bulk paste, and again with a gradient rather than a sharply defined edge. The reacted products forming the ITZ are richer in silicon than the rest of the bulk paste. In the silicon map for the AAS formulation with high-alkali content, Figure 5 (top), some silicon seems to have been released from the aggregate to participate in the reaction to form the N-C-A-S-H gel immediately surrounding the aggregate particle. This is consistent with the slightly ragged edge of the quartz particle visible in the BSE image of the AAS system in Figure 5 (top). The range of Al/Si ratios in this region is between 0.25 and 0.55, meaning that this is not expected to be an expansive (Al-free) gel that could be likely to cause damage to the specimens via a classical alkali-aggregate reaction pathway (Provis and Van Deventer, 2014), but rather is an N-C-A-S-H type reaction product that may contribute strength and interfacial binding. Moreover, the ESEM images and visual observations of the samples show no evidence of structural damage or cracking due to the formation of expansive gels.
The ESEM micrographs of the low-alkali AAS binder containing different sizes of aggregate do present some small differences in the ITZ regions, from 0 to 20 μm away from the aggregate surface. The quantitative results (Figure 7) present a very small difference between the reaction products in the ITZ in the mortars with different size of sand. An increase of 10% in the content of outer product gel can be identified in the samples with finer sand. This increase is also accompanied by a slightly higher volume fraction of pores with diameter larger than 1 μm.
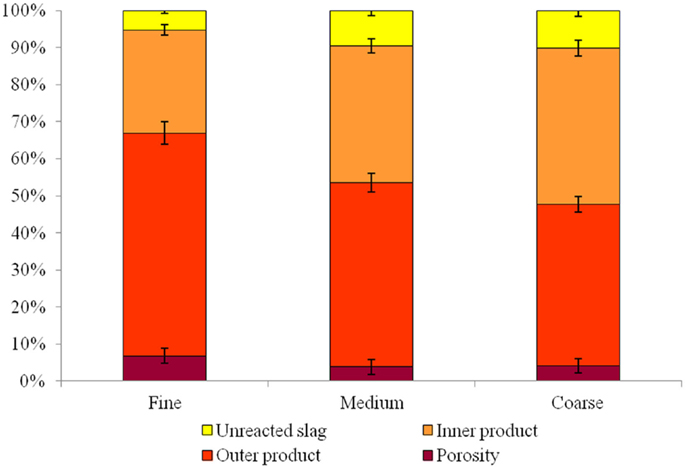
Figure 7. Relative proportion of different phases (unreacted slag, inner product, outer product, and porosity >1 μm diameter) in the low-alkalinity alkali-activated slag mortar, for each sand type.
The samples with finer sand grains also show a significant reduction in the unreacted slag content, which supports the theory of an increase in nucleation sites due to the smaller size of the aggregate. It is also possible that the higher extent of reaction of the slag has a stronger effect on the compressive strength than does the increased porosity in this system, leading to the observed increase in the compressive strength of these mortars even though the porosity is higher.
Figure 8 shows the average Ca/Si and Na/Si ratio of the low-alkali AAS assessed for the three sizes of sand, where it is again identified that the Ca/Si ratio is lower in the region close to the aggregate than in the bulk paste. The width of the ITZ increases with the size of the aggregate due to the increased heterogeneity introduced by the larger sand aggregates as well as a decrement of the thickness of the paste. This introduces an increment in the activator/slag ratio in the ITZ which then decreases the calcium content in this region, as there is no calcium supplied by the activator. This will lead to the formation of gels richer in silicon and with reduced Ca content in the hardened material.
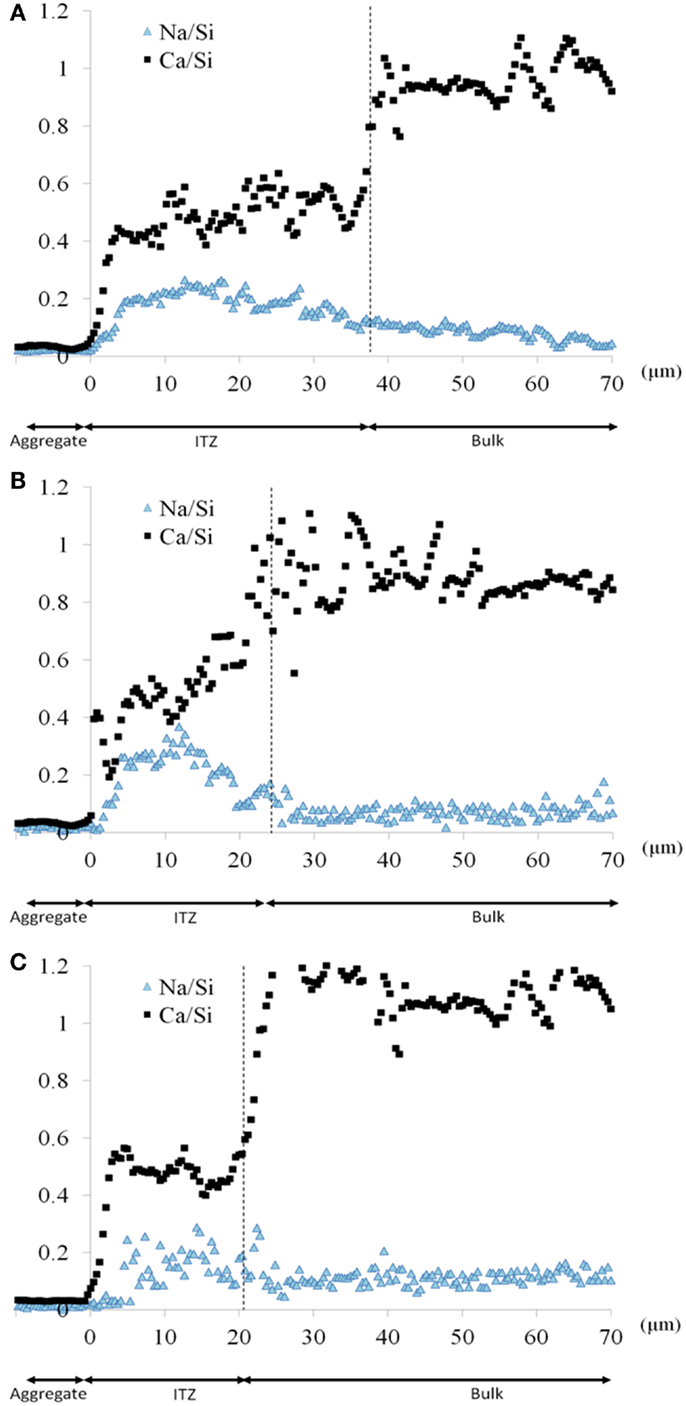
Figure 8. Atomic ratios Na/Si and Ca/Si, as a function of the distance from the interface between paste and aggregate, in the low-alkalinity alkali-activated slag mortar, for each sand type: (A) coarse sand, (B) medium sand, and (C) fine sand.
Mechanistic Implications
Figure 9 presents a schematic diagram illustrating the physicochemical phenomena occurring during sodium metasilicate activation of slag. Initially, the region around the aggregate particle (which will later become the ITZ) contains all components of the reacting slurry: the slag particles, the activator solution and the aggregate. Ions are released from the slag as it dissolves, taking up water via the hydrolysis of Si and Al species and hydration of Ca2+ cations, and these diffuse away from the source particle according to the concentration gradient which develops (Figure 9A). Then, when gelation occurs via condensation reactions as the solution reaches supersaturation, the water of hydrolysis is partially released and becomes available for further slag dissolution. The locally higher water/binder ratio helps the mobility of ions in this region, nucleation of the gel (with high Si and Na content due to the high activator content in this region and the initially small quantities of Ca present in this region) from the liquid phase takes place onto the surfaces of the aggregates, and after a few hours the matrix reaches the state shown in Figure 9B, with an immature gel nucleating outwards from the aggregate particles. This explains why the Ca/Si ratio in AAS is lower around the aggregate than in the bulk paste, as shown in the EDX maps in Figure 5, and also why with smaller aggregates, a larger amount of outer products is observed.
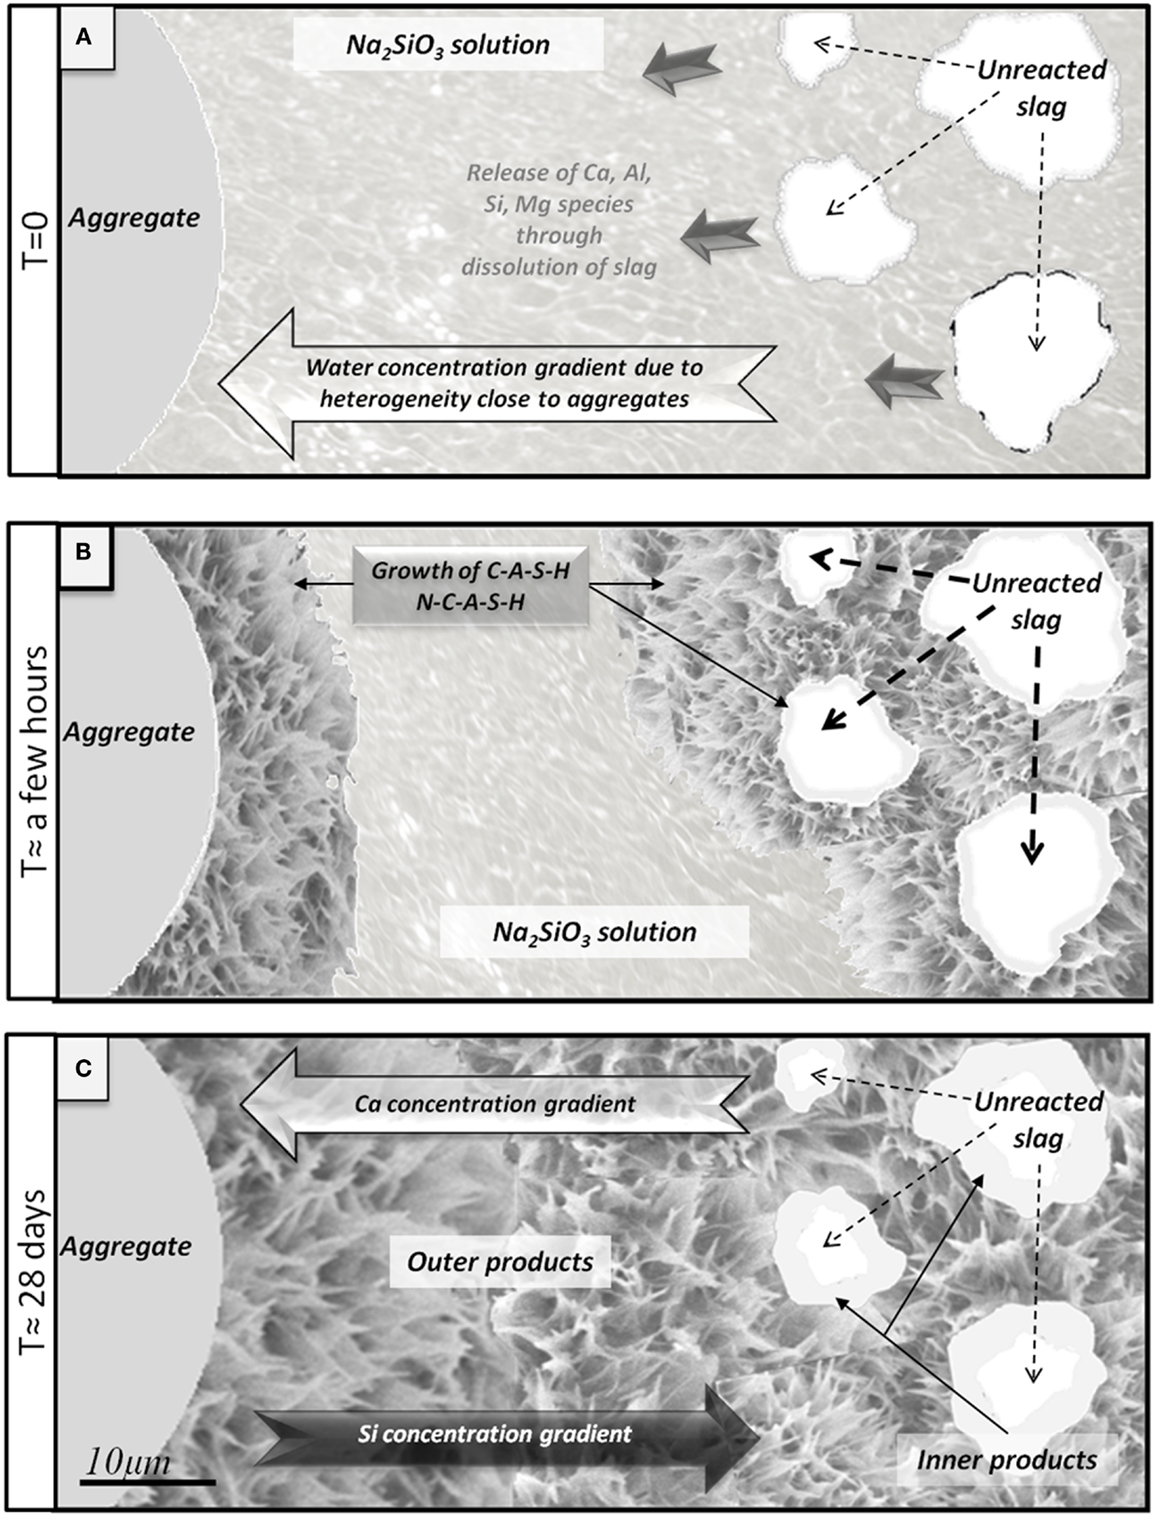
Figure 9. Schematic diagram of interfacial transition zone formation in an alkali-activated slag binder. (A) Initial early release of ions via slag dissolution. (B) Growth of C-A-S-H and N-C-A-S-H on slag and aggregate. (C) Situation of the paste after 28 days: residual unreacted slag, inner products around slag richer in calcium, and outer products around the aggregate richer in silica.
Products with a higher calcium concentration then progressively form closer to the surfaces of the slag particles, finally leading to a highly dense C-A-S-H gel around the slag, which is the inner product (Figure 9C). Then, after 28 days, the hardened matrix is relatively mature and compact, with inner product, outer product and unreacted slag forming a dense matrix (Brough and Atkinson, 2000).
Conclusion
A distinct ITZ is visible in AAS mortars formulated with different sizes of sand. Aggregate particles induce more disturbances in the packing of slag, which gives a zone adjacent to the interface that has a deficit of the reactive solid precursor. Due to this deficiency, different phenomena take place during the processes of precursor dissolution and gel nucleation, and the interfacial zone becomes structurally and chemically different from the bulk paste. In AAS, this zone is larger with coarse sand than with finer sand, and is between 20 and 50 μm in thickness. The interfacial zone seems dense and has a low observable (coarse) porosity. The ITZ contains outer product N-C-A-S-H or C-A-S-H phases with a lower Ca/Si ratio than the rest of the bulk paste, and is depleted in unreacted slag grains. The size of the aggregates has an influence on the nucleation properties of the gel, but no notable alkali–silica reaction degradation is observed. The thickness of the ITZ seems to increase with the size of aggregate tested. A finer aggregate offers more nucleation sites and so more reaction products have been observed in these mortars, consistent with the higher compressive strength observed in these materials, despite their higher porosity.
Author Contributions
RN designed experiments, collected and analyzed data, interpreted results, and drafted the manuscript. JP contributed to experimental design, data interpretation, and the writing of the manuscript.
Conflict of Interest Statement
The authors declare that the research was conducted in the absence of any commercial or financial relationships that could be construed as a potential conflict of interest.
Acknowledgments
We thank Roger Curtain of the Electron Microscopy Unit, Bio21 Institute, University of Melbourne, for assistance with the SEM work, and Zeobond Pty Ltd for the supply of materials.
Funding
The authors acknowledge partial funding for this work provided by the Australian Government through its CRC Program for this CO2CRC research project, and the salary support of JP provided through the Discovery Grants program via APD and DORA Fellowships.
References
Ben Haha, M., Le Saout, G., Winnefeld, F., and Lothenbach, B. (2011). Influence of activator type on hydration kinetics, hydrate assemblage and microstructural development of alkali activated blast-furnace slags. Cement Concr. Res. 41, 301–310. doi: 10.1016/j.cemconres.2010.11.016
Bentz, D., and Martys, N. (1994). Hydraulic radius and transport in reconstructed model three-dimensional porous media. Transp. Porous Media 17, 221–238. doi:10.1007/bf00613583
Bentz, D. P., Mizell, S., Satterfield, S., Devaney, J., George, W., Ketcham, P., et al. (2002). The visible cement data set. J. Res. NIST 107, 137–148. doi:10.6028/jres.107.013
Bernal, S. A., Mejía de Gutiérrez, R., Pedraza, A. L., Provis, J. L., Rodriguez, E. D., and Delvasto, S. (2011a). Effect of binder content on the performance of alkali-activated slag concretes. Cement Concr. Res. 41, 1–8. doi:10.1016/j.cemconres.2010.08.017
Bernal, S. A., Provis, J. L., Rose, V., and Mejía de Gutierrez, R. (2011b). Evolution of binder structure in sodium silicate-activated slag-metakaolin blends. Cement Concr. Compos. 33, 46–54. doi:10.1016/j.cemconcomp.2010.09.004
Breton, D., Carles-Gibergues, A., Ballivy, G., and Grandet, J. (1993). Contribution to the formation mechanism of the transition zone between rock-cement paste. Cement Concr. Res. 23, 335–346. doi:10.1016/0008-8846(93)90099-u
Brough, A. R., and Atkinson, A. (2000). Automated identification of the aggregate–paste interfacial transition zone in mortars of silica sand with Portland or alkali-activated slag cement paste. Cement Concr. Res. 30, 849–854. doi:10.1016/s0008-8846(00)00254-4
Brough, A. R., Holloway, M., Sykes, J., and Atkinson, A. (2000). Sodium silicate-based alkali-activated slag mortars: part II. The retarding effect of additions of sodium chloride or malic acid. Cement Concr. Res. 30, 1375–1379. doi:10.1016/s0008-8846(00)00356-2
Cwirzen, A., and Penttala, V. (2005). Aggregate–cement paste transition zone properties affecting the salt–frost damage of high-performance concretes. Cement Concr. Res. 35, 671–679. doi:10.1016/j.cemconres.2004.06.009
Douglas, E., Bilodeau, A., Brandstetr, J., and Malhotra, V. M. (1991). Alkali activated ground granulated blast-furnace slag concrete: preliminary investigation. Cement Concr. Res. 21, 101–108. doi:10.1016/0008-8846(91)90036-H
Fernández-Jiménez, A., Palomo, J. G., and Puertas, F. (1999). Alkali-activated slag mortars: mechanical strength behaviour. Cement Concr. Res. 29, 1313–1321. doi:10.1016/s0008-8846(99)00154-4
Gallucci, E., Scrivener, K., Groso, A., Stampanoni, M., and Margaritondo, G. (2007). 3D experimental investigation of the microstructure of cement pastes using synchrotron X-ray microtomography (μCT). Cement Concr. Res. 37, 360–368. doi:10.1016/j.cemconres.2006.10.012
Ismail, I., Bernal, S. A., San Nicolas, R., Hamdan, S., van Deventer, J. S. J., Brice, D. G., et al. (2013). Influence of fly ash on the water and chloride permeability of alkali-activated slag mortars and concretes. Construct. Build. Mater. 48, 1187–1201. doi:10.1016/j.conbuildmat.2013.07.106
Kovler, K., and Roussel, N. (2011). Properties of fresh and hardened concrete. Cement Concr. Res. 41, 775–792. doi:10.1016/j.cemconres.2011.03.009
Krivenko, P., Drochytka, R., Gelevera, A., and Kavalerova, E. (2014). Mechanism of preventing the alkali–aggregate reaction in alkali activated cement concretes. Cement Concr. Compos. 45, 157–165. doi:10.1016/j.cemconcomp.2013.10.003
Leemann, A., Münch, B., Gasser, P., and Holzer, L. (2006). Influence of compaction on the interfacial transition zone and the permeability of concrete. Cement Concr. Res. 36, 1425–1433. doi:10.1016/j.cemconres.2006.02.010
Lloyd, R. R., Provis, J. L., and Van Deventer, J. S. J. (2009). Microscopy and microanalysis of inorganic polymer cements. 2: the gel binder. J. Mater. Sci. 44, 620–631. doi:10.1007/s10853-008-3078-z
Ma, H., Hou, D., and Li, Z. (2015). Two-scale modeling of transport properties of cement paste: formation factor, electrical conductivity and chloride diffusivity. Comput. Mater. Sci. 110, 270–280. doi:10.1016/j.commatsci.2015.08.048
Ma, H., Hou, D., Lu, Y., and Li, Z. (2014). Two-scale modeling of the capillary network in hydrated cement paste. Construct. Build. Mater. 64, 11–21. doi:10.1016/j.conbuildmat.2014.04.005
Ma, H., and Li, Z. (2014). Multi-aggregate approach for modeling interfacial transition zone in concrete. ACI Mater. J. 111, 189–199. doi:10.14359/51686501
Mehta, P. K., and Monteiro, P. J. M. (2006). Concrete: Microstructure, Properties and Materials. New York, NY: McGraw-Hill.
Myers, R. J., Bernal, S. A., San Nicolas, R., and Provis, J. L. (2013). Generalized structural description of calcium-sodium aluminosilicate hydrate gels: the crosslinked substituted tobermorite model. Langmuir 29, 5294–5306. doi:10.1021/la4000473
Myers, R. J., Lothenbach, B., Bernal, S. A., and Provis, J. L. (2015). Thermodynamic modelling of alkali-activated slag cements. Appl. Geochem. 61, 233–247. doi:10.1016/j.apgeochem.2015.06.006
Ollivier, J. P., Maso, J. C., and Bourdette, B. (1995). Interfacial transition zone in concrete. Adv. Cement Base. Mater. 2, 30–38. doi:10.1016/1065-7355(95)90037-3
Promentilla, M. A. B., Sugiyama, T., Hitomi, T., and Takeda, N. (2009). Quantification of tortuosity in hardened cement pastes using synchrotron-based X-ray computed microtomography. Cement Concr. Res. 39, 548–557. doi:10.1016/j.cemconres.2009.03.005
Provis, J. L., Myers, R. J., White, C. E., Rose, V., and Van Deventer, J. S. J. (2012). X-ray microtomography shows pore structure and tortuosity in alkali-activated binders. Cement Concr. Res. 42, 855–864. doi:10.1016/j.cemconres.2012.03.004
Provis, J. L., Rose, V., Winarski, R. P., and van Deventer, J. S. J. (2011). Hard X-ray nanotomography of amorphous aluminosilicate cements. Scr. Mater. 65, 316–319. doi:10.1016/j.scriptamat.2011.04.036
Provis, J. L., and Van Deventer, J. S. J. (2014). Alkali Activated Materials, State-of-the-Art Report, RILEM TC 224-AAM. Dordrecht: Springer/RILEM.
Puertas, F., Palacios, M., Manzano, H., Dolado, J. S., Rico, A., and Rodríguez, J. (2011). A model for the C-A-S-H gel formed in alkali-activated slag cements. J. Eur. Ceram. Soc. 31, 2043–2056. doi:10.1016/j.jeurceramsoc.2011.04.036
Ravikumar, D., and Neithalath, N. (2012). Effects of activator characteristics on the reaction product formation in slag binders activated using alkali silicate powder and NaOH. Cement Concr. Compos. 34, 809–818. doi:10.1016/j.cemconcomp.2012.03.006
San Nicolas, R., Bernal, S. A., Mejía de Gutiérrez, R., Van Deventer, J. S. J., and Provis, J. L. (2014). Distinctive microstructural features of aged sodium silicate-activated slag concretes. Cement Concr. Res. 65, 41–51. doi:10.1016/j.cemconres.2014.07.008
Scrivener, K., Bentur, A., and Pratt, P. L. (1988). Quantitative characterization of the transition zone in high strength concretes. Adv. Cement Res. 1, 230–237. doi:10.1680/adcr.1988.1.4.230
Scrivener, K., Crumbie, A., and Laugesen, P. (2004). The interfacial transition zone (ITZ) between cement paste and aggregate in concrete. Interface Sci. 12, 411–421. doi:10.1023/B:INTS.0000042339.92990.4c
Scrivener, K., Lothenbach, B., De Belie, N., Gruyaert, E., Skibsted, J., Snellings, R., et al. (2015). TC 238-SCM: hydration and microstructure of concrete with SCMs. Mater. Struct. 48, 835–862. doi:10.1617/s11527-015-0527-4
Scrivener, K. L., and Nemati, K. M. (1996). The percolation of pore space in the cement paste/aggregate interfacial zone of concrete. Cement Concr. Res. 26, 35–40. doi:10.1016/0008-8846(95)00185-9
Scrivener, K. L., Patel, H. H., Pratt, P. L., and Parrott, L. J. (1986). Analysis of phases in cement paste using backscattered electron images, methanol adsorption and thermogravimetric analysis. Mater. Res. Soc. Symp. Proc. 85, 67–76. doi:10.1557/PROC-85-67
Scrivener, K. L., and Pratt, P. L. (1996). “Characterization of interfacial microstructure,” in Interfacial Transition Zone in Concrete, ed. J. C. Maso (London: E & FN Spon), 3–17.
Shi, C., Krivenko, P. V., and Roy, D. M. (2006). Alkali-Activated Cements and Concretes. Abingdon: Taylor & Francis.
Škvára, F., Doležal, J., Svoboda, P., Kopecký, L., Pawlasová, S., Lucuk, M., et al. (2006). “Concrete based on fly ash geopolymers,” in Proceedings of 16th IBAUSIL, Weimar.
Song, S., and Jennings, H. M. (1999). Pore solution chemistry of alkali-activated ground granulated blast-furnace slag. Cement Concr. Res. 29, 159–170. doi:10.1016/s0008-8846(98)00212-9
Stampanoni, M., Mokso, R., Marone, F., Vila-Comamala, J., Gorelick, S., Trtik, P., et al. (2010). Phase-contrast tomography at the nanoscale using hard x rays. Phys. Rev. B 81, 140105. doi:10.1103/PhysRevB.81.140105
Tasong, W. A., Lynsdale, C. J., and Cripps, J. C. (1999). Aggregate-cement paste interface: part I. Influence of aggregate geochemistry. Cement Concr. Res. 29, 1019–1025. doi:10.1016/s0008-8846(99)00086-1
Trtik, P., Münch, B., Gasser, P., Leemann, A., Loser, R., Wepf, R., et al. (2011). Focussed ion beam nanotomography reveals the 3D morphology of different solid phases in hardened cement pastes. J. Microsc. 241, 234–242. doi:10.1111/j.1365-2818.2010.03433.x
Van Deventer, J. S. J., Provis, J. L., and Duxson, P. (2012). Technical and commercial progress in the adoption of geopolymer cement. Miner. Eng. 29, 89–104. doi:10.1016/j.mineng.2011.09.009
Van Deventer, J. S. J., Provis, J. L., Duxson, P., and Brice, D. G. (2010). Chemical research and climate change as drivers in the commercial adoption of alkali activated materials. Waste Biomass Valor. 1, 145–155. doi:10.1007/s12649-010-9015-9
Wasserman, R., and Bentur, A. (1996). Interfacial interactions in lightweight aggregate concretes and their influence on the concrete strength. Cement Concr. Res. 18, 67–76. doi:10.1016/0958-9465(96)00002-9
Wong, H. S., Head, M. K., and Buenfeld, N. R. (2006). Pore segmentation of cement-based materials from backscattered electron images. Cement Concr. Res. 36, 1083–1090. doi:10.1016/j.cemconres.2005.10.006
Xie, P., Beaudoin, J. J., and Brousseau, R. (1991). Effect of aggregate size on transition zone properties at the portland cement paste interface. Cement Concr. Res. 21, 999–1005. doi:10.1016/0008-8846(91)90059-Q
Keywords: alkali-activated slag, microstructure, backscattered electron imaging, X-ray mapping, interfacial transition zone
Citation: San Nicolas R and Provis JL (2015) The Interfacial Transition Zone in Alkali-Activated Slag Mortars. Front. Mater. 2:70. doi: 10.3389/fmats.2015.00070
Received: 11 October 2015; Accepted: 23 November 2015;
Published: 21 December 2015
Edited by:
Yu-Fei Wu, City University of Hong Kong, Hong KongReviewed by:
Ching Tai Ng, The University of Adelaide, AustraliaHongyan Ma, Missouri University of Science and Technology, USA
Copyright: © 2015 San Nicolas and Provis. This is an open-access article distributed under the terms of the Creative Commons Attribution License (CC BY). The use, distribution or reproduction in other forums is permitted, provided the original author(s) or licensor are credited and that the original publication in this journal is cited, in accordance with accepted academic practice. No use, distribution or reproduction is permitted which does not comply with these terms.
*Correspondence: Rackel San Nicolas, rackel.san@unimelb.edu.au;
John L. Provis, j.provis@sheffield.ac.uk