3D RVE Models Able to Capture and Quantify the Dispersion, Agglomeration, and Orientation State of CNT in CNT/PP Nanocomposites
 Md A. Bhuiyan
 Raghuram V. Pucha
 Kyriaki Kalaitzidou
- 1G.W. Woodruff School of Mechanical Engineering, Georgia Institute of Technology, Atlanta, GA, USA
- 2School of Materials Science and Engineering, Georgia Institute of Technology, Atlanta, GA, USA
The focus of this study is to investigate the capabilities of three dimensional (3D) RVE models in predicting the tensile modulus of carbon nanotube/polypropylene (CNT/PP) composites, which differ slightly in the dispersion, agglomeration, and orientation states of CNT within the PP matrix. The composites are made using melt mixing followed by either injection molding or melt spinning of fibers. The dispersion, agglomeration, and orientation of CNT within the PP are experimentally altered by using a surfactant and by forcing the molten material to flow through a narrow orifice (melt spinning) that promotes alignment of CNT along the flow/drawing direction. An elaborate image analysis technique is used to quantify the CNT characteristics in terms of probability distribution functions (PDF). The PDF are then introduced to the 3D RVE models that also account for the CNT–PP interfacial interactions. It is concluded that the 3D RVE models can accurately distinguish among the different cases (dispersion, distribution, geometry, and alignment of CNT) as the predicted tensile modulus is in good agreement with the experimentally determined one.
Introduction
Polymer nanocomposites (PCNs) reinforced with carbon nanotube (CNT) can exhibit improved mechanical properties, high electrical and thermal conductivity, resistance against corrosion, noise damping, thermal stability over metallic materials, and many more (Godovsky, 2000; Mylvaganam and Zhang, 2007). Preliminary studies demonstrate that the addition of up to 3 wt%, of CNT can improve the properties substantially, compared to the properties of the host polymer (Andrews et al., 1999; Qian et al., 2000; Kumar et al., 2002; Liang et al., 2009). CNT has the potential to provide lightweight and multifunctional composites with superior mechanical properties (Chen and Liu, 2004) for various applications, including aerospace structures, sporting goods, automotive components, consumers electronics, optical barriers, electromagnetic interference shielding, transmission line cables, and nanosensors (Calvert, 1999; Ajayan and Tour, 2007; Mylvaganam and Zhang, 2007; Endo et al., 2008).
Despite their great potential, the property enhancement that is currently realized in CNT/polymer composites is much lower than expected mainly due to non-uniform dispersion and non-homogeneous distribution of CNT, random orientation and waviness of CNT within the polymer, inefficient load transfer from matrix to CNT, etc. (Du et al., 2007; Jancar et al., 2010; Song et al., 2013; Liu and Kumar, 2014; Peponib et al., 2014). Non-uniform dispersion of CNT results in CNT agglomerates that act as stress concentration sites. On the other hand, non-homogeneous distribution of CNT leads to uneven stress transfer between the polymer and CNT in presence of an applied mechanical load. The random orientation and waviness of CNT, with respect to the applied load direction and the presence of agglomerates result in drastic reduction of the effective CNT length and thus of the CNT reinforcing efficiency (Fisher et al., 2002; Shi et al., 2004; Anumandla and Gibson, 2006). The CNT–polymer interfacial interactions are also important as they dictate the performance of the PNCs, including modulus, strength, and stiffness (Andrews et al., 2002; Luo et al., 2007). Therefore, more research is needed in order to realize the full potential of CNT/polymer composites in engineering applications. In addition, there is lack of systematic approaches that can eliminate the time intensive and cost inefficient “trial-and-error” approaches often used and facilitate manufacture of CNT/polymer composites with engineered properties. Such an approach should be based on up-front computational design tools (Pucha and Worthy, 2014) with minimum experimental iterations.
Continuum mechanics based finite element analysis (FEA) methods have been successfully used to investigate the mechanical behavior of PNCs reinforced with CNT (Liu and Chen, 2003; Chen and Liu, 2004; Gade, 2005; Hu et al., 2005; Wan et al., 2005; Ashrafi and Hubert, 2006; Pantano et al., 2008; Hernández-Pérez and Avilés, 2010). FEA has also been used to study the interfacial stress transfer and possible stress singularities (Xu and Sengupta, 2005), as well as the effect of interphase thickness on the elastic properties of PNC (Wan et al., 2005; Hernández-Pérez and Avilés, 2010). The effect of CNT waviness, orientation and random distribution in polymers, and the failure of PNC have also investigated using FEA (Fisher et al., 2002, 2003; Shi et al., 2004; Anumandla and Gibson, 2006). In these studies, random distribution of CNT characteristics within the polymer is considered, which is due to the difficulty in experimentally quantifying their distribution within the polymer. Efforts to experimentally determine the distribution of CNT characteristics have been made (Yokozeki et al., 2010; Young et al., 2010; Blighe et al., 2011); however, only qualitative information was provided. Image analysis techniques of electron microscopy have been used to quantitatively characterize CNT dispersion, distribution, and orientation state in polymer (Gommes et al., 2003; Thostenson and Chou, 2003; Sarkar and Banerjee, 2004; Fan and Advani, 2005; Wang et al., 2006). However, such techniques are either not automated to analyze large number of CNT or cannot account for all the CNT characteristics together and therefore are not capable of giving an estimate of the synergistic effect of all the factors on the overall properties of the composites.
Each of the models discussed above provides important and unique contributions to the modeling of nanoscale carbon reinforced polymers. However, a comprehensive three dimensional (3D) RVE model to capture the synergistic effect of all the CNT characteristics on the composites elastic modulus and that is sensitive enough to differentiate between composites with small changes in the microstructure is absent. This study fills this gap, i.e., it investigates the ability of a multi-CNT 3D RVE model, developed combining image analysis approach and finite element method (FEM), as presented in our previous studies (Bhuiyan et al., 2012, 2013), to capture small changes in the CNT characteristics, such as dispersion, distribution, orientation, and waviness of CNT, within the polymer matrix and provides a systematic approach to understand the synergistic effect of these CNT characteristics, which can be altered by processing conditions, on the elastic properties of PCNs. Such an approach has the potential to lead to composites with engineered properties.
Experimental
Materials Used and Fabrication of Composites
The polypropylene (PP) (trade name: pro-fax 6301 with melt flow index of 12 g/10 min) purchased from LyondellBasell, Lansing, MI, USA and Multi-walled CNT were purchased from Cheap Tubes, VT, USA. The specifications of the CNT as provided by the supplier are outer diameter (OD): 20–30 nm, inner diameter (ID): 5–10 nm, length: 10–30 μm, purity: >95 wt%, ash: <1.5 wt%, specific surface area: 110 m2/g, density: ~2.1 g/cm3, and electrical conductivity: >100 S/cm.
Carbon nanotube/PP bulk composites with CNT content from 0 to 5 wt% were made by using the coating method described in Kalaitzidou et al. (2007), according to which the PP powder is coated with CNT, followed by melt compounding and injection molding. A DSM Micro 15 cc Compounder (vertical, corotating twin-screw micro extruder) and a 10-cc injection molding machine were used. The conditions used are mixing time of 3 min, Tbarrel = 180°C and screw speed of 245 rpm. The mold temperature and the injection pressure were set to Tmold = 80°C and ~758 kPa, respectively. CNT/PP fibers were made using a fiber spinning set up consisted of a single holed spinneret of 0.8 mm diameter, two 10.5 cm diameter rolls (take-up and collection rolls) with independent speed controls and a heating zone set to 80°C between them through which fiber is passed as it is drawn. Fiber take-up and collection is done at 200 and 800 mm/min, respectively, resulting in a fiber draw ratio of 4. Sodium dodecylbenzene sulfonate (SDBS) (chemical formula C12H25C6H4SO3Na) was used as surfactant to improve the dispersion of CNT within the polymer. SDBS and CNT at 1:1 weight ratio were dispersed in 100 ml of H2O through sonication (Q700 Sonicator, QSONICA) for 2 h at ambient temperature. The suspension was then dried in a vacuum oven at 60°C and the dried mixture of CNT and surfactant was mixed with PP powder manually and fed into the extruder for melt mixing and injection molding.
Characterization of Composites
The tensile properties of bulk composites were determined using Instron 33R-4466 apparatus with a 500 N load cell according to ASTM D638. The tensile properties of the fibers were determined according to ASTM D3822 using an Instron with a 2.5 N load cell. A single fiber was fixed on the specific fiber test tab with 25.4 mm gage and tested at a rate of 25.4 mm/min.
The distribution of CNT diameter (used as a measure of CNT agglomeration), the CNT orientation, waviness, and spatial distribution within the PP matrix were evaluated by studying the polished and etched surfaces, details can be found in Bhuiyan et al. (2013), of CNT/PP composites using SEM (Zeiss Ultra 60-SEM, accelerating voltage of 5 kV). About 15 SEM images, taken from various locations of the composites surface, were used so that a statistically meaningful distribution of the CNT characteristics could be obtained. A typical SEM image of 4 wt% CNT/PP composites is presented in Figure 1A. The CNT/polymer interphase was characterized using AFM in terms of its’ thickness and stiffness, as we reported in our prior studies (Bhuiyan et al., 2012, 2013).
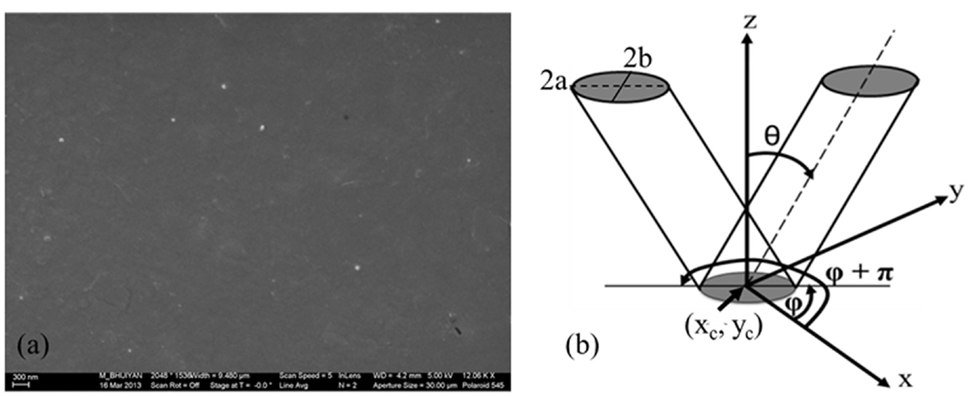
Figure 1. (A) Representative SEM image of 4 wt% CNT/PP composites; (B) definition of in-plane (φ) and out-of-plane (θ) angles used to describe CNT orientation.
Determination of the Probability Distribution Functions of CNT Characteristics
The probability distribution functions (PDF) of the CNT orientation were determined based on the CNT geometry and footprint just below the polished surface shown in the SEM images. The CNT projection on the plane (polished surface) can be an ellipse or a circular disk depending on the CNT inclination below the surface (Kawamura et al., 2005). The two angles θ and φ, which define the 3D orientation of each CNT (Hine and Duckett, 2004), can be obtained by measuring the elliptical parameters that are the center of the ellipse (xc,yc), the major (2a) and minor (2b) axes, and the in-plane angle (φ), all shown in Figure 1B. Specifically, the out-of-plane angle θ is defined as the angle formed between the CNT and the injection/applied load direction (z axis), while the angle φ is defined as the angle that the ellipses major axis makes with the x-axis in the x–y plane (Hine and Duckett, 2004; Velez-Garcia et al., 2012). An image analysis algorithm using a series of SEM images was used to determine 2a, 2b, θ, φ, and the center of ellipses.
However, using just the elliptical marks creates ambiguity in the determination of the in-plane angle φ. As indicated in the schematic of Figure 1B there can be two possible orientation configurations, (θ, φ) and (θ, φ + π), for the same elliptical cross section in the x–y plane that cannot be distinguishable. This ambiguity is resolved by using the dark regions, “etch marks,” around the CNT cross sections shown in the SEM images. These etch marks are amplified by chemical etching of the polished surface, which removes a thin polymer layer exposing some portion of the CNT underneath the surface being studied. The way the etch marks are related to the CNT orientation and the correction methodology for the in-plane angle are also shown in Figure 1B. If the etch mark is located at the opposite side with respect to the measured in-plane angle then no correction is required. A correction of φ = φ + π is applied when the etch mark is in the same side with the measured in-plane angle (Kawamura et al., 2005; Velez-Garcia et al., 2012).
The CNT diameter is determined based on the major (2a) and minor (2b) axes, see Figure 1B, of the CNT cross sections shown in the SEM images. Using the following three criteria the diameter of CNT is calculated: (i) if for a CNT cross section the major axis equals the minor then the CNT diameter = 2a = 2b; (ii) if the major axis is larger than 2*2b, then the CNT diameter = 2b; (iii) CNT diameter = (2a + 2b)/2 for all other cases (Bhuiyan et al., 2013).
The CNT spatial distribution was determined using a method developed for studying the spatial distribution of fibers in polymer composites (Fischer and Eyerer, 1988). The two parameters R and α, shown in Figure 2A, are chosen in a convenient relation to the coordinates of the CNT centroids and are used to describe the spatial position of the CNT. Specifically, R is the distance between the CNT cross-section centroid (xc, yc) and the origin, defined as, and α is the angle between the x axis and R defined as . In this schematic, circular and elliptical cross sections represent CNT that are perpendicular and at an angle to the plane, respectively.
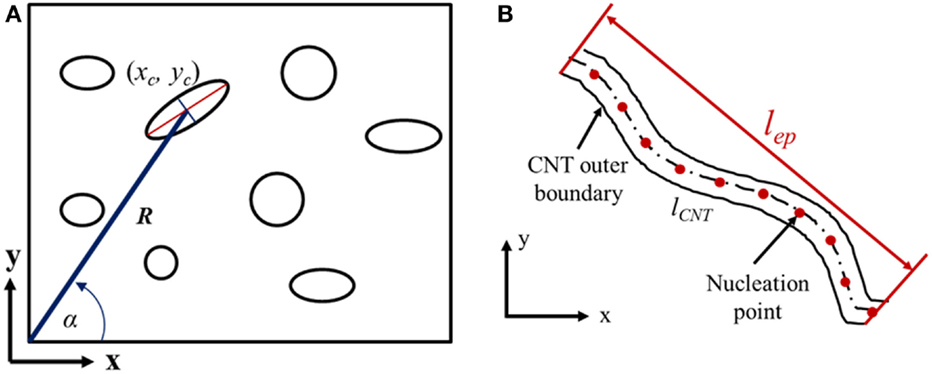
Figure 2. (A) CNT cross sections as extracted from SEM images using binary conversion to determine spatial distribution; (B) schematic of a wavy CNT with the definition of measured parameters used to determine CNT waviness (Bhuiyan et al., 2013).
Figure 2B shows the CNT parameters measured, in order to determine CNTs waviness distribution, from the SEM images captured from surfaces that are parallel to the injection/applied load direction of CNT/PP composites. These parameters are the distance between the endpoints of a CNT (lep) and the length of the CNT (lCNT ) and are measured using a modified image analysis algorithm originally developed for extracting the network geometry of 3D collagen gels (Stein et al., 2008). The algorithm is based on a principle of nucleation and local maxima points. Using the distance function and parameters set by the user; the program finds nucleation points and maps the CNT network through the local maxima points. The concept is then extended to output both the length and the endpoint to endpoint distance of the CNT. The straightness parameter (Ps) (Rezakhaniha et al., 2012), defined by Eq. 1, is used to characterize the CNT waviness. Ps value is bounded from 0 to 1, with Ps ~ 1 indicating a totally straight CNT whereas Ps ~ 0 indicates high degree of waviness.
where lep = distance between the CNT endpoints, lCNT = Length of the CNT, Ps = straightness parameter (CNTs are very wavy if Ps = 0; and CNTs are straight if Ps = 1).
Modeling of CNT/PP Composites
Three dimensional RVE models that consist of multiple CNT embedded in PP matrix, PP matrix and CNT/PP interphase, are developed and analyzed to evaluate the tensile modulus of CNT/PP composites. The dimensions of the RVEs were chosen as 2000 nm (L) × 1000 nm (W) × 1000 nm (H) so that the finite element analyses are not computationally intensive but large enough to accommodate the CNT characteristics, such as orientation, dispersion, distribution, waviness, and give convergent results when FEA is repeated.
The RVEs with different weight fractions of CNT are modeled by integrating analytical and solid modeling tools. The CNT centers of mass within the RVE are chosen according to the spatial PDF acquired from the SEM image analysis. Likewise, the CNT 3D orientation, waviness, and agglomerates of various sizes are modeled within the RVE utilizing the PDF obtained from image analysis. It is noted that the PDF of the CNT characteristics are expressed in terms of parameters, such as mean (μ) and SD (σ). These parameters are used to define the distribution of CNT characteristics within the RVE using a programing code written in MATLAB®. Next, the 3D RVE is generated in Autodex INVENTOR® and the geometry is imported to ANSYS® for FEA. The flow chart presented in Figure 3A outlines the process of RVE generation for FEA. While generating the RVE, a filler-to-filler distance algorithm (Pucha and Worthy, 2014) is used to make sure that the CNT are not overlapping/contacting with each other. The volume fraction is updated when CNT is added and the process continues until the desired volume fraction is achieved. Schematic representation of the steps to generate 3D RVE of the composite for FEA is shown in Figure 3B.
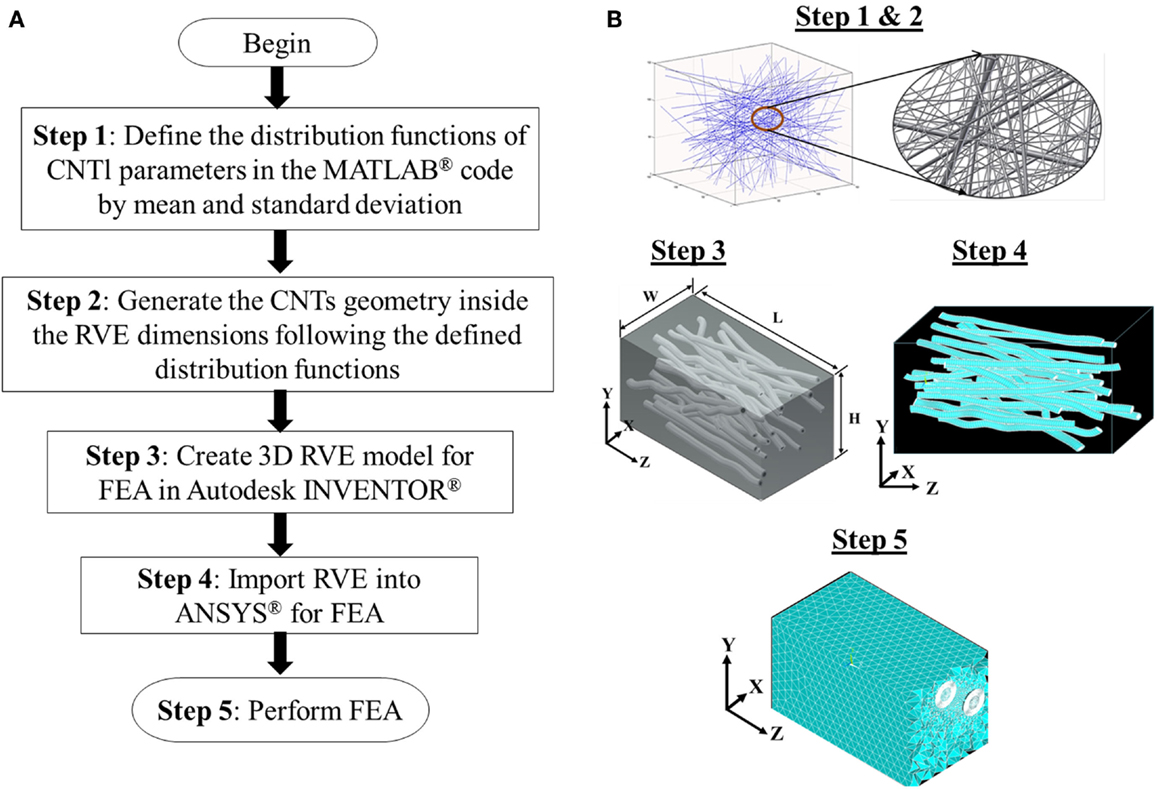
Figure 3. (A) Flow chart showing the steps used to generate RVE for the composites. (B) Schematic representation of the steps to generate 3D RVE of the composites for FEA.
A CNT length of 1500 nm is used, which is the critical length (minimum CNT length required to deliver the highest reinforcing efficiency of CNT) of the CNT based on a FEA parametric study. From the FEA parametric study, it was found that when CNT length is more than 1500 nm the modulus of CNT/PP composites is almost constant for all the CNT content used in the analysis. However, the modulus drops significantly when CNT length is below 1500 nm. Therefore, it is concluded that the load transfer capacity of the CNTs used in this study is maximized when the CNT length is 1500 nm. The details of the FEA parametric study can be found in Bhuiyan et al. (2012). In addition, the CNT is modeled as effective (solid) fiber of diameter equal to the CNT OD (Bhuiyan et al., 2013). The modulus of the effective fiber is calculated using Eq. 2, which is derived based on the assumption that an applied external force on the CNT and the effective fiber will result in an isostrain condition (Thostenson and Chou, 2003).
where, rf (=d/2) is the radius of effective fiber, t (≅0.34 nm) is the thickness of CNT outer layer and ECNT = 1250 GPa is the average modulus of the CNT as provided by the supplier.
The CNT/polymer interphase is introduced in the RVE by replacing an equivalent volume of polymer matrix, while maintaining the CNT volume. The interphase was characterized in terms of thickness and modulus using phase images obtained by taping mode AFM of the composites. Phase images present the phase angle as a function of distance. Any change in phase angle reflects changes in the material stiffness (Gao and Mader, 2002) and by scanning across the CNT–PP interphase one can obtain the thickness/width of the interphase as well as the stiffness (modulus) profile across the interphase.
As reported in our previous studies (Bhuiyan et al., 2011, 2012, 2013), the average width/thickness of the interphase is ~20 nm and the interphase modulus varies from Eint = ECNT at the CNT surface to Eint = EPP at the interface surface adjacent to the polymer following a property (modulus) gradient profile across the thickness of the interphase. The modulus profile across the interphase can be better described using a fourth order polynomial equation as shown below that is derived using Matlab® polyfit function.
where A, B, C, and D are constants. The constants are derived as A = 0.0005, B = −0. 0247, C = 0.4928, and D = −4.0909 and are determined by fitting the profile with a polynomial with a R2 value of 0.994. It is noted that several AFM images are taken from various locations (five in an average) at the surfaces of CNT/PP composites of different CNT concentrations (0.1, 1, and 4 wt%) to measure the thickness of interphase and the modulus profile across the interphase. The modulus profiles are sensitive enough to capture the presence of defects, such as voids, if there is any, at the CNT/PP interphase.
Commercially available software ANSYS® 14.5 is used to analyze the generated 3D RVE models. The RVE is subjected to uniform extension within the linear regime of the stress–strain curve as determined experimentally. For each model, one end (z = 0, see Figure 3B) is constrained in the axial direction (z direction) and free to move in the lateral directions. The free edges are constrained to their respective normal directions in order to allow the RVE to contract due to tension. An axial displacement, which corresponds to the experimental strain, is applied to all nodes on the surface of the other end (z = L) of the RVE. Periodic boundary conditions are applied to the other RVE faces. The element used for all phases is a 3D structural brick element namely, SOLID185, which is an eight-node quadratic element and has three degrees of freedom per node. It is assumed that the bonding at the interface is perfect (Hammeranda et al., 2007; Zhang et al., 2007; Kumar et al., 2010), and all the phases are isotropic, linear elastic, and homogeneous. A FEA parametric study is used to determine the optimum element size (mesh density) that leads to a fully converged solution with minimum computational time. The mechanical properties and the dimensions of each of the phases used in the analysis can be found in our prior studies (Bhuiyan et al., 2012, 2013).
Results
Tensile Properties of CNT/PP Composites Determined Experimentally
Tensile stress–strain curves of CNT/PP composites bulk/dogbone and fibers are presented in Figures 4A,B, respectively. The corresponding values of strength and modulus are presented in Table 1. Each data point is the average value of 5 tests for bulk composites and 10 tests for fiber composites. Tensile moduli of CNT/PP bulk composites obtained using theoretical micromechanical models, such as Halpin–Tsai (H–T) (Halpin and Kardos, 1976) and Tandon–Weng (T–W) (Tandon and Weng, 1984), and using rule of mixtures (RoM) as a function of CNT content are also presented in Table 1 for comparison.
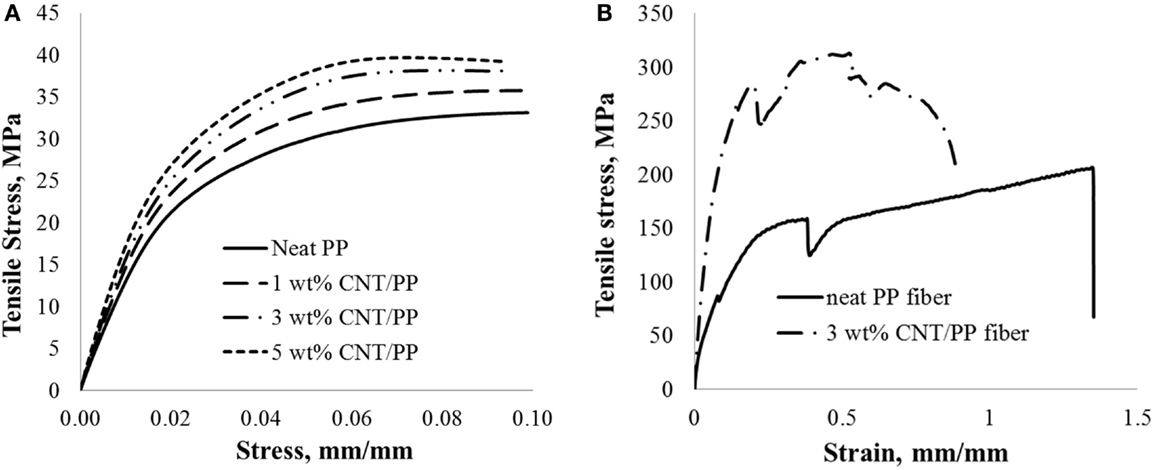
Figure 4. Tensile stress–strain plots of CNT/PP composites: (A) bulk and (B) fiber.
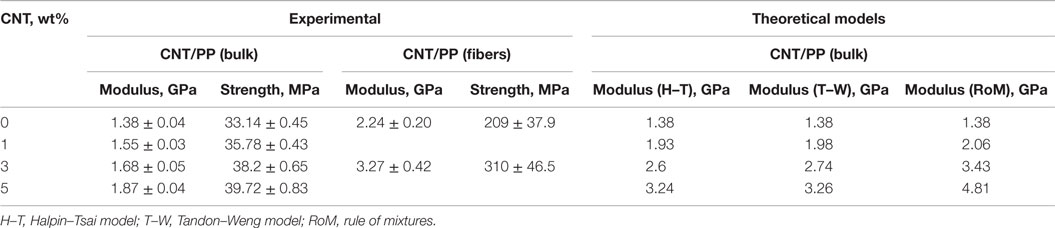
Table 1. Tensile properties of CNT/PP composites: bulk vs. fibers and experiments vs. models.
As shown in Figure 4B, the fibers have a very high initial modulus followed by a very sharp yield that is a result of shear band nucleation at the necked zone. The stress decrease after yield corresponds to the intrinsic softening of the polymer. Similar behavior of CNT/PP fibers is reported elsewhere (Moore et al., 2004). The elongation at the break of the PP fiber is also higher than that of the bulk PP specimen (see Figure 4A), which is due to the higher degree of alignment of amorphous chains in case of fibers during tensile stretching. It is noted that addition of CNT results in significant improvement in the tensile properties of the fibers and lower elongation at break. The modulus and the strength of CNT/PP fiber composites are approximately twice and eight times the modulus and strength of the bulk CNT/PP composites, respectively, for the same CNT content that is attributed to the alignment of CNT and polymer chains along the applied load direction and the increased crystallinity of the polymers due to the addition of CNT (Moore et al., 2004). Similar trends have been observed when bulk PP specimens are compared to neat PP fiber, as a result of the orientation of polymer chains along the draw direction and the strain-induced crystallization within the amorphous region in case of the fibers (Dabrowska et al., 2015).
As shown, the strength and modulus of composites (both bulk and fiber) increase with CNT content but are significantly lower than the properties predicted by the theoretical micromechanical models H–T, T–W, and RoM. The higher predicted values are due to the assumption of the ideal case: (i) uniform distribution of unidirectional CNTs, (ii) perfect bonding between CNT and PP, and (iii) absence of voids within the matrix. However, this is not the case for composites made using melt mixing and injection molding as evident from the SEM images captured from the fracture surfaces of CNT/PP composites (bulk). A representative SEM image of 4 wt% CNT/PP (bulk) composite, Figure 5A, indicates that there are microvoids at the CNT/PP interphase and CNT agglomerates and the CNT are wavy and not straight within the PP matrix. Agglomerates that act as stress concentration sites, and CNT waviness reduce the reinforcing efficiency of CNT within the polymer and result to composites with compromised tensile properties. The existence of voids at the CNT/PP interface leads to inefficient load transfer between the two phases. It is noted that at higher CNT content (>3 wt%) RoM predictions are significantly higher than the H–T and T–W predictions, which is the effect of the type of reinforcement considered in the models. Reinforcement is considered as continuous in RoM, whereas it is discontinuous for both the H–T and T–W models.
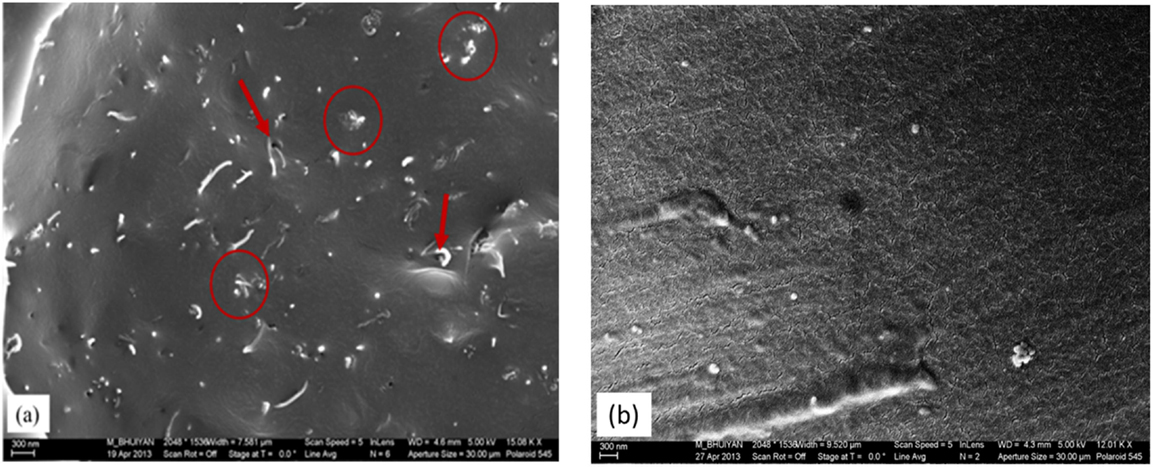
Figure 5. SEM images of the fracture surface of (A) 4 wt% CNT/PP bulk composites and (B) 3 wt% CNT/PP fiber composites showing the presence of CNT agglomerates (circled) and voids at the CNT/PP interface.
Another factor that contributes to this large improvement in the tensile properties in case of the CNT/PP fibers is the CNT dispersion. A typical SEM image of the fracture surface of 3 wt% CNT/PP fiber composites, shown in Figure 5B, indicates that the dispersion of CNT within the PP matrix is almost uniform with very few CNT agglomerates present. The boundary conditions induced by the melt spinning process help both the CNT and polymer chains to align along the loading direction that in effect helps to develop good interaction between CNT and polymer chains (Dabrowska et al., 2015) resulting in good dispersion of CNTs within the polymer matrix. In addition, no evidence of CNT pull out is observed, which indicates good CNT–PP interfacial interactions.
The dispersion state of CNT within the polymer was altered by using SDBS. Figure 6 shows the tensile properties of SDBS-modified CNT and as received (non-modified) CNT composites (bulk), as a function of CNT content up to 5 wt%. As shown, the modified CNT result in composites with higher modulus and strength compared to the corresponding properties of the non-modified CNT composites. SDBS that consists of hydrophilic head groups and hydrophobic hydrocarbon chain molecules acts as an intermediate agent improving the interfacial interactions between CNT and PP and resulting in better dispersion of CNT within the PP matrix (Cheng et al., 2012; Mirjalili et al., 2014; Rahman et al., 2014). In addition, modification of the surface of CNT using SDBS reduces their surface tension, thereby preventing the formation of CNT agglomerates (Zhou et al., 2008; Mičušík et al., 2011). According to Figure 6, the modulus and strength of the SDBS-modified CNT/PP composites reach a plateau value at 4 wt% of CNT despite the presence of SDBS. This may be due to the fact that at higher CNT content the surface of CNT increases significantly and CNT are closer together, so there are strong van der Waals forces acting against the action of the SDBS (Rahman et al., 2014). Also, as the CNT content increases, so does the SDBS (their ration is 1:1), which means that the high molecular weight PP is replaced by the low molecular SDBS resulting in a decrease of the modulus and strength (Wang et al., 2008). Typical SEM micrographs of the fracture surfaces of 4 wt% CNT/PP composites, with modified and non-modified CNT, are presented in Figures 7A,B, respectively. As shown, there is uniform dispersion of CNT within the PP only in the case of SDBS-modified CNT/PP composites, Figure 7A, whereas a large number of CNT agglomerates can be seen in Figure 7B.
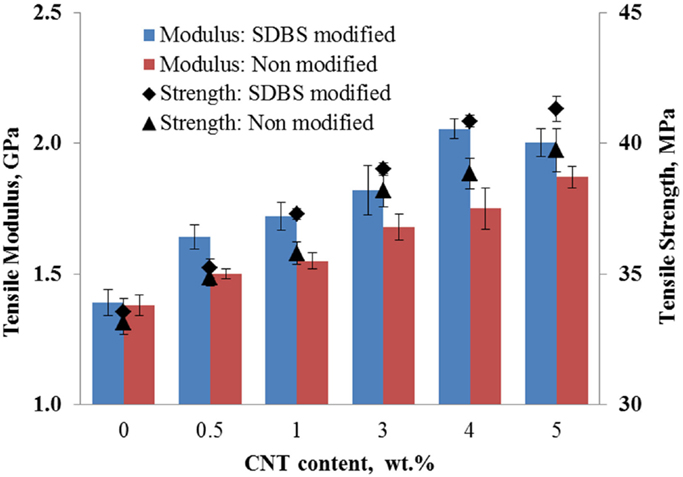
Figure 6. Effects of CNT dispersion on the tensile properties of CNT/PP composites.
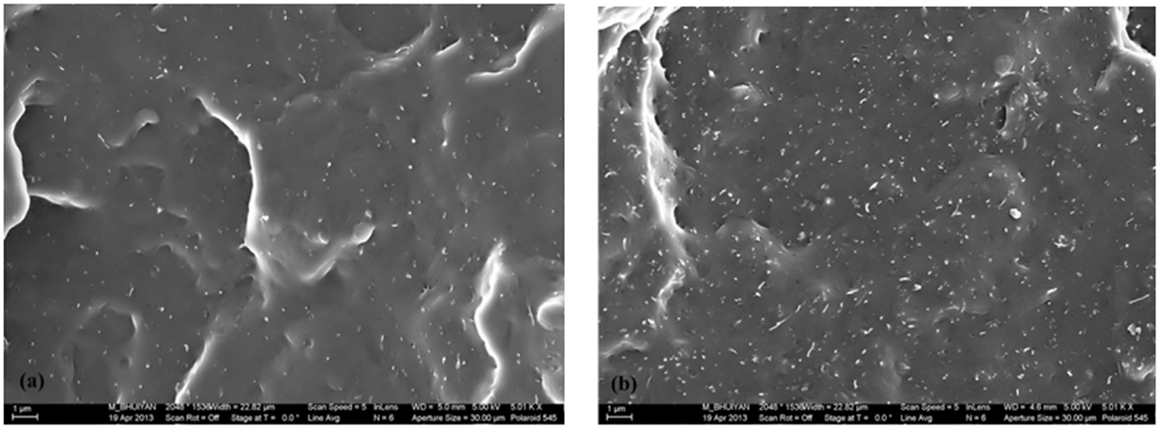
Figure 7. SEM images of the fracture surfaces of 4 wt% CNT/PP composites with (A) SDBS-modified CNT; and (B) non-modified CNT.
Probability Distribution Functions of CNT Parameters within the PP Matrix
The PDF of the 3D orientation (θ and φ) of CNT within the PP matrix for 4 wt% CNT/PP bulk and 3 wt% CNT/PP fiber composites are shown in Figures 8A,B, respectively. The PDF were obtained using the image analysis algorithm and a series of SEM images as described above. It can be seen that for fiber composites most CNT are oriented within ±35° range with respect to the applied load/spinning direction (Z-axis, Figure 3B), whereas this range is broader (from −40° to 70°) for CNT/PP bulk composites.
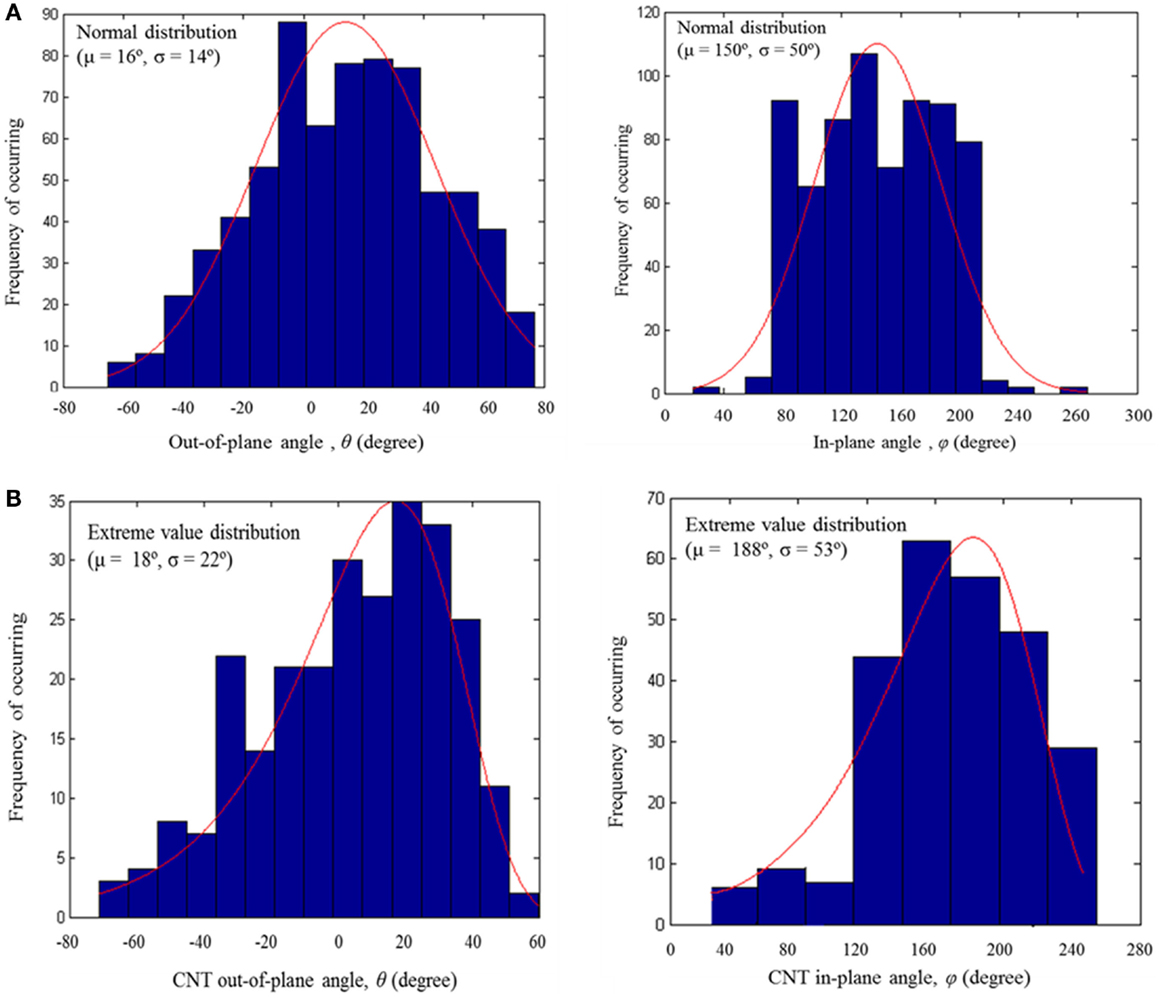
Figure 8. CNT orientation distribution within the PP matrix obtained through SEM image analysis: (A) bulk and (B) fiber composites.
The spatial distribution of CNT within PP matrix, described by two parameters, R [distance of the centroid (xc, yc) of CNT cross section from the origin in nanometer] and α (angular position of the centroid of CNT cross section with respect to the horizontal axis in degrees), are presented in Figures 9A,B for bulk and fiber CNT/PP composites, respectively. As shown, the CNT spatial distribution within the polymer is non-homogeneous for bulk composites and close to homogeneous for fiber composites.
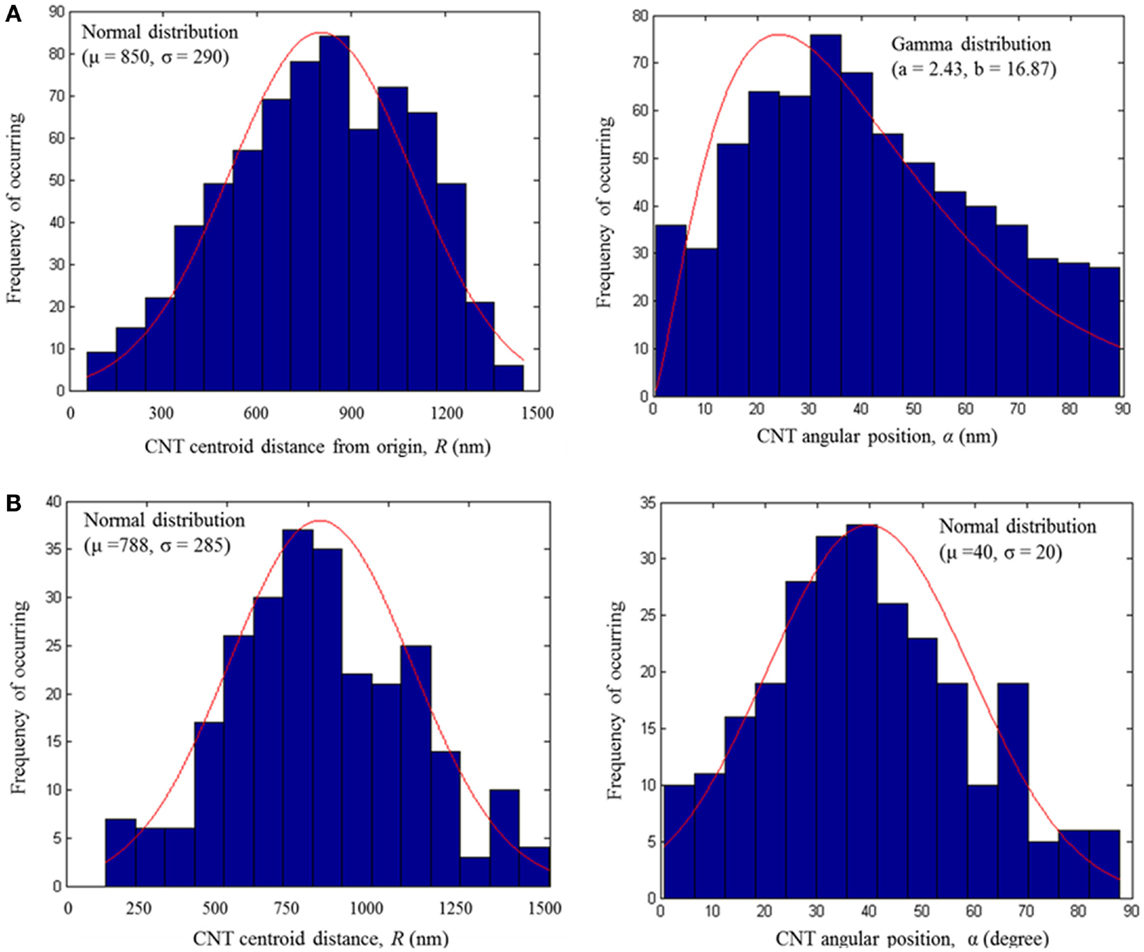
Figure 9. CNT spatial distribution within the PP matrix as extracted from the SEM micrographs of (A) 4 wt% CNT/PP bulk composites; (B) 3 wt% CNT/PP fiber composites.
The PDF of the CNT diameter for (i) 4 wt% non-modified CNT/PP bulk composites, (ii) 4 wt% SDBS-modified CNT/PP bulk composites, and (iii) 3 wt% non-modified CNT/PP fiber composites are presented in Figures 10A–C, respectively. In case of the bulk composites with non-modified CNT, there are agglomerates with diameters ranging from 40 to 180 nm due to the strong van der Waals attractions among the CNT and their large aspect ratio. An improvement in dispersion of CNT within the PP matrix is observed for the case of SDBS-modified CNT/PP composites where the maximum size of the CNT agglomerates is ~80 nm.
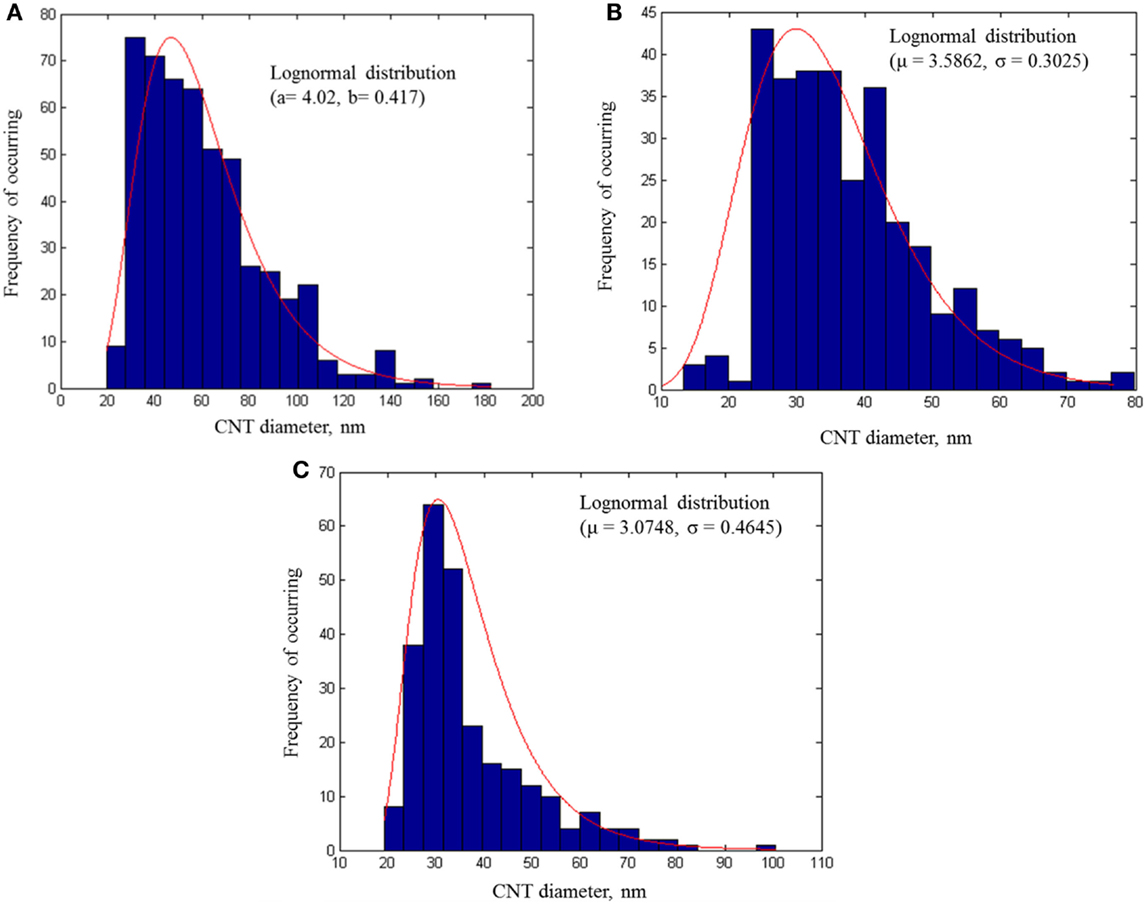
Figure 10. PDF of CNT diameter according to the image analysis: (A) bulk (non-modified CNT); (B) bulk (SDBS-modified CNT); and (C) fiber (non-modified CNT) composites.
The distribution of CNT diameter in CNT/PP fibers, presented in Figure 10C, shows that the CNT diameter varies from 20 to 100 nm with a mean of ~30 nm, which is very close to the diameter of a single CNT as provided by the supplier. Although no surface treatment of CNT is performed, the size of the CNT agglomerates present in the CNT/PP fiber composites is much lower than the size of the agglomerates present in the CNT/PP bulk composites. This is mainly because during the fiber spinning process, CNT are always under tension, which helps CNT alignment and dispersion (Haggenmueller et al., 2000; Kearns and Shambaugh, 2002; Sennett et al., 2003). The alignment of CNT along the applied load direction, as well as small CNT diameter (better dispersion) results in CNT/PP fibers with tensile properties better than those of the CNT/PP bulk composites.
It is noted that the PDF for CNT orientation, spatial distribution, and waviness within the PP matrix for SDBS-modified CNT/PP composites were also determined but show no significant differences compared to the corresponding PDF of the non-modified CNT/PP composites thus they are presented here. This is expected as no special effort has been undertaken to control the distribution of these CNT parameters within the PP matrix. In addition, the PDF of CNT waviness within the PP matrix for CNT/PP fibers cannot be determined, due to the small number of CNT in the SEM images of CNT/PP fiber composites surface although, according to SEM the CNT are wavy in the CNT/PP fiber composites.
Ability of 3D RVE Models to Distinguish between Two Different Dispersion and Orientation States
The goal of this section is to demonstrate the ability of the multi-cell 3D RVE analysis models to capture the changes in the CNT dispersion state and orientation within the PP matrix. Bulk CNT/PP composites with as received and SDBS-modified CNT and fiber CNT/PP composites are modeled using the corresponding PDF presented in Figures 8–10. The interphase characteristics (thickness and modulus), as determined in Bhuiyan et al. (2013), are also accounted for in the model and considered the same for all three cases of composites studied. The FEA predictions of the modulus for the three composite systems as well as the corresponding modulus determined experimentally are presented in Figure 11. FEA simulations are repeated six times and the variations are shown using error bars. It is noted that in the case of the composite fibers the CNT waviness is modeled using a random distribution. The same RVE geometry and loading and boundary conditions, and the same materials properties are used for all three cases. As shown, the modulus predicted by the FEA is within the experimental deviation, for all three cases studied indicating that the model can capture changes in the CNT dispersion and agglomeration. It is noted that the model seems to under-predict the tensile modulus of 3 wt% CNT composite fibers. Some possible reasons for this may be the random distribution assumption for CNT waviness and the fact that the modulus of the PP matrix, which is an input parameter in the model, is higher in the case of the fibers due to polymer chain alignment.
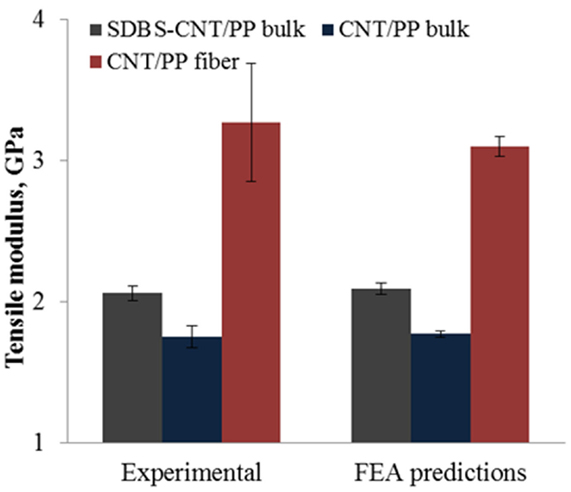
Figure 11. FEA predictions for tensile modulus of CNT/PP bulk composites (both modified and non-modified CNT) and CNT/PP fiber composites.
It is noted that the model is also capable of capturing the change of CNT wt% while generating the 3D RVE for FEA. To verify, 3D RVE for 3 wt% CNT/PP composites is generated using the same distribution functions for CNT characteristics as obtained from SEM images of 4 wt% CNT/PP composites. A total of 8 CNT are counted within the RVE for 3 wt% CNT case, whereas this number is larger or equal to 11 for 4 wt% CNT case. The smaller number of CNT within the RVE suggests that FEA will predict lower modulus for 3 wt% CNT/PP composites as expected. Although, the distribution functions used to generate the RVEs represent the worst case scenario for 3 wt% CNT/PP composites the generated models are sufficient to verify the capability of the model to capture the changes of CNT wt% while generating the RVEs for FEA.
Conclusion
In this study, CNT/PP composites with different CNT orientation, dispersion, and distribution (agglomeration) states were fabricated and characterized in terms of their modulus. The CNT orientation and dispersion of bulk (dogbone) composites were altered by melt spinning fibers whereas the agglomeration was altered by using a surfactant. The PDF of the CNT characteristics was determined using series of SEM images and an image analysis algorithm. The experimentally determined modulus for the bulk composites with as received and SDBS-modified CNT and for the fiber composites was compared to the modulus of the corresponding composite system predicted by 3D RVE analysis models that accounted for the PDF of the of CNT orientation, dispersion, and agglomeration. The comparison with the experimental results indicated that this integrated modeling technique that combines experimental characterization and FEA through 3D RVE models is sensitive enough to capture small differences in the CNT characteristics and can quantify the effect of these characteristics (orientation, dispersion, and agglomeration) on the tensile modulus of CNT polymer composites.
It is concluded that the 3D RVE FEA model used in this study can reliably simulate the tensile modulus of PCNs and provide quantitative information regarding the impact of nanomaterials’ parameters, some of which are affected by the manufacturing method and conditions used, and their geometry on the composites tensile modulus. The modeling framework due to its capability to capture these differences in the structure/morphology of the nanocomposites can be used as a design tool to guide the manufacture of PCNs with engineered properties, namely, tensile modulus avoiding the costly and time intensive “trial-and-error” method commonly used.
Author Contributions
Author KK supervised the Ph.D. student, MB who conducted all the research, and Dr. RP helped the student with the modeling work.
Conflict of Interest Statement
The authors declare that the research was conducted in the absence of any commercial or financial relationships that could be construed as a potential conflict of interest.
Acknowledgments
The authors thank Mr. J. Worthy and Prof. J. Colton from Georgia Institute of Technology for helping with the modeling of 3D RVE of composites and the tensile testing of the composites, respectively.
References
Ajayan, P., and Tour, J. (2007). Materials science: nanotube composites. Nature 447, 1066–1068. doi: 10.1038/4471066a
Andrews, R., Jacques, D., Rao, A., Rantell, T., Derbyshire, F., Chen, Y., et al. (1999). Nanotube composite carbon fibers. Appl. Phys. Lett. 75, 1329–1331. doi:10.1063/1.124683
Andrews, R., Jaques, D., Qian, D., and Rantell, T. (2002). Multiwall carbon nanotubes: synthesis and application. Acc. Chem. Res. 35, 1008–1017. doi:10.1021/ar010151m
Anumandla, V., and Gibson, R. (2006). A comprehensive closed form micromechanics model for estimating the elastic modulus of nanotube-reinforced composites. Compos. A. Appl. Sci. Manuf. 37, 2178–2185. doi:10.1016/j.compositesa.2005.09.016
Ashrafi, B., and Hubert, P. (2006). Modeling the elastic properties of carbon nanotube array/polymer composites. Compos. Sci. Technol. 66, 387–396. doi:10.1016/j.compscitech.2005.07.020
Bhuiyan, M., Pucha, R., Karevan, M., and Kalaitzidou, K. (2011). Tensile modulus of carbon nanotube/polypropylene composites – a computational study based on experimental characterization. Comput. Mater. Sci. 50, 2347–2353. doi:10.1016/j.commatsci.2011.03.009
Bhuiyan, M., Pucha, R., Worthy, J., Karevan, M., and Kalaitzidou, K. (2012). Defining the lower and upper limit of the effective modulus of CNT/polypropylene composites through integration of modeling and experiments. Compos. Struct. 95, 80–87. doi:10.1016/j.compstruct.2012.06.025
Bhuiyan, M., Pucha, R., Worthy, J., Karevan, M., and Kalaitzidou, K. (2013). Understanding the effect of CNT characteristics on the tensile modulus of CNT reinforced polypropylene using finite element analysis. Comput. Mater. Sci. 79, 368–376. doi:10.1016/j.commatsci.2013.06.046
Blighe, F., Young, K., Vilatela, J., Windle, A., Kinloch, I., Deng, L., et al. (2011). The effect of nanotube content and orientation on the mechanical properties of polymer-nanotube composite fibers: separating intrinsic reinforcement from orientational effects. Adv. Funct. Mater. 21, 364–371. doi:10.1002/adfm.201000940
Calvert, P. (1999). Nanotube composites: a recipe for strength. Nature 399, 210–211. doi:10.1038/20326
Chen, X., and Liu, Y. (2004). Square representative volume elements for evaluating the effective material properties of carbon nanotube-based composites. Comput. Mater. Sci. 29, 1–11. doi:10.1016/S0927-0256(03)00090-9
Cheng, H., Pan, Y., Sahoo, N., Chong, K., Li, L., Chan, H., et al. (2012). Improvement in properties of multiwalled carbon nanotube/polypropylene nanocomposites through homogeneous dispersion with the aid of surfactants. J. Appl. Polym. Sci. 124, 1117–1127. doi:10.1002/app.35047
Dabrowska, I., Fambri, L., Pegoretti, A., Slouf, M., Vackova, T., and Kolarik, J. (2015). Spinning, drawing and physical properties of polypropylene nanocomposite fibers with fumed nanosilica. Express Polym. Lett. 9, 277–290. doi:10.3144/expresspolymlett.2015.25
Du, J.-H., Bai, J., and Cheng, H.-M. (2007). The present status and key problems of carbon nanotube based polymer composites. Express Polym. Lett. 1, 253–273. doi:10.3144/expresspolymlett.2007.39
Endo, M., Strano, M., and Ajayan, P. (2008). Potential applications of carbon nanotubes. Top. Appl. Phys. 111, 13–62. doi:10.1007/978-3-540-72865-8_2
Fan, Z., and Advani, S. (2005). Characterization of orientation state of carbon nanotubes in shear flows. Polymer 46, 5232–5240. doi:10.1016/j.polymer.2005.04.008
Fischer, G., and Eyerer, P. (1988). Measuring spatial orientation of short fiber reinforced thermoplastics by image analysis. Polym. Compos. 9, 297–304. doi:10.1002/pc.750090409
Fisher, F., Bradshaw, R., and Brinson, L. (2002). Effects of nanotube waviness on the modulus of nanotube-reinforced polymers. Appl. Phys. Lett. 80, 4647–4650. doi:10.1063/1.1487900
Fisher, F., Bradshaw, R., and Brinson, L. (2003). Fibre waviness in nanotube-reinforced polymer composites-I: modulus predictions using effective nanotube properties. Compos. Sci. Technol. 63, 1689–1703. doi:10.1016/S0266-3538(03)00069-1
Gade, S. (2005). Characterization of the Mechanical Properties of Carbon Nanotube Based Composites Using the Finite Element Method. Ph.D. thesis, University of Cincinnati, Ohio.
Gao, S., and Mader, E. (2002). Characterisation of interphase nanoscale property variations in glass fibre reinforced polypropylene and epoxy resin composites. Compos. A. Appl. Sci. Manuf. 33, 559–576. doi:10.1016/S1359-835X(01)00134-8
Godovsky, D. (2000). Device applications of polymer-nanocomposites. Adv. Polym. Sci. 153, 163–205. doi:10.1007/3-540-46414-X_4
Gommes, C., Blacher, S., Masenelli-Varlot, K., Bossuot, C., McRae, E., Fonseca, A., et al. (2003). Image analysis characterization of multi-walled carbon nanotubes. Carbon N. Y. 41, 2561–2572. doi:10.1016/S0008-6223(03)00375-0
Haggenmueller, R., Gommans, H., Rinzler, A., Fischer, J., and Winey, K. (2000). Aligned single wall carbon nanotubes in composites by melt processing methods. Chem. Phys. Lett. 330, 219–225. doi:10.1016/S0009-2614(00)01013-7
Halpin, J., and Kardos, J. (1976). The Halpin-Tsai equations: a review. Polym. Eng. Sci. 16, 344–352. doi:10.1002/pen.760160512
Hammeranda, D., Seidelb, G., and DC, L. (2007). Computational micromechanics of clustering and interphase effects in carbon nanotube composites. Mech. Adv. Mater. Struct. 14, 277–294. doi:10.1080/15376490600817370
Hernández-Pérez, A., and Avilés, F. (2010). Modeling the influence of interphase on the elastic properties of carbon nanotube composites. Comput. Mater. Sci. 47, 926–933. doi:10.1016/j.commatsci.2009.11.025
Hine, P., and Duckett, R. (2004). Fiber orientation structures and mechanical properties of injection molded short glass fiber reinforced ribbed plates. Polym. Compos. 25, 237–254. doi:10.1002/pc.20019
Hu, N., Fukunaga, H., Lu, C., Kameyama, M., and Yan, B. (2005). Prediction of elastic properties of carbon nanotube reinforced composites. Proc. R. Soc. A 461, 1685–1710. doi:10.1098/rspa.2004.1422
Jancar, J., Douglas, J., Starr, F., Kumar, S., Cassagnau, P., Lesser, A., et al. (2010). Current issues in research on structure property relationships in polymer nanocomposites. Polymer 51, 3321–3343. doi:10.1016/j.polymer.2010.04.074
Kalaitzidou, K., Fukushima, H., and Drzal, L. (2007). A new compounding method for exfoliated graphite-polypropylene nanocomposites with enhanced flexural properties and lower percolation threshold. Compos. Sci. Technol. 67, 2045–2051. doi:10.1016/j.compscitech.2006.11.014
Kawamura, M., Ikeda, S., and Sanomura, Y. (2005). Unambiguous determination of 3D fiber orientation distribution in thermoplastic composites using SAM image of elliptical mark and interference fringe. J. Compos. Mater. 39, 287–299. doi:10.1177/0021998305046463
Kearns, J., and Shambaugh, R. (2002). Polypropylene fibers reinforced with carbon nanotubes. J. Appl. Polym. Sci. 86, 2079–2084. doi:10.1002/app.11160
Kumar, P., Chandra, R., and Singh, S. (2010). Interphase effect on fiber-reinforced polymer composites. Compos. Interfaces 17, 15–35. doi:10.1163/092764409X12580201111502
Kumar, S., Dang, T., Arnold, F., Bhattacharyya, A., Min, B., Zhang, X., et al. (2002). Synthesis, structure and properties of PBO/SWNT composites. Macromolecules 24, 9039–9043. doi:10.1021/ma0205055
Liang, J., Huang, Y., Zhang, L., Wang, Y., Ma, Y., and Guo, T. (2009). Molecular-level dispersion of graphene into poly(vinyl alcohol) and effective reinforcement of their nanocomposites. Adv. Funct. Mater. 19, 2297–2302. doi:10.1002/adfm.200801776
Liu, Y., and Chen, X. (2003). Evaluation of the effective material properties of carbon nanotube-based composites using a nanoscale representative volume element. Mech. Mater. 35, 69–81. doi:10.1016/S0167-6636(02)00200-4
Liu, Y., and Kumar, S. (2014). Polymer/carbon nanotube nano composite fibers – a review. ACS Appl. Mater. Interfaces 6, 6069–6087. doi:10.1021/am405136s
Luo, D., Wang, W.-X., and Takao, Y. (2007). Effects of the distribution and geometry of carbon nanotubes on the macroscopic stiffness and microscopic stresses of nanocomposites. Compos. Sci. Technol. 67, 2947–2958. doi:10.1016/j.compscitech.2007.05.005
Mičušík, M., Omastová, M., Pionteck, J., Pandis, C., Logakis, E., and Pissis, P. (2011). Influence of surface treatment of multiwall carbon nanotubes on the properties of polypropylene/carbon nanotubes nanocomposites. Polym. Adv. Technol. 22, 38–47. doi:10.1002/pat.1745
Mirjalili, F., Chuah, L., and Salahi, E. (2014). Mechanical and morphological properties of polypropylene/nano a-AL2O3 composites. ScientificWorldJournal 2014, 1–12. doi:10.1155/2014/718765
Moore, E., Ortiz, D., Marla, V., Shambaugh, R., and Grady, B. (2004). Enhancing the strength of polypropylene fibers with carbon nanotubes. J. Appl. Polym. Sci. 93, 2926–2933. doi:10.1002/app.20703
Mylvaganam, K., and Zhang, L. (2007). Fabrication and application of polymer composites comprising carbon nanotubes. Recent Pat. Nanotechnol. 1, 59–65. doi:10.2174/187221007779814826
Pantano, A., Modica, G., and Cappello, F. (2008). Multiwalled carbon nanotube reinforced polymer composites. Mater. Sci. Eng. A 486, 220–227. doi:10.1016/j.msea.2007.08.078
Peponib, L., Pugliaa, D., Torrea, L., Valentinia, L., and Kenny, J. (2014). Processing of nanostructured polymers and advanced polymeric based nanocomposites. Mater. Sci. Eng. R 85, 1–46. doi:10.1016/j.mser.2014.08.002
Pucha, R., and Worthy, J. (2014). Representative volume element-based design and analysis tools for composite materials with nanofillers. J. Compos. Mater. 48, 2117–2129. doi:10.1177/0021998313494916
Qian, D., Dickey, E., Andrews, R., and Rantell, T. (2000). Load transfer and deformation mechanisms in carbon nanotubepolystyrene composites. Appl. Phys. Lett. 76, 2868–2870. doi:10.1063/1.126500
Rahman, M., Younes, H., Subramanian, N., and Ghaferi, A. (2014). Optimizing the dispersion conditions of SWCNTs in aqueous solution of surfactants and organic solvents. J. Nanomater. 2014, 1–11. doi:10.1155/2014/102621
Rezakhaniha, R., Agianniotis, A., Schrauwen, J., Griff, A., Sage, D., Bouten, C., et al. (2012). Experimental investigation of collagen waviness and orientation in the arterial adventitia using confocal laser scanning microscopy. Biomech. Model. Mechanobiol. 11, 461–473. doi:10.1007/s10237-011-0325-z
Sarkar, A., and Banerjee, R. (2004). A quantitative method for characterization of carbon nanotubes for hydrogen storage. Int. J. Hydrogen Energy 29, 1487–1491. doi:10.1016/j.ijhydene.2004.02.003
Sennett, M., Welsh, E., Wright, J., Li, W., Wen, J., and Ren, Z. (2003). Dispersion and alignment of carbon nanotubes in polycarbonate. Appl. Phys. A Mater. Sci. Process. 76, 111–113. doi:10.1007/s00339-002-1449-x
Shi, D.-L., Feng, X.-Q., Huang, Y., Hwang, K.-C., and Gao, H. (2004). The effect of nanotube waviness and agglomeration on the elastic property of carbon nanotube reinforced composites. J. Eng. Mater. Technol. 126, 250–257. doi:10.1115/1.1751182
Song, K., Zhang, Y., Meng, J., Green, E., Tajaddod, N., Li, H., et al. (2013). Structural polymer based carbon nanotube composite fibers: understanding the processing-structure-performance relationship. Materials 6, 2543–2577. doi:10.3390/ma6062543
Stein, A., Vader, D., Jawerth, L., Weitz, D., and Sander, L. (2008). An algorithm for extracting the network geometry of three-dimensional collagen gels. J. Microsc. 232, 463–475. doi:10.1111/j.1365-2818.2008.02141.x
Tandon, G., and Weng, G. (1984). The effect of aspect ratio of inclusions on the elastic properties of unidirectionally aligned composites. Polym. Compos. 5, 327–333. doi:10.1002/pc.750050413
Thostenson, E., and Chou, T.-W. (2003). On the elastic properties of carbon nanotube-based composites: modelling and characterization. J. Phys. D Appl. Phys. 36, 573–582. doi:10.1088/0022-3727/36/5/323
Velez-Garcia, G., Wapperom, P., Baird, D., Aning, A., and Kunc, V. (2012). Unambiguous orientation in short fiber composites over small sampling area in a center-gated disk. Compos. A. Appl. Sci. Manuf. 43, 104–113. doi:10.1016/j.compositesa.2011.09.024
Wan, H., Delale, F., and Shen, L. (2005). Effect of CNT length and CNT-matrix interphase in carbon nanotube (CNT) reinforced composites. Mech. Res. Commun. 32, 481–489. doi:10.1016/j.mechrescom.2004.10.011
Wang, S., Liang, Z., Wang, B., and Zhang, C. (2006). Statistical characterization of single-wall carbon nanotube length distribution. Nanotechnology 17, 634–639. doi:10.1088/0957-4484/17/3/003
Wang, W., Ciselli, P., Kuznetsov, E., Peijs, T., and Barber, A. (2008). Effective reinforcement in carbon nanotube-polymer composites. Philos. Trans. A Math. Phys. Eng. Sci. 366, 1613–1626. doi:10.1098/rsta.2007.2175
Xu, L., and Sengupta, S. (2005). Interfacial stress transfer and property mismatch in discontinuous nanofiber/nanotube composite materials. J. Nanosci. Nanotechnol. 5, 620–626. doi:10.1166/jnn.2005.077
Yokozeki, T., Jitpipatpong, C., Aoki, T., Arai, A., Ishibashi, M., Yanagisawa, T., et al. (2010). Effect of mixing process on CNT length and rheological/mechanical properties of nanocomposites. J. Nanostruct. Polym. Nanocompos. 6, 5–11.
Young, K., Blighe, F., Vilatela, J., Windle, A., Kinloch, I., Deng, L., et al. (2010). Strong dependence of mechanical properties on fiber diameter for polymer-nanotube composite fibers: differentiating defect from orientation effects. ACS Nano 4, 6989–6997. doi:10.1021/nn102059c
Zhang, W., Li, L., and Wang, T. (2007). Interphase effect on the strengthening behavior of particle-reinforced metal matrix composites. Comput. Mater. Sci. 41, 145–155. doi:10.1016/j.commatsci.2007.03.011
Keywords: CNT polymer composites, tensile modulus, finite modeling, dispersion, interphase
Citation: Bhuiyan MA, Pucha RV and Kalaitzidou K (2016) 3D RVE Models Able to Capture and Quantify the Dispersion, Agglomeration, and Orientation State of CNT in CNT/PP Nanocomposites. Front. Mater. 3:2. doi: 10.3389/fmats.2016.00002
Received: 23 November 2015; Accepted: 18 January 2016;
Published: 02 February 2016
Edited by:
Yves Leterrier, École Polytechnique Fédérale de Lausanne, SwitzerlandReviewed by:
Ali Naghashpour, Concordia University, CanadaKenan Song, Massachusetts Institute of Technology, USA
Federico Bosia, University of Turin, Italy
Copyright: © 2016 Bhuiyan, Pucha and Kalaitzidou. This is an open-access article distributed under the terms of the Creative Commons Attribution License (CC BY). The use, distribution or reproduction in other forums is permitted, provided the original author(s) or licensor are credited and that the original publication in this journal is cited, in accordance with accepted academic practice. No use, distribution or reproduction is permitted which does not comply with these terms.
*Correspondence: Kyriaki Kalaitzidou, kyriaki.kalaitzidou@me.gatech.edu