Formation of Actin Networks in Microfluidic Concentration Gradients
 Natalja Strelnikova
 Cora-Ann Schoenenberger
- Department of Chemistry, University of Basel, Basel, Switzerland
The physical properties of cytoskeletal networks are contributors in a number of mechanical responses of cells, including cellular deformation and locomotion, and are crucial for the proper action of living cells. Local chemical gradients modulate cytoskeletal functionality including the interactions of the cytoskeleton with other cellular components. Actin is a major constituent of the cytoskeleton. Introducing a microfluidic-based platform, we explored the impact of concentration gradients on the formation and structural properties of actin networks. Microfluidic-controlled flow-free and steady-state experimental conditions allow for the generation of chemical gradients of different profiles, such as linear or step-like. We discovered specific features of actin networks emerging in defined gradients. In particular, we analyzed the effects of spatial conditions on network properties, bending rigidities of network links, and the network elasticity.
Introduction
The active and passive mechanical performance of the cytoskeleton is based upon crowded solutions and networks that mainly comprise actin, microtubules, and intermediate filaments (Janmey et al., 2014). Actin and actin filaments, the major structural and functional element of the cytoskeleton, form a variety of higher order assemblies with specific designs, properties, and functions (Bausch and Kroy, 2006; Huber et al., 2013). These specialized superstructures are highly dynamic in space and time as evidenced most prominently by cells that move and/or change their shape (Yang et al., 2009). Moreover, the heterogeneous structure and dynamic organization of the actin networks are essential for numerous biological processes.
Microfluidics has been applied in a wide range of studies on actin dynamics. For example, the behavior of filamentous actin (F-actin) in confinement (Köster and Pfohl, 2009) and microflow (Steinhauser et al., 2012), and the assembly and disassembly of F-actin (Soares e Silva et al., 2011; Swank et al., 2016), bundles (Hirst et al., 2005), and supramolecular networks (Deshpande and Pfohl, 2012, 2015) have been studied using microfluidics approaches.
Microfluidics is also a promising tool for establishing and controlling well-defined chemical gradients, which considering the significance of microenvironments is of great interest in biological research (Kim et al., 2010; Toh et al., 2014). Different microfluidic platforms are applicable including laminar flow (Berthier and Beebe, 2014), transient (Du et al., 2009), and steady-state (Atencia et al., 2009) gradient generators. For example, laminar flow microfluidic gradient generators are being used for the analysis of chemotactic and migratory behavior of cells (Chung and Choo, 2010; Huang et al., 2011; Wu et al., 2015). However, to study the formation of soft materials, supramolecular assemblies, and networks in concentration gradients, only flow-free transient or steady-state generators are feasible where interference of flow with the assembly process can largely be excluded.
Here, we present a new approach to create steady-state and flow-free concentration gradients for examining actin polymerization in situ. Using time-lapse epifluorescence microscopy with high spatiotemporal resolution, we monitored the formation of actin filaments in a KCl gradient. Moreover, using Mg2+ as a bivalent cationic bundling agent for actin filaments, we show the concentration-dependent formation of bundled F-actin networks with anisotropic physical properties.
Materials and Methods
Microfluidics Platform
Using standard soft lithography methods (Deshpande and Pfohl, 2012), we have fabricated microfluidic devices with two flow channels (height hchannel = 5 μm and width 50 μm), which are connected to small bypasses (hbypass = 0.5–1 μm) as illustrated in Figures 1 and 2. The two bypasses are connected to either a rectangular gradient chamber (hchamber = 0.5–1 μm, width 40 μm, and length 350 μm) or to five serially connected square chambers (hchamber = 0.5–1 μm and side length 40 μm each), which are both diffusion-controlled. The multi-height masters, which were used as a mold for corresponding microfluidic devices, were fabricated in SU8 negative photoresists (Microchem, Newton, MA, USA) coated on silicon wafers (Si-Mat, Kaufering, Germany). In order to produce the microdevices, replicas of the masters were fabricated in polydimethylsiloxane (PDMS) and finally plasma-sealed to glass slides. To prevent actin adsorption to the microdevice walls, the device was flushed with bovine serum albumin solution (BSA 1 mg/mL, Sigma-Aldrich, Switzerland). The device was submerged in water before and during the experiments to eliminate permeation-driven flow through PDMS.
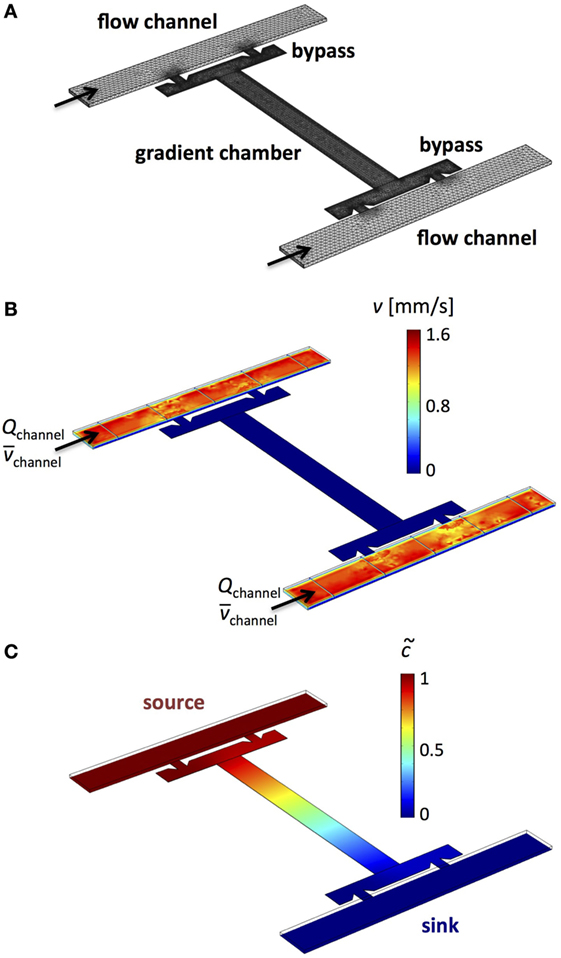
Figure 1. Microfluidic device design for flow-free and steady-state linear gradients. (A) Design of a multi-height device with two flow channels, corresponding bypasses, and a rectangular microchamber. (B) Computational simulation of the flow velocity distribution within the microfluidic device reveals advective transport in the two flow channels and absence of flow across the rectangular microchamber. (C) A linear concentration gradient across the rectangular microchamber is generated when one flow channel acts as the concentration source and the other flow channel as the sink.
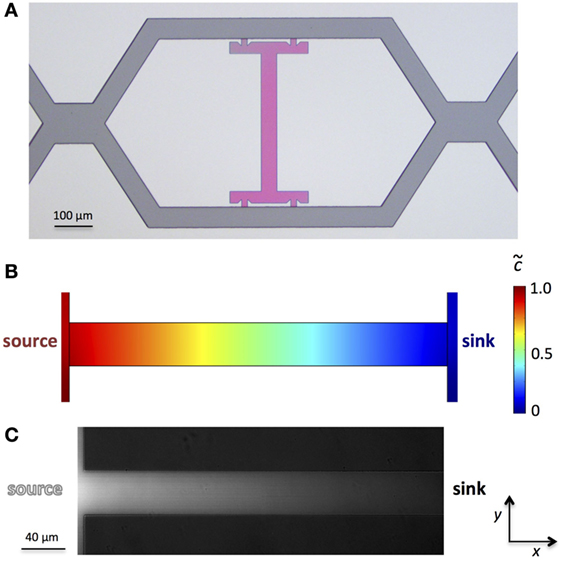
Figure 2. Experimental realization of a microfluidic device for flow-free and steady-state linear gradients. (A) Bright field micrograph of the device master prepared by photolithography. The multi-height design is evident by the different interference colors of the flow channels (dark gray) and the rectangular microchamber with bypasses (pink). The simulated linear concentration gradient (B) can be verified by an aqueous fluorescein solution using the left flow channel as the fluorescein source and the right as the sink (C).
The controlled supply of solutions to the two flow channels was achieved by syringe pumps (neMESYs low pressure syringe pump, Cetoni GmbH, Germany) using 100 μL syringes (Hamilton, Switzerland), which were connected to the microdevice inlets via polytetrafluoroethylene (PTFE) tubing.
Protein Solutions
Lyophilized actin and fluorescent Atto488-actin from rabbit skeletal muscle were purchased from Hypermol EK (Bielefeld, Germany). To prepare the monomeric actin solution, 3 μM stock solutions of Atto488-actin and actin in 2 mM Tris–HCl (pH 8.2), 0.4 mM ATP, 0.1 mM CaCl2, and 0.5 mM DTT were prepared and mixed at a 1:5 (v/v) ratio. For the actin polymerization solution (“KCl solution”), monomeric actin solution was supplemented with 100 mM KCl, 2 mM MgCl2, 0.1 mM CaCl2, 1.4 mM ATP, 0.5 mM DTT, 10 mM imidazole, 2 mM Tris–Cl (pH 7.4), and 0.2% disaccharides. The actin-bundling solution (“MgCl2 solution”) has the same composition as the actin polymerization solution (“KCl solution”) with the exception of a higher MgCl2 concentration of 50 mM.
Microscopy and Image Analysis
Polymerization and bundling experiments in gradients were observed with an Olympus IX81 inverted microscope equipped with fluorescence illumination (X-Cite Series 120 Q). The 40× (N.A. 1.30) UPlanFL N or 100× (N.A. 1.49) UApo N oil immersion objectives were used for the experiments. Images were recorded with a PCO Edge SensiCam (PCO AG, Kelheim, Germany) with exposure times of 100 ms. Images were processed and analyzed using ImageJ (version1.47k, Wayne Rasband, National Institute of Health, USA).
Simulations
All simulations were carried out using COMSOL Multiphysics 4.3a, a program solving partial differential equations numerically using the finite element method (FEM). The used mesh of the gradient chambers and the two flow channels consisted of 90,227 elements. The fluid velocities or pressures in the flow channels were tuned at the inlets. The incompressible Navier–Stokes equation was solved for the geometry with no-slip boundary conditions at the walls. A stationary flow-field was obtained and used to solve the advection–diffusion equation.
Results and Discussion
Microfluidic Device for Flow-Free and Steady-State Linear Gradients
Based on the principles of diffusion-advection chamber microfluidics (Deshpande and Pfohl, 2012, 2015), we developed a microfluidic setup for generating flow-free and steady-state concentration gradients. The corresponding microfluidic device consists of two controllable flow channels (width 50 μm and height hchannel = 5 μm), either of which is connected to a bypass by two small connecting channels (width 5 μm and height hbypass = 0.5–1 μm) as shown in Figures 1 and 2. The two bypasses are interconnected by a rectangular chamber (width 40 μm, length 350 μm, and hchamber = 0.5 – 1 μm). In case of an equal pressure difference Δp between the inlet and outlet of both flow channels or equal volume flow rates Qchannel in both channels, a diffusional interface between the main flow channels and bypasses with the rectangular microchamber is created. The approximately 10-fold larger height of the flow channels in comparison to the bypasses and microchamber generates a volume flow reduction of several orders of magnitude, and thus, diffusion is the dominating transport mechanism for molecules in the microchamber. Figure 1B shows the distribution of flow velocity v in the microfluidic device calculated by finite element simulations. Based on these simulations, we find a reduction of the volume flow rate of Qchannel/Qbypass ≈ 6250 (or a reduction of the mean flow velocity of ≈ 250) between the flow channels and the bypasses and a reduction of Qchannel/Qchamber ≈ 2.1 × 10⁶ ( ≈ 1.7 × 10⁵) between the flow channels and the center position of the microchamber, using an input volume flow rate of the channels, Qchannel = 0.25 nL/s .
In order to generate a linear concentration gradient across the rectangular microchamber, one flow channel served as the concentration source through addition of the gradient-forming substance to the solution, while the second flow channel served as the concentration sink (Figure 1C). Finite element simulations of the linear concentration gradient are shown in Figure 2B. Using an aqueous fluorescein solution as the concentration source and an aqueous solution without fluorescein as the sink, a stable fluorescein gradient was established across the microchamber in x-direction (Figure 2C), assuming that the fluorescence intensity increases linearly with the concentration of fluorescein. Important for the stability of flow-free and steady-state gradients is a good control of the volume flow rates (Qchannel1 = Qchannel2) or of the pressure drops (Δpchannel1 = Δpchannel2) in both flow channels. The control of the flow can be facilitated by adding pressure adjustment points upstream of the microchambers, where the two flow channels come in contact for a short distance. At these sites, which are shown in the image of the microdevice master in Figure 2A, the pressures of the two flow channels are equilibrated, making the adjustment of the two individual solution flows (source and sink) more amenable.
The time of achieving a fully developed steady-state gradient of fluorescein can be estimated by using , with x = 430 μm, the microchamber length including the bypasses, and the diffusion coefficient of fluorescein, Dfluo = 425 μm2/s (Culbertson et al., 2002). A gradient is fully developed in tfluo ≈ 215 s. However, a gradient with around 90% of the final steady-state gradient concentrations can be achieved in less than .
In the following, we study the polymerization of actin monomers into filaments in a KCl gradient and the bundling of actin filaments (F-actin) in a gradient of Mg2+. Due to the smaller size of these ions in comparison to fluorescein, we expect a faster evolution of the concentration gradients with for K+ and for Mg2+ (Cussler, 1997).
Actin Polymerization in KCl Gradients
In vitro actin polymerization can be initiated by adding 50 mM KCl to a buffered solution of monomeric actin (Deshpande and Pfohl, 2012). To address the polymerization of actin in KCl gradients, we aimed to form a linear steady-state gradient ranging from 0 to 100 mM KCl. The channel operating as the KCl source was flushed with a solution of actin monomers (3 μM) containing 100 mM KCl, whereas the second flow channel was flushed with a solution containing only actin (3 μM) to operate as a sink. Under these conditions, a linear KCl gradient could be generated with a concentration of about 100 mM KCl at the interface between the bypass and microchamber at the source side and about 0 mM at the interface between the bypass and microchamber at the sink side, with approximately 50 mM KCl at the center of the microchamber. Because the time course of actin polymerization is much slower than that of establishing a stable KCl gradient, the entire polymerization process takes place in a linear KCl gradient across the microchamber. Using fluorescently labeled actin, the polymerization process can be directly followed by fluorescence microscopy. After a few hours, a stationary state of partially entangled polymerized actin filaments was reached. The impact of the KCl gradient on the assembly of entangled actin filaments is shown in Figure 3. Actin polymerization occurs, when the concentration of unassembled subunits is above a critical concentration, which is about 0.1 μM in 100 mM KCl as well as in vivo (Lodish et al., 2000). Thus, along a steady-state KCl gradient in the chamber, the monomer concentration decreases from 3 to 0.1 μM with increasing KCl while the polymer density increases.
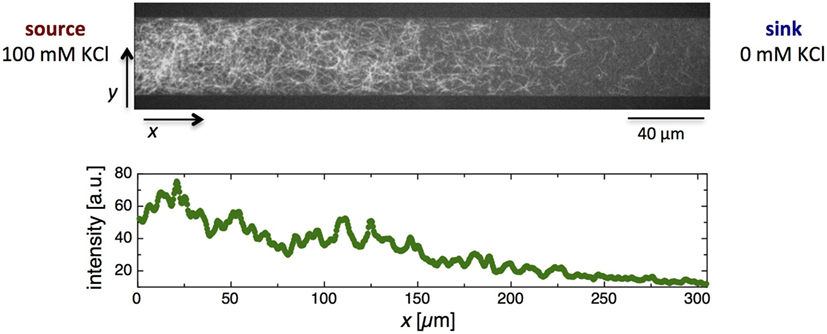
Figure 3. Fluorescence micrograph of actin filament assembly in a KCl gradient over a rectangular microchannel (top panel). The density of the entangled actin filaments decreases with decreasing KCl concentration. In the bottom panel, the decrease in F-actin density is represented as a plot of the averaged fluorescence intensity against the distance from the source, x.
A transition zone from a semi-dilute entangled filament solution defined by the number density of actin filaments , with the length l of the filaments, to a dilute solution defined by (Boal, 2002) was observed at a distance of about 3/4 of the microchamber length (x ~ 260 μm) away from the source, which corresponds to a concentration of ~25 mM KCl. Semi-dilute solutions of entangled actin filaments show distinct viscoelastic properties. At intermediate strain frequencies, which represent the time scales that are significant in cells, solutions of semi-dilute filaments behave like networks of temporarily fixed links (Xu et al., 1998; Boal, 2002). In this frequency range, the storage modulus G′ shows a plateau with , where kB is the Boltzmann’s constant and T the absolute temperature (Boal, 2002). We find an almost linear decrease of the density of actin filaments ρ from 100 to 25 mM KCl (x ~ 0–260 μm, Figure 3), ρ ∝ cKCl. Using the aforementioned relation for G′, are proportionality of in this regime should be expected. In the dilute regime , actin solutions show an almost purely viscous behavior with a viscosity close to the solvent (Boal, 2002).
Formation of Networks of F-Actin Bundles in Mg2+ Gradients
Multivalent cations in the millimolar range, such as Mg2+, cross-link F-actin by compensating the electrostatic repulsion between filaments, which are overall negatively charged with a linear charge density of 4 e−/nm. Beyond a critical multivalent cation concentration, a sharp bundling transition of filaments occurs (Tang and Janmey, 1996; Deshpande and Pfohl, 2015). In order to form an Mg2+ cross-linking gradient along the microchamber with entangled filaments, Mg2+ was added to the flushing solution of one of the flow channels and not to the other. The formation of a network of bundled F-actin in a linear Mg2+ gradient is shown in Figure 4A. In the first step, an anisotropic, partially entangled F-actin solution was formed in a linear KCl gradient (~0–100 mM KCl) over several hours. Subsequently, a linear Mg2+ (~0–50 mM Mg2+) was generated. For the final steady state (Figure 4A), one flow channel was flushed with an actin solution (3 μM) containing 100 mM KCl and 50 mM Mg2+ to operate as KCl and Mg2+ source, and the second flow channel was only flushed with an actin solution (3 μM) without additional salts. In comparison to the F-actin polymerization which takes several hours under the experimental conditions used, actin filaments undergo a fast bundling transition within a few minutes. Subsequently, bundles fuse together to give rise to a network of bundled F-actin.
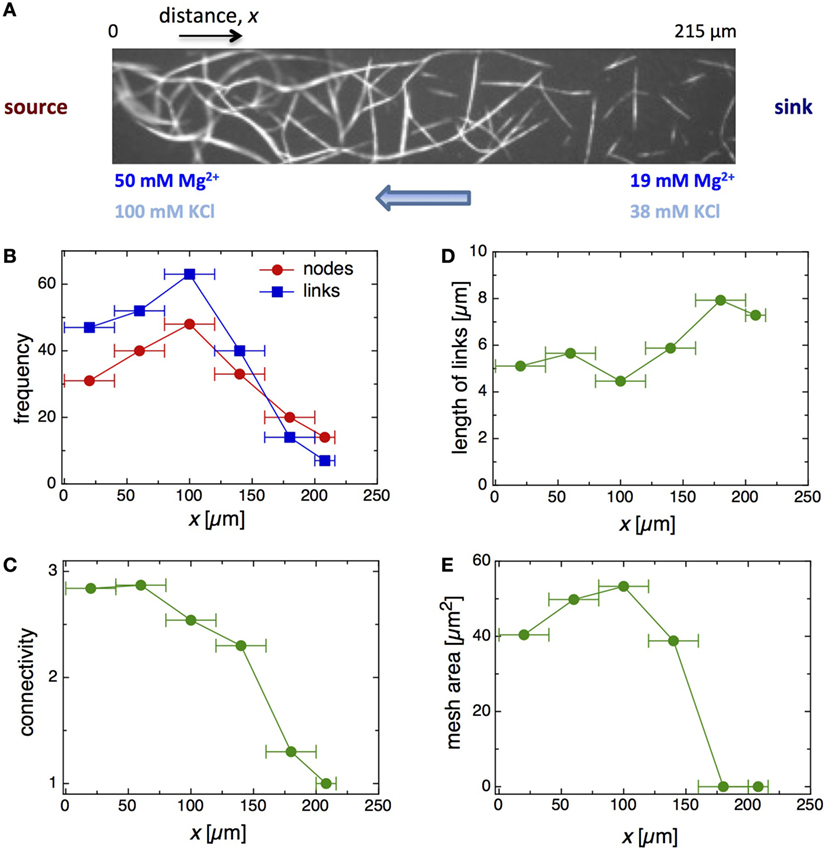
Figure 4. (A) Fluorescence micrograph of the formation of an Mg2+-induced F-actin bundle network in a double gradient of KCl and Mg2+. Several network properties are plotted against the x-position along the concentration gradients including the frequency of nodes and links (B), the network connectivity (C), the length of links (D), and the mesh area (E).
We found two distinct regimes of the bundled F-actin along the Mg2+ concentration gradient. At the source side of the microchamber, a single network of actin bundles emerged in response to the bundling agent. The actin filaments were frequently shared between two or more links of the network, aided by the close proximity of the entangled filaments. Adjacent to the percolated network toward the sink side of the microchamber, isolated and non-interconnected bundles were detected. This behavior appeared to be related to the decrease of filament density resulting from the decrease of the KCl concentration rather than the decrease of the Mg2+ concentration.
To gain more insight into the bundling of F-actin in Mg2+ gradients, the network properties along the concentration gradient were further characterized. We analyzed the nature of links, nodes, and meshes of the network depending on their position in the microchamber and thus the gradient. The number of links and nodes versus the x-position of the microchamber are shown in Figure 4B. The link and node numbers of the network are slightly increasing from the beginning of the chamber at x ~ 20 μm to position x ~ 100 μm, followed by a strong decrease at larger distance. Up to x ~ 140 μm, the number of links is greater than the number of nodes, but switches at x ≥ 180 μm. Conceivably, this observation is attributed to the poorly evolved network and the appearance of isolated bundles at these positions. The connectivity obtained and the number of incident links on a specific node (Figure 4C) further supported this notion. For the network developed, we found an average connectivity of about 3 (Deshpande and Pfohl, 2015) that slightly decreased with increasing x. In addition, we observed a jump to an average connectivity value of about 1 at x ~ 180 μm, which correlates to the presence of isolated bundles. The average link lengths within the network were approximately 5 μm (Figure 4D), and the average mesh areas between 40 and 60 μm2 (Figure 4E). In comparison, the average link length of isolated bundles is 8 μm. In regions with only isolated bundles, the average mesh areas were obviously 0.
Overall, in the gradient of KCl and Mg2+, a single percolated network of F-actin bundles was formed that spread on the source side to an x-position of about 160 μm in the microchamber, followed by a region of isolated bundles that tapered off toward the sink side. For the network between x ~ 0–120 μm, we found almost the same network properties – average number of length and nodes, connectivity, link length, and mesh area – indicating that the entangled filaments form a homogenous network of F-actin bundles in this region. In view of the decrease in filament density associated with the KCl gradient with no bundling agent, this result is astonishing (Figure 3). Only at the border to the transition zone to the isolated bundle phase was the network connected looser, with more open link ends that lead to a reduced connectivity.
In order to elucidate the mechanical behavior of the network of F-actin bundles, the amount of filaments inside the bundles was estimated on the basis of their fluorescence intensity profiles. As shown in Figure 5A, the grayscale histogram of the fluorescence micrograph of the network (Figure 4A) was plotted and analyzed. Higher grayscale values correspond to thicker bundles, which are composed of a higher number of filaments. To characterize the filament distribution within the network, we have defined four different grayscale intervals (gray, red, blue, and green areas in plot Figure 5A), which represent a different bundle thickness or amount of filaments. To translate the grayscale value into numbers of filaments, a linear increase of the fluorescent intensities with the number of filaments per bundle was assumed (Deshpande and Pfohl, 2015). The selected intervals correspond to a number of filaments of ngray ~ 2–6, nred ~ 6–11, nblue ~ 11–16, and . To illustrate this analysis, the network of F-actin bundles was color coded according to the number of filaments in the network links (Figure 5B). The distribution of the four classes of bundle thickness (i.e., number of filaments) in the network links versus the spatial position x is shown in Figure 5C. Up to x ~120 μm, no major differences between the relative frequencies of red, blue, and green bundles (20–25%) or for the gray bundles (25–40%) were observed. However, fewer thicker (red, blue, and green) bundles and an increase in thinner bundles (gray) were observed in the network close to the transition zone (x ~ 120–160 μm). The isolated bundles (x ≳ 160 μm) were much thinner than the bundles in the network and consist primarily of gray bundles.
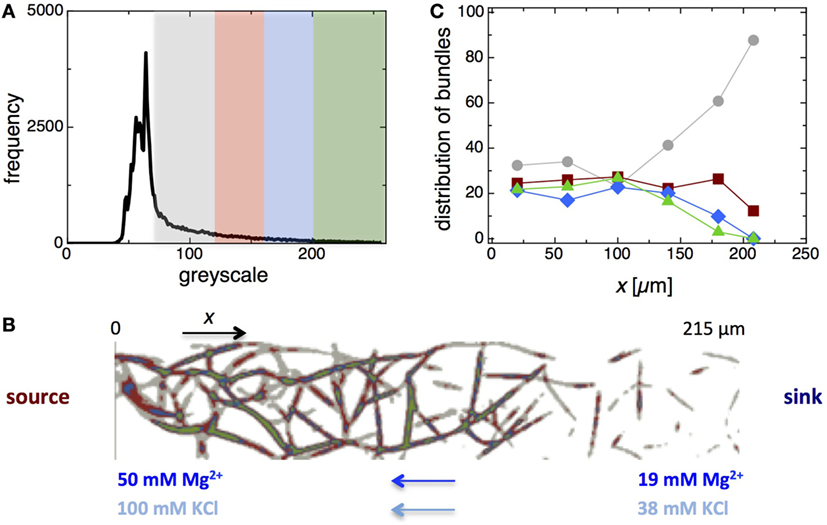
Figure 5. Analysis of the distribution of bundle thickness within the F-actin bundle network. (A) Frequency histogram of grayscale values of the fluorescence micrograph of the F-actin bundle network (Figure 4A). The grayscale is divided into four segments that represent bundles of different thickness – gray represents bundles with filament numbers of ngray ~ 2–6, red with nred ~ 6–11, blue with nblue ~ 11–16, and green with ngreen ≳ 16. (B) Fluorescence micrograph of the bundle network colorized according to the amount of filaments within the network links. (C) Distribution of four classes of bundle thickness, i.e., number of filaments, in the network links versus the distance, x from the source of the double gradient.
In the range x ~ 0–120 μm, the network exhibited not only similar properties but also a comparable distribution of filament numbers within the bundles, indicating that the composition and the mechanical properties of this network section were homogenous. Considering the gradual decrease of filament density prior to bundling (in the absence of bundle inducing Mg2+), this result is surprising. However, during the bundling and fusion processes involved in network formation, a redistribution of the filaments occurs. At the length scale of a few tenths of a micrometer, the Brownian motion of semiflexible filaments as well as of the partially formed and fused bundles may be fast enough to support this reorganization of F-actin within network section. In the transition region (x ~ 120–160 μm), the links within the networks are becoming thinner as indicated by a relative increase of the thinner (gray) bundles and a decrease of the number of thicker bundles.
Describing the links in the network as homogenous rods made up of a definite number n of actin filaments, the elastic properties of the bundles can be determined from the bending rigidity κn, a parameter describing the resistance of a rod to a bending force. The bending rigidity κ of a single actin filament can be calculated from its persistence length LP ≈ 13 μm (Köster and Pfohl, 2009) by κ = LPkBT ≈ 5.3 × 10⁻²⁶ Nm2 with the Boltzmann’s constant kB and the temperature T. To describe the bending of a bundle consisting of n filaments, two limiting types of F-actin bundle bending can be distinguished. In the decoupled case, bending shows no interfilament shearing as the interjacent crosslinks do not resist shear. The bending rigidity of a bundle κn depends linearly on the number of filaments n, κn = n⋅κ. In the fully coupled case, crosslinks strongly resist shear and show a quadratic dependence, similar to the bending of a homogenous mechanical beam, κn = n2⋅κ. Interestingly, Ca2+-induced bundles show a partly coupled behavior, κn = n1.3⋅κ, most probably due to an optimization of the charge distribution inside the bundles (Steinhauser, 2008). Since the flexural rigidity of Ca2+- and Mg2+-induced bundles are very similar (Isambert et al., 1995; Scharf and Newman, 1995) and Mg2+ ions bundle filaments by counter-ion condensation as well, we presume the same partly coupled case for Mg2+-induced bundles as for Ca2+-induced bundles. Therefore, the bending rigidity of bundles within the network can be calculated by . The bundles of the network in the region x ~ 0–120 μm have an average bending rigidity of and in the transition region to isolated bundles (x ~ 120–160 μm) of .
Gradient Formation across Sequential Microchambers
Connecting the two bypasses of the flow channels by a series of five square microchambers, each with a side length of 40 μm, generates an interesting variation of the microfluidic gradient device (Figure 6). This design should produce a nearly step-like gradient profile with a steep gradient in the narrow channels connecting the microchambers and an almost constant gradient across individual microchambers. The realization of a steady-state, step-like change of concentrations resulting from a sequence of microchambers is confirmed by FEM simulations (Figure 6A) as well as by fluorescein experiments, where an aqueous fluorescein solution flowing in one of the flow channels served as a concentration source and an aqueous solution without fluorescein in the second flow channel as a sink (Figure 6B).
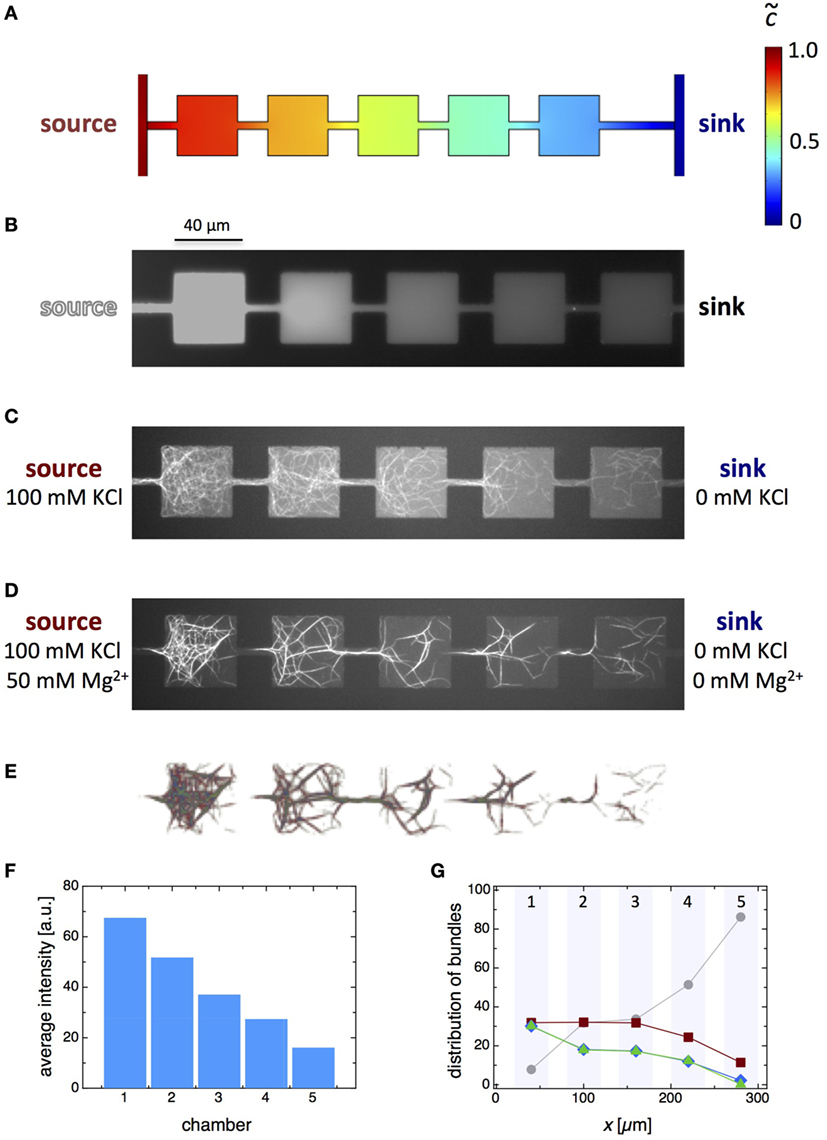
Figure 6. Experimental realization of microfluidic gradient formation over consecutive microchambers. (A) Simulations reveal a step-like gradient profile with a steep gradient in the narrow connecting channels and an extremely weak gradient across individual squared microchambers. (B) The step-like gradient was experimentally verified by using an aqueous fluorescein solution as a source. (C) Actin polymerization in a KCl gradient over a series of five connected square microchambers shows a decreased amount of filaments from one microchamber to the next from the source to the sink. (D) Formation of bundled F-actin networks in a double gradient of KCl and Mg2+. (E) Fluorescence micrograph of the bundle network colorized according to the amount of filaments within the network links (gray represents bundles with ngray ~ 2–6, red with nred ~ 6–11, blue with nblue ~ 11–16, and green with ngreen ≳ 16). (F) Averaged fluorescence intensity plotted against the chamber number, where chamber 1 is closest to the source and chamber 5 is closest to the sink. The average fluorescence intensity is proportional to the overall number of filaments in a microchamber. (G) Distribution of four classes of bundle thickness, i.e., number of filaments, in the network links versus the microchamber number.
A corresponding microdevice was used to examine the effects of a KCl gradient over the sequentially connected chambers on actin polymerization. One flow channel was flushed with a freshly prepared actin solution of (3 μM) containing 100 mM KCl as the KCl source, while a sink was provided by flushing the other flow channel with a corresponding actin solution (3 μM) without KCl. The fluorescence micrograph at steady state (Figure 6C) revealed a decrease in the amount of filaments in consecutive microchambers from the source to the sink. However, contrary to what the simulations and fluorescein experiments led to expect, the distribution of filaments within individual microchambers was not always homogeneous. Conceivably, this effect might emerge from the trapping and entrenchment of filaments in the narrow connection channels (Swank et al., 2016), which was most evident at the higher KCl concentrations.
The formation of an additional Mg2+ cross-linker gradient over the consecutive microchambers is shown in Figure 6D. Mg2+ was added to the actin solution in the source flow channel but not to the sink flow channel. Under these conditions, the actin filaments underwent a bundling transition and formed bundles that ultimately fuse to give rise to a network of bundled F-actin. The density of the network and the network properties are strongly related to the amount of individual filaments that were found in the microchambers before the addition of Mg2+. In the microchamber closest to the source (chamber 1), i.e., with the highest concentration of Mg2+ (~40 mM), the densest network with the smallest mesh size, the most links and nodes, and thickest bundles were observed. Moving from one microchamber to the next toward the sink (from chambers 1 to 5), more open network structures with bigger mesh sizes, less links and nodes, and thinner bundles were obtained. In the microchamber closest to the sink with the lowest Mg2+ concentration (~10 mM; chamber 5) a loose collection of bundles rather than a percolated network was found. Analyzing the overall filament number and the bundle thickness distribution (Figure 6E) in successive microchambers supports these observations. An almost linear decrease of the averaged fluorescence intensity, which is proportional to the overall number of filaments, from chambers 1 to 5 was obtained (Figure 6F). In addition, the thickest bundles within the networks are found in chamber 1, whereas the thickness and thickness distribution decreased with increasing chamber number, i.e., decreasing Mg2+ concentration (Figure 6G). Trapping and entrenchment of actin filaments in the narrow connection channels led to the accumulation of F-actin bundles at these sites independent of the Mg2+ concentration. In contrast to the experiments in the long rectangular microchamber with a linear Mg2+ gradient (Figures 4 and 5), experiments with the sequential microchambers did not reveal a redistribution of actin filaments during the bundling process. Instead, the geometric partitioning produced a cross-linker gradient that resulted in distinct assembly levels of bundled F-actin networks from one chamber to the next.
Conclusion
We successfully developed a microfluidic-based method to generate steady-state and flow-free gradients for analyzing polymerization, bundling, and network formation of the cytoskeletal protein actin under an unprecedented range of experimental conditions. Using multi-height microfluidic devices with corresponding geometrical designs, linear and step-like gradients for polymerizing and cross-linking actin filaments were established. We analyzed the density distribution of actin filaments from semi-dilute to dilute polymer solutions that were formed in KCl gradients. Moreover, the ample and heterogeneous properties of actin networks that emerge in Mg2+ gradients at cross-linking concentrations could be determined by analyzing the space-dependent connectivity, mesh sizes, and distributions of nodes, links, and link lengths. Additionally, the local bending rigidity of the network as well as the overall elastic behavior could be estimated from the analysis of the bundle thicknesses and network geometry. Moreover, we found a partial redistribution of actin filaments during the bundling process in a linear double gradient of KCl and Mg2+, which is suppressed in step-like gradients achieved by geometric portioning of the microchamber.
This powerful method can be applied to many other experiments involving anisotropic cytoskeletal materials. Owing to the extensive flexibility and simplicity of the microfluidic setup, the impact of material gradients that vary over time, as well as of many other manipulations including the effects of components that associate with the networks can be examined. Furthermore, by adding colloidal particles, the mechanical properties of the cytoskeletal assemblies that are formed in the respective gradients might be directly measured by microrheology (Gardel et al., 2003; Lee et al., 2010). The technique of investigating materials in gradients is not limited to components of the cytoskeleton but might be applicable to studies on other soft biological, synthetic, or hybrid materials (Wu et al., 2011). The combination of microfluidic gradients with advanced microscopy, spectromicroscopy, or X-ray nanoscattering, and imaging (Köster and Pfohl, 2012) extends the potential of this technique even further.
Author Contributions
NS, C-AS, and TP designed the experiments; NS and FH performed the experiments; NS, FH, C-AS, and TP analyzed data; and NS, C-AS, and TP wrote the manuscript.
Conflict of Interest Statement
The authors declare that the research was conducted in the absence of any commercial or financial relationships that could be construed as a potential conflict of interest.
Acknowledgments
We thank Stefan Arnold and Joël Wahl for their experimental support at different stages of the project, and Zoe Swank and Siddharth Deshpande for fruitful discussions. Financial support by the Swiss National Science Foundation (SNF_ 200020_141270) and the NCCR Molecular Systems Engineering is gratefully acknowledged.
References
Atencia, J., Morrow, J., and Locascio, L. E. (2009). The microfluidic palette: a diffusive gradient generator with spatio-temporal control. Lab. Chip 9, 2707–2714. doi: 10.1039/b902113b
Bausch, A. R., and Kroy, K. (2006). A bottom-up approach to cell mechanics. Nat. Phys. 2, 231–238. doi:10.1038/nphys260
Berthier, E., and Beebe, D. J. (2014). Gradient generation platforms: new directions for an established microfluidic technology. Lab. Chip 14, 3241–3247. doi:10.1039/c4lc00448e
Chung, B. G., and Choo, J. (2010). Microfluidic gradient platforms for controlling cellular behavior. Electrophoresis 31, 3014–3027. doi:10.1002/elps.201000137
Culbertson, C. T., Jacobson, S. C., and Ramsey, J. M. (2002). Diffusion coefficient measurements in microfluidic devices. Talanta 56, 365–373. doi:10.1016/S0039-9140(01)00602-6
Cussler, E. L. (1997). Diffusion Mass Transfer in Fluid Systems. Cambridge: Cambridge University Press, 143.
Deshpande, S., and Pfohl, T. (2012). Hierarchical self-assembly of actin in micro-confinements using microfluidics. Biomicrofluidics 6, 034120. doi:10.1063/1.4752245
Deshpande, S., and Pfohl, T. (2015). Real-time dynamics of emerging actin networks in cell-mimicking compartments. PLoS ONE 10:e0116521. doi:10.1371/journal.pone.0116521
Du, Y., Shim, J., Vidula, M., Hancock, M. J., Lo, E., Chung, B. G., et al. (2009). Rapid generation of spatially and temporally controllable long-range concentration gradients in a microfluidic device. Lab. Chip 9, 761–767. doi:10.1039/b815990d
Gardel, M. L., Valentine, M. T., Crocker, J. C., Bausch, A. R., and Weitz, D. A. (2003). Microrheology of entangled F-actin solutions. Phys. Rev. Lett. 91, 158302. doi:10.1103/PhysRevLett.91.158302
Hirst, L. S., Parker, E. R., Abu-Samah, Z., Li, Y., Pynn, R., MacDonald, N. C., et al. (2005). Microchannel systems in titanium and silicon for structural and mechanical studies of aligned protein self-assemblies. Langmuir 21, 3910–3914. doi:10.1021/la0476175
Huang, Y., Agrawal, B., Sun, D., Kuo, J. S., and Williams, J. C. (2011). Microfluidics-based devices: new tools for studying cancer and cancer stem cell migration. Biomicrofluidics 5, 013412. doi:10.1063/1.3555195
Huber, F., Schnauß, J., Rönicke, S., Rauch, P., Müller, K., Fütterer, C., et al. (2013). Emergent complexity of the cytoskeleton: from single filaments to tissue. Adv. Phys. 62, 1–112. doi:10.1080/00018732.2013.771509
Isambert, H., Venier, P., Maggs, A. C., Fattoum, A., Kassab, R., Pantaloni, D., et al. (1995). Flexibility of actin filaments derived from thermal fluctuations. J. Biol. Chem. 270, 11437–11444. doi:10.1074/jbc.270.19.11437
Janmey, P. A., Slochower, D. R., Wang, Y.-H., Wen, Q., and Cebers, A. (2014). Polyelectrolyte properties of filamentous biopolymers and their consequences in biological fluids. Soft Matter 10, 1439–1449. doi:10.1039/c3sm50854d
Kim, S., Kim, H. J., and Jeon, N. L. (2010). Biological applications of microfluidic gradient devices. Integr. Biol. 2, 584–603. doi:10.1039/c0ib00055h
Köster, S., and Pfohl, T. (2009). An in vitro model system for cytoskeletal confinement. Cell Motil. Cytoskeleton 66, 771–776. doi:10.1002/cm.20336
Köster, S., and Pfohl, T. (2012). X-ray studies of biological matter in microfluidic environments. Mod. Phys. Lett. B 26, 1230018. doi:10.1142/S0217984912300189
Lee, H., Ferrer, J. M., Nakamura, F., Lang, M. J., and Kamm, R. D. (2010). Passive and active microrheology for cross-linked F-actin networks. Acta Biomater. 6, 1207–1218. doi:10.1016/j.actbio.2009.10.044
Lodish, H., Berk, A., Zipursky, S. L., Matsudaira, P., Baltimore, D., and Darnell, J.(2000). Molecular Cell Biology. New York: W. H. Freeman.
Scharf, R. E., and Newman, J. (1995). Mg- and Ca-actin filaments appear virtually identical in steady-state as determined by dynamic light scattering. Biochim. Biophys. Acta 1253, 129–132. doi:10.1016/0167-4838(95)00186-5
Soares e Silva, M., Alvarado, J., Nguyen, J., Georgoulia, N., Mulder, B. M., and Koenderink, G. H. (2011). Self-organized patterns of actin filaments in cell-sized confinement. Soft Matter 7, 10631–10641. doi:10.1039/c1sm06060k
Steinhauser, D. (2008). Actin Filaments and Bundles in Flow. Ph.D. thesis, Georg-August University of Göttingen, Göttingen, 104.
Steinhauser, D., Köster, S., and Pfohl, T. (2012). Mobility gradient induces cross-streamline migration of semiflexible polymers. ACS Macro. Lett. 1, 541–545. doi:10.1021/mz3000539
Swank, Z., Deshpande, S., and Pfohl, T. (2016). Trapping, entrainment and synchronization of semiflexible polymers in narrow, asymmetric confinements. Soft Matter 12, 87–92. doi:10.1039/c5sm02304a
Tang, J. X., and Janmey, P. A. (1996). The polyelectrolyte nature of F-actin and the mechanism of actin bundle formation. J. Biol. Chem. 271, 8556–8563. doi:10.1074/jbc.271.15.8556
Toh, A. G. G., Wang, Z. P., Yang, C., and Nguyen, N.-T. (2014). Engineering microfluidic concentration gradient generators for biological applications. Microfluid. Nanofluid. 16, 1–18. doi:10.1007/s10404-013-1236-3
Wu, X., Wu, J., Li, H., Legler, D. F., Marshall, A. J., and Lin, F. (2015). Analysis of CCR7 mediated T cell transfectant migration using a microfluidic gradient generator. J. Immunol. Methods 419, 9–17. doi:10.1016/j.jim.2015.02.008
Wu, Z. L., Kurokawa, T., Sawada, D., Hu, J., Furukawa, H., and Gong, J. P. (2011). Anisotropic hydrogel from complexation-driven reorientation of semirigid polyanion at Ca2+ diffusion flux front. Macromolecules 44, 3535–3541. doi:10.1021/ma2001228
Xu, J., Palmer, A., and Wirtz, D. (1998). Rheology and microrheology of semiflexible polymer solutions: actin filament networks. Macromolecules 31, 6486–6492. doi:10.1021/ma9717754
Keywords: microfluidics, filaments, bundling, heterogeneous networks, FEM simulations
Citation: Strelnikova N, Herren F, Schoenenberger C-A and Pfohl T (2016) Formation of Actin Networks in Microfluidic Concentration Gradients. Front. Mater. 3:20. doi: 10.3389/fmats.2016.00020
Received: 04 January 2016; Accepted: 15 April 2016;
Published: 02 May 2016
Edited by:
Anupam Sengupta, Massachusetts Institute of Technology, USAReviewed by:
Tamal Das, Max Planck Institute for Intelligent Systems, GermanyYael Roichman, Tel Aviv University, Israel
Copyright: © 2016 Strelnikova, Herren, Schoenenberger and Pfohl. This is an open-access article distributed under the terms of the Creative Commons Attribution License (CC BY). The use, distribution or reproduction in other forums is permitted, provided the original author(s) or licensor are credited and that the original publication in this journal is cited, in accordance with accepted academic practice. No use, distribution or reproduction is permitted which does not comply with these terms.
*Correspondence: Thomas Pfohl, thomas.pfohl69@gmail.com