Biomass Waste Carbon Materials as adsorbents for CO2 Capture under Post-Combustion Conditions
 Elisa M. Calvo-Muñoz
 Francisco J. García-Mateos
 Juana M. Rosas
 José Rodríguez-Mirasol*
  Tomás Cordero
- Departamento de Ingeniería Química, Universidad de Málaga, Andalucía Tech, Málaga, Spain
A series of porous carbon materials obtained from biomass waste have been synthesized, with different morphologies and structural properties, and evaluated as potential adsorbents for CO2 capture in post-combustion conditions. These carbon materials present CO2 adsorption capacities, at 25°C and 101.3 kPa, comparable to those obtained by other complex carbon or inorganic materials. Furthermore, CO2 uptakes under these conditions can be well correlated with the narrow micropore volume, derived from the CO2 adsorption data at 0°C . In contrast, CO2 adsorption capacities at 25°C and 15 kPa are more related to only pores of sizes lower than 0.7 nm. The capacity values obtained in column adsorption experiments were really promising. An activated carbon fiber obtained from Alcell lignin, FCL, presented a capacity value of 1.3 mmol/g (5.7%wt). Moreover, the adsorption capacity of this carbon fiber was totally recovered in a very fast desorption cycle at the same operation temperature and total pressure and, therefore, without any additional energy requirement. Thus, these results suggest that the biomass waste used in this work could be successfully valorized as efficient CO2 adsorbent, under post-combustion conditions, showing excellent regeneration performance.
Introduction
The increase of climate-related natural disasters or the fact that since 2000, 14 years are among the 15 hottest ever registered,1 have reinforced the unequivocal need of diminishing greenhouse gases emissions, particularly those of CO2 [IPCC (Intergovernmental Panel on Climate Change), 2007; IEA, 2013], and is leading governments to develop a series of roadmaps, which aim at moving forward to a low carbon economy. Nevertheless, the current and future continuously growing energy demands along with the immaturity of most alternative technologies make it evident that fossil fuels will continue to be used in many industrial processes (European Commission, 2011). Within this framework, carbon capture and storage (CCS) has been identified as one of the key technologies that could contribute in a greater degree to reach the CO2 emission reduction targets [IPCC (Intergovernmental Panel on Climate Change), 2005; European Commission, 2013; IEA, 2013].
In the mid-term, post-combustion CCS and, especially post-combustion using adsorption over porous solids seems to be called to play an important role. Post-combustion CCS can be integrated in an easier way into existing facilities and is more flexible with regard to its control and to the plant maintenance [Figueroa et al., 2008; Olajire, 2010; Finkenrath, 2011; IEA and UNIDO (United Nations Industrial Development Organizations, 2011)]. In contrast to the currently preferred absorption technologies (mainly amine scrubbing based systems) which still present important drawbacks related to sorbent regeneration and corrosion issues (GCCSI, 2012; Yan et al., 2012), adsorption has shown a great potential to significantly cut down the overall costs by providing substantial energy savings and reduction of the equipment sizes (Ho et al., 2008; Radosz et al., 2008; Davidson, 2009). Main challenges of post-combustion applications arise from dealing with large flue gas volumes, low CO2 partial pressure, and common presence of water vapor in the outlet stream (Sreenivasulu et al., 2015). Therefore, appropriate adsorbents must present sufficient adsorption capacity, high CO2 selectivity, adequate density and hardness, low abrasion index, and good stability in moisture conditions. Besides, availability, low cost, and easy of regeneration are key factors to ensure the feasibility of the overall adsorption process (Plaza et al., 2010, 2014; Samanta et al., 2012; Lee and Park, 2015; Ben-Mansour et al., 2016).
Carbon materials have been extensively employed for adsorption applications in many areas due to their high specific surface areas, remarkable mechanical, thermal, and chemical stabilities, and relatively easy to tailor porous structure and chemical surface. Focusing on CCS, some outstanding properties make them advantageous over other proposed materials, such as zeolites or MOFs: low heat of adsorption (easy of regeneration), hydrophobic character (low sensitivity to moisture conditions), higher CO2 uptake at high pressure or the possibility of been obtained through low-cost processes from different types of biomass and lignocellulosic waste (Choi et al., 2009; Plaza et al., 2009; Olivares-Marín and Maroto-Valer, 2012; Parshetti et al., 2015; Rashidi and Yusup, 2016). On the other hand, activated carbon materials are usually adversely compared in terms of CO2 adsorption capacity and/or selectivity. Nevertheless, it has been proven that adsorption capacity and selectivity toward CO2 are strongly dependent on the porous structure and chemical surface of the adsorbent (Ruthven, 1984; Marsh and Rodríguez-Reinoso, 2006; Shafeeyan et al., 2010; Gargiulo et al., 2014). Specifically, it has been reported that at low CO2 partial pressures and room temperature, CO2 adsorption capacity is intrinsically related to micropores, although some discrepancies can be found in the literature. Maroto-Valer et al. (2005) reported that pores lower than five times the size of CO2 molecule (0.209 nm) maximize CO2 adsorption; therefore, they proposed pores lower than 1 nm. Martín et al. (2010) indicated that micropore volumes coming from pores below 0.6 nm present the highest CO2 retention capacities. Sevilla et al. (2011) proposed that the amount of CO2 adsorbed depends mainly on the population of narrow micropores (<1 nm), which make a considerable contribution to CO2 capture. More recently in 2013, these authors pointed out that the adsorption of CO2 by non-functionalized porous carbons is mainly determined by the volume of the micropores with only a size below 0.8 nm (Sevilla et al., 2013). Some studies related to the study of inorganic materials as adsorbents suggested that pore sizes of 0.5 nm are the most adequate for CO2 adsorption (Harlick and Tezel, 2004; Saha et al., 2010). These discrepancies are responsible for the research effort driven on developing advanced carbon adsorbents with optimal porous size distributions to maximize CO2 uptake.
On the other hand, contribution of other properties, i.e., surface chemistry, morphology, particle size, etc., may condition or stimulate the adsorption performance of a specific material and must be taken into account as well. In this line, different types of conformations, sizes, and textures are been considered for CO2 separation, from the broadly used granular activated carbons or monoliths to advanced nanostructured carbon fibers, fabrics, highly hierarchical and ordered molecular sieves, or graphene-based materials (Wahby et al., 2010; Hao et al., 2011; Jiménez et al., 2012; Wei et al., 2012; Srinivas et al., 2014; Balasubramanian and Chowdhury, 2015; Díez et al., 2015).
In light of the above considerations, the present work aims at developing a series of carbonaceous materials to be used as efficient adsorbents for CO2 capture under post-combustion conditions. Samples have been prepared following different synthesis strategies and from diverse raw materials in order to achieve a wide range of physicochemical properties and morphologies, namely, activated carbons, carbon fibers, and carbon cloths. Precursors selected were low cost, highly available, and underutilized residues from the food, wood, papermaking, and textile industries. In an environmentally friendly scenario, their valorization would entail, therefore, additional economic and environmental profits. The CO2 uptake capacities of the materials obtained will be evaluated by equilibrium and dynamic CO2 adsorption experiments. Furthermore, the regeneration potential of the samples will be also analyzed.
Materials and Methods
Precursors and Starting Materials
Six carbon materials were prepared from four types of abundant and economic biomass waste, obtaining granular, fibers, and cloths conformations. Alcell® lignin (Repap Technologies, Inc.) was used as precursor of three of the samples. The type of lignin chosen in this work, Alcell® lignin, contains very small amounts of inorganic materials because of the pulping process (organosolv process) applied, in which the delignifying agent and lignin solvent is ethanol and lignin is obtained as a sulfur-free, fine, brown powder (Pye and Lora, 1991; Rosas et al., 2014). Olive stones provided by Sociedad Cooperativa Andaluza Olivarera y Frutera San Isidro (Periana, Málaga) were also used as raw material. Prior to its use, this precursor was cleaned with deionized water, dried at 100°C, and ground with a roller mill to obtain samples of 400–800 μm particle size. Finally, plywood waste as received and a 100% cotton denim cloth were employed as starting materials. The denim fabric was cut into pieces of approximately 1 cm × 1 cm and activated without any further treatment.
Preparation Method
Stabilized lignin fibers were manufactured by electrospinning of lignin/ethanol following an analogous procedure to that described elsewhere (Lallave et al., 2007; Ruiz-Rosas et al., 2010). The lignin/ethanol solution was flowed at 1 cm3 h−1 for the inner capillary tip of a coaxial electrospinning set up, whereas pure ethanol was fed at 0.2 cm3 h−1 by the outermost one. The tip-to-collector distance was 30 cm and the electrical potential difference was 14 kV (the collector was at −7 kV and the tips at +7 kV). The as-spun fibers were subsequently thermostabilized at a heating rate of 0.08°C/min up to 200°C, keeping the final temperature for 48 h. Then, stabilized lignin fibers were carbonized at 900°C, under N2 flow (150 cm3/min STP). For the sake of comparison, powder lignin was also carbonized at the same previous conditions.
Another series of materials were obtained by chemical activation with phosphoric acid from lignin powder and denim cloth. In each case, the corresponding carbonaceous precursor was impregnated with concentrated commercial H3PO4 (85 wt%, Sigma-Aldrich) at room temperature, using a weight ratio of 2/1 or 0.5/1 (H3PO4/dry precursor), respectively, and dried for 24 h at 60°C. The impregnated samples were then activated at 600 or 900°C, respectively, under continuous N2 flow (150 cm3 STP/min) for 2 h. Finally, they were washed with distilled water at 60°C until neutral pH and negative phosphate analysis in the eluate and dried at 100°C. The resultant activated carbon from lignin was grinded and sieved (100–300 μm).
The last two samples were prepared by physical activation from olive stones and plywood waste, following a procedure described elsewhere (Rodríguez-Mirasol et al., 1993a,b,c; Tancredi et al., 1996). First, both precursors were carbonized at 800°C for 2 h under N2 flow (150 cm3 STP/min). After the carbonization, the sample from olive stones was activated by partial gasification with CO2 flow (150 cm3 STP/min) at 800°C for 7 h. The final activated carbon was also grinded and sieved (100–300 μm). In the case of carbonized plywood waste, the activated carbon preparation process involved two steps. The first one was the activation with water vapor (0.319 cm3 STP/min) for 2 h at 800°C. This activated carbon was dried at 70°C for 24 h, and then the sample was loaded with 20 wt% of Ba applying incipient wetness impregnation with the corresponding aqueous C4H6BaO4 (99%, Sigma-Aldrich) solution. After impregnation, the sample was dried again at 70°C for 24 h. Finally, it was treated under N2 flow (150 cm3 STP/min) at 400°C for 4 h.
All thermal treatments were carried out in a conventional horizontal tubular furnace. Heating (heating rate of 10°C/min, unless specified) and cooling of the samples were reached in N2 flow (150 cm3 STP/min).
Table 1 summarizes notation, activation conditions, and yields for the different samples obtained. In the followed nomenclature, the first letter of each sample name refers to its conformation: granular (G), fiber (F) or cloth (C); the second one is related to the preparation method: carbonization (C) or activation (A); and the last one specifies the precursor used: lignin (L), olive stones (S), wood (W), or denim cloth (D). For instance, GAS is a granular activated carbon obtained from olive stones and FCL are carbonized carbon fibers prepared from lignin. GAWBa is a physically activated carbon impregnated with barium acetate. Letters Ba in this sample name highlight this treatment.
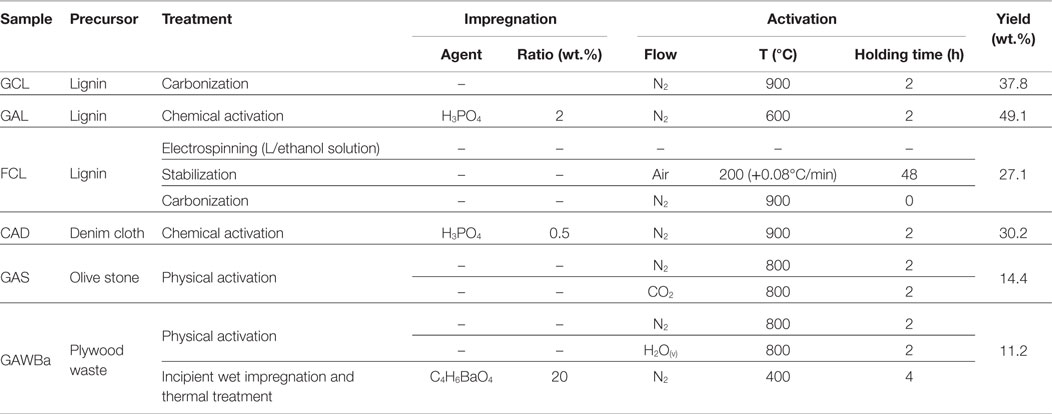
Table 1. Notation and activation conditions of the different carbonaceous materials studied.
Characterization
The structure and texture of the samples were analyzed by scanning electron microscopy (SEM) in a JEOL JSM-840 instrument. Porous structure of all the samples was characterized by N2 adsorption/desorption isotherm at −196°C and CO2 adsorption isotherm at 0°C carried out in an ASAP 2020 model equipment of Michromeritics Instruments Corporation. Samples were previously outgassed during at least 8 h at 150°C. From the N2 adsorption/desorption isotherm, the apparent surface area, ABET, was determined applying the BET equation (Brunauer et al., 1938); the αs method was used to obtain the values of the external surface area , that is, the surface area associated with the non-microporous structure; the micropore volume , and the specific surface area , using the high-resolution method proposed by Kaneko and Ishii (1992), Kaneko et al. (1992), and Kaneko (1994) with a non-porous carbon black sample (Elftex-120) as solid standard (Gregg and Sing, 1982). The mesopore volume, Vmes, was obtained as the difference between the adsorbed volume at a relative pressure of 0.995 and the micropore volume (Kaneko and Ishii, 1992). This methodology covers only the mesopore range between 2 and 40 nm in size, according to the Kelvin equation (Gregg and Sing, 1982). Pore size distribution has been calculated from the N2 adsorption isotherms considering the proposed 2D-NLDFT heterogeneous surface model (Jagiello and Olivier, 2013) and by applying the Solution of Adsorption Integral Equation Using Splines (SAIEUS, available online at http://www.nldft.com/) Software. The porosity of the samples was also analyzed by means of the Dubinin–Radushkevich (D–R) equation (Dubinin, 1960). The specific surface area and micropore volume obtained from the N2 and CO2 characteristic curves are also provided (βN2 = 0.33; βCO2 = 0.35). The average micropore sizes were assessed by application of the empirical correlation proposed by Stoeckli et al. (1990).
Adsorption Equilibrium Studies
To evaluate the potential of the samples as adsorbents for CO2 in post-combustion conditions and to be able to compare the results with others in the literature, CO2 adsorption equilibrium tests were performed following an analog procedure to that previously described for the CO2 adsorption isotherms at 0°C. After outgassing the samples at 150°C, CO2 adsorption isotherms of pure CO2 were obtained at 25°C between 0 and 101.3 kPa.
Equilibrium data were fitted to the adsorption isotherm models of Langmuir (Eq. 1) and Freundlich (Eq. 2) (Ruthven, 1984; Do, 1998):
where CL is the adsorption capacity at the equilibrium assessed by Langmuir equation at each equilibrium pressure P, KL is the equilibrium constant (kPa−1), usually related to the enthalpy of adsorption, and qL is the equilibrium concentration of the adsorbate (mmol g−1) on the solid phase corresponding to a complete coverage (adsorption capacity for a monolayer).
where CF is the adsorption capacity at the equilibrium given by Freundlich equation at each equilibrium pressure P. K (mmol g−1 kPa−1) is the Freundlich isotherm constant, normally considered as an indicator of adsorption capacity. (1/n) accounts for the intensity of adsorption.
Breakthrough Experiments
Dynamic adsorption experiments were also carried out in a fixed bed column consisting of a thermostatized custom quartz tubular reactor (±0.5°C), with internal diameter of 4 mm. The 400 mg of carbon sample were packed between two slices of inert quartz wool inside the column. A previous blank experiment with a quartz wool piece placed as adsorbent was performed in order to discard its ability to adsorb CO2 as well as any dispersive effect downstream from the column exit up to the detector. Outlet concentrations were monitored by mass spectroscopy (Pfeiffer Omnistar GSD-301) and gas chromatography (490 micro-GC equipped with PPQ, 5A molsieve and Wax columns, Agilent).
Before the column test was started, a He flow (purity 99.999%) of 150 cm3 STP/min samples was passed for 2 h at 150°C, in order to eliminate the possible presence of CO2 in the column. Then, breakthrough curves were obtained by using a flow of 50 cm3 STP/min of a binary mixture composed by 15% CO2 and 85% N2 at 25°C from individual streams of N2 (purity 99.999%) and CO2 (purity 99.99%). After saturation, the desorption step was carried out, at the same adsorption temperature, by cutting down the CO2 flow and keeping that of N2 at the same flow rate until no CO2 was detected in the outlet stream. The amount of CO2 adsorbed at equilibrium was estimated by integration of the area above the breakthrough curve. Analogously, the amount of CO2 desorbed was calculated by integration of the area below the desorption curve. Blank experiments were carried out in order to evaluate the possible N2 adsorption under the same operating conditions and negligible N2 adsorption was observed. Regeneration capacity, defined as the capacity of a specific material to be used in subsequent adsorption–desorption cycles, was evaluated by adding a second adsorption step right after 2000 s of desorption at adsorption temperature, time enough to assure complete CO2 desorption.
Results and Discussion
Materials Characterization
The shape, size, and texture of the samples have been characterized by SEM. As an example, Figure 1 shows SEM micrographs of the different morphologies studied. As expected, samples GCL, GAL, GAS, and GAWBa present a granular conformation, with particle sizes mainly ranging from 100 to 150 μm. FCL are electrospun-activated carbon fibers collected as mats with average diameters going from 400 nm to 1 μm. These fibers show smooth surface and neither fusion nor macroscopic defects were observed. The activated carbon cloth also presents a fibrous structure, but in this case, carbon fibers are woven and higher degrees of preferential orientation and packing are achieved. It can be noticed that chemical treatment with phosphoric acid has not destroyed the original structure of the denim fabric, at the impregnation ratio used. The size of these fibers (14–16 μm) is about 15–20 times greater and more uniform than that of the sample FCL, manufactured by electrospinning.
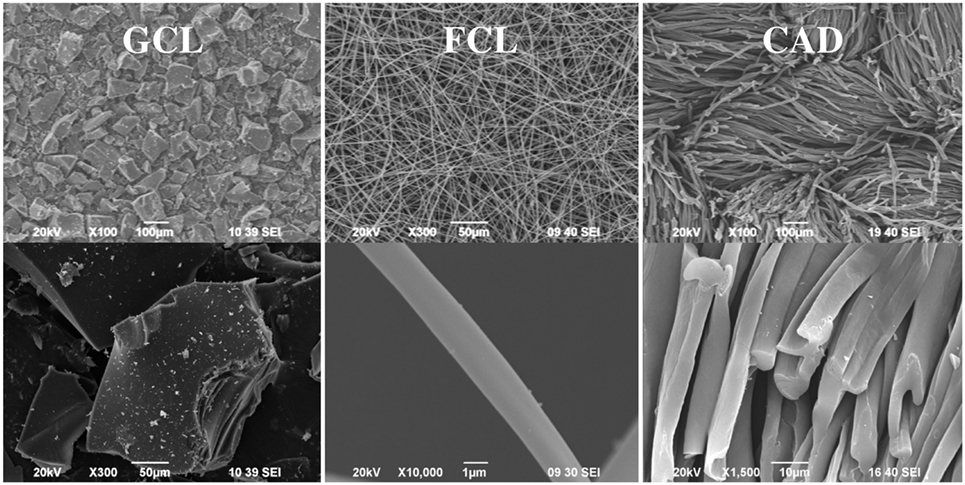
Figure 1. SEM micrographs of GCL, FCL, and CAD.
Figure 2 presents the N2 adsorption–desorption isotherms at −196°C (Figure 2A) and CO2 adsorption isotherms at 0°C (Figure 2B) of the different carbonaceous materials. The different shapes of the curves and amounts of N2 and CO2 adsorbed indicate that materials with a wide range of porous structures have been attained. Sample GCL shows almost negligible N2 adsorption in all range of relative pressures, whereas significant N2 volumes are adsorbed for the rest of materials, decreasing in the order chemically activated cloth and carbon, GAL, and CAD, respectively; physically activated carbons GAS and GAWBa; and just carbonized lignin fiber, FCL. FCL presents a clear type I N2 isotherm, with most of the N2 adsorbed at low relative pressures and an almost horizontal plateau from the very beginning of the curve, which is characteristic of solids with a predominantly homogeneous narrow micropore structure. A small modification of the type I isotherms can be noted for the activated samples CAD and GAS. The more rounded knee of the isotherms at low pressures and the slight increase in the amount of N2 adsorbed with increasing relative pressures reveal a small broadening of the microporous structure. Enlargement of the micropores is much more significant in the activated carbon GAL, as suggested by the considerable adsorption of N2 up to relative pressures of about 0.4. GAS isotherm displays a very narrow hysteresis loop at relative pressures around 0.6, representative of a slight development of narrow mesopores (Figure 2, inset). The mesoporosity contribution is greater in GAWBa, as pointed out by the wider hysteresis cycle.
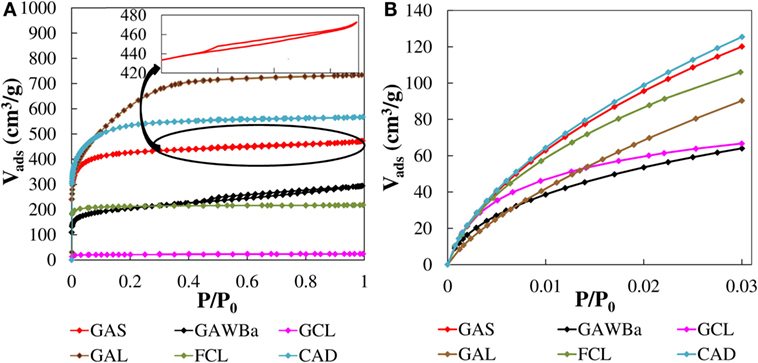
Figure 2. N2 adsorption–desorption isotherms at −196°C (A) and CO2 adsorption isotherms at 0°C (B) of the different carbon materials.
Adsorption of N2 at −196°C is not adequate to characterize narrow micropores due to diffusional problems of the molecules inside these pores (<0.7 nm). In this sense, adsorption of CO2 carried out under low relative pressures (<0.03), and at higher temperatures, 0°C, can give us valuable information about this type of microporosity (Linares-Solano, 1986; Marsh, 1987; Rodríguez-Reinoso and Linares-Solano, 1988). Significant differences are found in CO2 adsorption isotherms at 0°C (Figure 2B). The activated carbon CAD and GAS show the highest CO2 adsorption capacities at this temperature, with very similar amount of CO2 adsorbed, indicative of narrow microporosity. However, as aforementioned, they adsorb different amounts of N2, presenting the activated carbon CAD, a higher amount of wider micropores. The activated carbon GAL presents an almost linear CO2 isotherm, with lower CO2 uptakes than those of the previously mentioned carbons, in all range of relative pressures. These results point out the lower presence of narrow microporosity, in spite of being the activated carbon with higher N2 uptakes. In contrast, analysis for FCL reflects only slightly lower CO2 adsorption amounts for this carbon than for CAD and for GAS, whereas its N2 adsorption was quite smaller, indicative of a major presence of more homogeneous narrow microporosity. On the other hand, a considerable CO2 adsorption does take place in the activated carbon GCL, whose adsorption curve displays a pronounced knee at very low pressures and an almost horizontal plateau. In contrast, an insignificant N2 uptake at −196°C was observed. These features are characteristic of solids with a very narrow microporous structures such as molecular sieves. Finally, the activated carbon GAWBa shows lower amounts of CO2 adsorbed in the entire range of pressures associated with a less developed narrow micropore structure. The plausible synergistic effect of the doping with Barium seems to be not quite important at this temperature.
The textural parameters calculated from the N2 and CO2 adsorption isotherms are summarized in Table 2. All the carbon materials present very high values of apparent surface area, reaching, the activated carbon GAL, even more than 2200 m2/g. The values of external surface are very low, in general, with the higher value observed for GAWBa, with 130 m2/g. FCL carbon shows very similar values of apparent surface area obtained by applying the BET and DR methods to the N2 and CO2 data, indicating that this carbon material presents a micropore size close to 0.7 nm (Cazorla-Amorós et al., 1998). With regard to the pore volumes obtained from N2 adsorption data, almost all the carbons present considerable values, except GCL. GAL has the highest total pore volume (1.134 cm3 STP/g). However, if the ratio of micropore volume to total pore volume is analyzed, , the carbons GAL and GAWBa present the lowest contribution of microporosity to the total pore volume, around 65%. In the case of GCL, a value of pore volume close to 0 confirms N2 adsorption diffusion restrictions on the very narrow micropores (Rodríguez-Reinoso et al., 1995).
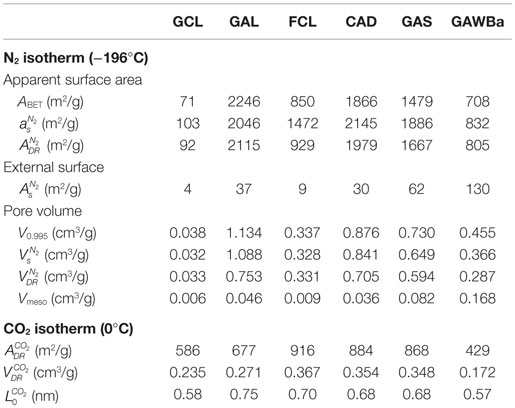
Table 2. Textural parameters obtained from N2 and CO2 isotherms.
Taking now into account the structural parameters derived from CO2 adsorption data, it can be seen that the micropore volumes, , are, in general, much lower than the values obtained from N2 adsorption data, indicative of a lower presence of narrow microporosity with respect to that associated with pores between 0.7 and 2 nm. Nevertheless, FCL and GCL carbons present very similar and even higher micropore volume with CO2, respectively, showing a behavior typical of carbon molecular sieves. Furthermore, FCL accounts for the highest contribution of narrow micropore volume, with a ratio very close to 1, thus supporting the existence of micropores near 0.7 nm (Cazorla-Amorós et al., 1998). In contrast, GAL presents lower amount of narrow micropores, despite its exceptional porosity. CAD and GAS show comparable narrow microporosity development with a small contribution of wider micropores . Finally, the lower pore volume found for sample GAWBa likely responds to a partial blockage of the porous structures by the barium loading (Bedia et al., 2010; Rosas et al., 2010; Guerrero-Pérez et al., 2011; Calzado et al., 2015). However, due to the intrinsic nature of the CO2 molecule (CO2 is a weak Lewis acid), the enhanced basic character of this sample could influence its adsorption capacity at higher temperatures.
In order to clarify factors affecting CO2 capture capacity under different conditions, the pore size distribution of all samples is plotted in Figure 3. FCL shows a unimodal distribution with a very thick peak associated, almost exclusively, to the presence of very narrow micropores with the maximum at ≈0.58 nm. The rest of the carbon materials, with the exception of GCL, present multimodal distributions, with also contribution of micropores of larger size and even mesopores. At least two main ranges of micropores can be distinguished for samples GAS, CAD, and GAWBa: very small micropores with average sizes between 0.62 and 0.66 nm; and micropores with sizes between 1 and 2 nm for the first two (maximum at 1.4 and 1.6 nm, respectively) or narrow mesopores (3.0–5.0 nm), in the case of the activated carbon GAWBa. Data assessed by the N2 adsorption/desorption isotherm for the activated carbon GCL would lack reliability due to the abovementioned diffusion restrictions derived from its very narrow microporosity. In this line, analysis and comparison of the characteristic curves obtained by linearization of the D–R equation form both the N2 and CO2 adsorption isotherms provide interesting information. Figure 4 shows an example of the three basic types of plots found for the materials studied in this work. In these plots, well-defined linear behavior is indicative of uniform pore size distributions, whereas deviation from linearity appears if microporosity is made up of micropores of different sizes (Dubinin, 1989). Micropore volumes of diverse size ranges could be assessed by the interceptions of each distinguished linear zone (Dubinin, 1989). Figure 4A depicts the D–R plots of GCL for data obtained from N2 (−196°C) and from CO2 (0°C) isotherms and substantial differences are noticed. First, the N2 corresponding points remain always below those of CO2, symptomatic of kinetic restrictions of the adsorption of N2 at −196°C in the narrower micropores (<0.7 nm). Focusing on the CO2 curve, two linear regions can be seen, being the faintly steeper slope at low pressures [high values of log2(P0/P)] characteristic of the molecular sieves carbons. Figure 4B, corresponding to FCL, shows that both characteristic curves maintain linearity in the entire range of relative pressures and provide identical micropore volumes, which suggests that this sample contains very homogeneous and narrow micropores accessible to CO2 and N2. Given that both samples (GCL and FCL) have been obtained from the same carbon precursor and at the same treatment conditions, the fiber configuration seems to provide a better access of N2 to the narrow microporosity of this carbon. In contrast, the D–R curves corresponding to sample GAWBa (Figure 4C) exhibit some upward deviations at high relative pressures in both cases (N2 and CO2) and assesses a greater than . This remarks the existence of a wider microporosity for this carbon. Similar behaviors were found for the rest of the samples studied.
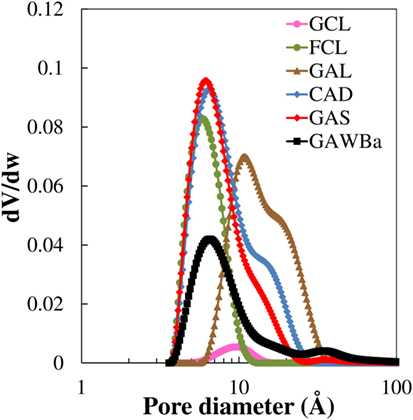
Figure 3. Pore size distributions calculated from the N2 adsorption isotherms.
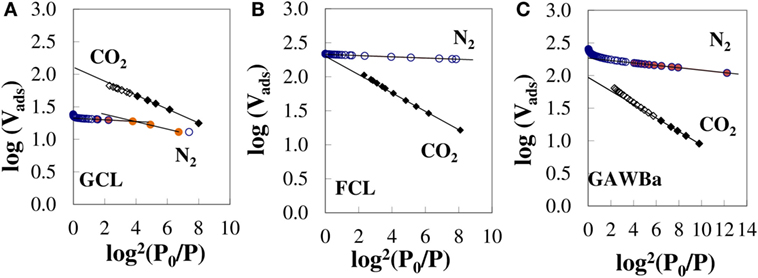
Figure 4. Characteristic N2 (−196°C) and CO2 (0°C) D–R curves for samples (A) GCL, (B) FCL, and (C) GAWBa (βN2 = 0.33; βCO2 = 0.35).
CO2 D–R curves were used to estimate the average narrowest micropore width by means of the empirical correlation proposed by Stoeckli et al. (1990), valid for pore sizes between 0.35 and 1.3 nm (Cazorla-Amorós et al., 1998). For samples with a wide micropore size distribution, only the linear zone at lower relative pressures has been considered. The calculated values have been included in Table 2. FCL presents an average pore size of 0.7 nm that almost coincides with the pore diameter of the maximum of the narrow pore size distribution observed for this sample in Figure 3, obtained from the N2 isotherm. GAS and CAD show an average micropore size of 0.68 nm, also matching the maximum of the N2 pore size distributions in the narrow micropore region. A similar result can be found for GAWBa. On the other hand, the CO2 results show that GCL contains micropores of much reduced dimensions, with an average size of 0.58 nm (Table 2). This value is very different from that attained from the N2 isotherm, which shows a small peak at a pore diameter of 1 nm (Figure 3). These results clearly reflect the diffusional limitations of N2 molecule in the narrow microporosity of this carbon at such a low temperature (−196°C) and reinforce the idea of this technique not being adequate to characterize this narrow microporous structure. GAL shows an average micropore size of 0.75 nm (Table 2), a value much lower than the maximum at c.a. 1.1 nm of the broad pore size distribution of this sample in Figure 3. This suggests that adsorption of CO2 a 0°C only takes into account a part of the wide microporosity, obviating the larger micropores and the narrow mesopores that are also present in this sample.
Adsorption Equilibrium Studies
Equilibrium and kinetic studies are essential for envisaging the viability of using an adsorbent for a particular application, especially in gas separation processes. Figure 5 represents the equilibrium adsorption isotherms of pure CO2, from 0 to 101.3 kPa and 25°C, on all the carbon materials prepared. An increase in CO2 pressure leads to an increase in CO2 adsorption capacity for all the samples, yet different behaviors can be discriminated. On the one hand, activated carbon GAL isotherm exhibits almost a linear shape characteristic of weak interactions between the adsorbate and the adsorbent (Henry-type). CAD and GAS equilibrium isotherms are almost linear as well, although they reflect higher CO2 adsorption capacities in the entire range of pressure covered. Finally, another type of isotherm can be noticed for samples GCL, FCL, and GAWBa. The more rounded shape of these equilibrium curves indicates stronger interactions adsorbate–adsorbent. Table 3 summarizes the equilibrium CO2 capacity values reached up to 101.3 kPa, which are in the range of 2.0 mmol/g, for GAWBa, to 3.1 mmol/g, for FCL. GAS and CAD values are very similar and only slightly lower than the maximum achieved by FCL. Activated carbons GCL and GAL also reflect comparable CO2 retention capacities at atmospheric pressure, despite the noticeable different shape of their isotherms (see Figure 5).
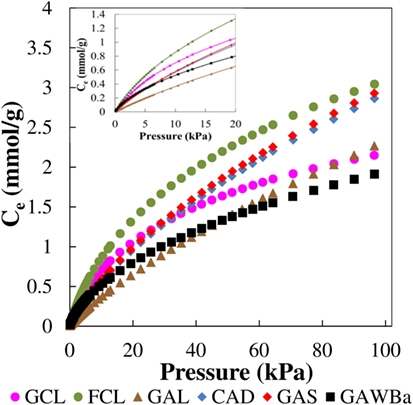
Figure 5. Equilibrium adsorption isotherms of CO2 at 25°C over all the samples.
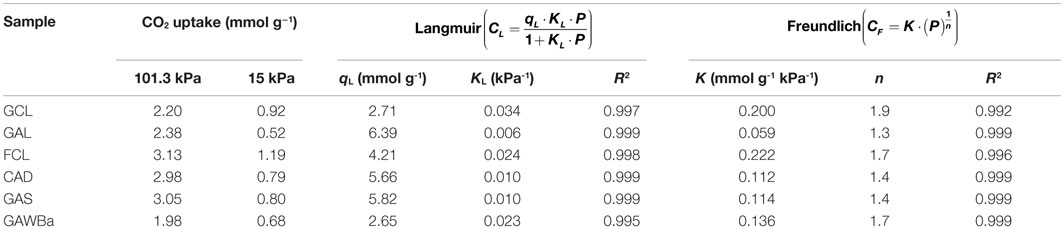
Table 3. Experimental CO2 capacity (15 kPa; 101.3 kPa) and characteristic isotherm parameters obtained from equilibrium studies at 25°C.
In order to actually evaluate the potential of the different materials, it is important to consider the CO2 uptakes at typical CO2 pressure in post-combustion applications, which are around 15 kPa. Under these conditions, CO2 capacities fall to the range of 0.7–1.2 mmol/g. It is worthy to highlight that these values are still higher or equal than those reported from some commercial carbon-based adsorbents, i.e., Norit R2030 CO2 (Plaza et al., 2015), BPL (Chue et al., 1995), Norit AC 1 Extra (Dreisbach et al., 1999), BrightblackTM (Hornbostel et al., 2013), or VR-5-M (Wahby et al., 2010), very similar to some carbon fiber composites obtained by petroleum pith (Thiruvenkatachari et al., 2013), or even to other attractive adsorbents such as some MOFs (Krishna and Van Baten, 2012; Li et al., 2012; Sabouni et al., 2013; Xu et al., 2013; Xian et al., 2015) and zeolites (Hefti et al., 2015), tested under similar operating conditions. In addition, it should be kept in mind that these materials would present the added value of having being prepared by valorization of highly available underutilized biomass residues and using much more inexpensive, straightforward, and easy to scale-up procedures.
As it can be observed from the inset in Figure 5, it is also interesting that at 15 kPa, the sequence of increasing CO2 adsorption capacities differs from that shown at atmospheric pressure. Specifically, adsorption capacity of the GCL activated carbon is higher than those of CAD and GAS samples, which do still remain very close. Adsorption capacity is strongly influenced by the structural characteristics of the adsorbent and the operating conditions, since different mechanisms may be involved. At low pressures, the volume-filling mechanism (driven by adsorbate–adsorbent short-range non-specific attractive and repulsive interactions) governs, and therefore, the adsorption potential would be enhanced in very small micropores due to the overlapping of the potential fields from the neighboring walls (Dubinin, 1966; Sing, 1995). At higher pressures, adsorption can occur via surface coverage and wider micropores become more relevant. In this context, theoretical and empirical investigations have tried to clarify the role of small narrow micropores in the CO2 uptake under typical post-combustion conditions. Some authors proposed that pores lower than five times the size of CO2 molecule (0.209 nm) maximize CO2 adsorption, proposing, in that case, pores lower than 1 nm (Maroto-Valer et al., 2005). Other authors also reported that CO2 capture basically depends on micropores with sizes below 0.8 nm (Presser et al., 2011; Lee and Park, 2013; Sevilla et al., 2013; Wickramaratne and Jaroniec, 2013). Improved CO2 retention capacities have been ascribed to even smaller diameters as well (Martín et al., 2010; Wahby et al., 2010; Wei et al., 2012; Sethia and Sayari, 2015). Zhang et al. (2013) described that critical pore size increased with decreasing adsorption temperature and found that micropores with sizes below 0.54, 0.7, and 0.8 nm were determinant for adsorption at 75, 25, and 0°C, respectively (Zhang et al., 2013). However, inconsistencies between authors are common depending on the conditions or characteristics studied, and seeking an advanced adsorbent is still very much empirical (Martín et al., 2010).
Bearing all that in mind and taking into account data summarized in Table 2, along with the porous size distributions of the different carbon materials, analysis of the results herein presented may provide new insights of the critical role of structural characteristics, and more precisely, of narrow micropores, on the CO2 adsorption potential. The activated carbon GAL, despite owing the highest specific surface area (ABET = 2246 m2/g) and total pore volume (V0.995 = 1.134 cm3/g), presents very poor performance as a consequence of insufficient narrow microporosity. In fact, more than 75% of its porosity comes from super-micropores (>0.8 nm), as indicated by the ratio . In contrast, FCL has almost exclusively very narrow micropores (maximum at ≈0.70 nm), which remarkably favors and strengthens the interaction forces responsible of the adsorbate adsorption. Additionally, the outstanding narrow micropore volume of these fibers is the highest among the studied samples, thus justifying the greater CO2 uptake values over the entire range of pressures. In the case of the samples GAS and CAD, they account with nearly identical narrow micropore volumes and pore size distributions in the range of micropores <1 nm, with an average narrow micropore width of 0.68 nm. The presence of certain amount of wider micropores explains the more linear shape of the curve. As compared with them, GCL demonstrates better performance at low pressures, whereas the trend is changed with increasing pressures. This material has lower volume of narrow micropores, but they are very uniformly distributed and present a smaller average size (approx. 0.58 nm). If higher pressures were involved, wider micropores would start to contribute and materials with slightly greater micropores, such as GAS or CAD, will be able to enhance CO2 uptakes. On the other hand, role of mesopores seems to be negligible, as indicated by the similar shape of the GCL isotherm with respect to that of GAWBa, in which very narrow micropores of about 0.57–0.6 prevails but some small mesopores (maximum at 4.7 nm) also exists. In this case, the decrease in the CO2 retention capacity is most likely due to its lower . Figure 6 depicts the CO2 capacities (25°C, 101.3 kPa) versus the narrow micropore volume, derived from the CO2 adsorption data at 0°C , of the samples. A very good correlation exists for materials exhibiting similar narrow micropore sizes. The small positive deviation of GAWBa can be associated with the effect of the Ba doping.
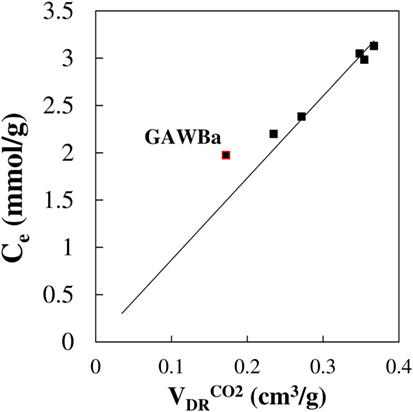
Figure 6. Relationship between the experimental adsorption capacity (25°C, 101.3 kPa) and the narrow micropore volume, .
On the other hand, results obtained at 15 kPa present the following sequence FCL > GCL > CAD ≈ GAS > GAWBa > GAL of CO2 uptake at 25°C. These values cannot be directly associated with any of the structural parameters initially evaluated (see Table 2). However, when the cumulative pore volume is calculated as a function of the pore size, results are revealing. These distributions, assessed from the CO2 adsorption isotherms at 0°C by applying the DFT method, are plotted in Figure 7. It can be observed that the cumulative pore volume only presents the same trend found in the inset of Figure 5, when pore sizes lower than 0.7 nm are considered. This reinforces the role of very narrow micropores in CO2 adsorption under post-combustion conditions and seems to specifically match it to micropores below 0.7 nm. Likewise, it confirms that CO2 uptake at higher pressures is affected by slightly wider micropores because of the coverage surface adsorption mechanism that would be involved under those increasing concentrations. For instance, a good agreement between CO2 capacity values and cumulative pore volume is only achieved by taking into account micropores up to approximately 1.0 nm.
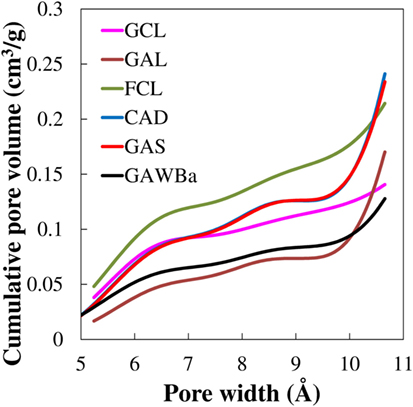
Figure 7. Cumulative pore volume distributions from the CO2 adsorption isotherms at 0°C.
Equilibrium isotherms were fitted using the typical models of Langmuir and Freundlich. Table 3 presents the characteristics parameters assessed from both models. The goodness of the multiple fits can be appreciated by the R2 values. Both models are able to describe satisfactorily the experimental data although, as it would be expected, Langmuir model accuracy is slightly greater over samples GCL and FCL, whereas the Freundlich equation gives better estimations for CAD, GAS, and GAWBa. In the range of microporous, the first two materials are characterized by very uniform and narrow distributions, which strengthen the interaction forces and seem to ensure more uniform energies of adsorption onto the surface while reducing transmigration of the adsorbed molecules and the formation of multiple layers. The other samples have a broader microporosity, thus favoring the heterogeneity of the surface and moving off from the Langmuir assumptions (Ruthven, 1984; Do, 1998).
Breakthrough Experiments
Notwithstanding that it seems clear that materials with very uniform narrow micropores would be desirable to ensure high equilibrium adsorption capacity, their response may be influenced by other structural properties when exposed to real operation conditions; herein, typical dynamic conditions of post-combustion applications. For instance, wider micro- or mesoporous can facilitate the diffusion of the adsorbate to the inner porosity and promote faster kinetics. In addition, for a potential scale-up of the adsorption process, other factors such as morphology, particle size, density, easy of regeneration, etc., must be taken into consideration as well.
In this line, to evaluate the effect of some of the abovementioned aspects, dynamic adsorption–desorption studies have been carried out over four of the samples that have demonstrated substantial CO2 uptakes and present different physicochemical properties and morphologies: GCL, FCL, GAS, and GAWBa. Table 4 reports the length and density of the beds obtained for the different samples. In each analysis, it was checked that the ratio of bed length to particle diameter was larger than 20 to minimize axial dispersion effects. As expected, for the same weight of adsorbent, the bed length of granular activated carbons is much smaller than the bed length of the carbon fiber, as a result of a considerably greater bed density for the former. This is very important from a practical point of view, as the size of the required adsorber in the final application would depend on it. However, very high bed densities would lead to adverse pressure drops through the column and loses in the overall efficiency of the process (Ruthven, 1984).
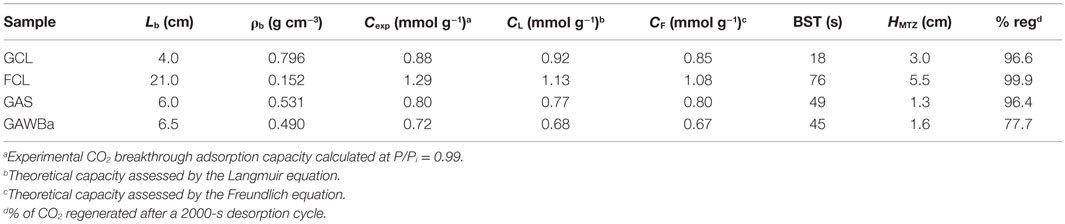
Table 4. Experimental parameters for breakthrough curves and comparison between experimental CO2 capacities (0.4 g of adsorbent, 25°C, 101.3 kPa, 15% CO2 in N2) and Langmuir and Freundlich models predictions (25°C, pure CO2, 15.2 kPa).
Figure 8 compares the breakthrough profiles obtained for each selected material at 25°C, 101.3 kPa, and 15% CO2 in N2. All the experimental curves present the typical S-shaped curve for column operation with favorable adsorption isotherms (Yang, 1987). GCL displays the broadest breakthrough curve, whereas GAWBa and GAS express the steepest ones, which indicates that intraparticle diffusion must be the mass transfer rate limiting mechanism. It must be taken into account that GCL can be considered as a molecular sieve, with a porous structure mainly constituted by very narrow micropores (average size of 0.58 nm), thus possibly entailing diffusion and mass transfer limitations, which lead a lower slope breakthrough curve. In contrast, the other two samples exhibit a wider microporosity and even some contribution of small mesopores, due the activation process, which aid in the diffusion of the adsorbate to the inner narrow micropores. Presence of these bigger pores, while not enhancing the equilibrium adsorptive capacities, does seem to be advantageous for real applications. The activated carbon fibers, FCL, shows a curve with a little less slope than GAS and GAWBa but significantly steeper than GCL. This clearly remarks some of the benefits of this kind of conformations: porosity of this sample is made up almost exclusively by narrow micropores as small as those prevailing in GCL; nonetheless, its submicron fibrous structure makes all the microporosity accessible for adsorption and substantially reduces the mass transfer resistance.
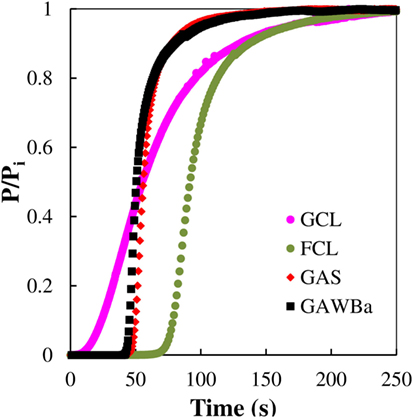
Figure 8. CO2 breakthrough curves at 25°C and 101.3 kPa (0.4 g of adsorbent, 50 cm3 STP/min, 15% CO2 in N2) over the samples GAS, GAWBa, GCL, and FCL.
The characteristic breakthrough appearance or bed service time (BST) and the height of the mass transfer zone (HMTZ) have been determined from the dynamic experimental curves. Herein, the BST has been established as the time required for the outlet concentration to reach a 5% of the inlet concentration (P/Pi = 0.05). This time is inversely related to the HMTZ and would be proportional to the actual operating adsorption capacity of the adsorbent. The height of the mass transfer zone has been determined according to the equation:
where W (g) is the mass of the adsorbent, Rb (cm) and ρb (g cm−3) are the bed radius and density, respectively, AT is the total area above the breakthrough curve, and AMTZ is the area above the curve from the BST. HMTZ depends on the interactions between the experimental conditions and the surface properties of the adsorbent and provides an estimation of the actual use of the adsorption bed (Ruthven, 1984). Specifically, percentages of utilization have been assessed by the ratio between the area above the curve up to the BST and the total area above the breakthrough curve until the bed saturation time.
Table 4 compiles the experimental CO2 adsorption capacities, as well as the BST and HMTZ values obtained from the dynamic runs. Values of capacities estimated by means of the Langmuir and Freundlich equations, derived from the equilibrium adsorption experiments, have also been included with comparative purposes. For the studied samples, it can be observed that a good agreement between experimental and predicted amounts of CO2 adsorbed was found. Looking at the BST and breakthrough capacity values, FCL, the sample that showed the highest adsorption capacity in the equilibrium studies also presents the highest BST. Very similar behavior can be detected for the two activated carbons, GAS and GAWBa, despite owing very different surface chemistry, suggesting that under the dynamic conditions studied, also porous structure is more relevant. GCL presents the shortest values. On the other hand, HMTZ values vary according to the material properties and indicate an actual use of about 74–78% of the available CO2 capture capacities for samples FCL, GAS, and GAWBa. The above discussed diffusion and mass transfer limitations make this percentage to fall down to approximately 25% for the activated carbon GCL, what would imply the necessity of increasing the bed length (or the bed weight) to achieve a better use of the adsorbent. The comparison of these values to others reported in the literature shows that the capacity value obtained in column experiments for the activated carbon fiber, FCL, is considerably higher than those reported by Jadhav et al. (2007) with modified zeolites 13X; and Sjostrom and Krutka (2010) with different carbon materials at very similar experimental conditions.
Regeneration capacity, defined as the capacity of a specific material to be used in subsequent adsorption–desorption cycles, is another key issue that can be addressed by dynamic fix bed studies. As an example, an adsorption–desorption–adsorption cycle of CO2 at 25°C over the activated carbon fibers FCL has been plotted in Figure 9. This sample has proven an excellent regeneration potential: after the saturation step, CO2 adsorbed is easily recovered by switching the inlet flow to pure N2, at the same adsorption temperature; and the same adsorption capacity is accomplished in a second adsorption step. Similar results were observed up to 10 cycles of adsorption–desorption. In the present study, regeneration capacity has been determined based on the amount of CO2 desorbed after a desorption step of 2000 s to that of CO2 adsorbed at the end of the adsorption step (%reg). Values are also presented in Table 4. After this desorption time, the sample FCL showed 99.9% of regeneration capacity. In contrast, a 78% of regeneration was found for the activated carbon impregnated with barium acetate, due to the presence of stronger interaction forces between the CO2 and the barium surface sites, of basic character. This is in agreement with previously reported adsorption mechanisms over other carbon materials with basic functionalities and is mainly attributed to different polarities of adsorbate and adsorbent surfaces. Thus, in this case, further or complete regeneration would require longer desorption times or alternative regeneration strategies, for instance, temperature swing adsorption (Hedin et al., 2013). These results are really interesting if they are compared to other inorganic materials. In this sense, the highest CO2 adsorption capacity shown in this work is slightly lower than the value reported by Aschenbrenner et al. (2011) with hydrotalcite-like compounds. However, they need to supply much energy in the regeneration step, because desorption takes place at 300°C. On the other hand, Sumida et al. (2012) pointed out in its review that CO2 adsorption capacity is considerably reduced in regenerated MOFs due to the strong interaction with the adsorption sites. In this line, it is worth mentioning that the activated carbon or even the simply carbonized samples studied in this work show very high regeneration capacities, near 100%, indicating weak interactions adsorbate–adsorbent, low heat of adsorption and, therefore, easiness of regeneration. This factor would be crucial for a feasible actual application of any potential adsorbent and represents a step forward with respect to other types of materials such as MOFs or zeolites, as aforementioned, since energy requirements and cost of the overall adsorption process are related to its regeneration.
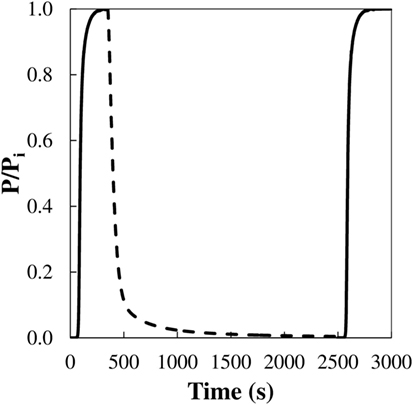
Figure 9. Cycle of adsorption–desorption–adsorption of CO2 at 25°C and 101.3 kPa (0.4 g of adsorbent, 50 cm3 STP/min, 15% CO2 in N2) over the activated carbon fiber FCL.
Conclusion
A series of carbon materials with different morphologies and porous structural properties have been synthesized from biomass byproducts and residues and evaluated as potential adsorbents for CO2 capture under post-combustion conditions.
Equilibrium studies of these porous materials showed that CO2 capacities at 25°C and 101.3 kPa are comparable to those reported for other carbon materials. Furthermore, at that CO2 pressure, they can be well correlated with the narrow micropore volume, derived from the CO2 adsorption data at 0°C . On the other hand, CO2 capacities at 25°C and 15 kPa are more related to the amount of pores of sizes lower than 0.7 nm, as indicated by the analysis of the cumulative pore volume as a function of the pore size, assessed from the CO2 data at 0°C.
Dynamic adsorption–desorption studies in column system (25°C, 15 kPa CO2) revealed really promising breakthrough adsorption capacities, as well. For instance, an activated carbon fiber synthesized from Alcell lignin, FCL, exhibited a capacity value of about 1.3 mmol/g (5.7%wt). Additionally, the carbon materials displayed excellent regeneration capacities after a simple, fast, and no high-energy-demanding desorption treatments carried out at the same operational temperature and pressure.
Author Contributions
The authors EC-M, FG-M, and JR have provided substantial contribution to the acquisition, interpretation, and analysis of data, as well as to the drafting of the work. JR-M and TC performed essential work regarding to the conception and design of the research presented and to its critical revision for important intellectual content. They all approve the version to be published, and agree to be accountable to investigate and resolve any question related to the accuracy or integrity of any part of the work.
Conflict of Interest Statement
The authors declare that the research was conducted in the absence of any commercial or financial relationships that could be construed as a potential conflict of interest.
Funding
The authors gratefully thank Junta de Andalucia (P09-FQM-5156) and Spanish Ministry of Economy and Competitiveness (MINECO) and FEDER (Project CTQ2015-68654-R) for financial support. EC-M gratefully thanks MECD for a FPU fellowship (AP-2012-01359).
Footnote
References
Aschenbrenner, O., McGuire, P., Alsamaq, S., Wang, J., Supasitmongkol, S., Al-Duri, B., et al. (2011). Adsorption of carbon dioxide on hydrotalcite-like compounds of different compositions. Chem. Eng. Res. Des. 89, 1711–1721. doi: 10.1016/j.cherd.2010.09.019
Balasubramanian, R., and Chowdhury, S. (2015). Recent advances and progress in the development of graphene-based adsorbents for CO2 capture. J. Mater. Chem. A 3, 21968–21989. doi:10.1039/c5ta04822b
Bedia, J., Rosas, J. M., Rodríguez-Mirasol, J., and Cordero, T. (2010). Pd supported on mesoporous activated carbons with high oxidation resistance as catalysts for toluene oxidation. Appl. Catal. B Environ. 94, 8–18. doi:10.1016/j.apcatb.2009.10.015
Ben-Mansour, R., Habib, M. A., Bamidele, O. E., Basha, M., Qasem, N. A. A., Peedikakkal, A., et al. (2016). Carbon capture by physical adsorption: materials, experimental investigations and numerical modeling and simulations – a review. Appl. Energy 161, 225–255. doi:10.1016/j.apenergy.2015.10.011
Brunauer, S., Emmett, P. H., and Teller, E. (1938). Adsorption of gases in multimolecular layers. J. Am. Chem. Soc. 60, 309–319. doi:10.1021/ja01269a023
Calzado, M., Valero-Romero, M. J., Garriga, P., Chica, A., Guerrero-Pérez, M. O., Rodríguez-Mirasol, J., et al. (2015). Lignocellulosic waste-derived basic solids and their catalytic applications for the transformation of biomass waste. Catalysis Today 257, 229–236. doi:10.1016/j.cattod.2014.06.038
Cazorla-Amorós, D., Alcañiz-Monge, J., De La Casa-Lillo, M. A., and Linares-Solano, A. (1998). CO2 as an adsorptive to characterize carbon molecular sieves and activated carbons. Langmuir 14, 4589–4596. doi:10.1021/la980198p
Choi, S., Drese, J. H., and Jones, C. W. (2009). Adsorbent materials for carbon dioxide capture from large anthropogenic point sources. ChemSusChem 2, 796–854. doi:10.1002/cssc.200900036
Chue, K. T., Kim, J. N., Yoo, Y. J., Cho, S. H., and Yang, R. T. (1995). Comparison of activated carbon and zeolite 13X for CO2 recovery from flue gas by pressure swing adsorption. Ind. Eng. Chem. Res. 34, 591–598. doi:10.1021/ie00041a020
Davidson, R. M. (2009). Post-Combustion Carbon-Capture Solid Sorbents and Membranes. Report CCC/1444. London: IEA Clean Coal Centre.
Díez, N., Álvarez, P., Granda, M., Blanco, C., Santamaría, R., and Menéndez, R. (2015). CO2 adsorption capacity and kinetics in nitrogen-enriched activated carbon fibers prepared by different methods. Chem. Eng. J. 281, 704–712. doi:10.1016/j.cej.2015.06.126
Do, D. (1998). Adsorption Analysis: Equilibria and Kinetics (Series on Chemical Engineering, vol. 2). London: Imperial College Press.
Dreisbach, F., Staudt, R., and Keller, J. U. (1999). High pressure adsorption data of methane, nitrogen, carbon dioxide and their binary and ternary mixtures on activated carbon. Adsorption 5, 215–227. doi:10.1023/A:1008914703884
Dubinin, M. M. (1960). The potential theory of adsorption of gases and vapors for adsorbents with energetically nonuniform surfaces. Chem. Rev. 60, 235–241. doi:10.1021/cr60204a006
Dubinin, M. M. (1966). “Porous structure and adsorption properties of active carbons,” in Chemistry and Physics of Carbon, Vol. 2, ed. P. L. Jr. Walker (New York: Marcel Dekker), 56.
Dubinin, M. M. (1989). Fundamentals of the theory of adsorption in micropores of carbon adsorbents: characteristics of their adsorption properties and microporous structures. Carbon N. Y. 27, 457–467. doi:10.1016/0008-6223(89)90078-X
European Commission. (2011). Communication from the Commission to the European Parliament, the Council, the European Economic and Social Committee and the Committee of the Regions. A Roadmap for Moving to a Competitive Low Carbon Economy in 2050. COM 112 final. Brussels.
European Commission. (2013). Communication from the Commission to the European Parliament, the Council, the European Economic and Social Committee and the Committee of the Regions on the Future of Carbon Capture and Storage in Europe. COM 180 Final. Brussels.
Figueroa, J. D., Fout, T., Plasynski, S., McIlvried, H., and Srivastava, R. D. (2008). Advances in CO2 capture technology – the U.S. Department of Energy’s Carbon Sequestration Program. Int. J. Greenhouse Gas Control 2, 9–20. doi:10.1016/S1750-5836(07)00094-1
Finkenrath, M. (2011). Cost of Postcombustion Carbon Dioxide Capture from Power Generation. Report. Paris: International Energy Agency.
Gargiulo, N., Pepe, F., and Caputo, D. (2014). CO2 adsorption by functionalized nanoporous materials: a review. J. Nanosci. Nanotechnol. 14, 1811–1822. doi:10.1166/jnn.2014.8893
GCCSI. (2012). CO2 Capture Technologies: Post Combustion Capture (PCC). Report. Melbourne: Global CCS Institute, Electric Power Research Institute (EPRI).
Gregg, S. I., and Sing, K. S. W. (1982). Adsorption, Surface Area and Porosity. London: Academic Press.
Guerrero-Pérez, M. O., Rosas, J. M., López-Medina, R., Bañares, M. A., Rodríguez-Mirasol, J., and Cordero, T. (2011). Lignocellulosic-derived catalysts for the selective oxidation of propane. Catal. Commun. 12, 989–992. doi:10.1016/j.catcom.2011.03.010
Hao, G.-P., Li, W.-C., Qian, D., Wang, G.-H., Zhang, W.-P., Zhang, T., et al. (2011). Structurally designed synthesis of mechanically stable poly(benzoxazine-co-resol)-based porous carbon monoliths and their application as high-performance CO2 capture sorbents. J. Am. Chem. Soc. 133, 11378–11388. doi:10.1021/ja203857g
Harlick, P. J. E., and Tezel, F. H. (2004). An experimental adsorbent screening study for CO2 removal from N2. Micropor. Mesopor. Mater. 76, 71–79. doi:10.1016/j.micromeso.2004.07.035
Hedin, N., Andersson, L., Bergström, L., and Yan, J. (2013). Adsorbents for the post-combustion capture of CO2 using rapid temperature swing or vacuum swing adsorption. Appl. Energy 104, 418–433. doi:10.1016/j.apenergy.2012.11.034
Hefti, M., Marx, D., Joss, L., and Mazzotti, M. (2015). Adsorption equilibrium of binary mixtures of carbon dioxide and nitrogen on zeolites ZSM-5 and 13X. Micropor. Mesopor. Mater. 215, 215–226. doi:10.1016/j.micromeso.2015.05.044
Ho, M. T., Allinson, G. W., and Wiley, D. E. (2008). Reducing the cost of CO2 capture from flue gases using pressure swing adsorption. Ind. Eng. Chem. Res 47, 4883–4890. doi:10.1021/ie070831e
Hornbostel, M. D., Bao, J., Krishnan, G., Nagar, A., Jayaweera, I., Kobayashi, T., et al. (2013). Characteristics of an advanced carbon sorbent for CO2 capture. Carbon N. Y. 56, 77–85. doi:10.1016/j.carbon.2012.12.082
IEA, UNIDO (United Nations Industrial Development Organizations). (2011). Technology Roadmap – Carbon Capture and Storage in Industrial Applications. Paris: OCDE/International Energy Agency.
IPCC (Intergovernmental Panel on Climate Change). (2005). IPCC Special Report on Carbon Dioxide Capture and Storage. Cambridge: Cambridge University Press.
IPCC (Intergovernmental Panel on Climate Change). (2007). Climate Change 2007: The Physical Science Basis. Cambridge: Cambridge University Press.
Jadhav, P. D., Chatti, R. V., Biniwale, R. B., Labhsetwar, N. K., Devotta, S., and Rayalu, S. S. (2007). Monoethanol amine modified zeolite 13X for CO2 adsorption at different temperatures. Energy Fuels 21, 3555–3559. doi:10.1021/ef070038y
Jagiello, J., and Olivier, J. P. (2013). 2D-NLDFT adsorption models for carbon slit-shaped pores with surface energetical heterogeneity and geometrical corrugation. Carbon N. Y. 55, 70–80. doi:10.1016/j.carbon.2012.12.011
Jiménez, V., Ramírez-Lucas, A., Díaz, J. A., Sánchez, P., and Romero, A. (2012). CO2 capture in different carbon materials. Environ. Sci. Technol. 46, 7407–7414. doi:10.1021/es2046553
Kaneko, K. (1994). Determination of pore size and pore size distribution. 1. Adsorbents and catalysts. J. Membrane Sci. 96, 59–89. doi:10.1016/0376-7388(94)00126-X
Kaneko, K., and Ishii, C. (1992). Superhigh surface area determination of microporous solids. Colloids Surf. 67, 203–212. doi:10.1016/0166-6622(92)80299-H
Kaneko, K., Ishii, C., Ruike, M., and Kuwabara, H. (1992). Origin of superhigh surface area and microcrystalline graphitic structures of activated carbons. Carbon N. Y. 30, 1075–1088. doi:10.1016/0008-6223(92)90139-N
Krishna, R., and Van Baten, J. M. (2012). A comparison of the CO2 capture characteristics of zeolites and metal-organic frameworks. Sep. Purif. Technol. 87, 120–126. doi:10.1016/j.seppur.2011.11.031
Lallave, M., Bedia, J., Ruiz-Rosas, R., Rodríguez-Mirasol, J., Cordero, T., Otero, J. C., et al. (2007). Filled and hollow carbon nanofibers by coaxial electrospinning of alcell lignin without binder polymers. Adv. Mater. Weinheim 19, 4292–4296. doi:10.1002/adma.200700963
Lee, S.-Y., and Park, S.-J. (2013). Determination of the optimal pore size for improved CO2 adsorption in activated carbon fibers. J. Colloid Interface Sci. 389, 230–235. doi:10.1016/j.jcis.2012.09.018
Lee, S.-Y., and Park, S.-J. (2015). A review on solid adsorbents for carbon dioxide capture. J. Ind. Eng. Chem. 23, 1–11. doi:10.1016/j.jiec.2014.09.001
Li, B., Zhang, Z., Li, Y., Yao, K., Zhu, Y., Deng, Z., et al. (2012). Enhanced binding affinity, remarkable selectivity, and high capacity of CO2 by dual functionalization of a rht-type metal-organic framework. Angew. Chem. Int. Ed. 51, 1412–1415. doi:10.1002/anie.201105966
Linares-Solano, A. (1986). “Textural characterization of porous carbons by physical adsorptions of gasses,” in Carbon and Coal Gasification, eds J. L. Figuereido and J. A. Moulijn (Dordrecht: Martinus Nijhoff), 137–178.
Maroto-Valer, M. M., Tang, Z., and Zhang, Y. (2005). CO2 capture by activated and impregnated anthracites. Fuel Process. Technol. 86, 1487–1502. doi:10.1016/j.fuproc.2005.01.003
Marsh, H. (1987). Adsorption methods to study microporosity in coals and carbons – a critique. Carbon N. Y. 25, 49–58. doi:10.1016/0008-6223(87)90039-X
Martín, C. F., Plaza, M. G., Pis, J. J., Rubiera, F., Pevida, C., and Centeno, T. A. (2010). On the limits of CO2 capture capacity of carbons. Sep. Purif. Technol. 74, 225–229. doi:10.1016/j.seppur.2010.06.009
Olajire, A. (2010). CO2 capture and separation technologies for end-of-pipe applications – a review. Energy 35, 2610–2628. doi:10.1016/j.energy.2010.02.030
Olivares-Marín, M., and Maroto-Valer, M. (2012). Development of adsorbents for CO2 capture from waste materials: a review. Greenhouse Gases: Sci. Technol. 2, 20–35. doi:10.1002/ghg
Parshetti, G. K., Chowdhury, S., and Balasubramanian, R. (2015). Biomass derived low-cost microporous adsorbents for efficient CO2 capture. Fuel 148, 246–254. doi:10.1016/j.fuel.2015.01.032
Plaza, M. G., García, S., Rubiera, F., Pis, J. J., and Pevida, C. (2010). Post-combustion CO2 capture with a commercial activated carbon: comparison of different regeneration strategies. Chem. Eng. J. 163, 41–47. doi:10.1016/j.cej.2010.07.030
Plaza, M. G., González, A. S., Pevida, C., and Rubiera, F. (2014). Influence of water vapor on CO2 adsorption using a biomass-based carbon. Ind. Eng. Chem. Res. 53, 15488–15499. doi:10.1021/ie500342q
Plaza, M. G., González, A. S., Pevida, C., and Rubiera, F. (2015). Green coffee based CO2 adsorbent with high performance in postcombustion conditions. Fuel 140, 633–648. doi:10.1016/j.fuel.2014.10.014
Plaza, M. G., Pevida, C., Arias, B., Fermoso, J., Casal, M. D., Martín, C. F., et al. (2009). Development of low-cost biomass-based adsorbents for CO2 capture. Fuel 88, 2442–2447. doi:10.1016/j.fuel.2009.02.025
Presser, V., McDonough, J., Yeon, S., and Gogotsi, Y. (2011). Effect of pore size on carbon dioxide sorption by carbide derived carbon. Energy Environ. Sci. 4, 3059–3066. doi:10.1039/c1ee01176f
Pye, E. K., and Lora, J. H. (1991). The AlcellTM process: a proven alternative to Kraft pulping. Tappi J. 74, 113–118.
Radosz, M., Hu, X., Krutkramelis, K., and Shen, Y. (2008). Flue-gas carbon capture on carbonaceous sorbents: toward a low-cost multifunctional carbon filter for ‘Green’ energy producers. Ind. Eng. Chem. Res. 47, 3783–3794. doi:10.1021/ie0707974
Rashidi, N. A., and Yusup, S. (2016). An overview of activated carbons utilization for the post-combustion carbon dioxide capture. J. CO2 Utilization 13, 1–16. doi:10.1016/j.jcou.2015.11.002
Rodríguez-Mirasol, J., Cordero, T., and Rodriguez, J. J. (1993a). Activated carbons from CO2 partial gasification of eucalyptus kraft lignin. Energy Fuels 7, 133–138. doi:10.1021/ef00037a021
Rodríguez-Mirasol, J., Cordero, T., and Rodriguez, J. J. (1993b). CO2-reactivity of eucalyptus kraft lignin chars. Carbon N. Y. 31, 53–61. doi:10.1016/0008-6223(93)90155-4
Rodríguez-Mirasol, J., Cordero, T., and Rodriguez, J. J. (1993c). Preparation and characterization of activated carbons from eucalyptus kraft lignin. Carbon N. Y. 31, 87–95. doi:10.1016/0008-6223(93)90160-C
Rodríguez-Reinoso, F., and Linares-Solano, A. (1988). “Microporous structure of activated carbons as revealed by adsorption methods,” in Chemistry and Physics Of Carbon, Vol. 21, ed. P. A. Thrower (New York: Marcel Dekker), 1–146.
Rodríguez-Reinoso, F., Molina-Sabio, M., and González, M. T. (1995). The use of steam and CO2 as activating agents in the preparation of activated carbons. Carbon N. Y. 33, 15–23. doi:10.1016/0008-6223(94)00100-E
Rosas, J. M., Berenguer, R., Valero-Romero, M. J., Rodríguez-Mirasol, J., and Cordero, T. (2014). Preparation of different carbon materials by thermochemical conversion of lignin. Front. Mater. 1:29. doi:10.3389/fmats.2014.00029
Rosas, J. M., Rodríguez-Mirasol, J., and Cordero, T. (2010). NO reduction on carbon-supported chromium catalysts. Energy Fuels 24, 3321–3328. doi:10.1021/ef901455v
Ruiz-Rosas, R., Bedia, J., Lallave, M., Loscertales, I. G., Barrero, A., Rodríguez-Mirasol, J., et al. (2010). The production of submicron diameter carbon fibers by the electrospinning of lignin. Carbon N. Y. 48, 696–705. doi:10.1016/j.carbon.2009.10.014
Sabouni, R., Kazemian, H., and Rohani, S. (2013). Carbon dioxide adsorption in microwave-synthesized metal organic framework CPM-5: equilibrium and kinetics study. Micropor. Mesopor. Mater. 175, 85–91. doi:10.1016/j.micromeso.2013.03.024
Saha, D., Bao, Z., Jia, F., and Deng, S. (2010). Adsorption of CO2, CH4, N2O, and N2 on MOF-5, MOF-177, and zeolite 5A. Environ. Sci. Technol. 44, 1820–1826. doi:10.1021/es9032309
Samanta, A., Zhao, A., Shimizu, G. K. H., Sarkar, P., and Gupta, R. (2012). Post-combustion CO2 capture using solid sorbents: a review. Ind. Eng. Chem. Res. 51, 1438–1463. doi:10.1021/ie200686q
Sethia, G., and Sayari, A. (2015). Comprehensive study of ultra-microporous nitrogen-doped activated carbon for CO2 capture. Carbon N. Y. 93, 68–80. doi:10.1016/j.carbon.2015.05.017
Sevilla, M., Parra, J. B., and Fuertes, A. B. (2013). Assessment of the role of micropore size and N-doping in CO2 capture by porous carbons. ACS Appl. Mater. Interfaces 5, 6360–6368. doi:10.1021/am401423b
Sevilla, M., Valle-Vigõn, P., and Fuertes, A. B. (2011). N-doped polypyrrole-based porous carbons for CO2 capture. Adv. Funct. Mater. 21, 2781–2787. doi:10.1002/adfm.201100291
Shafeeyan, M. S., Daud, W. M. A. W., Houshmand, A., and Shamiri, A. (2010). A review on surface modification of activated carbon for carbon dioxide adsorption. J. Anal. Appl. Pyrol. 89, 143–151. doi:10.1016/j.jaap.2010.07.006
Sing, K. S. W. (1995). “Chapter 2: physisorption of gases by porous carbons,” in Porosity in Carbons: Characterization and Applications, ed. J. W. Patrick (London: Edward Arnold).
Sjostrom, S., and Krutka, H. (2010). Evaluation of solid sorbents as a retrofit technology for CO2 capture. Fuel 89, 1298–1306. doi:10.1016/j.fuel.2009.11.019
Sreenivasulu, B., Gayatri, D. V., Sreedhar, I., and Raghavan, K. V. (2015). A journey into the process and engineering aspects of carbon capture technologies. Renew. Sustain. Energ. Rev. 41, 1324–1350. doi:10.1016/j.rser.2014.09.029
Srinivas, G., Krungleviciute, V., Guo, Z., and Yildirim, T. (2014). Exceptional CO2 capture in a hierarchically porous carbon with simultaneous high surface area and pore volume. Energy Environ. Sci. 7, 335–342. doi:10.1039/c3ee42918k
Stoeckli, H. F., Rebstein, P., and Ballerini, L. (1990). On the assessment of microporosity in active carbons, a comparison of theoretical and experimental data. Carbon N. Y. 28, 907–909. doi:10.1016/0008-6223(90)90339-Z
Sumida, K., Rogow, D. L., Mason, J. A., McDonald, T. M., Bloch, E. D., Herm, Z. R., et al. (2012). Carbon dioxide capture in metal-organic frameworks. Chem. Rev. 112, 724–781. doi:10.1021/cr2003272
Tancredi, N., Cordero, T., Rodríguez-Mirasol, J., and Rodríguez, J. J. (1996). Activated carbons from uruguayan eucalyptus wood. Fuel 75, 1701–1706. doi:10.1016/S0016-2361(96)00168-8
Thiruvenkatachari, R., Su, S., Yu, X. X., and Bae, J.-S. (2013). Application of carbon fibre composites to CO2 capture from flue gas. Int. J. Greenhouse Gas Control 13, 191–200. doi:10.1016/j.ijggc.2012.12.014
Wahby, A., Ramos-Fernández, J. M., Martínez-Escandell, M., Sepúveda-Escribano, A., Silvestre-Albero, J., and Rodríguez-Reinoso, F. (2010). High-surface-area carbon molecular sieves for selective CO2 adsorption. ChemSusChem 3, 974–981. doi:10.1002/cssc.201000083
Wei, H., Deng, S., Hu, B., Chen, Z., Wang, B., Huang, J., et al. (2012). Granular bamboo-derived activated carbon for high CO2 adsorption: the dominant role of narrow micropores. ChemSusChem 5, 2354–2360. doi:10.1002/cssc.201200570
Wickramaratne, N. P., and Jaroniec, M. (2013). Importance of small micropores in CO2 capture by phenolic resin-based activated carbon spheres. J. Mater. Chem. A 1, 112–116. doi:10.1039/c2ta00388k
Xian, S., Peng, J., Zhang, Z., Xia, Q., Wang, H., and Li, Z. (2015). Highly enhanced and weakened adsorption properties of two MOFs by water vapor for separation of CO2/CH4 and CO2/N2 binary mixtures. Chem. Eng. J. 270, 385–392. doi:10.1016/j.cej.2015.02.041
Xu, W., Pramanik, S., Zhang, Z., Emge, T. J., and Li, J. (2013). Microporous metal organic framework [M2(hfipbb) 2(ted)] (M=Zn, co; H2hfipbb=4,4-(hexafluoroisopropylidene) -bis(benzoic acid); Ted=triethylenediamine): synthesis, structure analysis, pore characterization, small gas adsorption and CO2/N2 separation properties. J. Solid State Chem. 200, 1–6. doi:10.1016/j.jssc.2012.12.030
Yan, S., Fang, M., Wang, Z., and Luo, Z. (2012). Regeneration performance of CO2-rich solvents by using membrane vacuum regeneration technology: relationships between absorbent structure and regeneration efficiency. Appl. Energy 98, 357–367. doi:10.1016/j.apenergy.2012.03.055
Yang, R. T. (1987). Gas Separation by Adsorption Processes. Boston: Butterworths, UK Imperial College.
Keywords: CO2 capture, CO2, post-combustion, adsorption, biomass, activated carbons, carbon materials
Citation: Calvo-Muñoz EM, García-Mateos FJ, Rosas JM, Rodríguez-Mirasol J and Cordero T (2016) Biomass Waste Carbon Materials as adsorbents for CO2 Capture under Post-Combustion Conditions. Front. Mater. 3:23. doi: 10.3389/fmats.2016.00023
Received: 10 March 2016; Accepted: 22 April 2016;
Published: 19 May 2016
Edited by:
Santosh Kumar Yadav, Drexel University, USAReviewed by:
Qihui Wu, Quanzhou Normal University, ChinaVeerappan Mani, National Taipei University of Technology, Taiwan
Rajesh Kumar, State University of Campinas-UNICAMP, Brazil
Copyright: © 2016 Calvo-Muñoz, García-Mateos, Rosas, Rodríguez-Mirasol and Cordero. This is an open-access article distributed under the terms of the Creative Commons Attribution License (CC BY). The use, distribution or reproduction in other forums is permitted, provided the original author(s) or licensor are credited and that the original publication in this journal is cited, in accordance with accepted academic practice. No use, distribution or reproduction is permitted which does not comply with these terms.
*Correspondence: José Rodríguez-Mirasol, mirasol@uma.es