Advanced Image Analysis of the Surface Pattern Emerging in Ni3Al Intermetallic Alloys on Anodization
 Marco Salerno1*
 Wojciech J. Stępniowski2
 Grzegorz Cieślak3
 Małgorzata Norek2
 Marta Michalska-Domańska2
 Krzysztof Karczewski2
Paulina Chilimoniuk2
Krzysztof Karczewski2
Paulina Chilimoniuk2
 Wojciech Polkowski2
 Paweł Jóźwik2
  Zbigniew Bojar2
- 1Department of Nanophysics, Istituto Italiano di Tecnologia, Genova, Italy
- 2Department of Advanced Materials and Technologies, Faculty of Advanced Technology and Chemistry, Military University of Technology, Warszawa, Poland
- 3Institute of Precision Mechanics, Warszawa, Poland
Anodization of Ni3Al alloy is of interest in the field of industrial manufacturing, thanks to the formation of protective oxide layer on the materials working in corrosive environments and high temperatures. However, homogeneous surface treatment is paramount for technological applications of this material. The anodization conditions have to be set outside the ranges of corrosion and “burning,” which is the electric-field-enhanced anodic dissolution of the metal. In order to check against occurrence of these events, proper quantitative means for assessing the surface quality have to be developed and established. We approached this task by advanced analysis of scanning electron microscope images of anodized Ni3Al plates. The anodization was carried out in 0.3M citric acid at two temperatures of 0 and 30°C and at voltages in the range of 2–12 V. Different figures can be used to characterize the quality of the surface, in terms of uniformity. Here, the concept of regularity ratio spread is used for the first time on surfaces of technological interest. Additionally, the Minkowski parameters have been calculated, and their meaning is discussed.
Introduction
Aluminum-containing intermetallic alloys, known as alumides, are important technological materials exhibiting combined properties of both ceramics and metals. Nickel aluminide, in particular, is used in coating blades of gas turbines and jet engines (ASM International, 2000; Dey, 2003). Alumides are known for their resistance against corrosion and heat (Jóźwiak et al., 2013; Senderowski, 2014). These properties are owed to the formation of alumina on the surface of the alloy. Extensive electrochemical research has confirmed this phenomenon (Jóźwiak and Karczewski, 2009; Zurek et al., 2011). In previous work, anodization of Ni3Al intermetallic alloy was carried out, and formation of a nanoporous oxide coating was observed (Stępniowski et al., 2013). The arrangement of the pores was poor, and a full quantitative assessment of the surface pattern was not done, due to the lack of reliable tools. In fact, typical approaches based on simple fast Fourier transform (FFT), Delaunay maps, or even angle distribution function and pair distribution function (Nowak-Stępniowska, 2015) are only appropriate for well-organized periodic nanostructures similar to the honeycomb pattern formed during two-step anodization of pure aluminum (Das et al., 2012; Nowak-Stępniowska, 2015). Recently, a FFT approach taking into account the whole distribution of interpore distances was found to be successful for quantitative arrangement analysis of poorly organized anodic aluminum oxide (Sulka and Jaskuła, 2006; Stępniowski et al., 2014). Also integral geometry tools of the Minkowski functional were considered, showing good correlation with the above mentioned analysis of the whole FFT images (Toccafondi et al., 2014).
In this work, quantitative analysis of the arrangement of the pattern of surface features in oxide films formed on Ni3Al intermetallic alloy on anodization has been carried out. For the first time, advanced whole-space FFT processing based on the concept of regularity ratio spread has been used, supplemented with Minkowski’s functional calculations. These novel image analysis tools could be useful for quality control of the texture resulting from the surface treatment considered, on industrial material. It could also eventually disclose peculiar behavior associated with given texture parameters, affecting the adhesion properties of the material.
Experimental
Sample Fabrication
Samples of Ni3Al intermetallic alloy were prepared as described previously (Stępniowski et al., 2013). The chemical composition of the alloy was the following: 74.8 ± 2.7 at.% of Ni, 24.2 ± 2.7 at.% of Al, 0.6 ± 0.1 at.% of Zr, and 0.3 ± 0.1 at.% of B (Stępniowski et al., 2013). The plates were cut into samples of size 20 mm × 25 mm × 0.5 mm, degreased in acetone and ethanol, and electro-polished by means of a LectroPol-5 device (Struers, Denmark), working with A2 commercial electrolyte at 24 V for 30 s. Next, the samples were rinsed with ethyl alcohol and water, and finally dyed at back and edges such as to provide a flat working surface of ·2.0 cm2.
Anodization of Ni3Al intermetallic alloy was conducted in a double-walled cell with a Pt grid as the cathode. 0.3M citric acid solution made of analytical purity crystalline citric acid, and deionized water was serving as the electrolyte for the anodization. The temperature was maintained constant at either of two values (0 or 30oC) by means of a cooling with circulator thermostat RE105 (Lauda, Germany). The voltage was varied in the range of 2–12 V, with a step of 2 V. After 12 h long first step of anodization at given conditions of temperature and voltage, the formed oxide was chemically removed (etching in 6.0 wt.% H3PO4 with 1.8 wt.% H2CrO4, at 60oC for 60 min), and the samples were anodized again at the same set of experimental conditions as during the first anodization step.
Surface Imaging by SEM
Imaging was carried out by means of a field-emission scanning electron microscope (SEM) Quanta 3D FEG (FEI, USA), collecting the secondary electron signal emerging from 5 kV primary electrons, working in low vacuum mode to minimize possible electrostatic charging due to imaging a dielectric (oxide) surface. The size of the images was 1024 × 883 pixel, with a magnification of 100 kX that corresponded to a scale of 2.837 nm/√pixel.
Image Analysis by Regularity Ratio Spread and Minkowski Parameters
The analysis of SEM images was carried out as detailed elsewhere (Chu et al., 2005). In short, for the regularity ratio spread the FFT map was calculated with ImageJ (NIH, USA) freeware. A Matlab R2008a (Mathworks, USA) routine was used to angularly average the FFT profiles pointing from the center outwards, at 1° spacing, for a length of 200 pixel. The 180 independent profiles were averaged point-by-point into a single profile of mean μ with error bars at ±1 SD σ. Such a radial profile was analyzed to check for the presence of a significant peak (maximum) when this was deviating from the 1/r trend (with r the radial distance) of more than the surrounding error bars. For those cases, the bare regularity ratio R0 was calculated, as the ratio of peak intensity I to its width w, and the corrected regularity ratio R with the correction coefficient required after (Stępniowski et al., 2014). An additional profile was plot for the SE, defined as the point-by-point ratio of SD to mean, σ/μ. After further averaging along this profile, the resulting mean was called the regularity ratio spread, ΔR.
For the Minkowski parameters, with the help of another Matlab routine, the three functional plots of coverage C(ρ), Euler number E(ρ), and boundary length L(ρ) were calculated, as a function of the threshold ρ used to binarize the given image into its B/W counterpart. From these three profiles, single important values have been extracted of Cflex, Emin, and Lmax, corresponding to the flex, the minimum and the maximum of the respective functional (Toccafondi et al., 2014). Both Matlab routines are available as Data Sheet S1 in the Supplementary Material. An example of image treatment and analysis is described for the case of a single specimen in Figure 1.
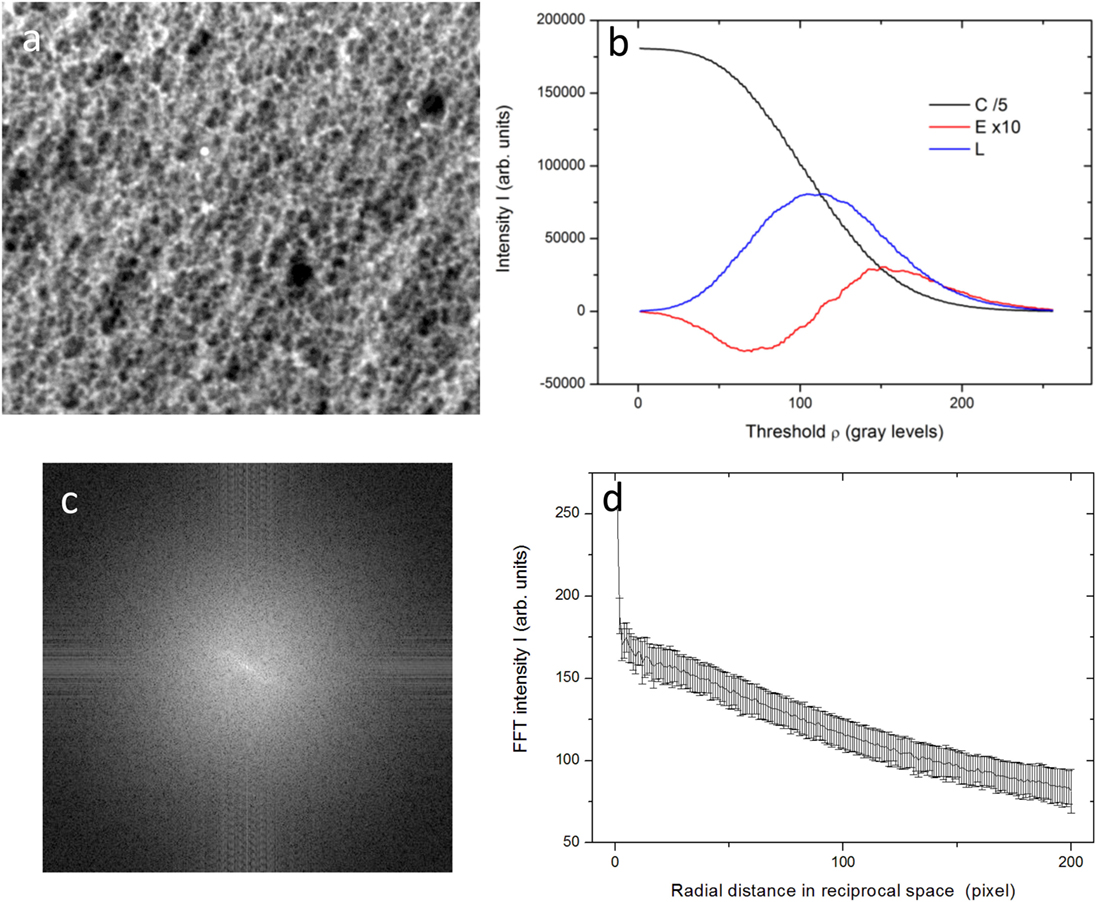
Figure 1. Representative case (0°C, 8 V) for the type of samples and data involved in the analysis: (A) SEM image, (B) Minkowski functionals, from which Cflex, Emin, and Lmax are extracted, (C) FFT map, (D) radially averaged profile of the FFT map, from which the ΔR and if possible R0 and R are extracted [not in this case due to missing peak, for more details, see Toccafondi et al. (2014)].
Results and Discussion
Voltage Set at 0°C
Only for the samples anodized at 2 and 4 V did a peak appear in the angularly averaged profile of the FFT. Thus, only in those cases was the regularity ratio defined. The bare regularity ratio, namely R0, obtained simply as the ratio of peak intensity I to peak width w, turned out to be 0.91 and 1.32 for the case of 2 and 4 V anodization, respectively. Thus, the surface obtained at 4 V seemed more ordered. However, after correction by the factor required for angularly averaged FFT profiles in agreement with (Stępniowski et al., 2014), namely (√n)/A3/2, the order of the two surfaces was inverted, as the resulting R appeared to be 12.1 and 11.5, respectively. Thus, even if very close in scoring, the order in the anodic films seems instead to decrease slightly with increasing anodization voltage V. The missing peak, and thus order, for the even higher V values, seems in agreement with this observation.
Even though there is no defined regularity ratio, i.e., no apparent order, according to Toccafondi et al. (2014) still the uniformity of the surface patterns of pores may be assessed, by means of the regularity ratio spread parameter, ΔR. After calculation, this has been plot in Figure 2A. ΔR happens to be maximum for 12 V, much higher than for all the other cases. Because the higher the ΔR the lower the uniformity in the pattern of pores (Toccafondi et al., 2014), obviously at higher voltage the uniformity of the nanoporous films of Ni3Al oxide is degraded. On the other hand, for all the remaining voltages, the deviations are minor, also considering the error bars, and suggest a minimum value (i.e., maximum uniformity) at intermediate voltages, in the 6–10 V range.
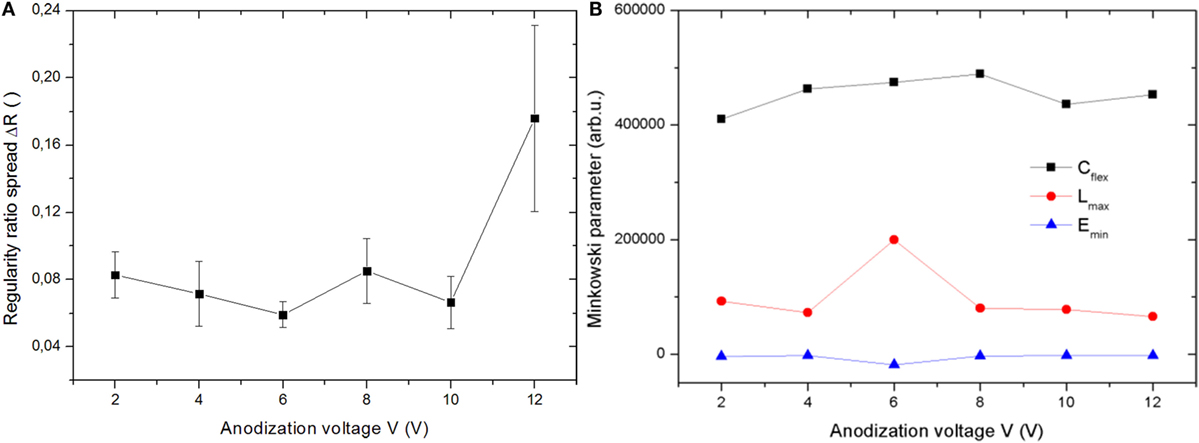
Figure 2. Set of anodizations carried out at 0°C: (A) regularity ratio spread and (B) Minkowski parameters plotted versus the anodization voltage.
For the Minkowski parameters of the 0°C anodization set, the overall results are presented in Figure 2B. All the plot quantities are in arbitrary units. Additionally, in order to make them appear on similar scales, actually the C was divided by a factor 5, whereas the E was multiplied by a factor 10. Here, it is worth reminding shortly the meaning of the involved quantities. C represents the coverage of the pores in the SEM images, where Cflex value of C at flex of the functional plot C(ρ) is the most significant C value, separating the pores from the top of film, so it should be measure porosity. Actually, Cflex in Figure 2B appears not to increase clearly, in fact it is only slightly increasing but roughly constant. However, also the behavior expected for porosity is not clear, according to the existing literature. Most authors observed a decrease of porosity with V for most acids, but, for example, for sulfuric acid, a slight increase was observed, instead (Chu et al., 2005). However, the behavior has been early recognized as a multivariate problem, depending also on several additional operating parameters, such as temperature and anodizing time, and concentration (Sulka, 2008). Additionally, that behavior was observed for pure Al, whereas here we have a different starting metal.
L, and thus Lmax, represents the total length of the boundaries between the pores and the top plane of the oxide film, like a kind of global perimeter. Ideally, Lmax should increase with increasing pore size d, if the pore density stays constant (Toccafondi et al., 2014). Since it is almost constant, it means that the pore density is decreasing on increasing d, i.e., the small pores are probably merging often into the larger ones, when increasing V. This is indeed what we observed on counting the pores during the thresholding (data not shown).
Finally, Emin (Euler connectivity) should be the same as the number of dark objects, i.e., pores. Also, this parameter in Figure 2B stays rather constant over the whole range of V tested, while at higher V, giving larger pore cell size, it would be expected to decrease. However, we are probably in the flat regime explored in the ideal case of perfectly regular pore patterns, as investigated in Toccafondi et al. (2014). In that work, we had separated the effects of a change in pore density (decreasing with increasing cell size) at constant porosity, and, conversely, porosity change (increasing with increasing pore size at constant cell size). However, obviously in most real cases both parameters of porosity and pore density change simultaneously and tend to partly compensate each other. This seems to be especially the case in our alloy plates.
Voltage Set at 30°C
In Figures 3A,B, the counterparts (regularity ratio spread and Minkowski parameters) of Figures 2A,B are presented, for the set of anodizations at the high temperature of 30°C instead of the 0°C one. As a first observation, one can see that the point at 2 V is missing in both cases. Actually, at that relatively low voltage, anodization did not give rise to any oxide film, as confirmed by energy dispersive spectroscopy measurements on the SEM images (data not shown).
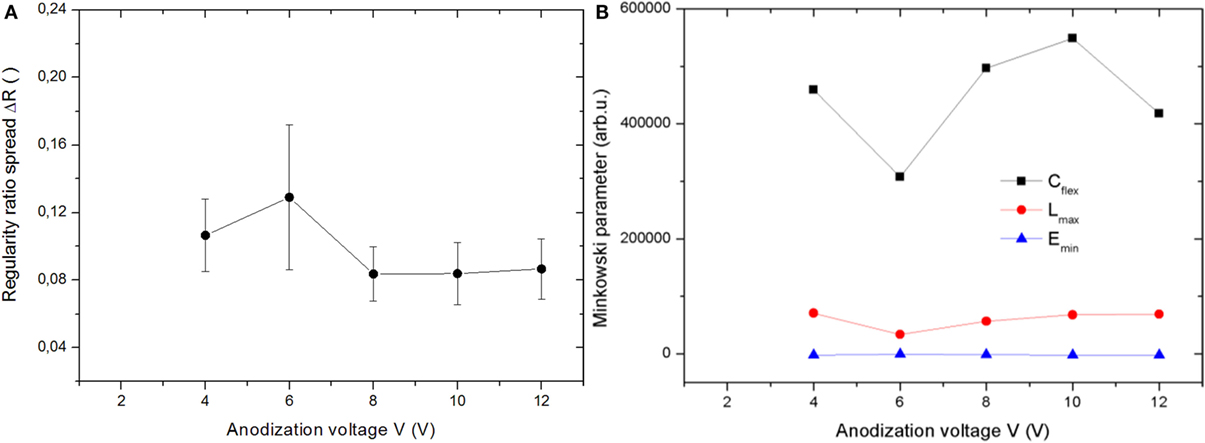
Figure 3. Set of anodizations carried out at 30°C: (A) regularity ratio spread and (B) Minkowski parameters plotted versus the anodization voltage.
For the regularity ratio, no clear peak at all appeared throughout the whole 30°C set. This is consistent with the point that the regularity ratio parameter describes the order in the pattern of pores, and higher temperature works in favor of more disordered patterns. In the end, some degree of order only appeared for the oxide films obtained by anodization at the lower temperature and at the lowest anodization voltages. On the other hand, the regularity ratio spread ΔR is always defined as the quantity and describes the pattern uniformity instead of the ordered arrangement. In Figure 3B, a maximum in ΔR seems to appear at intermediate anodization voltages, around 6 V. However, the error bars are so large, that this apparent difference is probably not significant. We may state that the ΔR is rather constant throughout all the 30°C set. Notably, the absolute values of the parameter are higher, on average (0.08–0.12), than those of Figure 3A (0.06–0.09), except the highest point of the 0°C set, obtained at the highest voltage of 12 V. This means that the anodization at higher temperature generated more widespread (i.e., less uniform) patterns of pores, due to the increased thermal energy available during the processing. This is true with the exception of the above mentioned data point: obviously, at the highest voltage, the electric energy had higher effect in making the pattern non-uniform than the thermal energy had. However, the point at both highest voltage (12 V) and highest temperature (30°C), i.e., the rightmost data point in Figure 3A, was not the highest one of all. For some reason, it appears that the simultaneous excess of both thermal and electrical energy available in the system kind of counteracts and compensate, such as to make the degree of non-uniformity not the highest accessible, but similar to the mean of the high temperature set.
For the Minkowski parameters in Figure 3B, similar to Figure 2B, all three parameters appear to take roughly constant values across the whole V range explored. Different from Figure 2B, in Figure 3B for all the three quantities the same data point appears to deviate mostly with respect to its homologous, which is the pattern obtained by anodization at 6 V.
When comparing the absolute values of the Minkowski parameters between Figure 2B and Figure 1B, it appears that the Cflex is very similar for the 0 and the 30°C sets. The mean ± SD values are 90,905 ± 5621 and 89,233 ± 18,240, respectively, with a relative difference of the means of only ~2% versus a relative error in each set of ~6 and ~20%. Thus, in this respect, no difference is observed in the pattern due to the anodization temperature. For the other two Minkowski parameters, larger differences appear between the two temperature sets, see the red and blue bars in Figure 4. In particular, the mean of Lmax decreases in the 30°C set (of ~39%), and the mean of Emin also decreases, in absolute value, even more consistently (of ~88%). Both quantities seem to suggest that, while porosity (Cflex) is the same at both temperatures, the high temperature favors a decrease of the global pore perimeter and the number of pores themselves. For the latter quantity, at 30°C, the number of black objects (pores) identified by the thresholding procedure is less prominent, and even the character of the surface as being porous is less pronounced, with a shift toward a different type of roughness, more grainy than porous. However, given the broad distribution of values within the two sets (large errors in Figure 4 for the red and even more the blue bars), in all cases, the differences are not statistically significant. In fact, ANOVA with Tukey pair tests made between the corresponding quantities measured for the 0 and the 30°C sets, gave a p of 0.83, 0.14, and 0.26 for Cflex, Lmax, and Emin, i.e., in all cases p > 0.05 (95% level of confidence in the difference).
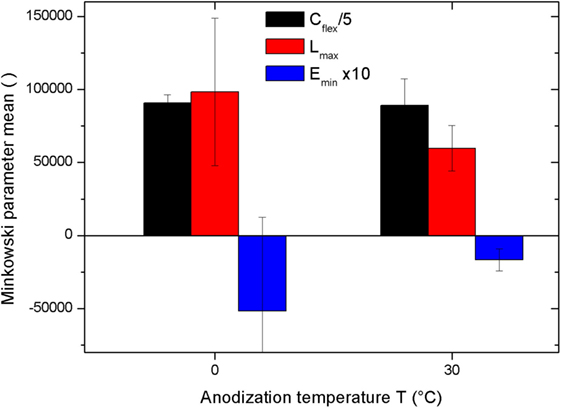
Figure 4. Bar plots of the data for all the calculated quantities, 0 versus 30°C set.
Finally, we wish to point out one limitation of the method used in the present investigation, which is useful to get porosity information from the sample surface but does not allow to get information about pore connectivity. The latter is an important parameter for gas transport from the atmosphere to the non-oxidized sample surface, also in view of possible applications of porous surfaces for, e.g., chemical sensors and biosensors. However, pore connectivity simply cannot be described by surface images such as those obtained in SEM, which can not disclose informations about the possible pore bending and merging/splitting under the top surface.
Conclusion
The reported experiments confirmed that the fabrication of surface oxide coatings with nanoporous pattern is possible for Ni3Al plates at relatively low voltages in an electrolyte with relatively low dissociation constant. With respect to the anodization of pure Al, for these alloys, even a two-step anodization results in low order of the pattern of nanopores, if any. As such, the regularity ratio is in most cases undefined. Nevertheless, the regularity ratio spread is always defined, and can be calculated. This parameter can describe the uniformity of the nanoporous pattern, and can thus be used for a quality control of the fabricated poorly ordered surface oxides. Additionally, further insight in the patterns of nanopores may be given by the Minkowski parameters. Overall, in the ranges explored here, we see a dominant effect of temperature in the uniformity of the patterns, with respect to the anodization voltage. The oxides fabricated at 30°C are less uniform than those fabricated at 0°C, at all voltages but at 12 V, in which case, the 0°C anodized oxide is the least uniform of all.
Author Contributions
WS designed the experiment; GC and MN prepared the samples; MM-D acquired the SEM images; MS carried out the image analysis and drafted the manuscript; KK, PC, WP, and PJ took part in the discussion; ZB critically revised the manuscript and improved it.
Conflict of Interest Statement
The authors declare that the research was conducted in the absence of any commercial or financial relationships that could be construed as a potential conflict of interest.
Supplementary Material
The Supplementary Material for this article can be found online at https://www.frontiersin.org/article/10.3389/fmats.2016.00034
References
ASM International. (2000). ASM Specialty Handbook: “Nickel, Cobalt, and Their Alloys”. (Materials Park, OH: ASM International), 104.
Chu, S.-Z., Wada, K., Inoue, S., Isogai, M., and Yasumori, A. (2005). Fabrication of ideally ordered nanoporous alumina films and integrated alumina nanotubule arrays by high-field anodization. Adv. Mater. 17, 2115–2119. doi: 10.1002/adma.200500401
Das, G., Patra, N., Gopalakrishanan, A., Proietti Zaccaria, R., Toma, A., Thorat, S., et al. (2012). Surface enhanced Raman scattering substrate based on gold-coated anodic porous alumina template. Microelectr. Eng. 97, 383–386. doi:10.1016/j.mee.2012.02.037
Dey, G. K. (2003). Physical metallurgy of nickel aluminides. Sadhana 28(Parts 1 & 2), 247–262. doi:10.1007/BF02717135
Jóźwiak, S., and Karczewski, K. (2009). Influence of aluminum oxides on abrasive wear resistance of Fe-50 at.% Al intermetallic sinters. J. Alloys Compd. 482, 405–411. doi:10.1016/j.jallcom.2009.04.034
Jóźwiak, S., Karczewski, K., and Bojar, Z. (2013). The effect of loading mode changes during the sintering process on the mechanical properties of FeAl intermetallic sinters. Intermetallics 33, 99–104. doi:10.1016/j.intermet.2012.10.003
Nowak-Stępniowska, A. (2015). A review of quantitative arrangement analysis methods applied to nanostructured anodic oxides characterization. Curr. Nanosci. 11, 581–592. doi:10.2174/1573413711666150415225311
Senderowski, C. (2014). Nanocomposite Fe-Al intermetallic coating obtained by gas detonation spraying of milled self-decomposing powder. J. Thermal Spray Technol. 23, 1124–1134. doi:10.1007/s11666-014-0086-1
Stępniowski, W. J., Cieślak, G., Norek, M., Karczewski, K., Michalska-Domańska, M., Zasada, D., et al. (2013). Nanoporous alumina formed by self-organized two-step anodization of Ni 3Al intermetallic alloy in citric acid. Appl. Surf. Sci. 264, 605–610. doi:10.1016/j.apsusc.2012.10.074
Stępniowski, W. J., Michalska-Domańska, M., Norek, M., and Czujko, T. (2014). Fast Fourier transform based arrangement analysis of poorly organized alumina nanopores formed via self-organized anodization in chromic acid. Mater. Lett. 117, 69–73. doi:10.1016/j.matlet.2013.11.099
Sulka, G. D. (2008). “Highly ordered anodic porous alumina formation by self-organized anodizing, book chapter,” in Nanostructured Materials in Electrochemistry, ed. A. Eftekhari (Weinheim: WILEY-VCH Verlag GmbH & Co), 1–116.
Sulka, G. D., and Jaskuła, M. (2006). Defects analysis in self-organized nanopore arrays formed by anodization of aluminium at various temperatures. J. Nanosci. Nanotechnol. 6, 3803–3811. doi:10.1166/jnn.2006.617
Toccafondi, C., Stępniowski, W. J., Leoncini, M., and Salerno, M. (2014). Advanced morphological analysis of patterns of thin anodic porous alumina. Mater. Character. 94, 26–36. doi:10.1016/j.matchar.2014.05.003
Keywords: anodization, self-organization, anodic aluminum oxide, fast Fourier transform, Minkowski functionals, pattern arrangement
Citation: Salerno M, Stępniowski WJ, Cieślak G, Norek M, Michalska-Domańska M, Karczewski K, Chilimoniuk P, Polkowski W, Jóźwik P and Bojar Z (2016) Advanced Image Analysis of the Surface Pattern Emerging in Ni3Al Intermetallic Alloys on Anodization. Front. Mater. 3:34. doi: 10.3389/fmats.2016.00034
Received: 15 March 2016; Accepted: 05 July 2016;
Published: 25 July 2016
Edited by:
Tadeusz Hryniewicz, Koszalin University of Technology, PolandReviewed by:
Ali Eftekhari, National Institute of Arts & Science, USAHugo Ricardo Zschommler Sandim, University of São Paulo, Brazil
Copyright: © 2016 Salerno, Stępniowski, Cieślak, Norek, Michalska-Domańska, Karczewski, Chilimoniuk, Polkowski, Jóźwik and Bojar. This is an open-access article distributed under the terms of the Creative Commons Attribution License (CC BY). The use, distribution or reproduction in other forums is permitted, provided the original author(s) or licensor are credited and that the original publication in this journal is cited, in accordance with accepted academic practice. No use, distribution or reproduction is permitted which does not comply with these terms.
*Correspondence: Marco Salerno, marco.salerno@iit.it