Development and performance of an advanced ejector cooling system for a sustainable built environment
 Paulo R. Pereira
 Szabolcs Varga1
 Armando Carlos Oliveira
- 1Centre for Renewable Energy Research, Instituto de Engenharia Mecânica e Gestão Industrial (INEGI/UP), University of Porto, Porto, Portugal
- 2Department of Mechanical Engineering, Faculty of Engineering, University of Porto, Porto, Portugal
Ejector refrigeration is a promising technology for the integration into solar driven cooling systems because of its relative simplicity and low initial cost. The major drawback of such a system is associated with its relatively low coefficient of performance (COP) under variable operating conditions. In order to overcome this problem, an advanced ejector was developed that changes its geometrical features depending on the upstream and downstream conditions. This paper provides a short overview of the development process and results of a small cooling capacity (1.5 kW) solar driven cooling system using a variable geometry ejector. During the design steps, a number of theoretical works have been carried out, including the selection of the working fluid, the determination of the geometrical requirements, and prototype design. Based on the analysis, R600a was selected as working fluid. A prototype was constructed with two independent variable geometrical factors: the area ratio and the nozzle exit position. A test rig was also assembled in order to test the ejector performance under controlled laboratory conditions and to elaborate a control algorithm for the variable geometry. Ejector performance was assessed by calculation of cooling cycle COP, entrainment ratio, and critical back pressure. The results show that for a condenser pressure of 3 bar, an 80% increase in the COP was obtained when compared to the performance of a fixed geometry ejector. Experimental COP values varied between 0.4 and 0.8, depending on operating conditions. Currently, the cooling cycle is being integrated into a solar driven demonstration site for long-term in situ assessment.
Introduction
Most worldwide existing cooling systems are driven by electricity. Their increase over the last years is so dramatic that, in many European countries the peak of electricity consumption is switching from winter to summer. In order to reverse this tendency, the development of efficient and reliable thermally driven cooling systems can be a logical solution, especially in the context of supplying the necessary heat from readily available solar collectors. Among alternative technologies, ejector cooling has been studied over the last two decades by a number of researchers as recently reviewed by Chen et al. (2013). In general, ejectors are simple in construction, have a low initial cost, and can be operated using a wide range of refrigerants when compared to alternatives such as an absorption refrigerator. Nevertheless, it has been realized by many researchers that it is necessary to improve performance in order to make ejector cooling economically more attractive.
As most thermally driven cooling cycles, ejector refrigeration is strongly influenced by thermodynamic properties of the working fluid and the working parameters such as operating temperatures and pressures. The influence of the working conditions on ejector cooling cycle performance is relatively well established. Several experimental (Chunnanond and Aphornratana, 2004; Selvaraju and Mani, 2006; Yapıcı et al., 2008; Zegenhagen and Ziegler, 2015) and theoretical works have been carried out (Huang et al., 1999; Hemidi et al., 2009; Varga et al., 2009a; Dennis et al., 2015) to assess the effect of generator, evaporator, and condenser conditions. Refrigerant selection is also an important factor to assure stable cycle operation. A considerable number of fluids have been applied in previously published works, including water, chlorofluorocarbons (CFCs), hydrochlorofluorocarbons (HCFCs), and other types of refrigerants. Comparative studies are however limited to theoretical analyses, such as in Sun (1999), Cizungu et al. (2001), and Gil and Kasperski (2015). Some recent studies that involved the analysis of hydrocarbon refrigerants for ejector cooling (Roman and Hernandez, 2011; Varga et al., 2013c), such as R600a, concluded that they provide high performance; however, precautions should be taken due to their flammability.
The geometrical design of ejectors (for a given working fluid and cooling capacity) has a strong dependence on the operating conditions (Yapıcı et al., 2008; Varga et al., 2009b). Consequently, an ejector with fixed geometry only works with good performance in a rather limited range of operating temperatures/pressures (near design condition). To overcome this problem, the concept of a variable geometry ejector (VGE) emerged. Sun (1996) was one of the first authors analyzing geometrical requirements for an ejector using water as working fluid. More recently, Varga et al. (2013c) carried out a sensitivity analysis of ejector dimensions to upstream and downstream temperatures/pressures for six different refrigerants. Dennis and Garzoli (2011) presented research results of a VGE using R141b under variable operating conditions. In all previously mentioned works, it was concluded that there is an urge to develop a VGE that can operate at high performance, especially when driven by solar heat (Dennis et al., 2015). Potential technical implementations for controlling the area ratio (the ratio between the constant area section to the primary nozzle section) can be found in Kim et al. (2006) for air; in Elbel and Hrnjak (2008) for carbon dioxide (R744); and in Ma et al. (2010) and Varga et al. (2011) for water as the working fluid. The use of air as a working fluid has very limited application in refrigeration. Water has been frequently applied in ejector systems; however, it leads to relatively low coefficient of performance (COP) values for moderate generator temperatures, which is the case when using low-cost solar collectors as primary heat source (Varga et al., 2013c).
Numerical studies with R600a (Pridasawas and Lundqvist, 2007; Varga et al., 2013a), have shown that a good cooling cycle performance can be achieved, even for moderate generator temperatures (80–90°C). Although R600a is already widely used in domestic refrigerators, because of the flammable nature of R600a, there are only a very limited number of experimental investigations regarding (fixed geometry) ejector cooling (Butrymowicz et al., 2012, 2014). The present work summarizes the major development steps and a summary of the performance results with a VGE prototype using R600a as working fluid. The ejector geometry is actively controlled by changing the area ratio through a movable spindle and by changing the nozzle exit position (NXP). The control algorithm uses pressure readings at the upstream and downstream sides of the ejector. The characteristics of a solar driven air-conditioning prototype and demonstration facility using the developed VGE cycle is also presented.
The Solar Driven Ejector Refrigeration Cycle and its Performance
A simple solar driven ejector refrigeration system is presented in Figure 1. The ejector cycle subsystem employs the following major components: a high pressure generator, a low pressure evaporator, an ejector, a condenser, a circulation pump, and an expansion valve. The role of the generator is to transfer a sufficient amount of thermal energy coming from the solar thermal subsystem to the working fluid. A part of this thermal energy is used as a driving force to entrain and recompress the secondary stream coming from the evaporator, where the cooling effect takes place. In order to complete the cycle, the heat content of the working fluid is released to the environment in the condenser. After condensation, part of the refrigerant is returned to the generator by a pump, increasing its pressure to the generator pressure, and part is returned to the evaporator through an expansion valve. The solar collector subsystem is also shown in Figure 1. It generally consists of solar thermal collectors in series or parallel configuration, a storage tank, and a circulating pump. Fittings, valves, and control are not indicated in the diagram. An auxiliary heater can be applied in the storage tank so that energy can be supplied to the generator if necessary during periods when solar radiation is not available, but there is need for cooling.
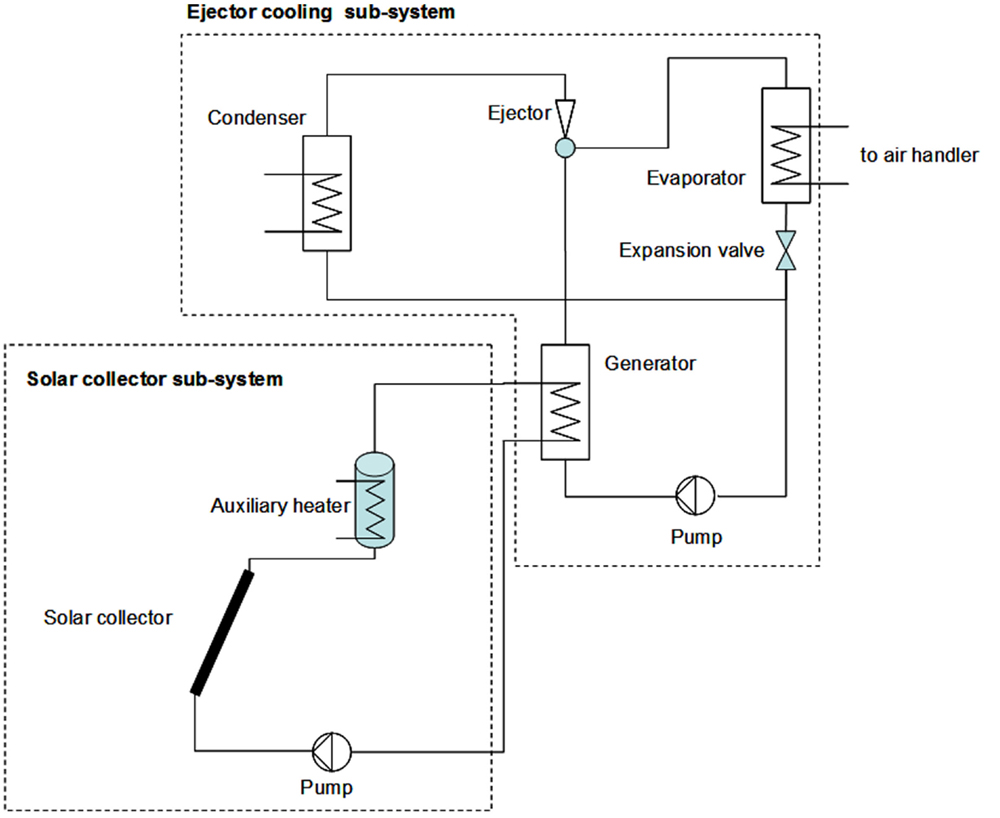
Figure 1. Simplified diagram of a solar driven ejector cooling system with its main components.
The key component of the cycle is the ejector (see Figure 2). In the ejector, the motive or primary fluid coming from the generator (g) enters the primary nozzle at high pressure and low velocity. After expansion, it leaves the nozzle exit section with high kinetic energy and low static pressure. This draws the low pressure (secondary) fluid through the suction chamber coming from the evaporator (e) of the cooling cycle where the refrigeration effect takes place. The strong shear between the motive and secondary jet leads to the acceleration of the secondary fluid. Under normal operation, the secondary fluid starts mixing with the primary flow after it gets choked. The condition when the secondary fluid reaches Ma = 1 is often referred to as “double choking” operation. The mixing process after the primary nozzle exit plane is rather complex due to the interaction between the two fluid streams and the ejector wall. The motive fluid flow can be characterized by a series of oblique/normal shock waves called the shock train (Bartosiewicz et al., 2006; Bouhanguel et al., 2011). During this process, the static pressure of the primary stream tends to gradually increase until it levels with the pressure of the secondary fluid. After the mixing process is completed, a final shock occurs somewhere in the constant area section or in the beginning of the diffuser depending on operating conditions. The resulting flow becomes subsonic; the pressure is then further increased in the diffuser toward the ejector exit. The exit pressure is mostly determined by the condenser conditions (Tc) of the ejector refrigeration cycle.
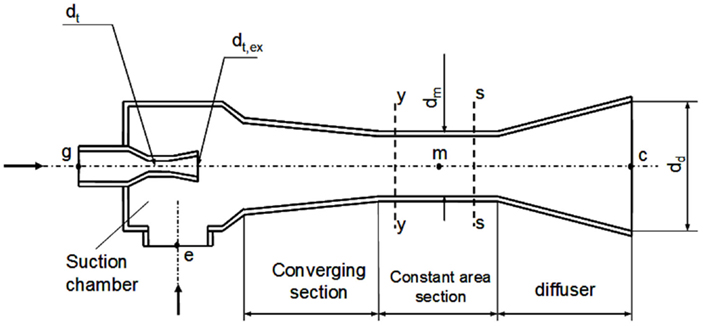
Figure 2. Cross section view of a typical ejector.
One way to measure ejector performance is by the entrainment ratio (λ), defined as:
For a given cooling load, the required evaporator flow rate is approximately constant. The higher the entrainment ratio is, the lower the flow rate on the primary nozzle side is, and consequently the lower the required generator energy input is. The entrainment ratio is related to the COP of the cooling cycle by the following relationship:
According to the variables present in Eq. 2, ejector performance is affected by both working fluid properties and operating conditions. The instantaneous (or steady state) performance of the solar collector array can be assessed by the solar collector efficiency (ηcoll) given by Pridasawas and Lundqvist (2007):
The reader should note that Eq. 3 represents a simplified assessment of solar collector performance, assuming no variability in the climatic conditions. For the evaluation of the long-term performance of solar thermal systems, the energy balance over the solar collector subsystem should be integrated with time using local climate data. This was out of the scope of the present work. The values of the optical efficiency [FR(τα)] and the loss coefficient (FR UL) in Eq. 3 strongly depend on the collector design and orientation. The steady state collector subsystem performance can be characterized by the heat ratio (HR) as:
In Eq. 4, QA is the heat supplied by the auxiliary heater. For a solar fraction of 1, HR is identical to the collector efficiency in Eq. 3. Typical solar fractions in solar heating/cooling applications are in the range of 0.5–0.7. By writing an energy balance over the solar and ejector subsystems and neglecting the energy required for fluid transport, the global system efficiency (ηsys) can be written as:
Working Fluid Selection and Geometrical Characterization of the Ejector
An analysis of the ejector performance with six environmentally friendly working fluids was carried out, based on the well-known constant pressure mixing ejector theory. This theory has been applied by several researchers over the last two decades (Eames et al., 1995; Huang et al., 1999; Yu et al., 2006; Varga et al., 2013c). In order to describe the fluid flow inside the ejector, the one-dimensional flow domain was divided into a number of physical and hypothetical sections including (see Figure 2): primary nozzle throat (dt), primary nozzle exit (dt,ex), hypothetical throat where the secondary fluid gets choked (y–y), mixing plane (m) where the mixing process is completed, transversal shock wave section (s–s), and diffuser outlet (c). A number of assumptions were made in order to solve the governing equations. For details of these assumptions, the reader is referred to Varga et al. (2013c). The model was implemented in Engineering Equation Solver (EES) (F-CHART, USA) software and validated with published experimental results. Typical inputs for the analysis were the refrigerant type, generator, evaporator and condenser temperatures, and cooling capacity. Typical outputs of the simulations were the ejector cycle performance indicators (λ, COP), ηsys, and the geometrical factors that allow the ejector to work under critical operation, including the diameters of the nozzle throat (dt) and constant area section (dm), as well as the corresponding area ratio .
The entrainment ratio as a function of generator temperature (for constant Tc and Te) is shown in Figure 3, for the six selected working fluids. It can be seen that water performed considerably worse than any of the other refrigerants. For example, for low generator temperatures (Tg = 80°C), the entrainment ratio for R600a was approximately five times larger than for water. A λ of 0.25, considered by the authors as a minimum acceptable performance, was obtained for Tg as high as 125°C. Based on the results for the entrainment ratio, R600a seems to be a good choice for the working fluid in the generator temperature range presented. Figure 4 shows the system efficiency for R600a and R152a using three types of solar collectors with typical efficiency curves. It can be seen that R152a performs always better than R600a, when a flat plate solar collector is considered. The highest system performance was obtained for vacuum tube collectors. In this case, the relative performance of the two fluids was inverted. The maximum value of at a Tg of 110°C was obtained for R152a, while in the case of R600a the system efficiency was 0.29 at a generator temperature 122°C. As mentioned before, the optimal area ratio considerably changes with the operating conditions. As an example, results of rA for varying Tc in the range of 24–40°C are shown in Figure 5. It can be seen from the figure that the area ratio required for the ejector to operate in critical mode decreased with Tc in a non-linear manner. The sensitivity of rA on the downstream conditions was again the highest for water. The results indicated that a one-degree increase in the condenser decreased the corresponding area ratio about 5.3% on average. Considering the remaining four refrigerants, it was found that the sensitivities were in the range of 3.5%. For more details, the reader is referred to Varga et al. (2013c).
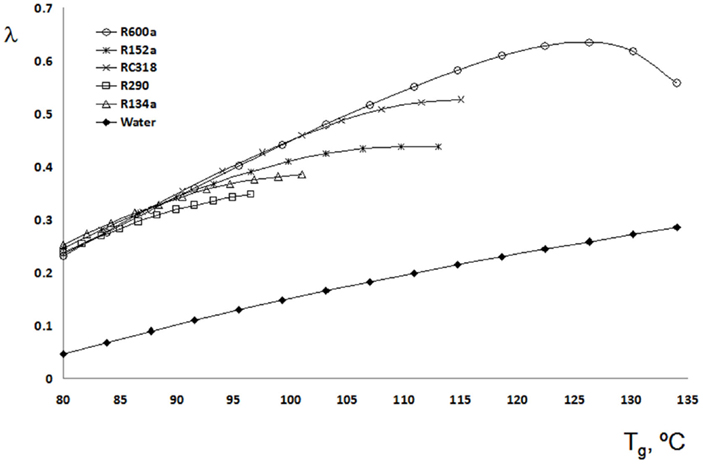
Figure 3. The effect of generator temperature on the entrainment ratio for the six selected working fluids and for constant Te= 10°C and Tc = 35°C.
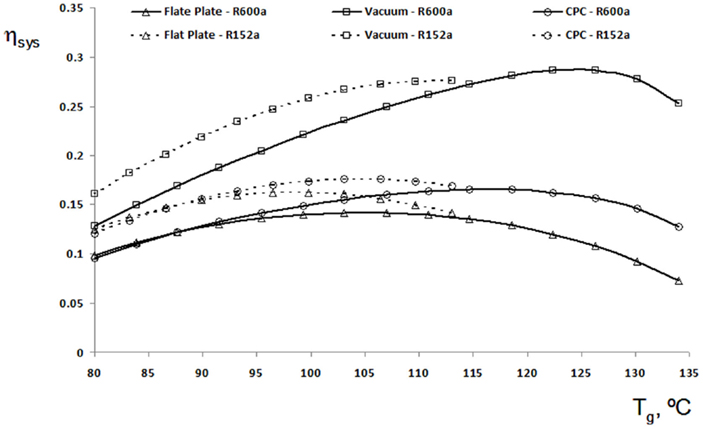
Figure 4. System efficiency for three types of solar collector for R152a and R600a (Te= 10°C and Tc = 35°C).
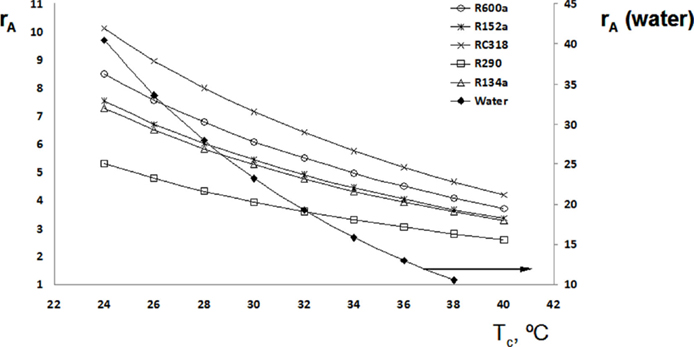
Figure 5. Area ratio as a function of condenser temperature with Tg= 90°C and Te = 10°C.
Based on this analysis, it was concluded that an ejector using R600a can operate with good performance for a wide range of operating conditions under moderate pressures, and thus can be an attractive choice for a small capacity air conditioner running on solar thermal energy, as long as special attention is paid to the fluid flammability. Thus, R600a was selected for the developed system.
Variable Geometry Ejector Design
The design of the VGE was based on CFD modeling of the ejector flow. Two of the most important geometrical factors affecting ejector performance were implemented in the model as variable features: the area ratio (rA) by using a spindle upstream the primary nozzle throat and the NXP as shown in Figure 6. The baseline geometry for both operating fluids was determined by using the 1D model discussed in the previous section. Typical inputs for the model were the refrigerant properties, generator, evaporator and condenser temperatures, and cooling capacity. The most important design parameters and the resulting ejector dimensions are summarized in Table 1. A commercial package – ANSYS FLUENT 12 – was used to simulate the fluid flow in the VGE. In FLUENT, the space domain is discretized into a number of small, non-overlapping control (finite) volumes and surrounding nodal points. For each finite volume, each PDE is transformed into a set of algebraic equations using the Gauss divergence theorem and then simultaneously solved. In each simulation, the solution was obtained in two steps. In the first step, unsteady terms were kept and the solution was obtained using a time marching scheme. In the second step, final convergence was obtained using a FLUENT’s coupled implicit algorithm. Iterations were performed until the relative residuals for each flow variable were ≤10−6. Mesh sensitivity tests indicated that a structured mesh with approximately 20,000 finite volumes resulted in grid independent ejector performance indicators. For more specific details of the developed CFD model including the assumptions, the reader is referred to Varga et al. (2013a).
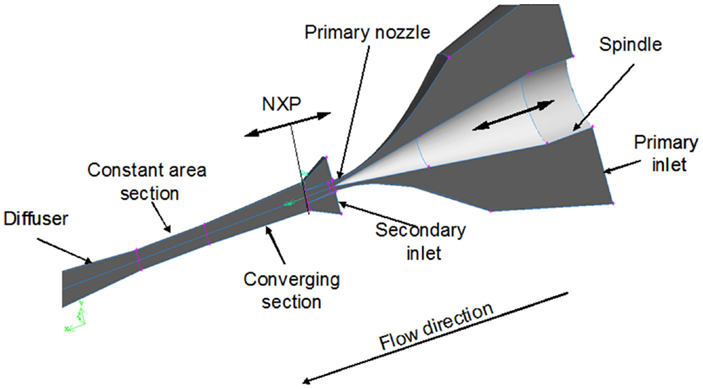
Figure 6. Representation of the flow domain indicating the location of the movable spindle and nozzle exit position.
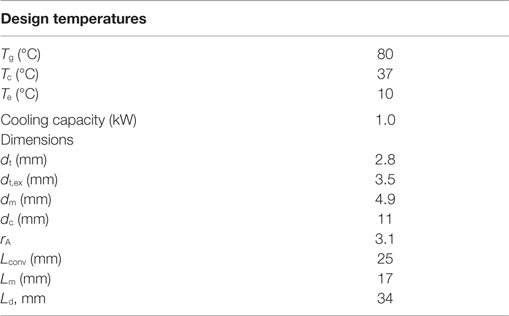
Table 1. Design conditions and baseline ejector geometry for the R600a ejector.
Figure 7 shows the influence of the spindle position on the Mach number distribution (Ma > 1) inside the ejector tail, under the same downstream and upstream conditions. For a spindle position of 1 mm (Figure 7A), the primary flow underwent a strong shock immediately after nozzle exit and correspondingly its pressure increased. In fact, the secondary fluid was not entrained; the primary fluid left the ejector through the secondary inlet, leading to ejector failure. By moving the spindle backwards to 2 mm, the shock train downstream the NXP was less intense; however, the secondary flow remained unchoked, with pc higher than its critical value. Similarly, weaker shock waves can be observed for a SP of 4 mm; however, in this case, the secondary flow gets accelerated to the speed of sound as shown in Figure 7C. The mixed flow became subsonic in the beginning of the diffuser. The ejector operates at near optimum. Further opening of the spindle resulted in stronger shock waves downstream the nozzle exit, as well as in a stronger final wave in the diffuser. In this case, the back pressure was lower than its critical value, and thus the ejector was not at its optimal operation point. Combining the results of optimal SP for different generator temperatures can be used as the basis for optimizing ejector operation under variable operating conditions, as shown in Figure 8. The ejector performance is depicted as a function of the critical back pressure (critical operation line) under different conditions. Continuous lines represent the entrainment ratio obtained as a function of Tg for a given spindle position, while dashed lines connect the points with the same generator temperature. In order to interpret Figure 8, the reader should notice that the left hand side of each line represents a situation when the ejector operates in double choking mode, while the right hand side corresponds to the operating conditions resulting in ejector failure. It can be seen from the figure that the ejector performance is successfully controlled along the entire spindle path (1–7 mm). As an example, consider the conditions following the dashed arrows in Figure 8. For example, the condenser pressure corresponding to 31°C is 415 kPa. For a generator temperature of 75°C, the optimal spindle position was somewhat smaller than 4 mm with an entrainment ratio of 0.37. Under the same conditions, a more advanced spindle position (e.g., 2 mm) would result in ejector failure while a more open spindle would decrease λ. It can also be seen that ejector performance could be improved by simultaneously moving SP to 2 mm and increasing the generator temperature to approximately 80°C. By positioning the spindle to 4 mm leads to an increase in the COP of about 40%, when compared to a fixed geometry design (no spindle), which can be considered as very significant.
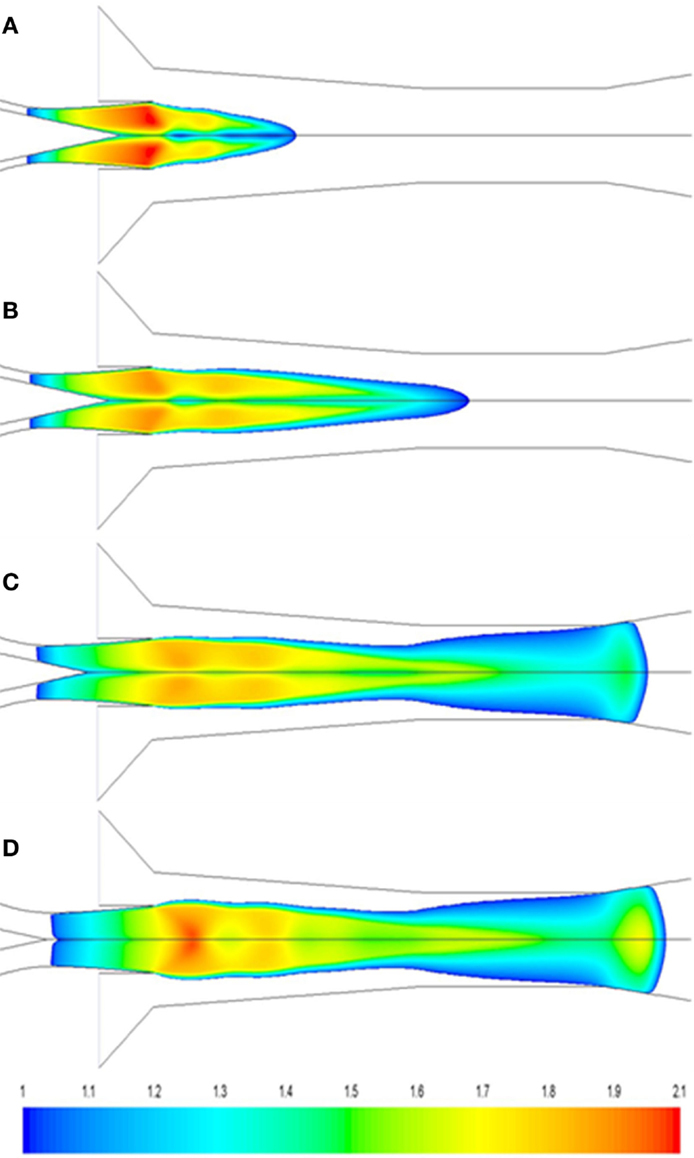
Figure 7. Mach number distribution (Ma > 1) inside the VGE for Tg= 85°C, Tc = 31°C, and spindle positions: (A) 1 mm, (B) 2 mm, (C) 4 mm, and (D) 8 mm.
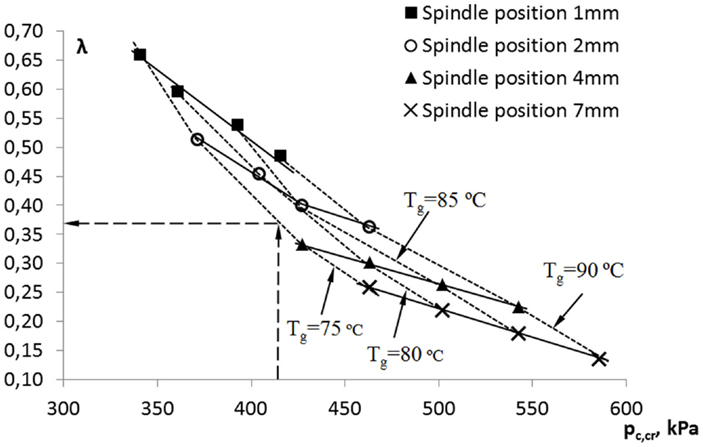
Figure 8. Ejector operation in critical mode for different condenser pressures, generator temperatures, and spindle tip positions.
Figure 9 shows the variation of λ with the NXP and the corresponding increase in ejector performance compared to an NXP of 0 mm (see Figure 5). The simulations were carried out for generator design conditions. It can be seen that λ increases with NXP from 0 mm until 10 mm, providing the highest entrainment ratio of 0.21. Beyond this point, λ starts to decrease. The maximum variation of λ with NXP was as high as 60%, which can be considered significant.
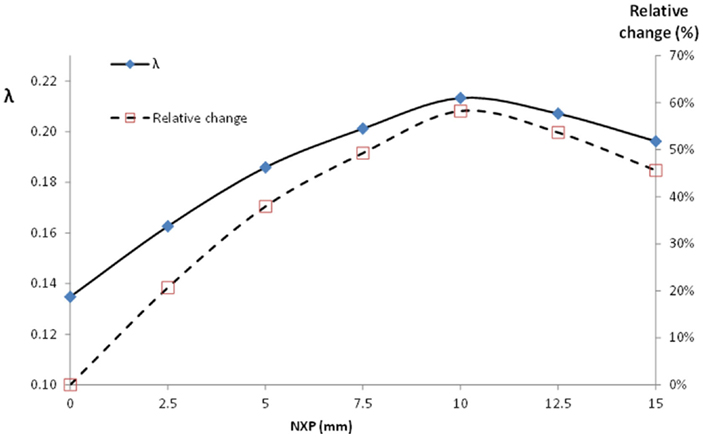
Figure 9. The influence of NXP on the entrainment ratio.
Experimental Determination of the VGE Performance Under Laboratory Conditions
After the geometrical optimization of the flow path and spindle profile, an experimental VGE prototype was constructed. In the prototype, SP and NXP can be independently adjusted, allowing for a full adaptation to the operating conditions. The desired positions can be adjusted by two actuators driven by small stepper motors. Both SP and NXP are considered 0 at a fully closed position, when there are no free cross sections for the primary and secondary flow, respectively. The ejector prototype was integrated into a test rig composed by the ejector refrigeration cycle with the VGE and three sub-cycles. These sub-cycles are: (i) high temperature generator; (ii) low temperature evaporator; and (iii) heat dissipation condenser sub-cycle, as shown in Figure 10. The objective of the three sub-cycles (i–iii) was to simulate operational conditions, so that the heat transfer in the generator, evaporator, and condenser can be independently controlled. For more details of the individual test rig components, the reader is referred to Pereira et al. (2014).
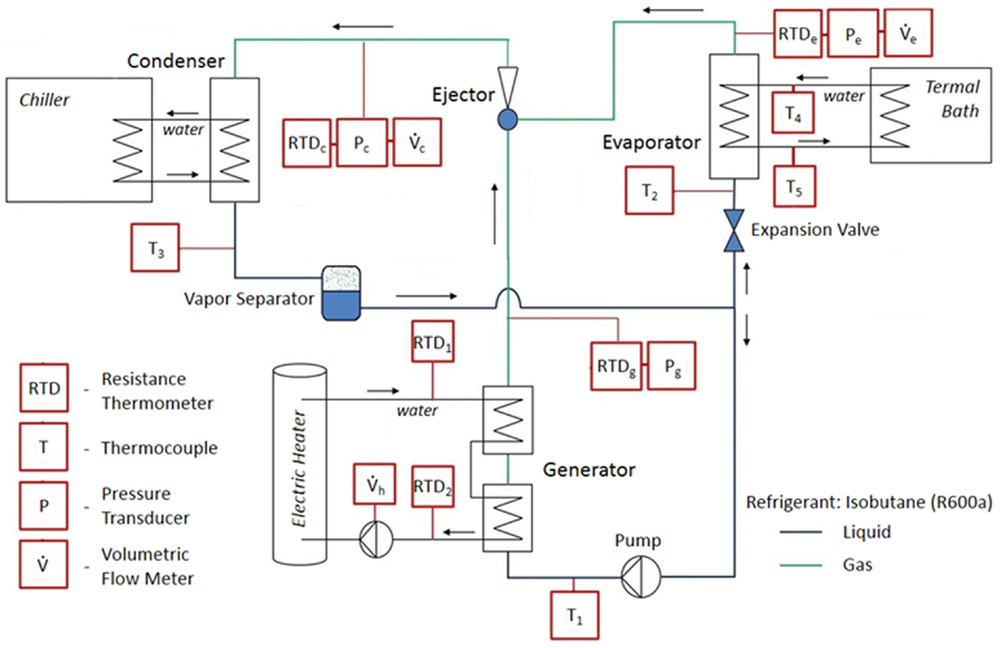
Figure 10. Schematic drawing of the experimental test rig.
In order to monitor the system variables along the ejector cycle, a number of instruments were installed including: pressure transducers (Kobold, Germany) with 6 and 25 bar measuring range and an accuracy of 0.5% on the full scale; calibrated T-type thermocouples (Tecnisis, Portugal) with a maximum error of 0.35°C; RTDs (KIMO, France) with 0–100°C range and an accuracy of ±0.08°C; and two variable area flow meters (Kobold, Germany) with an accuracy of 2.2% on the full scale. Additionally, the water temperature at the inlet and outlet of both the generator and the evaporator sub-cycles were measured in order to evaluate the global performance of the system. The water flow rate through the generator was monitored with a high precision electromagnetic flow meter (ABB, USA) with an accuracy of 0.5% of the read value. On the evaporator side, the water flow rate was constant (13.3 l/min) and it was manually determined by measuring the displaced water volume with a chronometer (estimated error of 3%). For the locations of the installed sensors, the reader is referred to Figure 10. The data acquisition system integrated a data logger module (HP Agilent 34970A, USA) connected to a personal computer. A control and monitoring application was developed in LabVIEW 2011 (National Instruments, USA). The data were sampled every 10 s and saved in a text file for data analysis, carried out in MS Excel and EES (F-Chart, USA).
Three sets of experiments (A–C) were carried out to demonstrate the performance benefits of the VGE, based on operating conditions, spindle position, and NXP, as shown in Table 2. In the first set (A), the spindle position was varied in a range of 3.75–5.5 mm. During these tests, the generator and thermal bath temperatures were maintained at 85 and 15°C, respectively. NXP was set to 3 mm, which is the position resulting in the lowest evaporator pressure for a closed expansion valve. In the second experimental set (B), SP was fixed at 7 mm and NXP was varied from 0 to 15 mm. In these runs, generator and thermal bath temperatures were 71 and 15°C, respectively. In the third set (C), the experimental conditions were identical to set B, with the difference that SP was reduced to 6 mm. In order to make sure that both SP and NXP are in the correct position during each run, both variables were set to 0 (fully closed) and then retracted to the desired set points using the stepper motors. Each experiment started when the temperature of the working fluid at the primary inlet of the ejector reached steady state, considering a superheat of 5–15°C. At the outlet, the condenser pressure (temperature) always started below the critical pressure (temperature) by adjusting the condenser temperature with the water chiller in the beginning of the test run, and it was allowed to slowly increase beyond pc,cr. This way, the entire operating curve of the ejector could be determined in a single run, identifying double choking, critical operation, and single choking regimes. The expansion valve was adjusted to set an evaporator pressure of about 2 bar.
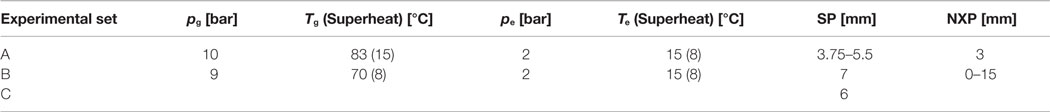
Table 2. Working conditions during each set of experiments.
Influence of the Spindle Position on Ejector Performance
The current section presents the discussion of the experimental results related to the influence of the spindle tip position on the VGE performance (set A). Operating curves were experimentally determined for each spindle position within the considered range and each pc,cr was computed. Figure 11 shows COP as a function of the condenser pressure for different spindle positions. The points indicated on the graph actually correspond to the critical conditions (see Figure 8). This representation allows to identify the effect of SP on both COP and critical back pressure simultaneously for constant Tg and Te. The critical operational line represents the highest possible COP that can be obtained for the ejector, as a function of the condenser pressure, and is also indicated. Looking at Figure 11, one may conclude that for the considered range, an SP of 3.75 mm results in optimal operation (maximum performance). However, as the spindle closes, critical back pressure decreases. These two characteristics allow for the optimization of the VGE SP control. Condenser pressure usually depends on the climatic conditions and it varies with time. For instance, considering a condenser pressure of about 3.65 bar (about 26°C condenser temperature), the spindle position that resulted in optimal operation conditions was 5.25 mm, ensuring critical operation with a COP of 0.5. If the condenser pressure decreased about 0.65 bar (condenser pressure of 3 bar, about 20°C condenser temperature), the optimal operation condition corresponding SP was 4.00 mm, and this corresponds to a COP improvement of about 70%. Therefore, SP can be tuned as a function of the condenser conditions, resulting in an optimum COP.
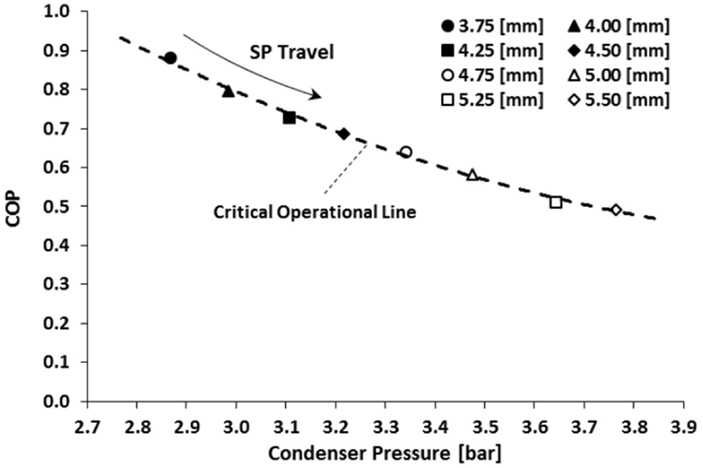
Figure 11. Experimentally determined COP as function of the condenser pressure for different SP (set A).
Influence of the Nozzle Exit Position on Ejector Operation
This section summarizes the experimental results obtained with the second set of experiments (set B), where the influence of NXP on ejector performance was studied. Figure 12 presents the results for the ejector COP, λ, and cooling capacity in double choking condition, function of the NXP. Analyzing the data, one may note that both performance parameters and also cooling capacity show a maximum at NXP = 7.5 mm. The optimum values were 0.32, 0.39, and 1.65 kW for COP, λ, and cooling capacity, respectively. For all positions of the nozzle exit, primary mass flow rate remained essentially constant, with an average value of 15.8 g/s and a coefficient of variation <6%. On the other hand, the secondary mass flow rate seems to be strongly influenced by NXP, and presented an evolution similar to the other performance parameters. Nevertheless, one may also observe that in a wide range of NXP (5–10 mm), the variation of the ejector performance was small. For example, when the exit nozzle traveled from 7.5 to 5 mm, the variation of all the parameters was within 3%. When NXP varied from 5 to 2.5 mm, the decrease in all the performance parameters was as high as 27%. Similarly, when NXP varied from 7.5 to 10 mm, the performance of the ejector decreased about 3%. When the nozzle exit traveled from 10 to 12.5 mm, the performance loss increased to 12%. Therefore, it was concluded that the optimal NXP was somewhere between 5 and 10 mm. It should be noted, however, that this finding needs confirmation for a range of generator and evaporator conditions.
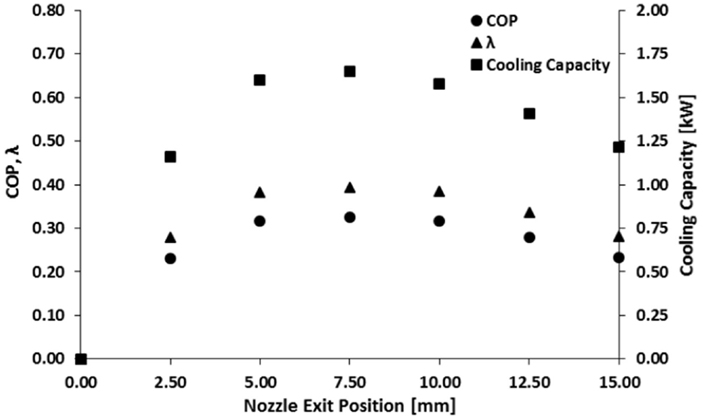
Figure 12. Performance parameters and evaporator cooling capacity at different NXP (set B).
Interaction of NXP and SP on the Ejector Performance
Applying the same methodology to set C, similar tendencies were found for the ejector behavior. COP and λ presented the same evolution as in set B, but with an average increase of 14%. Figure 13 shows the critical operational map for a SP of 7 and 6 mm as a function of condenser pressure and NXP. It is possible to observe that a COP improvement is obtained with the SP displacement. Regarding evaporator cooling capacity, the experimental conditions in set C resulted in similar values to set B, with an average deviation <0.02 kW and with a coefficient of variation below 5%. Also, for each NXP, the secondary mass flow rate values were near the ones verified in set B. Such as for set A, for a given NXP, closing the SP resulted in a decrease of the primary mass flow rate, with an average decrease of about 2 g/s. This way, with a SP of 6 mm, the NXP optimum range was kept between 5 and 10 mm, with a performance improvement due to the decrease in the primary flow rate (see Eq. 1). Looking at the data in Figure 13, one may note within the NXP range tested, pc,cr was lower nearer to a closed spindle position. For example, for NXP = 5 mm, the reduction of the critical back pressure was higher than 0.2 bar. Since generator and evaporator conditions were almost identical, this difference can be associated with the displacement of the spindle alone and is in agreement with the numerical simulations and the experimental data in Section “Influence of the Spindle Position on Ejector Performance.” The more closed the SP is, the lower the critical back pressure is, considering constant generator and evaporator conditions and NXP position.
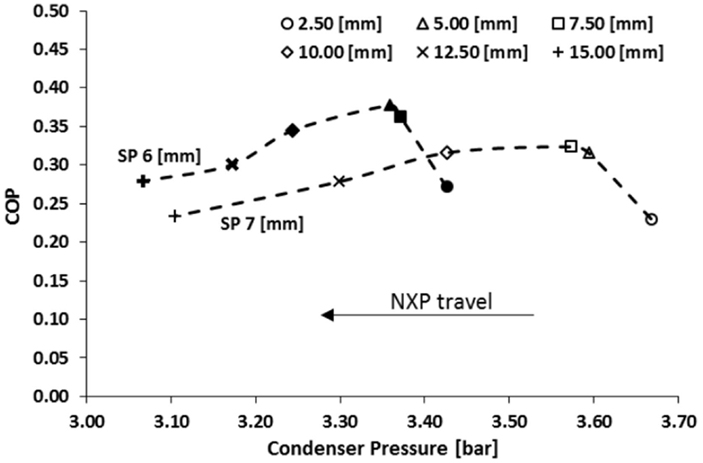
Figure 13. Influence of the NXP on the COP and critical back pressure for two different spindle positions (sets B and C).
Development of a Test and Demonstration Facility
Besides technological issues, there is a lack of sufficient know-how on how to integrate thermally driven solar cooling systems into buildings, especially in the residential sector where small capacity units are needed. In order to overcome this barrier, a solar driven ejector cooling test and demonstration facility (TDF) is under development. The TDF is designed in such a way that it can be cooled during the hot days (summer) and heated during the winter using solar energy. The TDF is composed by: (i) a solar collector field; (ii) the VGE cycle; (iii) the thermal energy distribution (TED) system; (iv) air-conditioned space; and (v) an equipment room, as shown in Figure 14. The VGE cycle is essentially identical to the unit tested under laboratory conditions. All the other components were designed to match the energy requirement of the ejector. The floor area of the air-conditioned space and the collector field were designed based on dynamic simulations using the TRNSYS 16 software with typical meteorological data (TMY) for Porto, where the TDF is installed. Based on the results, a 15 m2 space was constructed using prefabricated light weight composite sandwich panels, with window and door facing south as shown in Figure 15. The solar field is composed by four evacuated tube solar collectors (BAXI AR30), connected in series, with a total area of 17 m2, providing a heating capacity of 7.5 kW at an outlet temperature of 85°C and 72% efficiency, with an incident solar radiation of 800 W/m2. The heat exchange between the evaporator of the VGE cycle and the air inside the air-conditioned space is provided by a Daitsu FSTD 2-pipe cabinet fan coil with a rated cooling capacity of 3.1 kW. The heat transfer fluid is water. The dissipation unit placed outside the building is a Unitermos fan coil water-to-air unit from BAXI, with a rated capacity of about 55 kW. A 3D model of the TDF is shown in Figure 16.
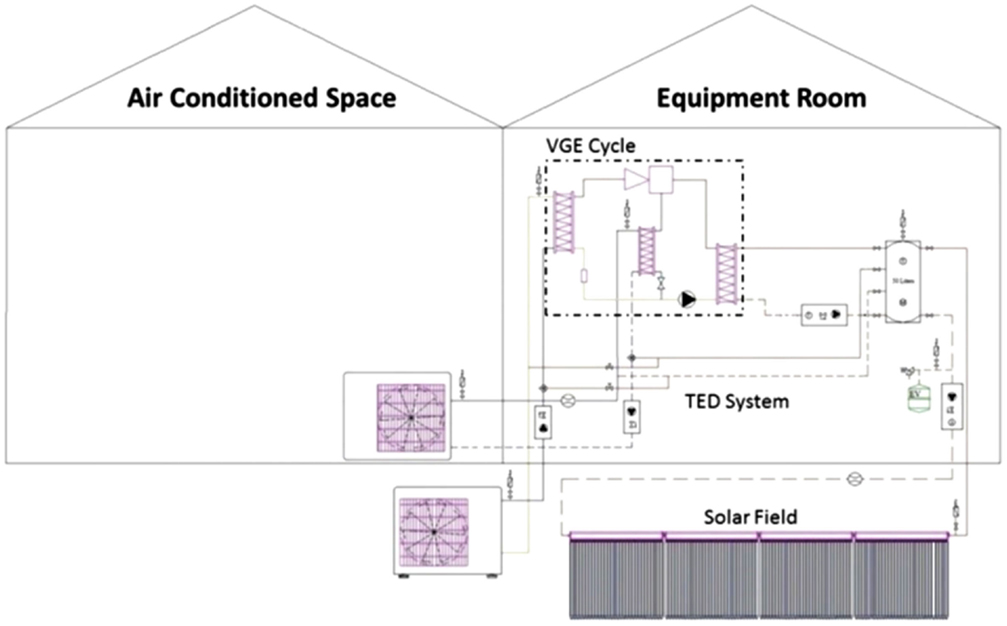
Figure 14. Schematic representation of the test and demonstration facility.
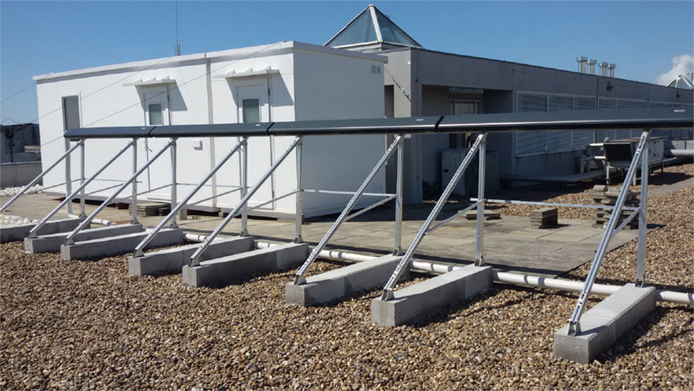
Figure 15. Photo of the south facing facade of the air-conditioned space and equipment room.
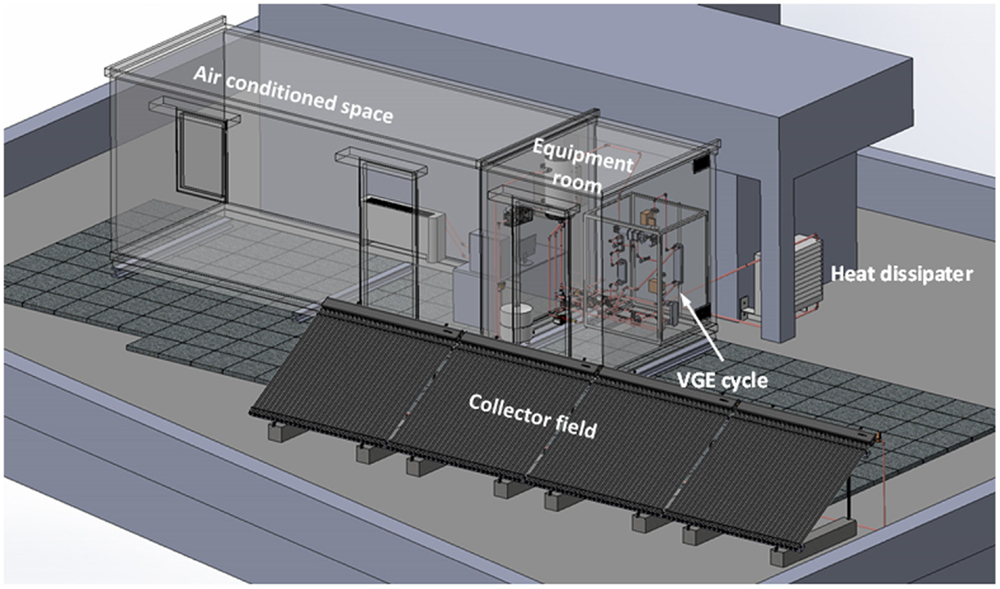
Figure 16. 3D representation of the installation.
The construction of the TDF is actually at 80%, and it is expected to be operational in the summer of 2015. The TDF will be instrumented using flow meters, temperature and pressure sensors. Instantaneous system variables, such as collector efficiency, cooling COP, cooling power, heating power, indoor temperature, environmental conditions (e.g., ambient temperature, solar radiation), and time integrated performance indicators (e.g., energy removal in the summer, heating energy in the winter) will be monitored so that long term performance of the solar driven cooling system can be assessed.
Conclusion
In this paper, the development process and the results of a small cooling capacity (1.5 kW) solar driven cooling system using a VGE were presented. Numerical modeling showed that R600a is an excellent choice for working fluid in a small-scale ejector cooling cycle, due to its good performance and moderate operating pressures. For larger systems, a different fluid should be selected, of safety issues (explosion risk) associated with larger fluid quantities.
The VGE was designed using CFD modeling with two degrees of freedom: the area ratio and the NXP. The area ratio was successfully controlled by a movable spindle in the primary nozzle throat, and the NXP adjusted by the position of primary nozzle in the ejector tail. Simulations indicated that ejector performance can be optimized by adjusting these features depending on the operating conditions. The performance improvement can be higher than 50% depending on the operating conditions.
The numerical findings were verified with an experimental VGE prototype. The experiments were carried out under controlled laboratory conditions. It was found that the larger the difference between the actual and design condenser pressure, the larger the benefits of using the VGE. The improvement in COP was as high as 85%. Operation maps were constructed which allowed for the development of a control algorithm that adjusts the optimal geometry of the VGE as a function of the operating parameters.
Currently, the VGE cycle is being installed in a TDF. The TDF will allow the long-term assessment of the energy performance of the solar driven air-conditioning system under real conditions.
Conflict of Interest Statement
The authors declare that the research was conducted in the absence of any commercial or financial relationships that could be construed as a potential conflict of interest.
Acknowledgments
The authors wish to acknowledge the financial support of “Fundação para a Ciência e a Tecnologia (FCT)”, through the contracts PTDC/EME-MFE/113007/2009 and EXPL/EMS-ENE/0256/2013. The authors also wish to acknowledge Armacell for supplying thermal insulations used in the test rig, and to express their gratitude to Baxi for their support.
References
Bartosiewicz, Y., Aidoun, Z., and Mercadier, Y. (2006). Numerical assessment of ejector operation for refrigeration applications based on CFD. Appl. Therm. Eng. 26, 604–612. doi: 10.1016/j.applthermaleng.2005.07.003
Bouhanguel, A., Desevaux, P., and Gavignet, E. (2011). Flow visualization in supersonic ejectors using laser tomography techniques. Int. J. Refrig. 34, 1633–1640. doi:10.1016/j.ijrefrig.2010.08.017
Butrymowicz, D., Smierciew, K., Gagan, J., Karwacki, J., and Bergander, M. (2012). “Numerical and experimental investigation of solar ejection refrigeration cycle utilizing natural refrigerants,” in Eurosun2012, eds B. Franković and J.-O. Dalenback (Opatija: International Solar Energy Society), p. 207.
Butrymowicz, D., Śmierciew, K., Karwacki, J., and Gagan, J. (2014). Experimental investigations of low-temperature driven ejection refrigeration cycle operating with isobutane. Int. J. Refrig. 39, 196–209. doi:10.1016/j.ijrefrig.2013.10.008
Chen, X., Omer, S., Worall, M., and Riffat, S. (2013). Recent developments in ejector refrigeration technologies. Renew. Sustain. Energ. Rev. 19, 629–651. doi:10.1016/j.rser.2012.11.028
Chunnanond, K., and Aphornratana, S. (2004). An experimental investigation of a steam ejector refrigerator: the analysis of the pressure profile along the ejector. Appl. Therm. Eng. 24, 311–322. doi:10.1016/j.applthermaleng.2003.07.003
Cizungu, K., Mani, A., and Groll, M. (2001). Performance comparison of vapour jet refrigeration system with environment friendly working fluids. Appl. Therm. Eng. 21, 585–598. doi:10.1016/S1359-4311(00)00070-3
Dennis, M., Cochrane, T., and Marina, A. (2015). A prescription for primary nozzle diameters for solar driven ejectors. Sol. Energy 115, 405–412. doi:10.1016/j.solener.2015.02.045
Dennis, M., and Garzoli, K. (2011). Use of variable geometry ejector with cold store to achieve high solar fraction for solar cooling. Int. J. Refrig. 34, 1626–1632. doi:10.1016/j.ijrefrig.2010.08.006
Eames, I. W., Aphornratana, S., and Haider, H. (1995). A theoretical and experimental study of a small-scale steam jet refrigerator. Int. J. Refrig. 18, 378–386. doi:10.1016/0140-7007(95)98160-M
Elbel, S., and Hrnjak, P. (2008). Experimental validation of a prototype ejector designed to reduce throttling losses encountered in transcritical R744 system operation. Int. J. Refrig. 31, 411–422. doi:10.1016/j.ijrefrig.2007.07.013
Gil, B., and Kasperski, J. (2015). Efficiency analysis of alternative refrigerants for ejector cooling cycles. Energy Convers. Manag. 94, 12–18. doi:10.1016/j.enconman.2015.01.056
Hemidi, A., Henry, F., Leclaire, S., Seynhaeve, J.-M., and Bartosiewicz, Y. (2009). CFD analysis of a supersonic air ejector. Part II: relation between global operation and local flow features. Appl. Therm. Eng. 29, 2990–2998. doi:10.1016/j.applthermaleng.2009.03.019
Huang, B. J., Chang, J. M., Wang, C. P., and Petrenko, V. A. (1999). A 1-D analysis of ejector performance. Int. J. Refrig. 22, 354–364. doi:10.1016/S0140-7007(99)00004-3
Kim, H. D., Rajesh, G., Setoguchi, T., and Matsuo, S. (2006). Optimization study of a coanda ejector. J. Therm. Sci. 15, 331–336. doi:10.1007/s11630-006-0331-2
Ma, X., Zhang, W., Omer, S. A., and Riffat, S. B. (2010). Experimental investigation of a novel steam ejector refrigerator suitable for solar energy applications. Appl. Therm. Eng. 30, 1320–1325. doi:10.1016/j.applthermaleng.2010.02.011
Pereira, P. R., Varga, S., Soares, J., Oliveira, A. C., Lopes, A. M., De Almeida, F. G., et al. (2014). Experimental results with a variable geometry ejector using R600a as working fluid. Int. J. Refrig. 46, 77–85. doi:10.1016/j.ijrefrig.2014.06.016
Pridasawas, W., and Lundqvist, P. (2007). A year-round dynamic simulation of a solar-driven ejector refrigeration system with iso-butane as a refrigerant. Int. J. Refrig. 30, 840–850. doi:10.1016/j.ijrefrig.2006.11.012
Roman, R., and Hernandez, J. I. (2011). Performance of ejector cooling systems using low ecological impact refrigerants. Int. J. Refrig. 34, 1707–1716. doi:10.1016/j.ijrefrig.2011.03.006
Selvaraju, A., and Mani, A. (2006). Experimental investigation on R134a vapour ejector refrigeration system. Int. J. Refrig. 29, 1160–1166. doi:10.1016/j.ijrefrig.2006.01.004
Sun, D.-W. (1996). Variable geometry ejectors and their applications in ejector refrigeration systems. Energy 21, 919–929. doi:10.1016/0360-5442(96)00038-2
Sun, D.-W. (1999). Comparative study of the performance of an ejector refrigeration cycle operating with various refrigerants. Energy Convers. Manag. 40, 873–884. doi:10.1016/S0196-8904(98)00151-4
Varga, S., Lebre, P. M. S., and Oliveira, A. C. (2013a). CFD study of a variable area ratio ejector using R600a and R152a refrigerants. Int. J. Refrig. 36, 157–165. doi:10.1016/j.ijrefrig.2012.10.016
Varga, S., Lebre, P. S., and Oliveira, A. C. (2013c). Readdressing working fluid selection with a view to designing a variable geometry ejector. Int. J. Low Carbon Technol. doi:10.1093/ijlct/ctt026
Varga, S., Oliveira, A. C., and Diaconu, B. (2009a). Analysis of a solar-assisted ejector cooling system for air conditioning. Int. J. Low Carbon Technol. 4, 2–8. doi:10.1093/ijlct/ctn001
Varga, S., Oliveira, A. C., and Diaconu, B. (2009b). Influence of geometrical factors on steam ejector performance – a numerical assessment. Int. J. Refrig. 32, 1694–1701. doi:10.1016/j.ijrefrig.2009.05.009
Varga, S., Oliveira, A. C., Ma, X., Omer, S. A., Zhang, W., and Riffat, S. B. (2011). Experimental and numerical analysis of a variable area ratio steam ejector. Int. J. Refrig. 34, 1668–1675. doi:10.1016/j.ijrefrig.2010.12.020
Yapıcı, R., Ersoy, H. K., Aktoprakoğlu, A., Halkacı, H. S., and Yiğit, O. (2008). Experimental determination of the optimum performance of ejector refrigeration system depending on ejector area ratio. Int. J. Refrig. 31, 1183–1189. doi:10.1016/j.ijrefrig.2008.02.010
Yu, J., Chen, H., Ren, Y., and Li, Y. (2006). A new ejector refrigeration system with an additional jet pump. Appl. Therm. Eng. 26, 312–319. doi:10.1016/j.applthermaleng.2005.04.018
Zegenhagen, T., and Ziegler, F. (2015). Experimental investigation of the characteristics of a jet-ejector and a jet-ejector cooling system operating with R134a as a refrigerant. Int. J. Refrig. 56, 173–185. doi:10.1016/j.ijrefrig.2015.01.001
Appendix
Keywords: ejector cooling system, variable geometry design, experimental work, performance enhancement
Citation: Pereira PR, Varga S, Oliveira AC and Soares J (2015) Development and performance of an advanced ejector cooling system for a sustainable built environment. Front. Mech. Eng. 1:7. doi: 10.3389/fmech.2015.00007
Received: 28 April 2015; Accepted: 17 June 2015;
Published: 30 June 2015
Edited by:
Bahram Moshfegh, Linköping University, SwedenReviewed by:
Xudong Zhao, University of Hull, UKAlaa Abdul-Ameer, The British University in Dubai, United Arab Emirates
Copyright: © 2015 Pereira, Varga, Oliveira and Soares. This is an open-access article distributed under the terms of the Creative Commons Attribution License (CC BY). The use, distribution or reproduction in other forums is permitted, provided the original author(s) or licensor are credited and that the original publication in this journal is cited, in accordance with accepted academic practice. No use, distribution or reproduction is permitted which does not comply with these terms.
*Correspondence: Armando Carlos Oliveira, Department of Mechanical Engineering, Faculty of Engineering, University of Porto, Rua Dr Roberto Frias, 4200-465 Porto, Portugal, acoliv@fe.up.pt