A Historical Analysis of the Co-evolution of Gasoline Octane Number and Spark-Ignition Engines
 Derek Splitter
 Alexander Pawlowski
 Robert Wagner
- 1Fuels, Engines and Emissions Research Center, Oak Ridge National Laboratory, Knoxville, TN, USA
- 2The University of Tennessee Knoxville, Knoxville, TN, USA
In this work, the authors reviewed engine, vehicle, and fuel data since 1925 to examine the historical and recent coupling of compression ratio and fuel antiknock properties (i.e., octane number) in the U.S. light-duty vehicle market. The analysis identified historical time frames and trends and illustrated how three factors – consumer preferences, technical capabilities, and regulatory legislation – affect personal mobility. Data showed that over many decades these three factors have a complex and time-sensitive interplay. Long-term trends in the data were identified where interaction and evolution between all three factors were observed. Specifically, transportation efficiency per unit power (gal/ton-mi/hp) was found to be a good metric to integrate technical, societal, and regulatory effects into the evolutional pathway of personal mobility. From this framework, discussions of future evolutionary changes to personal mobility are also presented, with a focus centered on how increasing fuel octane number can help to enable sustained improvement in transportation efficiency per unit power.
Introduction
There is little question that during the twentieth century significant gains in personal mobility occurred. In the United States, these gains most prominently occurred through the widespread deployment of the automobile, which revolutionized society, culture, landscape, and lifestyle. The technical backbone for this large-scale adoption and deployment was the robust, low production, and operating cost gasoline-fueled spark-ignited (SI) internal combustion engine. The concept of internal combustion engines is simple; they convert chemical potential energy to mechanical energy. Note that although this process obeys conservation of energy, it does not conserve species or the working fluid and, thus, is not suited to be represented by a heat engine thermodynamic cycle (Foster, 2012). However, in engine operation, fuel chemical potential is converted to thermal energy, which is then converted to mechanical energy through constrained expansion, where the latter portion of the process can and often is approximated by a thermodynamic cycle. For SI engines, the Otto standard air cycle is commonly used, which has an efficiency that is a function of the working fluid properties and compression ratio alone. This relatively simple relation has been studied by others; for example, studies by Smith et al. (2014) on compression ratio effects, Lavoie et al. (2012) on working fluid effects, and Caton (2012) on both illustrate that the implementation of even simple changes to engine design can have very dramatic effects on efficiency. However, Otto cycle analysis ignores the combustion process completely and instead assumes a heat addition in its place (Moran and Shapiro, 2004). The transient physical–chemical behavior of the combustion process is inherently complex, which can be adversely affected by changes made from Otto cycle approaches. For example, Caris and Nelson (1959) showed that compression ratio increase is bounded by increases in-cylinder heat losses, friction, and combustion duration, in turn limiting the practical benefits of increasing compression ratio beyond approximately 14:1–16:1. Even today, after over a century of research and engineering, there remain significant technical challenges in all aspects of engine operation and efficiency. Therefore, by default, reliance on a technically complex device couples societal and technical issues.
Moreover, the scale of the use of internal combustion engines as the prime mover for personal mobility results in non-trivial anthropogenic emissions, introducing environmental and human health considerations into engine use. Lastly, the relatively low cost and superb portability of high-energy-density liquid hydrocarbon fuels have resulted in consumption of primarily non-renewable resources as the energy carrier for personal mobility. Over the last half century, energy resource depletion and air pollution from engine use have inspired regulatory action and legislation to affect the design and performance criteria for the U.S. light-duty market. These combined regulatory, technical, and societal influences on engines will continue to influence the future trajectory of personal mobility. The present analysis aims to improve the understanding of historical engine evolution, to document key developmental time frames, and to identify potential pathways to maintain or improve light-duty personal mobility in a more sustainable manner.
Over the last century, researchers have quantified how strongly fuel properties have coupled with engine combustion and performance. In 1919, Horning made some of the first direct pressure measurements of end gas knock in an SI engine (Horning, 1919). Even in this early work, Horning found critical relationships between engine geometry, ignition source, fuel/air preparation, and fuel properties; he commented on how each of these can affect engine performance and knock. Later, in 1923, Horning elaborated upon this and other time period works (Horning, 1923) in which he found that fuels “composed of paraffins, which seem to be the least stable of all our common fuels … large molecules that are also considered less stable than the lighter, simpler ones.” Additionally he also noted that knock is dependent on engine operating conditions where knock occurrence is proportional to “… some power of the density of the fuel in the mixture …” and “… some power of the absolute temperature.” He found that knock was directly linked to fuel composition and engine compression ratio, which illustrates the fundamental efficiency and performance barriers that fuel and engine research have focused on for over a century.
Shortly after Horning’s findings, and in light of the growing evidence about fuel properties, engine performance, and fuel consumption, the Bureau of Standards requested a steering committee to work toward establishing a standard reference fuel and test method for characterizing SI engine knock and fuel properties (Cummings, 1927). For example, in 1922 Ricardo showed measured data for many fuels (Ricardo, 1922), and in 1927, Graham suggested octane and n-heptane as appropriate standard reference fuels (Edgar, 1927). Shortly thereafter, in 1930, Campbell et al. more fully identified how fuel molecular structure can influence knock and maximum compression ratio (Campbell et al., 1930). These were some of the first studies that laid the groundwork for the octane scale that eventually resulted in the ASTM D2699 research octane number (RON) and D 2700 motor octane number (MON) tests (ASTM Standard D 2699, 2013; ASTM Standard D 2700, 2014). The RON and MON tests rely on binary mixtures of n-heptane and 2,2,4 trimethylpentane (isooctane) to characterize a given fuel’s antiknock properties as a function of compression ratio. Standardization of fuel antiknock tests and reference fuels has helped researchers improve knock tolerance of engines. The reference fuels that were selected were not ideal (Leppard, 1990), but their continued use enables a historical analysis of the technological progress that has been made to improve the performance and fuel economy of engines.
Using the RON and MON of a given fuel, and engine and vehicle design parameters, the present work is a compilation of historical data for fuels and engines. The authors reviewed engine, vehicle, and fuel data since 1925 to examine the historical and recent coupling of compression ratio and fuel antiknock properties (i.e., octane number) in the U.S. light-duty vehicle market. This approach integrates not only the historical trends in compression ratio and fuel octane number but also engine power, vehicle weight, and fuel economy. The analysis concluded that since 1925 there have been five major historical ages of development, which have been time sensitive to incorporate and accommodate regulation, technical, and societal factors. The purpose of this analysis is threefold. The first is to improve the understanding of key development milestones and historical influences that affected the co-evolution of U.S. light-duty fuel and engines and to examine how the interactions among regulation, technology, and consumer preferences have influenced historical trends in fuel octane number, engine compression ratio, and vehicle fuel economy. This analysis illustrated that since 1925 a direct exponential relation between vehicle horsepower, fuel economy, and weight has existed. Second, historically fuel octane number has been an enabler for increases in fuel economy or performance through engine compression ratio; however, since the mid-1970s fuel octane number has remained stagnant. Are there viable potential paths for increasing fuel octane number that presently exist and can meet current regulation, technology, and consumer factors? Third, if fuel octane number is increased, will this enable a sufficient compression ratio increase in modern engines to aid in addressing present challenges in CO2 and fuel economy?
Materials and Methods
To compile historical trends and information, a literature review was conducted. The review mined market average data for relevant engine and fuel properties from various industrial, government, consortium, and consultant sources. The compiled parameters and data sources that were used for this analysis are presented in Table 1.
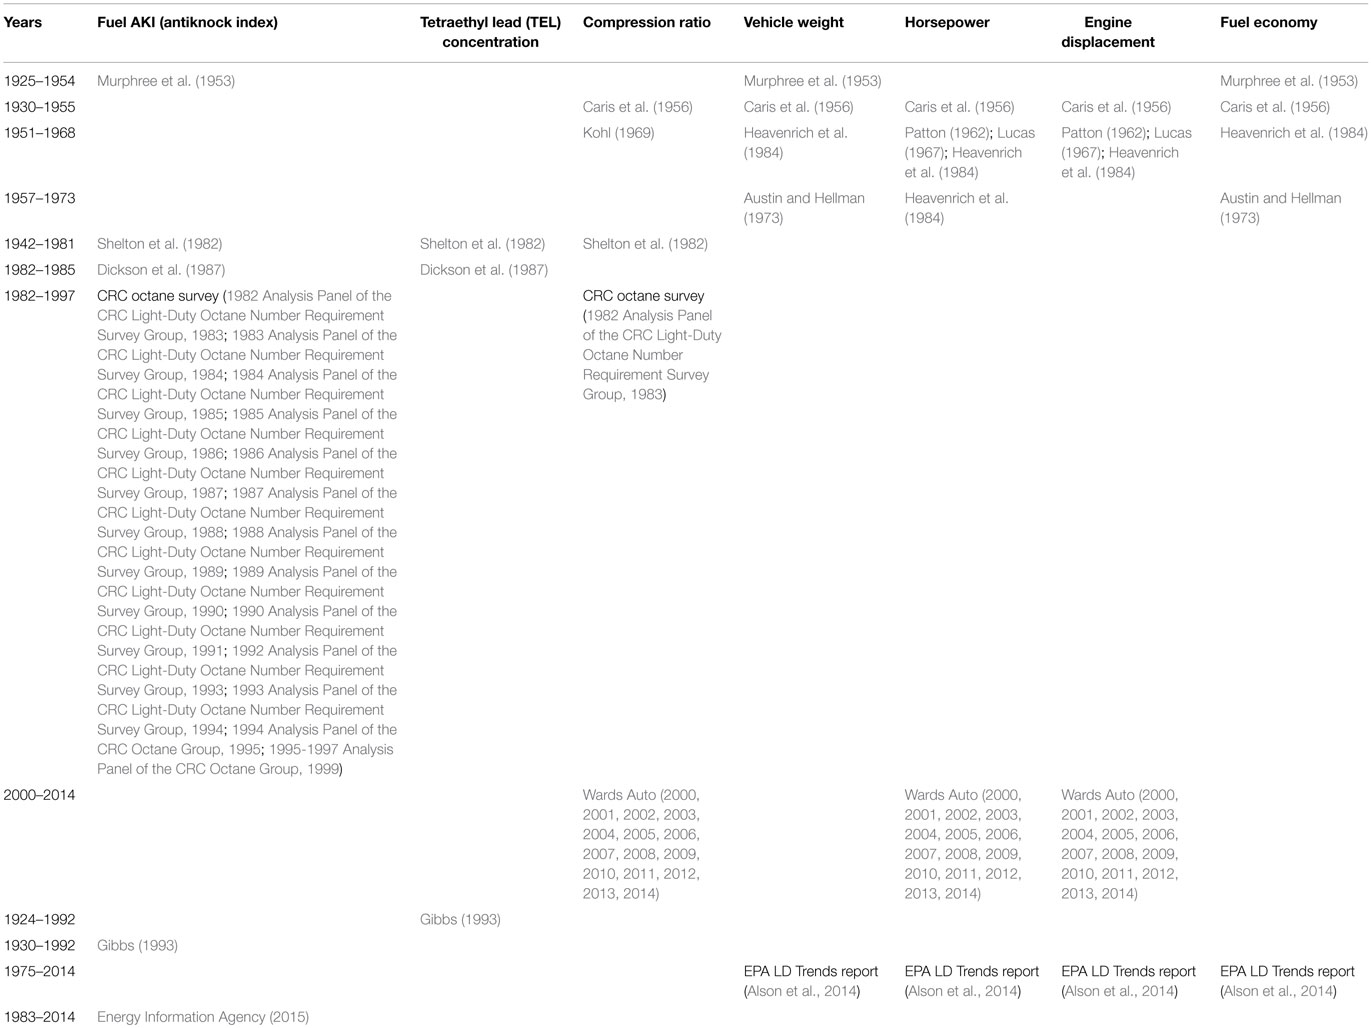
Table 1. Major historical fuel property and engine/vehicle data sources.
The data were compiled and analyzed into critical parameters. Analysis also focused on relating the data trends to one another, with conventional quantitative statistical methods (fitting, error, residual, average, SD, etc.) and comparative qualitative analysis techniques (trend-wise agreement, trend scaling).
Analysis
The analysis is portioned into five defined “ages,” which are bounded by the onset of or changes to technical, societal, and regulatory factors. These five ages are indicated in Figure 1, which also illustrates the fuel AKI, tetraethyl lead (TEL) concentration, and engine compression ratio. Note that the data in Figure 1 display TEL and AKI for regular-grade unleaded gasoline and the average compression ratio (i.e., the compression ratio of premium required/recommended and regular-grade fuel cars). Additionally, the analysis contains a sixth section, which presents the overall trends and summarizes the overarching interactions of regulation, consumer, and technical interplay that have and will continue to affect the light-duty market.
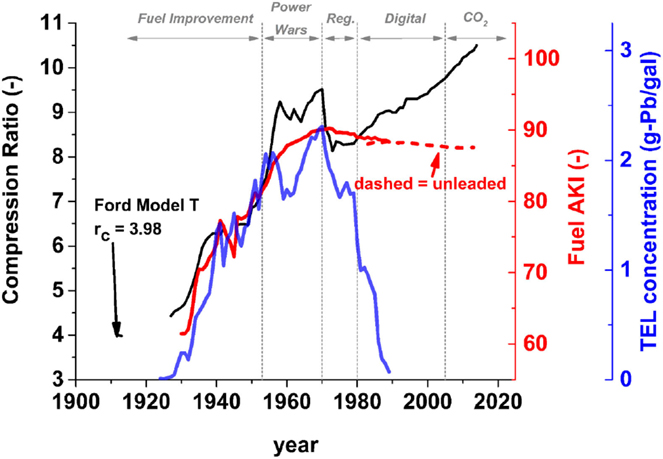
Figure 1. Historically representative averaged trends in compression ratio (black), fuel AKI (red), and fuel TEL concentration (blue) for the U.S. as a function of year. Data sources are presented in Table 1.
Fuel Improvement Age
The initial age of engine and fuel co-evolution stemmed from fuel improvements. Specifically, improvements to refining and fuel additives – such as TEL – greatly influenced the history and co-evolution of fuels and engines, not only in the “fuel improvement age” but also throughout the twentieth century. Beginning in the late 1910s through the 1930s, researchers identified engine and fuel relationships between knock, compression ratio, performance, and efficiency (Horning, 1919, 1923; Ricardo, 1922; Cummings, 1927; Edgar, 1927; Campbell et al., 1930; Boyd, 1950; Gibbs, 1993).
During this time, Charles Kettering and Thomas Midgley began researching a solution to knock through fuel properties and/or fuel additives, including the discovery of TEL as an antiknock fuel additive. Their work is extremely significant and critical, as well as controversial, in that their results defined the personal mobility pathway in the twentieth century. The significance of TEL is highlighted in Midgley’s laboratory notebook: “The ear-splitting knock of their test engine turned to a smooth purr when only a small amount of the compound [tetraethyl lead] was added to the fuel supply. and all the men danced a non-scientific jig around the laboratory.” (Kitman, 2000) Despite concerns about toxicity, TEL proved to become an economically viable pathway to improve fuel octane number.
From the very start, a controversy erupted among major political, economic, and governmental parties over the use of TEL in gasoline (Boyd, 1950; Rosner and Markowitz, 1985; Gibbs, 1993; Gibbs, 1996; Kitman, 2000; Alson et al., 2014; Energy Information Agency, 2015). It has been known since as early as 2000 BCE that lead is toxic (Pearce, 2007). In the 1920s, regulatory agencies and health organizations demanded that the addition of TEL to gasoline be justified to be safe and that proper procedures be used so that human exposure through direct contact and atmospheric deposition would be insignificant. For example, due to safety concerns over TEL use, the Surgeon General suspended TEL use in gasoline in May 1925 (Robert, 1983; Gibbs, 1990; Kitman, 2000), and requested that “… a statement as to the health hazards involved in the retail distribution and general use of tetraethyl lead gasoline motor fluid [be prepared], and that until such a time, the distribution of this substance be discontinued.” (United States, 1925; Nriagu, 1990) This action by the Surgeon General was one of the first times that a federal entity considered the health impacts of mobility and how regulation could influence technology and the consumer. However, within a year this regulatory action was lifted as an agreement was made between the Ethyl Gasoline Corporation and the Surgeon General’s Office in which the corporation suggested the concentrations and usage of TEL that could be deemed safe. This agreement resulted in a maximum content of TEL in motor gasoline of 3.17 g-Pb/gal (Leake et al., 1926). A 1933 study (Kehoe et al., 1934) corroborated the claims of the Ethyl Gasoline Corporation (Leake et al., 1926), stating that when proper safeguards for handling are in place “… there is no reason to fear the existence of danger to the public health from the distribution and use of leaded gasoline.” Based on these studies and a period of observation, the restrictions on TEL concentration were raised in 1959 to 4.23 g-Pb/gal (United States, 1959). Neither the 1959 nor 1925 notices were ever actual legal limits; they were merely agreements that had the effect of avoiding and stalling further investigation (Gibbs, 1990).
The specific discussion of TEL use and impacts is beyond the scope of the present analysis. However, the ensuing negative health and environmental effects associated with TEL use in gasoline are significant. In fact, some could classify the use of TEL in gasoline as one of the most significant and widespread man-made environmental and human health disasters in modern history (Needleman, 1998). For example, Nevin correlated increased lead concentrations with future poor decision making. Specifically, key findings of that work are illustrated in Figure 2, which shows that increased rates of poor decision making, such as murder, are correlated to increased lead concentration (Nevin, 2000). A key foundation for Nevin’s work and rationale for the 21-year difference between murder rates and lead concentration seen in Figure 2 is supported by Canfield et al. (2003) Canfield’s work in the New England Journal of Medicine showed that children’s Stanford-Binet Intelligence Test scores tend to asymptotically reduce as lifetime blood lead level increases, where most importantly there was a significant reduction in high scores. Thus, human exposure to lead at an early age, including TEL, has been shown to correlate with future increased rates of poor decision making.
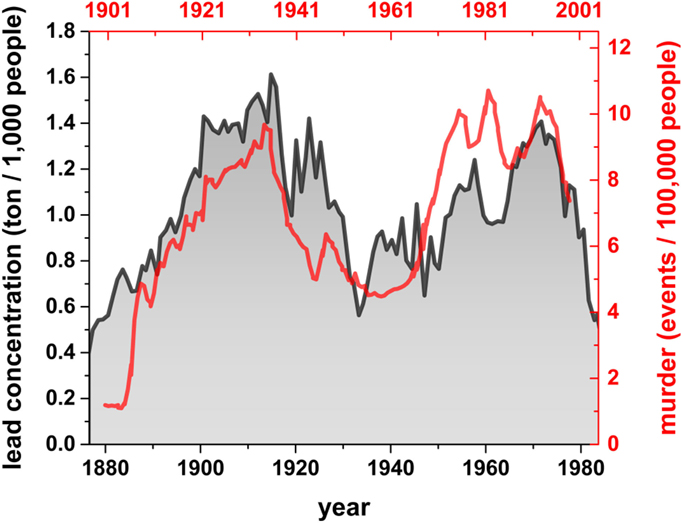
Figure 2. Historical trends in U.S. industrial lead usage and societal murder rates, murder rate scale shifted 21 years. Source: Date from, Rick Nevin, “How Lead Exposure Relates to Temporal Changes in IQ, Violent Crime, and Unwed Pregnancy.” Environmental Research 83, no. 1 (2000): 1–22.
Despite the damaging effects caused by the use of TEL in gasoline, TEL proved to be an effective and inexpensive octane improver that was widely adopted. Data in Figure 1 clearly show that during the fuel improvement age there was a direct dependence of engine compression ratio on fuel AKI, and subsequently TEL concentration. Based on the wide adoption and reliance on TEL to improve gasoline AKI, the continued and persistent usage of TEL in gasoline illustrates the value that society and industry place on personal mobility. The observed relationships between regulatory, technical, and societal influences were not unique to the “fuel improvement age,” and the following sections will illustrate how they have continued to evolve.
Power Wars Age
The second age of the co-evolution of fuels and engines can be defined as the “power wars age.” The previous fuel improvement age illustrated that consumer and technically motivated co-evolution of fuels and engines established performance improvements to personal mobility. Fuel improvements were critical for this occurrence. For example, Figure 1 illustrates that fuel antiknock quality increases with TEL’s introduction and subsequent increase in concentrations in motor gasoline. TEL also complemented new and improved refining processes throughout the mid-twentieth century, such as continuous process vacuum distillation, improved thermal reforming in the late 1920s and 1930s, catalytic cracking during World War II, and platinum reforming in the 1950s (Shelton et al., 1982), all of which also increased the antiknock qualities of motor gasoline. Although thermal reforming and catalytic cracking processes improved fuel AKI during the fuel improvement age, the full deployment of mature fuel improvement technology occurred during and after World War II, enabling the power wars age once World War II ended. For example, Shelton et al. (1982) state that the synthetic (i.e., refinery-upgraded gasoline) fraction of motor gasoline increased from a nominal amount in the 1920s to around 60% after World War II and exceeded 80% by the 1960s.
The result of the deployment of mature fuel improvement technology present in the 1950s and 1960s was that even with TEL concentration being held below limits stated in the informal non-binding agreement between the Surgeon General’s Office and the Ethyl Gasoline Corporation (United States, 1925, 1959; Leake et al., 1926; Kehoe et al., 1934; Robert, 1983; Gibbs, 1990; Nriagu, 1990), fuel octane number and compression ratio continued to increase. Much of this increase was enabled by full-scale deployment of platinum reforming in the 1950s that increased fuel aromatic content, increasing the fuel AKI of regular-grade fuel by over nine points from 80.5 in 1953 to 90 in 1970, while TEL concentrations remained constant. Similarly, the AKI of premium-grade fuel increased by 10 points from 85.9 in 1953 to 95.9 in 1970 with near constant TEL concentration. The increase in AKI enabled increased engine compression ratio, and ultimately performance, where the fleet average horsepower doubled between 1953 and 1969 with virtually no increase in vehicle weight (127 vs. 284 HP and 3850 vs. 3879 Lb, respectively). Therefore, when low cost, relatively high-octane-number fuels (in excess of 80 AKI) became available and abundant in the 1950s and 1960s, automakers dramatically increased compression ratios as fuel AKI increased.
While fuel AKI increased throughout the 1950s and 1960s, the real value of fuel price (i.e., price adjusted for time value of money) actually decreased. During this time, the nominal value (i.e., actual market price) of regular gasoline increased from $0.272/gal in 1951 to $0.321/gal in 1966, but when adjusted for real value in 2012 dollars [2012 U.S. dollars (USD)], the relative cost of gasoline actually decreased from $1.731/gal in 1951 to $1.566/gal in 1966 (U.S. Energy Information Administration, 2012). This reduction in fuel cost, coupled with high AKI fuel and little-to-no regulatory emissions or fuel economy oversight, resulted in increased power through fuel enrichment (at the expense of fuel economy) as the fleet average air–fuel ratio (AFR) (as determined as the average of chassis dynamometer measurements at 30, 50, and 70 miles per hour at steady cruise on level road) decreased from approximately 15:1 in 195 to approximately 13:1 by 1961 and persisting around 13:1 through 1965 (Kohl, 1969). Figure 3 shows how competing trends in AFR and compression ratio were used to increase power at the expense of fuel economy. Note that the AFR values were calculated from vehicle dynamometer horsepower testing presented in Kohl (1969), where the present analysis in Figure 3 removed data from 1962, which was an outlier. Additionally, although not illustrated in Figure 3, the complementary trends of decreased real value of fuel and fuel economy actually result in near constant consumer fuel cost on a real value basis (i.e., ~constant $/mi from 1951 to 1969). Note in Figure 3 that the AFR began to rise in 1967 in response to looming emissions regulation by the Environmental Protection Agency (EPA) and the California Air Resources Board (CARB) (2015) in 1970 and 1969, respectively (Shelton et al., 1982; United States, 1999).
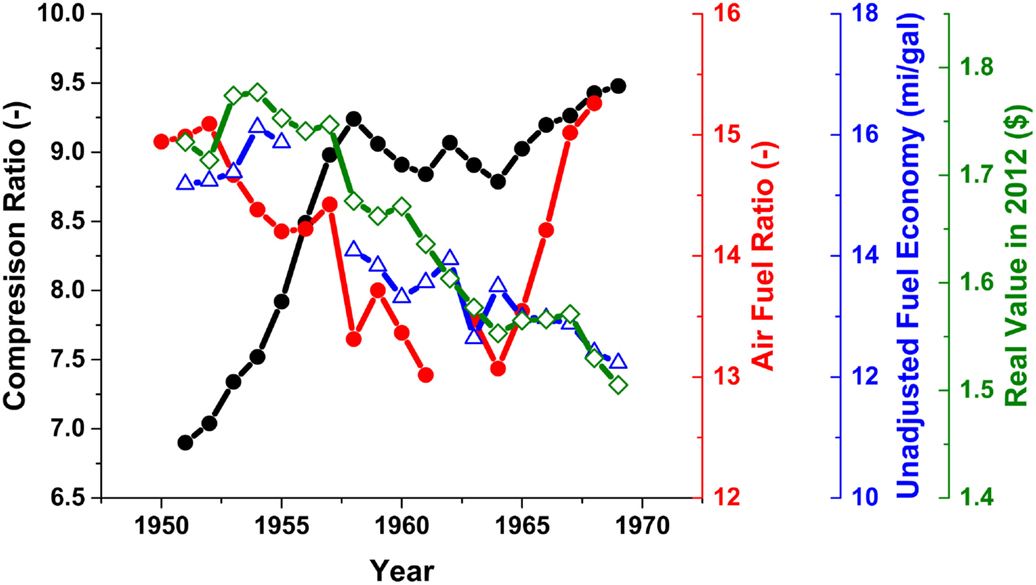
Figure 3. Historically representative average trends in compression ratio (black), air–fuel ratio at wide open throttle (red), fuel economy (blue), and fuel price (green) during the “power wars age.” The data sources are presented in Table 1. AFR data are from test averages in G. A. Kohl (Kohl, 1969).
However, the unregulated market and technical/consumer-driven trajectory enabled rationale for regulation. For example, in 1959, the Los Angeles County Board of Supervisors defined a bromine number limit on gasoline to control olefins as eye irritants and ozone generation that went into effect in 1960 (Neligan et al., 1961; Gibbs, 1996). Then in 1961, the California Motor Vehicle State Bureau of Air Sanitation passed legislation to mandate positive crankcase ventilation systems by 1963 (California Air Resources Board (CARB), 2015). By 1967, CARB was formed; it established its first tailpipe emission standard in 1969 (California Air Resources Board (CARB), 2015). Although these regulations were enacted, they were only applicable in California, with a limited impact on national tailpipe emissions or fuel economy until the EPA was formed in 1970 (California Air Resources Board (CARB), 2015).
Low regulatory oversight combined with high AKI and low-cost fuel provided insufficient economic motivation for automakers or consumers to desire improvements in fuel economy. Instead, manufactures designed and marketed high-performance vehicles that consumers wanted, effectively marking 1953–1970 as the power wars in the U.S. light-duty market.
Regulation Age
The unchecked quest for performance during the power wars age was quickly halted by emissions regulation resulting from urban air quality concerns and fuel economy regulation resulting from geopolitically motivated fuel shortages in the 1970s. In 1970, Congress passed the Clean Air Act – the first national tailpipe emissions standard that regulated tailpipe emissions of carbon monoxide (CO), volatile organic compounds (VOCs), and oxides of nitrogen (NOx) – which went into full effect by 1975. Beyond tailpipe emissions, the Clean Air Act would impose additional regulations on gasoline formulation and additives.
One of the factors that sparked the Clean Air Act was an increased understanding of the effects of TEL. Although there had historically been significant controversy over the effects of TEL (Boyd, 1950; Rosner and Markowitz, 1985; Nriagu, 1990), quantitative evidence of a rise in lead exposure from human activity was not introduced until 1965 when Clair Patterson demonstrated an over 100-fold increase in lead exposure during the mid-twentieth century as compared to before the industrial revolution (Patterson, 1965). While trying to accurately date the age of the earth using lead isotope decay (Patterson, 1956), he discovered that his instruments were affected by background lead contamination that was tied to the recent rise in environmental lead contamination, like that from leaded gasoline (Needleman, 2000). Patterson’s findings and evidence were soon used as catalyst for the Clean Air Act (United States Senate, Committee on Public Works, 1966). Similar isotope dating techniques have since been used by several researchers who have found evidence that the use of lead in gasoline has had detrimental societal effects in North America (Nriagu, 1990; Canfield et al., 2003) and around the world (Pacyna and Pacyna, 2000), where lead attributed to gasoline can be found as a function of year in plants (Balouet et al., 2007) and soils (Oudijk, 2005).
Tetraethyl lead had other more direct and negative technical qualities; specifically, TEL tended to cause deposit formation inside the combustion chamber. It was found in the late 1920s that anti-deposit fuel additives, such as dichloroethane and dibromoethane, were required to prevent metal deposits from rapidly forming on combustion chamber surfaces. (Gibbs, 1990, 1993; Nriagu, 1990) However, these and other anti-deposit chemicals introduced halogenates into the exhaust. Initially, the exhaust halogenates were not of a concern, but once exhaust catalysts were needed to comply with the Clean Air Act of 1970, this changed. It was found that halogenates poisoned catalysts, disrupting the catalyst’s ability to reduce regulated exhaust emissions. Thus, to enable catalyst use in 1975, the EPA defined the associated fuel lead phasedown process in 1973 (U.S. EPA (U.S. Environmental Protection Agency), 1973b), ruling that unleaded gasoline (91 RON minimum, 0.05 g-Pb/gal maximum) must be offered by all point-of-sale vendors by July 1974 (U.S. EPA (U.S. Environmental Protection Agency), 1973b). Tailpipe emissions were further reduced in 1977 when Congress amended the Clean Air Act to tighten the passenger car NOx standard from 3.5 to 2 grams per mile (gpm) and light-duty trucks at 2.3 gpm, both by 1979. By 1981, an additional passenger car phasedown in NOx to 1.0 gpm would also occur (United States, 1999). Kummer states that a pre-emissions vehicle would produce approximately 10 gpm HC, 80 gpm CO, and 4 gpm NOx when tested on U.S. Federal Test cycles of the 1970s (Kummer, 1980). Within a decade, NOx emissions were reduced by a factor of four, an aggressive phase that simultaneously required the introduction of unleaded fuel. Nearly 50 years after the first regulatory investigations into the use of lead in motor gasoline, it would be a technical motivation – to use catalysts to reduce smog forming emissions – and not a human health or environmental reason specifically related to lead toxicity that resulted in a regulatory-mandated reduction of fuel lead content. Although the Clean Air Act mandated emissions control and unleaded fuel requirements for new vehicles, it took over 20 additional years and the 1990 amendments to the Clean Air Act to completely phase lead out of motor gasoline in 1996.
As a response to emissions regulations, AFR was increased to aid in compliance with CO and VOC regulations, which in turn caused adiabatic flame temperature to also increase and, thus, increase NOx formation (Lavoie et al., 1970; Benson and Stebar, 1971; Blumberg and Kummer, 1971; Komiyama and Heywood, 1973; Kummer, 1980; Heywood, 1988; Turns, 1996). At that time, catalyst technology was not sufficiently mature to reduce the associated increase in NOx to regulated levels (Kummer, 1980) and, thus, this trade-off in emissions trends required relatively significant changes to engines. The inability to control NOx emissions with effective catalysts on-vehicle presented a NOx/CO trade-off, wherein compression ratio was reduced to reduce NOx, and technologies like exhaust gas recirculation were researched and implemented (Campau, 1971; Kummer, 1980).
Three-way catalysts that simultaneously reduce NOx while oxidizing CO and hydrocarbons were not fully phased in until the early 1980s to meet more stringent 1981 NOx standards (United States, 1999). Prior to the maturity of three-way catalysts, two-way catalysts were commonly used to control CO and HC emissions, but they required NOx emissions to be reduced in-cylinder by reducing in-cylinder temperatures while simultaneously reducing CO. The reduced compression ratio in this approach had an additional benefit in that it complemented the lower octane unleaded fuel, as seen by the rapid declines in Figures 2 and 4, which reduced the AKI of regular grade by two points from 90 AKI in 1970 to 88 AKI in 1974 (Neligan et al., 1961; Shelton et al., 1982; Dickson et al., 1987; Gibbs, 1993; United States, 1999; U.S. EPA (U.S. Environmental Protection Agency), 1973b). However, as NOx emissions control mandates became more stringent in the late 1970s, full catalysis of CO, HC, and NOx would be required to meet them, as future opportunities to operate fuel-lean would limit future fuel economy improvements (Kummer, 1980).
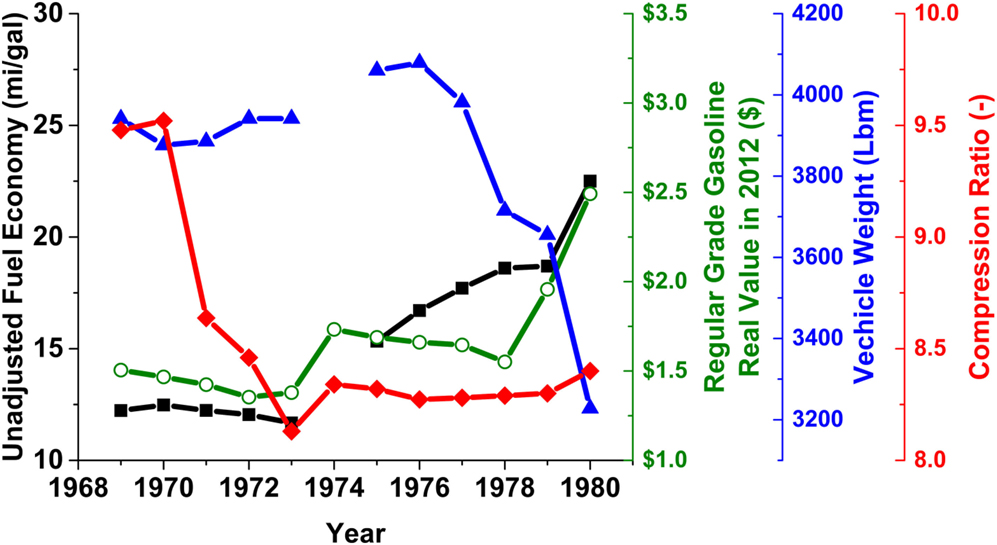
Figure 4. Historically representative average trends in compression ratio (red), fuel economy (black), fuel price (green), and vehicle weight (blue) during the “regulation age.” Data sources are presented in Table 1.
Although emission mandates tended to increase AFR relative to values seen in the mid-1960s (Figure 3), reduced compression ratio requirements counteracted gains in fuel economy by fundamentally reducing the maximum and achievable efficiency of the engine (Caris and Nelson, 1959). Figure 3 shows that the fuel economy of vehicles in the mid-1960s was actually higher than that of vehicles in the early 1970s, Figure 4. The full effect that fuel AKI reduction and emissions constraints had on fuel economy becomes apparent with the historical and political happenings of the 1970s. While implementing the phase-in of unleaded fuel and emissions standards, the U.S. began its involvement with the Yom Kippur War in October of 1973 that saw the Organization of Arab Petroleum Exporting Countries implement an oil embargo against the U.S. and other involved countries, causing an energy shortage from October 1973 until the embargo was lifted in March 1974 (U.S. Department of State, Office of the Historian, 2012). During the embargo, the price of regular gasoline in 1974 increased by 47% (27% in 2012 USD) (U.S. Energy Information Administration, 2012), delivering a rapid shock to the economy. The U.S. took immediate strategic political action to promote energy conservation and to develop domestic energy resources, as stated in the Energy Policy Conservation Act of 1975 (Energy Policy and Conservation act 42 USC 6201, 2015). Motorist highway speeds slowed to federally mandated 55 mph speed limit, and automakers manufactured new vehicles to comply with newly imposed fuel economy standards (Energy Policy and Conservation act 42 USC 6201, 2015). Specifically, the Energy Policy Conservation Act established average fuel economy standards of 15, 19, and 20 mpg for the model years (MYs) 1978, 1979, and 1980, respectively, and an eventual requirement of 27.5 mpg for 1985 (Energy Policy and Conservation act 42 USC 6201, 2015) that automakers met primarily through sharp reductions in vehicle weight – nearly 20% – from 1976–1980 (Figure 4).
The phase-in of these regulations was timely as they coincided with a second oil crisis in 1979, which was caused by the Iranian Revolution. Petroleum prices skyrocketed by 86% (a 57% increase in 2012 USD) between 1978 and 1980 and over a longer period of time than the first crisis in 1973. The public’s recent memory of dramatic changes in personal mobility from energy shortages motivated automakers to improve engine technologies and efficiency in the years to come.
Digital Age
The regulatory age of the 1970s proved to be a response period from the power wars age of the 1950s and 1960s and from fuel shortages influenced from geopolitical events. Following these two ages was the growth and maturity of the “digital age” of vehicles, caused by advances in computing power. These advances were utilized both in design through computer-aided simulations and on-vehicle through rugged low-cost computing and electronic controls. Both on-vehicle and in-design computational tools became critical to comply with increasingly stringent exhaust tailpipe emissions limits and fuel economy standards. Integration of cost-effective computational power and sensing technologies provided dramatic improvements to performance and operation while complying with new emissions regulations through active engine management and three-way catalyst functionality (Kummer, 1980).
Research began to illustrate that improvements to engine operation could occur with technologies, such as active spark control (Kraus et al., 1978), air–fuel-ratio control (Rivard, 1973; Zechnall et al., 1973; Holl, 1980), and advances in catalyst operation and conversion efficiency at stoichiometric operation (Kaneko et al., 1978; Hegedus et al., 1979; Kummer, 1980). Although reduced AKI of unleaded gasoline and a lack of maturity in emissions catalyst proved to be detrimental to engine compression ratio during the regulatory age, new engine management features and controls were found to enable increases in knock tolerance and associated compression ratio and performance without changes to fuel AKI. The ability to increase compression ratio allowed engines to regain some of the lost performance and efficiency associated with stoichiometric AFR operation as compared to rich or lean AFR operation, respectively. One enabler came from the implementation of knock sensors – accelerometers to detect resonance frequencies in the 4–5 kHz range common to knock (Hickling et al., 1983) – that sent feedback information to the engine control unit (ECU) that could adjust the engine operating parameters (i.e., retard ignition timing) to reduce knocking tendency without requiring increased fuel octane. The result was that the ECU and associated engine management strategies enabled engine compression ratio to increase with relatively constant fuel AKI (Kraus et al., 1978) (Figure 1).
Starting in the early 1980s, tremendous improvement to performance, engine efficiency, and refinement occurred, all while fuel economy regulation remained stagnant. The combined effect of engine sensing and control improvements is seen in Figure 5, where knock sensor deployment and port fuel injection (PFI) occurred simultaneously starting in approximately 1982. As active ignition timing was required with active knock control, it was rapidly adopted at a similar rate as PFI (Figure 5), which featured active on-board air/fuel management by controlling the AFR. With full introduction of knock sensors by the 1990s, the ability of the driver to audibly confirm knock became more ambiguous if not impossible (1985 Analysis Panel of the CRC Light-Duty Octane Number Requirement Survey Group, 1986; 1988 Analysis Panel of the CRC Light-Duty Octane Number Requirement Survey Group, 1989; 1992 Analysis Panel of the CRC Light-Duty Octane Number Requirement Survey Group, 1993). Because of the rapid adoption and improvement of on-board engine controls, 1997 was the last year that the Coordinating Research Council (CRC) conducted an octane survey of the MY vehicles as it had regularly done since the 1930s. The integration of on-board sensing, control technologies, such as variable valve timing (VVT), multi-valve cylinder heads, and computer-aided design, and simulation helped to relax the historically tight coupling between fuel octane number and compression ratio (Figure 1).
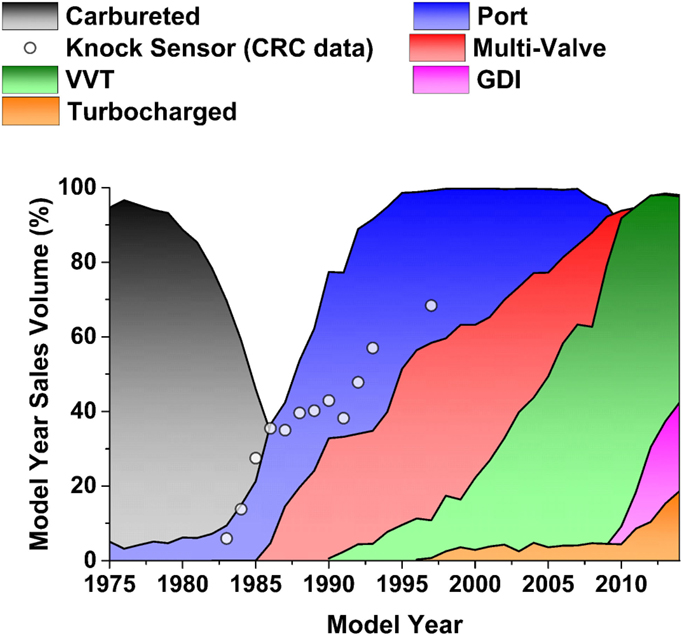
Figure 5. Historically representative average trends in fuel delivery and engine technologies during the last 40 years. Data are from EPA and CRC (1985 Analysis Panel of the CRC Light-Duty Octane Number Requirement Survey Group, 1986; 1988 Analysis Panel of the CRC Light-Duty Octane Number Requirement Survey Group, 1989; 1992 Analysis Panel of the CRC Light-Duty Octane Number Requirement Survey Group, 1993; Alson et al., 2014).
While engine technology was being implemented in the digital age, the nominal value of fuel was flat and the real value of fuel adjusted to 2012 actually declined (Figure 6). The decreasing real value of fuel mirrored the fuel price trends during the power wars age. Moreover, with the introduction of engine technology, as fuel prices were declining and cost-effective performance increases became available, vehicle performance began to increase. In fact, between 1980 and 2004, vehicle power and acceleration increased every single year, with an average increase in power of around 4% annually (Alson et al., 2014; Pawlowski and Splitter, 2015), despite fuel economy standards and more stringent emissions regulations of the digital age vs. the power wars age. Additionally, consumer response to decreased real value of fuel in the digital age was highlighted by consumer purchasing preference migrating from passenger cars to light trucks (16.5% light truck market share in 1980 vs. 48% light truck market share in 2004) (Alson et al., 2014). Although emissions regulations continued to become more stringent with Tier 1 and Tier 2 in 1990 and 1999, respectively (United States, 1999), significant advances in emission control technologies and on-board computational control helped to ease the integration of emissions regulation and prevent a major disturbance and correction such as the one that occurred during the regulation age. These trends have been emphasized by Cheah et al. (2009) which showed that the emphasis of the market through the digital age was not on reducing fuel consummation but on performance improvements. Mackenzie goes on to highlight that the emphasis on reducing fuel consumption continually reduced throughout the 1980s by over 120% and remained near or below 0 through the 1990s (MacKenzie, 2009). Thus, the digital age occurred during the U.S. light-duty market’s recovery from the disturbance and response of the power wars and regulation ages through successfully integrating technology regulation and consumer preferences.
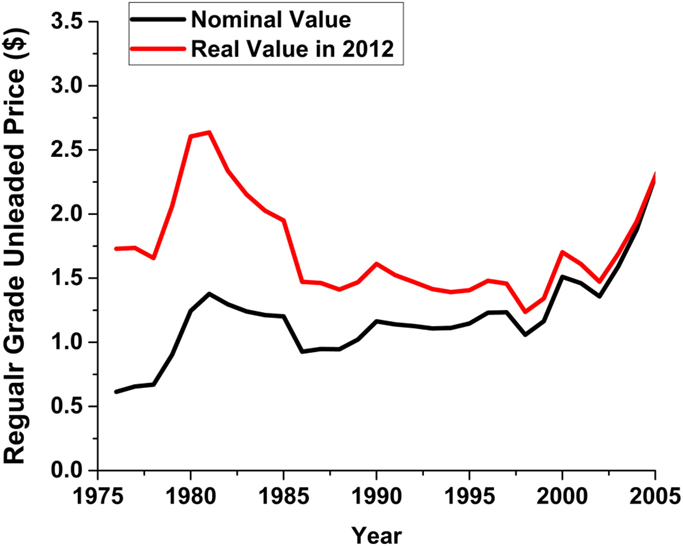
Figure 6. Average fuel price trends in nominal value (black) and real value in 2–12 (red) during the “digital age.” Data were taken from EIA (U.S. Energy Information Administration, 2012; Alson et al., 2014; Energy Information Agency, 2015).
CO2 Age
The transition from the digital age to the “CO2 age” is not well defined, but it is generally marked by legislated fuel economy and CO2 improvements (Federal Register, 2012). For example, in 2005 the combined car/light truck corporate average fuel economy (CAFE) requirement was raised for the first time in a decade from 20.7 to 21.0 mpg. However, the car portion of the CAFE requirement was not raised; thus, the light truck sales fraction needed to compensate for the combined CAFE target. Then in 2007, the Energy Independence and Security Act (EISA) was signed into law (110th Congress 121 STAT, 2007). The legislation of EISA and the corresponding adoption by the National Highway Traffic Safety Administration resulted in an approximate doubling of CAFE mandates by 2025 as “… an Act to move the U.S. toward greater energy independence and security, to increase the production of clean renewable fuels, to protect consumers, to increase the efficiency of products, buildings, and vehicles, to promote research on and deploy greenhouse gas capture and storage options, and to improve the energy performance of the Federal Government, and for other purposes.” (Energy Independence and Security Act of 2007, 2007) These ruling were “… consistent with the President’s request, responds to the country’s critical need to address global climate change and to reduce oil consumption,” (Federal Register, 2012) which established EPA regulation of CO2 as a greenhouse gas with CO2 emissions standards being implemented in the light-duty sector for MYs 2017–2025.
The CO2 age is relatively young at the time of this study. For example, EISA legislation is less than a decade old, and the formal rollout of EISA-directed fuel economy policy is less than 5 years old. Therefore, data quality and the significance of the CO2 age are reduced relative to the aforementioned light-duty ages. However, even in the present relatively young deployment stage of the CO2 age, significant changes relative to historical trends can be seen. For example, Figure 7 illustrates the dramatic uptick in fuel economy that has already occurred in the CO2 age. Note that the other ages of light duty are indicated for historical reference.
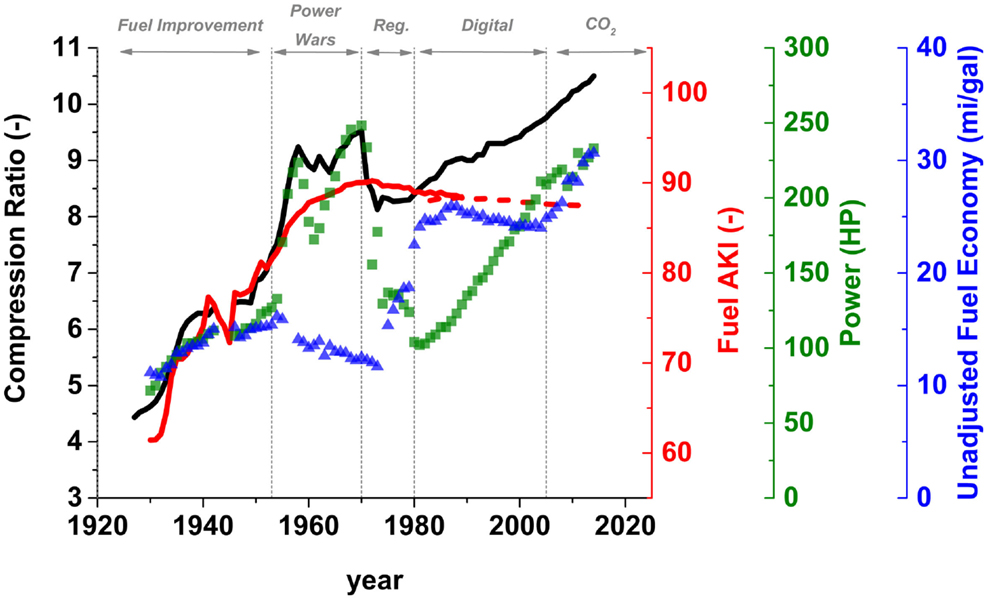
Figure 7. Average market trends in fuel AKI (red), compression ratio (black), unadjusted fuel economy (blue), and power (green), with age bins indicated. Data sources are listed in Table 1.
Additionally, fuel economy data of (Kohl, 1969) used speeds of 30, 40, 1 md 70 mph, while (Caris et al., 1956) used speeds of 20, 40, and 60 mph. To adjust for speed testing differences between (Caris et al., 1956) and (Kohl, 1969), the fuel economy of (Caris et al., 1956) was adjusted so that years overlapping data of (Kohl, 1969) were equal.
As seen in Figure 7, the CO2 age is the first time since 1952 when fuel economy, power, and compression ratio have all trended together. This contrasts with the trend in fuel economy improvement and power reduction during the regulation age, when significant technical challenges and a lack of digital design tools and electronic engine control and management prevented simultaneous gains. It has been suggested that a similar approach could be used today; however, the magnitude at which weight can be reduced is somewhat restricted by safety and consumer preferences more today than during the regulation age (Leone et al., 2015; Pawlowski and Splitter, 2015).
Historical Trends of the Ages
An alternative approach to examining fuel economy is transportation efficiency, which is defined as the fuel consumed to travel a given distance normalized to vehicle weight. For light-duty vehicles, this metric is commonly defined as gallons per ton-mile (gal/ton-mi). Figure 8 displays the same data that are in Figure 7, but fuel economy is replaced with transportation efficiency. Even when regulation was not present in the fuel improvement age, there was significant improvement in transportation efficiency. Figure 8 also shows the disturbance and response to transportation efficiency during the power wars and regulation ages. Ignoring these two eras as outliers, a third-order fit describes the trend in transportation efficiency from 1930 to today, despite the changes in the light-duty market from fuels, regulation, and controls. Although this fit is extremely good, it ultimately is non-physical as further extrapolation of the third-order fit reveals negative transportation efficiency; clearly, there must be additional factors unaccounted for in transportation efficiency that should be considered in defining fuel consumption metrics.
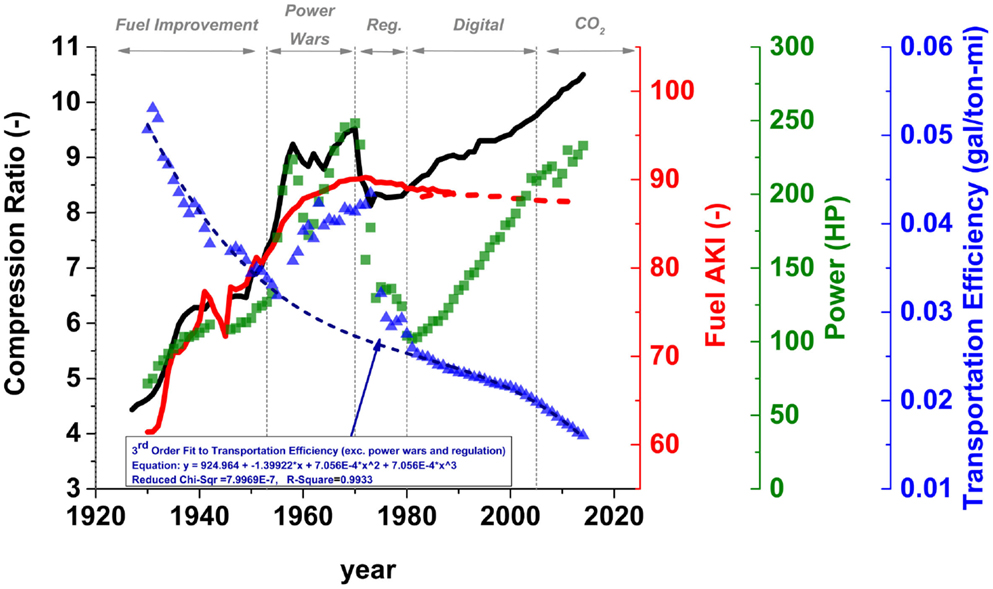
Figure 8. Average market trends in fuel AKI (red), compression ratio (black), transportation efficiency (blue), and power (green), with age bins indicated. Data sources are listed in Table 1.
The previous historical development age sections have shown that technology, regulation, and consumer preference have dictated the light-duty market through the ages. However, transportation efficiency seems inadequate to capture the complete relationship and interplay of these factors. It could be argued that transportation efficiency captures the regulatory and technical aspects well, but during the interim period of the power wars, consumer preference aligned with increased vehicle performance enabled by low-cost high AKI fuel with reduced emphasis on fuel economy or emissions. To better integrate consumer preference into the analysis, modifying transportation efficiency by normalizing vehicle transportation efficiency by vehicle power is proposed. This modification will allow the bias toward fuel economy or power in the utilization of engine performance and efficiency fundamentals like compression ratio to be better integrated into the historical progression. This effectively incorporates the influence of the consumer into the aforementioned ages though an emphasis on vehicle performance.
The result of this approach is seen in Figure 9. The trend shows an overall increase in transportation efficiency [numerically decreasing (i.e., reduced fuel usage)]. Interestingly, analyzing the data in this manner results in relatively constant transportation efficiency per unit power during the power wars and regulation ages, where transportation efficiency shows a clear increasing and decreasing trend, respectively (Figure 9). The flat trend in Figure 9 does not indicate that there was no technical progression; Figure 1 clearly shows that there was significant improvement to the fuel octane number and compression ratio (relative to the respective 80 AKI and 6.8:1 compression ratio achieved by the end of the fuel improvement age). Rather, the flat trend during the power wars and regulation ages is a result of the cancelation of two opposing factors – greater performance and reduced transportation efficiency. Thus, ignoring these ages is inaccurate from a technical perspective, but it is clear that the fuel improvement, digital, and CO2 ages show a clear progression in transportation efficiency per unit power regardless of the regulatory, technical, and consumer preference aspects within each age. In light of the legislated fuel economy mandates by EISA, a flat trajectory will not be sustainable going forward.
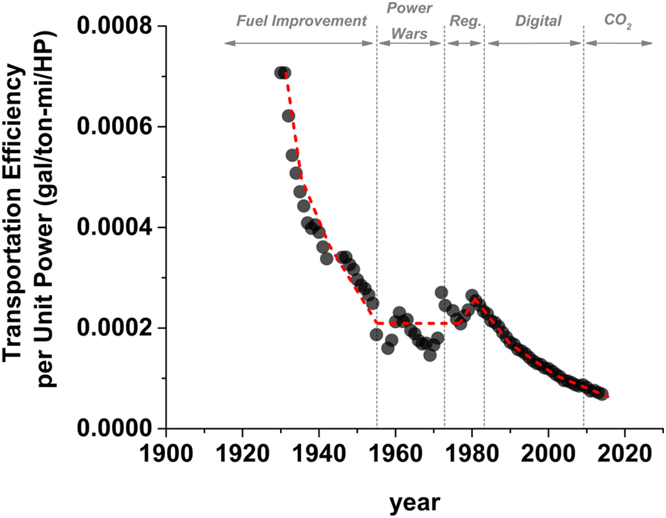
Figure 9. Average market trends in transportation efficiency per unit power with age bins indicated. Data sources are listed in Table 1.
The results of ignoring the power wars or regulation ages in transportation efficiency per unit power are seen in Figure 10, where an exponential decay fit (dashed red line) is overlaid that corresponds well. It is inferred that the progression of technology, consumer preferences, and regulation have interacted with each other on an exponential basis, and that going forward, the improvement expected is exponentially challenging to continue at the historical rate experienced. To sustain the historical rate of improvement of transportation efficiency per unit power, significant investment will likely be required. With this in mind, it is interesting to note that in Figure 8 all parameters but fuel AKI are trending upward together in the CO2 age. The only other period that fuel economy, power, and compression ratio all trended together was in the fuel improvement age, where unlike in the CO2 age, fuel octane number also increased. The engine technologies developed and deployed in the 1980s were extremely effective at increasing engine performance and compression ratio with stagnant fuel octane number. However, it has been shown that many of these technologies are mature in the market (Figure 5). Thus, with the looming emphasis on unprecedented increases to fuel economy in the current CO2 age, it is hard to argue that the current stagnant fuel octane number can be sustainable over the long term. Therefore, increasing fuel octane number offers significant motivation to achieve fuel economy and CO2 targets, which continue to be of primary concern.
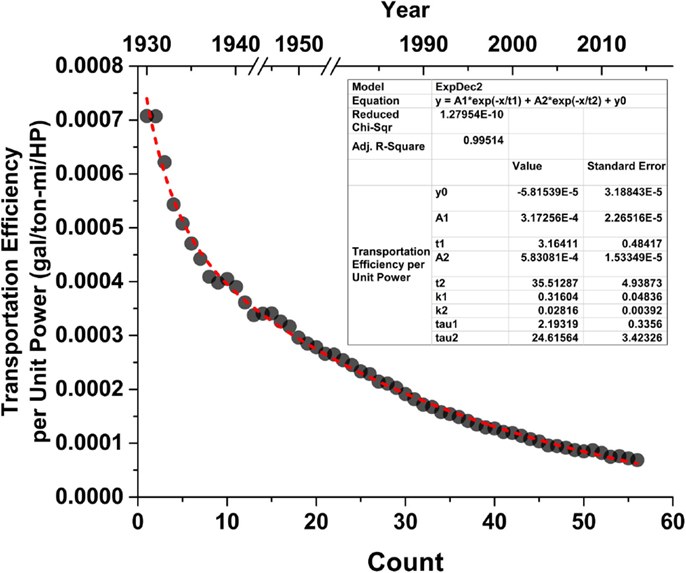
Figure 10. Average market trends in transportation efficiency per unit power with power war and regulation ages omitted and exponential decay curve fit applied (red line). Data sources are listed in Table 1.
Discussion and Future Directions
The analysis section presents specific engine, fuel, and vehicle historical data in historical context. There are key relationships between regulation, technical ability, and consumer preferences that affect light-duty transportation sales, which currently require significant effort to achieve legislated fuel economy targets. The present section examines some possible scenarios to improve fuel economy in the near-to-mid-term and describes technology options. Note that there are several non-mutually exclusive pathways to increase fuel economy; the present analysis explores fuel economy improvements from the powertrain alone.
Downsize Downspeed
The analysis section described the evolution of personal mobility and the ways that mobility has been influenced by technological, consumer, and regulatory influences. Currently, the U.S. light-duty market is evolving through downsizing and downspeeding (Pawlowski and Splitter, 2015), as evidenced by increased continually variable transmission (CVT) or 6+ speed transmissions, gasoline direct injection, and turbocharging within the marketplace (Alson et al., 2014). These technologies can be prime movers or on-demand power for range-extending hybrid powertrains. Regardless of the final powertrain configuration, it has been shown that smaller-displacement, high-output engines can reduce the relative effects of friction and pumping losses, improving the efficiency and associated fuel economy (Fraser et al., 2009; Shahed and Bauer, 2009; Thomas, 2014; Turner et al., 2014; Pawlowski and Splitter, 2015).
Studies have suggested that the powertrain benefits offered by downsizing and downspeeding could increase fuel economy by as much as 10% (Leone et al., 2015) to 20% (Lecointe and Monnier, 2003; Bandel et al., 2006), depending on the starting platform and the fuel that is used, as long as losses like crevice-borne hydrocarbon emissions do not increase (Smith and Cheng, 2013), and sufficient boost can be delivered (Fraser et al., 2009). It has been suggested that the ability to downsize has a greater possibility with high-octane fuels, with octane numbers greater than current market premium fuel (Splitter and Szybist, 2014a,b). These studies provide evidence that the U.S. fuel supply could require co-evolution with ever-advancing engine technologies to maintain the trajectory observed in Figure 10.
Evolving Fuel Supply Needs with Regulation and Technology
Gasoline is both historically and currently the primary light-duty fuel sold in the U.S. Gasoline typically is sold in multiple grades, where regular-grade (87 AKI) and premium-grade (92 AKI) blends are the most common, and midgrade (89 AKI) has generally had a sales percentage comparable to premium over the last 25 years (Energy Information Agency, 2015). Additionally, in some high-altitude regions of the U.S., 85 AKI regular grade is marketed. Loene et al. (Leone et al., 2015) state that the presence of 85 AKI fuel requires manufacturers to accommodate a worst-case scenario approach for consumer fuel choice. The result of this is that the engine design and control strategy is limited to an 85 AKI fuel for manufacturers’ durability and warranty considerations. Studies by the CRC (CRC Emissions Committee of the Coordinating Research Council, 2015) have shown that 85 AKI E10 regular grade exhibits linearly decreasing fuel economy with engine vehicle speed as compared to 87 AKI E10 when used in 2008–2013 MY vehicles. The study showed that the fuel economy reduction at highway cruise speeds (~50 mi/h) was ~1.75% of ~2.25% at elevations of 1000 or 5000 feet above sea level, respectively, and that increased vehicle speed and engine load cycles (i.e., US-06 test cycle) showed even greater disparity. Therefore, the presence of 85 AKI in a small portion of the market is a means that inadvertently limits engine efficiency and vehicle fuel economy for all vehicles within the entire market regardless of whether 85 AKI fuel is available as a consumer fuel choice for a given location.
Since there are multiple fuel grades available in the U.S., manufacturers could calibrate and design vehicles to take advantage of the AKI benefits offered by premium-grade fuel. However, the EPA mandates that a vehicle cannot deviate more than 3% in fuel economy between regular- or premium-grade certification fuels (91 and 96 RON, respectively), unless the manufacturer specifies that premium-grade fuel is required (Armstrong, 1997). This places the onus of proper fueling for both vehicle operation (i.e., durability) and fuel economy on the consumer. Economists and market analysts have shown that consumers tend to bias purchasing decisions to the current fuel price at point-of-sale venders (i.e., regular-grade fuel sales increase when fuel prices increase and premium-grade fuel sales increase when fuel price decline) (Hastings and Shapiro, 2012). For example, Greene investigated consumer fuel purchasing behavior in the 1980s and noted that consumer fuel purchasing habits were elastic to fuel price but also went on to illustrate that consumers are highly compliant in using the fuel type recommended by the manufacturer or required by law (i.e., leaded or unleaded) (Greene, 1989).
The present study highlights consumer purchasing trends in Figure 11, which illustrates the sales dependencies between premium fuel and vehicles that require or recommend premium fuel in the U.S. Specifically, the red bars display the sales percentage of new vehicles that either require or recommend premium-grade fuel. That trend shows very little gain in market share since MY 2000, with approximately 8–10% of the market sales since CAFE requirements began to increase in MY 2005. This market share of vehicle that recommend/require premium also agrees with the recent volume sales percentage of premium (dashed black line). Moreover, over the previous 30 years, the premium fuel-grade sales fraction has actually decreased. Premium fuel’s sales fraction correlates not only to the number of vehicles that require premium but – potentially better – also to the nominal value difference between premium- and regular-grade fuels (dark blue line).
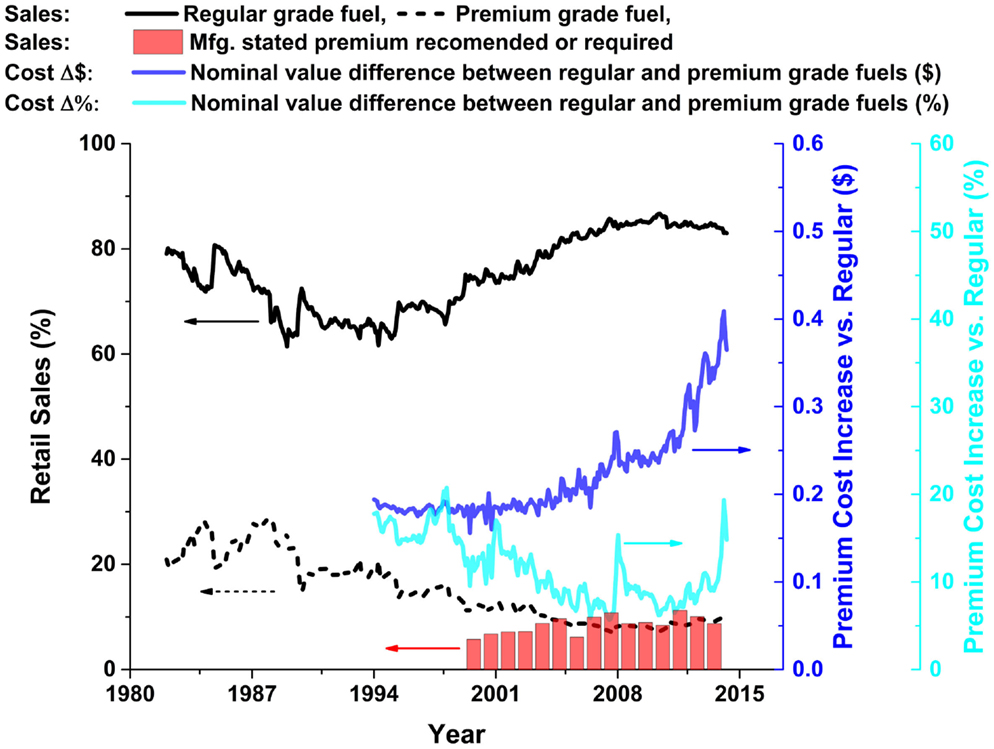
Figure 11. Market trends in regular-grade (black) and premium-grade (dashed black) fuel sales, the absolute cost increase of premium-grade vs. regular-grade fuel in nominal value (blue line), the relative cost increase in premium-grade vs. regular-grade fuel in nominal value (cyan), and the market sales percentage of premium fuel required and/or recommended of U.S. vehicles (red bars). Engine data are from Wards; fuel data are from the EIA (Wards Auto, 2000, 2001, 2002, 2003, 2004, 2005, 2006, 2007, 2008, 2009, 2010, 2011, 2012, 2013, 2014; U.S. Energy Information Administration, 2012; Energy Information Agency, 2015).
It is worth noting that over the last 30 years, consumer preference and purchasing habits of premium-grade fuels have changed. Specifically within the last 10 years, premium fuel sales volume has become stagnant at approximately 10% of the total fuel sales volume. Simultaneously, the absolute cost increase of premium-grade fuel has increased compared to that of regular-grade fuel. Hirshfeld et al. (2014) showed that refinery costs to produce current premium fuel are only a few cents higher per gallon than today’s regular-grade fuel. Thus, using the results of Hirshfeld et al. (2014), the recent cost increase of premium-grade fuel relative to regular grade (approximately $0.40 in 2014) suggests that there could be increased markup on premium-grade fuel. Moreover, the presence of and continued consumer purchasing reduced cost 85 AKI fuel in higher altitude western regions of the U.S. – which original equipment manufacturer (OEM) manufacturers currently do not recommend for use in their vehicle (National Institute of Standards and Technology Laws and Regulations Committee, 2013; CRC Emissions Committee of the Coordinating Research Council, 2015) – further illustrates how strongly cost has come to influence recent consumer fuel grade purchasing preferences. Interestingly, these recent trends in consumer fuel grade purchasing not agree with the previous in-depth work by Greene during the 1980s (Greene, 1989), which suggested that consumers were willing to choose higher octane or slightly more expensive premium fuel – and at the time of Greene’s work including unleaded vs. leaded – required to meet the vehicles octane/design requirements. Therefore, current consumer trends in regular grade or sub-regular grade AKI fueling choice suggest that if increased fuel economy is to be enabled by increased octane number, market fuel octane number should be increased.
A technically viable strategy to increase fuel economy could increase the sales volume of vehicles that are “premium required.” To quantify this limiting case opportunity of increasing the fleet fuel economy through vehicle fuel requirement, Leone et al. suggest that if all current fleet vehicles were recertified and re-flashed for premium certification fuel, a 0.5–2.5% increase in fuel economy might be possible (Leone et al., 2015). While this gain is somewhat trivial with respect to the gap in fuel economy between current trends and future targets, it does have the potential to increase the fuel economy of a portion of the existing car fleet. Note that there is effectively no technical issue from a knock and performance standpoint with fueling vehicles with higher octane number fuel than required. Although technically possible, the present consumer adoption of this strategy shown with the trends in Figure 11 and economic and consumer purchasing preferences (Greene, 1989; Hastings and Shapiro, 2012), suggests that current consumer acceptance of this strategy could be reduced as compared to 30 years ago (Greene, 1989). Regardless of current consumer preference, a change in fuel required could enable new engine designs that require increased octane number fuels from higher compression ratio and potentially increase the opportunity to downsize and downspeed.
Figures 7 and 8 illustrate that increasing fuel octane can increase fuel economy. However, there is no unique option to raise the fuel octane number. History has shown that the method to raise octane is important and must consider not only technical barriers and challenges (e.g., Figure 2) but also health effects, scalability, cost, and environmental factors. In 1907 White found that “… the efficiency of an Otto cycle is a function of the compression ratio. It follows that in motors specifically constructed for alcohol we should expect a very high thermal efficiency, and this expectation is borne out in practice.” (White, 1907) When pathways to increase fuel octane number were investigated in the early twentieth century, lead was not the only chemical that was of interest. Many other compounds were investigated, including ethanol. In fact, 4 years prior to the discovery of TEL, Scientific American noted the following in 1918: “It is now definitely established that alcohol can be blended with gasoline to produce a suitable fuel that will avoid the difficulties of starting a cold motor on alcohol alone, and without any change in the carburetor or the compression of the engine.” (Scientific American, 1918; Kitman, 2000). Two years later, Kettering’s researcher Thomas Midgley filed for a patent on a production process and resulting fuel composition that today would be classified as E50 (Midgley, 1925). However, once TEL was discovered in 1922, the widespread integration of ethanol–gasoline blends faded.
Improving Fuel Octane Number through Ethanol
Although TEL replaced ethanol as an antiknock additive, research in the 1920s, like that by Cummins (Cummings, 1927), illustrated that the antiknock qualities of ethanol with n-heptane were some of the highest measured – greater than isooctane and comparable to benzene and toluene. Likewise, in 1936, Egloff showed that ethanol–gasoline blends exhibited vapor pressures that were acceptable for carbureted engines (Egloff and Morrell, 1936), while Brown quantified the octane increase possible with gasoline splash blends relevant in the 1930s (Brown and Christensen, 1936). These works were expanded upon in 1952 by Porter and Wiebe, who documented RON and MON response to blending ratios of ethanol and TEL with various hydrocarbon/distillate blending streams and illustrated that ethanol and TEL had similar potential to increase octane (Porter and Wiebe, 1952). In 1981 Ferfecki and Sorenson illustrated that 85 AKI gasoline with up to 25% ethanol could be used to reduce engine displacement by downsizing (up to 20% downsizing with E25) if the compression ratio was simultaneously increased with ethanol content at a constant knock-limited power condition (Ferfecki and Sorenson, 1981). These works show that ethanol has been known to be a viable high-octane fuel for over a century. Based on these and many other studies, there historically has been little question that ethanol can be used as an effective octane improving additive in gasoline.
Recent interest in ethanol as an octane enhancer began in the CO2 age. EISA requires that by year 2022, 36 billion gallons per year of biofuels must be used in transportation. This uptake in biofuels is a more than a sevenfold increase from the 4.7 billion gallons that were consumed annually when the law was enacted (Energy Information Agency (EIA), 2015a). As fuel economy improves and fuel demand falls, this mandate will effectively require increased biofuel blends (e.g., ethanol) with gasoline to be sold (regardless of the improvement to octane) above the “blend wall” that currently exists with E10. However, to date EPA has been waiving or reducing the biofuel market share based on current capacity and availability (Federal Register, 2015), illustrating that meeting EISA targets is extremely difficult at the present. The EPA website states the following regarding non-compliance of EISA statutory volume targets: “Congress clearly intended the RFS program to incentivize changes that would be unlikely to occur absent the RFS program … The proposed volumes would require significant growth in renewable fuel production and use over historical levels. EPA believes the proposed standards to be ambitious but within reach of a responsive marketplace.” (EPA Website, 2015). Therefore, using increased fuel octane number biofuels, such as ethanol, provides an opportunity to reduce fuel consumption, increase marketplace responsiveness, and to increase fuel source diversity as legislated by Congress.
Several studies have identified possible ethanol–gasoline fuel formulations that could lend themselves to enabling increased engine compression ratio, reduced tailpipe CO2, and minimally reduced tank fuel mileage by not over-diluting the energy content of the fuel with ethanol (Jung et al., 2013a; Splitter and Szybist, 2014a,b). These recent studies show that blends of ethanol between 20 and 40% could increase octane more than E10 or E15 blends, while not diluting fuel energy as mush as typical flex fuel (e.g., “E85”) blends that can range from 51 to 83% ethanol (ASTM Standard D 5798, 2014). Interestingly, intermediate ethanol–gasoline blends can readily be made such that the blended AKI is quite comparable to TEL–gasoline blends sold at the height of the power wars. For example, Figure 12 shows contour maps of blended fuel AKI with various hydrocarbon base stocks and TEL (left) or ethanol (right). The maps were compiled using data that spanned several hydrocarbon streams with a wide range in octane number (Porter and Wiebe, 1952; Forster and Klein, 1962; Stein et al., 2012; Foong et al., 2014). Results show that the 90 AKI regular-grade fuel with approximately 1.7–2.2 g-Pb/gal that was marketed during the 1960s required a base stock of ~ 83 AKI. Likewise, the 95 AKI premium-grade fuel with ~2.3–2.7 g-Pb/gal that was marketed during the 1960s required a base stock of ~ 89 AKI.
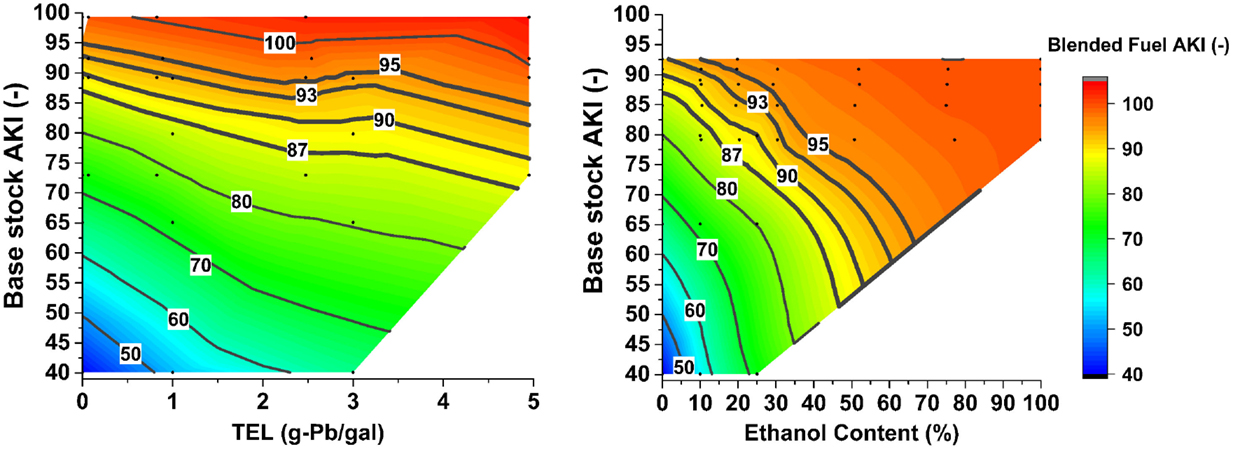
Figure 12. Response surfaces plots for TEL and ethanol AKI improvement as a function of the addition of various base stocks; dots represent data points. Data are from References (Porter and Wiebe, 1952; Forster and Klein, 1962; Foong et al., 2014).
The AKIs of the finished products’ base stocks were calculated from the average from 1960 to 1973 (the apex of AKI and TEL). Then, using the response curves in Figure 12, the corresponding base stock AKI was calculated for E15 regular-grade and E25 premium-grade fuels that matched the average finished AKI of the 1960–1973 time frame. The results in Figure 13 demonstrate that if almost the identical blend stock AKI is used with E15 and E25 blends vs. TEL, the finished product AKI matches historical fuels. This suggests that intermediate-level ethanol–gasoline fuels could be made to match the highest market average AKI fuels sold in U.S. history using matched base stock AKI. Additionally, an 87 AKI base stock was assumed with an E25 blend to illustrate that 87 AKI E0 with E25 blending is within 1 AKI point of historical premium fuel. Note that this assumes a fuel aromatic content that is consistent with fuel in the 1960s. Foong has illustrated that increased aromatic content can decrease ethanol octane AKI improvement on a per-unit volume (Foong et al., 2014). Therefore, potential differences in aromatic content between historical fuels and modern fuel could affect the base stock requirements in Figure 13. However, Gibbs showed that fuel aromatic content of the 1960s was within 5% of fuel in the 1990s (Gibbs, 1993), suggesting that the aromatic effects on octane response of today’s fuel could be minimal. Regardless, this approach illustrates a potential pathway to satisfy regulatory and technical considerations. Leone et al. (2015) suggested that increasing octane number with E25 holds the potential to increase vehicle fuel economy from increased compression ratio and downsizing. Using the findings of that study with the trends in Figure 12, an approximate 5% increase in engine efficiency could be anticipated by increasing fuel octane number to 90 AKI E15 or 95 AKI E25 as compared to current market regular grade 87 AKI E10. Thus, increasing fuel octane number alone from intermediate ethanol blends provides a pathway for improved engine efficiency. Note that this analysis does not consider consumer response, which is shown to be critical in the trends from Figures 10–12; therefore, engine and fuel properties may need to co-evolve within this approach.
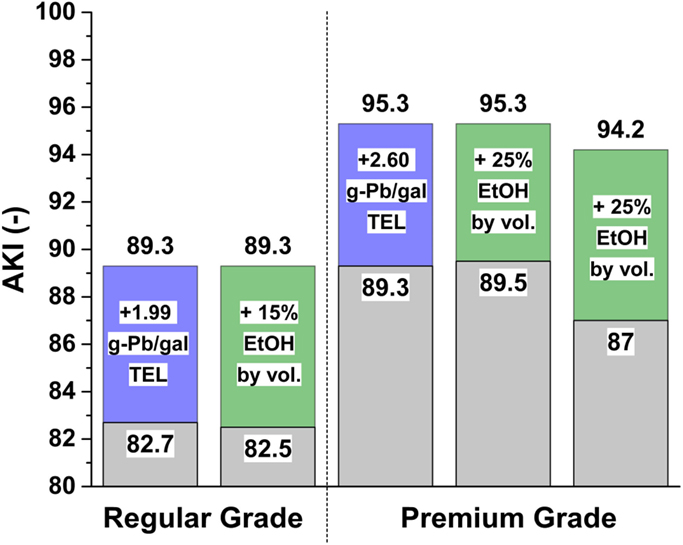
Figure 13. Estimate to match the average AKI of 1960–1973 regular and premium fuels as a function of historical base stocks and TEL concentrations by using ethanol and associated modern base stocks. Input data are from Porter and Wiebe (1952), Forster and Klein (1962), Stein et al. (2012), and Foong et al. (2014).
In addition to the octane number benefits of ethanol, several studies have indicated that complementary benefits to octane number can exist with intermediate ethanol–gasoline blends. Splitter and Szybist (Splitter and Szybist, 2014c) have shown that intermediate gasoline alcohol blends, like E30, have reduced combustion duration, and more recently Szybist and Splitter have shown improved dilution tolerance of similar E30 fuels over reference fuels and gasoline (Szybist and Splitter, 2016). Beyond flame speed and dilution tolerance effects, intermediate ethanol–gasoline blends have been shown to exhibit reduced combustion temperatures and increasing engine efficiency (Szybist et al., 2010; Jung et al., 2013b), which Szybist et al. illustrate could be a product of increased molar expansion ratio of alcohols compared to gasoline (Szybist et al., 2012). Many have indicated that the charge cooling of ethanol in direct injection engines offers reduced enrichment need (Stein et al., 2012, 2013; Jung et al., 2013a). An interesting recent study of Sluder et al. (2016) suggests that, in practice, fuel sensitivity – the fuel RON minus the fuel MON octane numbers – by default accounts for much of the charge cooling effects from direct fuel injection on fuel antiknock performance. Thus, these combined studies illustrate that the potential to increase engine performance and fuel economy offered through intermediate ethanol–gasoline blends extends beyond increased octane number alone.
While the present discussion and analysis do not include all possible factors, they do illustrate that increased fuel octane number from fuels like 89 AKI E15 and 95 AKI E25 could be a viable way to continue the trajectory in Figure 10 while striving to achieve regulated fuel economy targets. Currently, market fuel price indicates that using blends of ethanol of 25% or less by volume could be price competitive with gasoline. For example, since January 2009, the spot price of ethanol in Nebraska has tended to be on average 0.264 $/gal less expensive than gasoline (8.7% relative reduction in $/gal).1 The EIA projects that the price of ethanol and motor gasoline will begin to diverge in the coming decades, when ethanol is projected to be cheaper than gasoline (Energy Information Agency (EIA), 2015b). However, daily sources show that more recently the ethanol spot price can be higher than gasoline due to market volatility changes (Oil Price Information Services, 2015). Based on this and the current high volatility but consistent cost competiveness of ethanol and gasoline and a break even tank mileage possible from E20–E30 fuels (Jung et al., 2013a; Splitter and Szybist, 2014a), it seems possible that the national octane level of regular grade could be increased to 89 AKI via E15, and premium grade could be increased to 95 AKI via E25. Although compatibility will need to be considered for vehicles older than MY 2001, the EPA has declared that vehicles newer than MY 2001 are legally E15 compatible (Federal Register, 2011); with research supporting this work critically investigates differences between E15 and E10 and cites that no significant differences were found (West et al., 2012; McCormick et al., 2013). However, the EPA declaration and associated study findings are not mandates, and each vehicle manufacturer has the discretion to recommend E15 use in their vehicles. Additionally, new fuel dispenser installs in the U.S. can be UL listed safe for up to 25% ethanol with proper low-cost material compatibility options, which can also be installed as a retrofit onto many existing dispensers (Moriarty et al., 2014).
Combustion Process and Operating Strategy Improvements
From an engine technology standpoint, downsize and downspeed have taken hold in the U.S. market. Additionally, technology like cylinder deactivation has gained a non-trivial market share (Alson et al., 2014), which is an active method to downsize the engine on demand. The approach holds total engine output fixed by eliminating fueling and combustion in some cylinders while increasing the load in the remaining fired cylinders. This approach has been suggested to offer between a 4 and 14% fuel economic benefit, depending on applications and base engine design (Leone and Pozar, 2001). New advances in control approaches have been shown to offer pathways to reduce vibrational issues and expand the range of applicability of a variable displacement approach and offer fuel economy improvements up to 20% improvement (Wilcutts et al., 2013). However, in variable displacement approaches, the fact that the fired cylinders can become knock-limited reduces the potential of this approach to increasing fuel economy (Leone and Pozar, 2001).
The present study has focused on SI engines, yet other engine technologies exist that have increased engine efficiencies and, thus, have improved fuel economy. A well-known mature engine technology is the compression ignition engine. Conventional compression ignition combustion engines (i.e., mixing limited diesel combustion) are not limited by knock and, thus, can achieve high thermal efficiencies from increased compression ratios. Additionally, new unconventional thermodynamic compression ignition cycles have been suggested to achieve fuel economy improvements from reduced heat transfer losses [i.e., opposed piston two stroke engines (Herold et al., 2011) or free piston engines (Teh et al., 2008; Kosaka et al., 2014; Hanipah et al., 2015)]. Although conventional or new unconventional compression ignition engines offer high fuel economy potential (Akihama et al., 2001; Inagaki et al., 2011), the total cost of ownership varies where high upfront cost premium of compression ignition powertrains and fuel cost could be influential factors (Belzowski, 2015). Regardless of the rationale, since 1984 less than 2% of the U.S. light-duty fleet sales have been from compression ignited (i.e., diesel combustion) powertrains (Alson et al., 2014). However, recent studies have shown that diesel-like engine efficiencies have been demonstrated through advanced or low-temperature combustion concepts. These include some approaches that use SI-type engine designs or gasoline-like fuels, making them more akin to the majority of current and historical light-duty powertrains. Presently, there are many competing methods for achieving this. Some examples that have been investigated include advanced combustion strategies (Kimura et al., 1999; Manente et al., 2009; Yao et al., 2009; Dec and Yang, 2010; Kokjohn et al., 2011; Sellnau et al., 2015). Although low-temperature combustion concepts are all very relevant and promising, the near-term deployment of them remains to be fully proven. Many of these concepts show that there remain technical challenges that need to be addressed in the areas of controls, noise, drivability, load range, transients, and overall maturity of the combustion concept and/or unique base engine design before widespread market adoption. An alternative approach to reduced combustion temperatures and increase engine efficiency is through air or cooled exhaust gas recirculation (EGR) dilution in an SI engine (i.e., combustion process remains turbulent flame propagation combustion). Studies with homogeneous and stratified mixtures using air (Harada et al., 1997; Stokes et al., 2000) and/or EGR dilution (Alger and Mangold, 2009; Alger et al., 2009; Ikeya et al., 2015) have illustrated significant efficiency benefits similar to that achieved with advanced combustion concepts but with reduced combustion control, combustion noise, or system complexity. The technical, economic, and regulatory aspects of reduced temperature combustion through advanced or highly dilute SI approaches remain to be proven in the market, but the trends in Figure 10 suggest that the technology cost and performance must balance for adoption. Regardless of whether adoption of these high-efficiency engine strategies is possible, it has been shown that advanced combustion and highly dilute SI engine concepts are compatible with and even can offer improved efficiency potential with high-octane-number gasoline–ethanol fuel blends, suggesting that increases in fuel octane number will not prevent adoption of these strategies in the future (Splitter et al., 2011; Dempsey et al., 2012; Kalaskar et al., 2014; Szybist et al., 2014; Gao et al., 2015).
Hybridization
Hybridization combines engines and electric motors as a way to leverage positive attributes of each technology, including an enabling path for moving engine operating conditions to high-efficiency areas. To do so, hybrid powertrains virtually eliminate low-load engine operation and result in engine operation at or close to the knock limit. Thus, if engine efficiency can be increased through compression ratio enabled by fuel AKI increase, hybrid powertrains can leverage and compound engine efficiency increases to even further improve fuel economy. This ability illustrates that hybrid powertrains are complementary to high efficiency or advanced combustion concepts. However, unlike advanced combustion concepts, hybrid technologies have been in the market in excess of 10 years (Alson et al., 2014) with an annual sales market share of 4% in 2014. Thus, it is appropriate and possible to evaluate the consumer, regulatory, and technical factors expressed in the trend relative to hybrids (Figure 10). There is little argument that hybrid cars can be class leaders in fuel economy (Alson et al., 2014; Fueleconomy.gov, 2015); however, hybrid vehicles tend to retail at a price premium ($100–$4500) compared to conventional gasoline vehicles. As a result, hybrid sales tend to be proportional to near-term economic factors, such as fuel price. Figure 14 illustrates this trend in terms of monthly hybrid sales relative to monthly market fuel price, which shows that hybrid sales correlated strongly with market fuel price (i.e., near-term economics influenced consumer vehicle purchasing preferences) (Cobb, 2015). Although this trend is strong, there were two instances when the correlation deviated, but both can be explained by regulation and market factors that influenced consumer choice or availability.
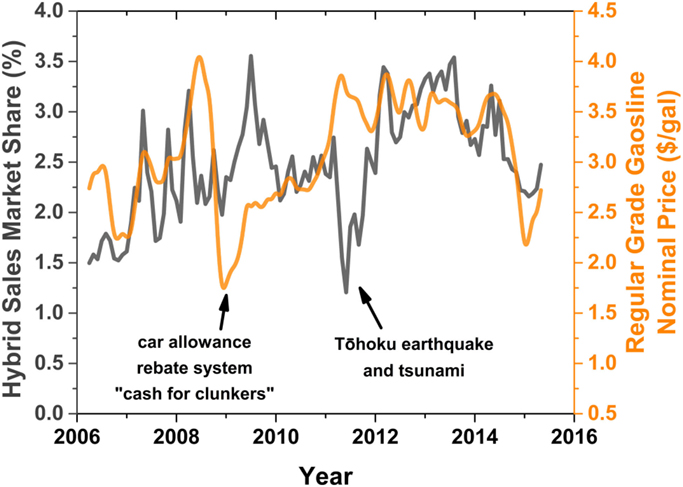
Figure 14. Average market trends, hybrid sales, and unleaded fuel price. Data are from EIA and hybridcars.com (sourced from Polk) (U.S. Energy Information Administration, 2012; Cobb, 2015).
The first deviation occurred in 2009, when hybrid sales increased even though fuel price decreased; the Car Allowance Rebate System (National Highway Traffic Safety Administration, 2009) was in effect (i.e., “cash for clunkers”), incentivizing consumers to buy more fuel efficient vehicles. The second deviation occurred in 2011, when hybrid sales declined even though fuel prices increased; this anomaly can be attributed to the limited supply of hybrid system components that was caused by the Tohoku earthquake and tsunami that struck Japan, temporarily cutting resources and operations at Japanese suppliers and OEMs, in particular Toyota (Trefis Team, 2011). Ignoring these two disturbances, the overall trend is quite good and that with flat or decreasing market fuel price, it seems unlikely that un-incentivized hybrid sales alone will meet aggressive CAFE targets.
Hybrid powertrains are not independent of, but rather work in tandem with, engine advancement. For example, the Toyota Prius, continually the best-selling hybrid vehicle in the U.S., has achieved low CO2 emissions not only from its hybrid system arrangement and vehicle efficiency gains but also from increases in thermal efficiency. Toyota has improved peak efficiency in the Prius’s internal combustion engine from 37% for its first generation to nearly 40% expected for its fourth generation (Shimizu, 2015). Just as future gains in engine efficiency will improve hybrid vehicle efficiency, electrification has and will continue to complement internal combustion engine strategies and technologies (Kleeberg et al., 2006). Based on this, if engine technology improves, the market competition between electrification and combustion will continue. For example, a 2012 economic analysis by McKinsey & Associates (Hensley et al., 2012) that found price-competitive curves for vehicles including battery-electric, plug-in hybrids, hybrid vehicles, and conventional powertrains (engines) were highly dependent on battery prices and gasoline prices. Their data show that while battery prices have slowly begun to decline (nearing price competitiveness of battery-electric vehicles), future gains in engine efficiency improve the competitiveness of combustion powertrains, including conventional, hybrid, and plug-in hybrid systems. Thus, there is a feedforward mechanism for engine efficiency improvements that can migrate into hybrid powertrains, and ultimately into consumer preferences. The effect that this has on the trajectory in Figure 10 is uncertain, but the data in Figures 10 and 14 support the theory that without direct regulatory action, consumer economic preference will likely be the near-term deciding factor in hybrid market adoption.
Conclusion
In this work, the authors reviewed engine, vehicle, and fuel data since 1925 to examine the historical and recent coupling of compression ratio and fuel antiknock properties (i.e., octane number) in the U.S. light-duty vehicle market. Analysis showed that consumer, technical, and regulatory bodies all affect the light-duty U.S. automotive market. Specifically, since 1925 there have been five definable ages of development. During each age, there have been critical factors that have affected the immediate co-evolution of fuels and engines. However, a long-term trend of improvements to transportation efficiency per unit power (gal/ton-mi/hp) has persisted, with strong evidence of an exponential decay as a function of time. Therefore, this trend appears to at least somewhat capture or account for consumer, technical, and regulatory body actions throughout history.
Based on this long-term trajectory and interdependence of controlling factors in the light-duty market, the continued improvement to transportation efficiency per unit power will require continued co-evolution of fuels and engines. The historical analysis presented in this work shows that fuel octane can be an enabler for increasing engine efficiency. Until the 1970s, co-evolution of fuels and engines occurred from improvements to fuel refining technologies and octane improvement through TEL addition. However, since fuel lead removal began in the mid-1970s, fuel octane number has remained stagnant while engine efficiency and performance improvements have resulted from digital controls and design refinements. This relaxation of the fundamental coupling between fuel octane number and engine compression ratio is a long-term unsustainable trajectory, as for a given octane number engine compression ratio will ultimately be limited by available technologies. Recent regulations that further reduce CO2 emissions present new challenges to improve engine and vehicle efficiencies that have prompted the need to reexamine if and how fuel consumption could decrease through increasing fuel octane number. It was found the incremental increase in fuel ethanol content from E10 to E15 and E10 to E25 could enable fuel octane number to increase from 87 to 90 AKI and 92 to 95 AKI for regular and premium grades, respectively. Additionally, these finished fuels could be achieved by blending ethanol with base stock fuel octane numbers identical to those historically used for leaded fuels. Therefore, an incremental increase in fuel octane number from a 5 to 15% increase in fuel ethanol content could be a process that enables continued future evolutionary changes to personal mobility that comply with historically documented consumer technical and regulatory trajectories.
Author Note
This manuscript has been authored by UT-Battelle, LLC, under Contract No. DE-AC0500OR22725 with the U.S. Department of Energy. The United States Government retains and the publisher, by accepting the article for publication, acknowledges that the United States Government retains a nonexclusive, paid-up, irrevocable, worldwide license to publish or reproduce the published form of this manuscript, or allow others to do so, for the United States Government purposes. The Department of Energy will provide public access to these results of federally sponsored research in accordance with the DOE Public Access Plan (http://energy.gov/downloads/doe-public-access-plan).
Conflict of Interest Statement
The authors declare that the research was conducted in the absence of any commercial or financial relationships that could be construed as a potential conflict of interest.
Acknowledgments
The authors graciously acknowledge Susan Diegel for providing access to Wards Auto data for Model Year 2000–2014.
Supplementary Material
Data used in the figures and supporting analysis for the present manuscript has been made publicly available at, https://www.frontiersin.org/article/10.3389/fmech.2015.00016
Please note that reproduction and use of this data and analysis is unlimited for personal not for profit means with proper citation of the original data source, the present manuscript including acknowledgment of the analysis presented herein. Reproduction for the data or present analysis for commercial publication, and or for profit means or other means than personal use, is unauthorized without consent of the authors.
Abbreviations
AFR, air–fuel ratio; AKI, antiknock index; CAFE, corporate average fuel economy; CARB, California air resources board; CO, carbon monoxide; CVT, continuously variable transmission; E15, 15 percent ethanol 85 percent gasoline; E25, 25 percent ethanol 75 percent gasoline; E85, 85 percent ethanol 15 percent gasoline; ECU, engine control unit; EGR, exhaust gas recirculation; EISA, energy independence and security act; EPA, environmental protection agency; EtOH, ethanol; gal, gallon; g-Pb, grams of tetraethyl lead; gpm, grams personal Mile; HP, horsepower; mi, mile; MON, motor octane number; MY, model year; NOx, oxides of nitrogen; OEM, original equipment manufacturer; PFI, port fuel injection; RON, research octane number; SI, spark ignition; TEL, tetraethyl lead; ton, 2000 pounds; USD, United States dollars; VOCs, volatile organic compounds; VVT, variable valve timing.
Footnote
- ^Sorum S., and Sneller T., Nebraska Ethanol Board, private communication, greater Omaha Nebraska monthly spot price of terminal fuels.
References
1995-1997 Analysis Panel of the CRC Octane Group. (1999). 1995-1997 CRC Octane Number Requirement Survey. CRC Report No. 575 CM-137-98. Atlanta, GA, 210. Available at: http://www.crcao.org/reports/motofuel/det-fs.htm
Akihama, K., Takatori, Y., Inagaki, K., Sasaki, S., and Dean, A. M. (2001). Mechanism of the Smokeless Rich Diesel Combustion by Reducing Temperature. SAE Technical Paper No. 2001-01-0655.
Alger, T., Chauvet, T., and Dimitrova, Z. (2009). Synergies between high EGR operation and GDI systems. SAE Int. J. Engines 1, 101–114. doi: 10.4271/2008-01-0134
Alger, T., and Mangold, B. (2009). Dedicated EGR: a new concept in high efficiency engines. SAE Int. J. Engines 2, 620–631. doi:10.4271/2009-01-0694
Alson J., Hula A., and Bunker A. (2014). Light-Duty Automotive Technology, Carbon Dioxide Emissions, and Fuel Economy Trends: 1975 through 2014 (EPA-420-R-14-023). Ann Arbor, Michigan: US Environmental Protection Agency, Available at: http://www3.epa.gov/fueleconomy/fetrends/1975-2014/420r14023a.pdf [accessed June 10, 2015].
1982 Analysis Panel of the CRC Light-Duty Octane Number Requirement Survey Group. (1983). 1982 CRC Octane Number Requirement Survey. CRC Report No. CM-123-82. Atlanta, GA, 266. Available at: http://www.crcao.org/reports/motofuel/det-fs.htm
1983 Analysis Panel of the CRC Light-Duty Octane Number Requirement Survey Group. (1984). 1983 CRC Octane Number Requirement Survey. CRC Report No. 539 CM-123-83. Atlanta, GA, 242. Available at: http://www.crcao.org/reports/motofuel/det-fs.htm
1984 Analysis Panel of the CRC Light-Duty Octane Number Requirement Survey Group. (1985). 1984 CRC Octane Number Requirement Survey. CRC Report No. 544 CM-123-84. Atlanta, GA, 270. Available at: http://www.crcao.org/reports/motofuel/det-fs.htm
1985 Analysis Panel of the CRC Light-Duty Octane Number Requirement Survey Group. (1986). 1985 CRC Octane Number Requirement Survey. CRC Report No. 548 CM-123-85. Atlanta, GA, 169 p. Available at: http://www.crcao.org/reports/motofuel/det-fs.htm
1986 Analysis Panel of the CRC Light-Duty Octane Number Requirement Survey Group. (1987). 1986 CRC Octane Number Requirement Survey. CRC Report No. 553 CM-123-86. Atlanta, GA, 165 p. Available at: http://www.crcao.org/reports/motofuel/det-fs.htm
1987 Analysis Panel of the CRC Light-Duty Octane Number Requirement Survey Group. (1988). 1987 CRC Octane Number Requirement Survey. CRC Report No. 561 CM-123-87. Atlanta, GA, 178 p. Available at: http://www.crcao.org/reports/motofuel/det-fs.htm
1988 Analysis Panel of the CRC Light-Duty Octane Number Requirement Survey Group. (1989). 1988 CRC Octane Number Requirement Survey. CRC Report No. 566 CM-123-88. Atlanta, GA. 186 p. Available at: http://www.crcao.org/reports/motofuel/det-fs.htm
1989 Analysis Panel of the CRC Light-Duty Octane Number Requirement Survey Group. (1990). 1989 CRC Octane Number Requirement Survey. CRC Report No. 570 CM-123-89. Atlanta, GA, 162 p. Available at: http://www.crcao.org/reports/motofuel/det-fs.htm
1990 Analysis Panel of the CRC Light-Duty Octane Number Requirement Survey Group. (1991). 1990 CRC Octane Number Requirement Survey. CRC Report No. 575 CM-123-90. Atlanta, GA, 206 p. Available at: http://www.crcao.org/reports/motofuel/det-fs.htm
1992 Analysis Panel of the CRC Light-Duty Octane Number Requirement Survey Group. (1993). 1992 CRC Octane Number Requirement Survey. CRC Report No. 575 CM-123-92. Atlanta, GA, 168 p. Available at: http://www.crcao.org/reports/motofuel/det-fs.htm
1993 Analysis Panel of the CRC Light-Duty Octane Number Requirement Survey Group. (1994). 1993 CRC Octane Number Requirement Survey. CRC Report No. 575 CM-123-93. Atlanta, GA, 142 p. Available at: http://www.crcao.org/reports/motofuel/det-fs.htm
1994 Analysis Panel of the CRC Octane Group. (1995). 1994 CRC Octane Number Requirement Survey. CRC Report No. 596 CM-123-94. Atlanta, GA, 133 p. Available at: http://www.crcao.org/reports/motofuel/det-fs.htm
Armstrong, J. (1997). New Guidance on Testing Vehicles With Knock Sensors. EPA Guidance VPCD-97 01. Available at: https://web.archive.org/web/20040922024332/http://www.epa.gov/otaq/cert/dearmfr/vpcd9701.pdf
ASTM Standard D 5798. (2014). Standard Specification for Ethanol Fuel Blends for Flexible-Fuel Automotive Spark-Ignition Engines. West Conshohocken, PA: ASTM International.
ASTM Standard D 2699. (2013). Standard Test Method for Research Octane Number of Spark-Ignition Engine Fuel. West Conshohocken, PA: ASTM International.
ASTM Standard D 2700. (2014). Standard Test Method for Motor Octane Number of Spark-Ignition Engine Fuel. West Conshohocken, PA: ASTM International.
Austin, T. C., and Hellman, K. H. (1973). Passenger Car Fuel Economy- Trends and Influencing Factors (No. 730790). SAE Technical Paper. doi:10.4271/730790
Balouet, J. C., Oudijk, G., Smith, K. T., Petrisor, I., Grudd, H., and Stocklassa, B. (2007). Applied dendroecology and environmental forensics. Characterizing and age dating environmental releases: fundamentals and case studies. Environ. Forensics 8, 1–17. doi:10.1080/15275920601180487
Bandel, W., Fraidl, G. K., Kapus, P. E., Sikinger, H., and Cowland, C. N. (2006). The Turbocharged GDI Engine: Boosted Synergies for High Fuel Economy Plus Ultra-Low Emission. SAE Technical Paper No. 2006-01-1266.
Belzowski, B. M. (2015). Total Cost of Ownership: A Diesel Versus Gasoline Comparison (2012-2013). Report No. UMTRI-2015-20. Ann Arbor, MI: Transportation Research Institute, University of Michigan. Available at: http://deepblue.lib.umich.edu/bitstream/2027.42/111893/1/103193.pdf; http://hdl.handle.net/2027.42/111893
Benson, J. D., and Stebar, R. F. (1971). Effects of Charge Dilution on Nitric Oxide Emission from a Single-Cylinder Engine. SAE Technical Paper No. 710008.
Blumberg, P., and Kummer, J. T. (1971). Prediction of NO formation in spark-ignited engines – an analysis of methods of control. Combust. Sci. Technol. 4, 73–95. doi:10.1080/00102207108952474
Brown, L. T., and Christensen, L. M. (1936). Gasoline and alcohol-gasoline blends. Ind. Eng. Chem. 28, 650–652. doi:10.1021/ie50318a008
California Air Resources Board (CARB). (2015). Key Events in the History of Air Quality in California. Available at: http://www.arb.ca.gov/html/brochure/history.htm
Campbell, J. M., Lovell, W. G., and Boyd, T. A. (1930). Detonation Characteristics of Some of the Fuels Suggested as Standards of Antiknock Quality. SAE Technical Paper No. 300018.
Canfield, R. L., Henderson, C. R. Jr., Cory-Slechta, D. A., Cox, C., Jusko, T. A., and Lanphear, B. P. (2003). Intellectual impairment in children with blood lead concentrations below 10 μg per deciliter. N. Engl. J. Med. 348, 1517–1526. doi:10.1056/NEJMoa022848
Caris, D. F., Mitchell, B. J., McDuffie, A. D., and Wyczalek, F. A. (1956). Mechanical Octanes for Higher Efficiency. SAE Technical Paper No. 560010. doi:10.4271/560010
Caris, D. F., and Nelson, E. E. (1959). A New Look at High Compression Engines. SAE Technical Paper No. 590015.
Caton, J. A. (2012). The thermodynamic characteristics of high efficiency, internal-combustion engines. Energy Convers. Manag. 58, 84–93. doi:10.1016/j.enconman.2012.01.005
Cheah, L. W., Bandivadekar, A. P., Bodek, K. M., Kasseris, E. P., and Heywood, J. B. (2009). The trade-off between automobile acceleration performance, weight, and fuel consumption. SAE Int. J. Fuels Lubr. 1, 771–777. doi:10.4271/2008-01-1524
Cobb, J. (2015). Data from: May 2015 Dashboard. HybridCars.Com Monthly Sales Dashboard. Available from: HybridCars.Com; http://www.hybridcars.com/may-2015-dashboard/
CRC Emissions Committee of the Coordinating Research Council. (2015). Effects of 85 and 87 Anti-knock Index (AKI) Gasoline Ethanol Blends on U.S. Light-Duty Vehicle Emissions, Fuel Economy, and Performance at Two Elevations (1,000 ft. and 5,000 ft.). CRC Report No. 669, E-108, CRC Report No. 669, 98. Available at: http://www.crcao.org/reports/recentstudies2015/CRC%20669/CRC%20No.%20669%20[E-108]%20Report%20Final.pdf
Cummings, H. K. (1927). Methods of Measuring the Antiknock Value of Fuels. SAE Technical Paper No. 270003.
Dec, J. E., and Yang, Y. (2010). Boosted HCCI for high power without engine knock and with ultra-low NOx emissions-using conventional gasoline. SAE Int. J. Engines 3, 750–767. doi:10.4271/2010-01-1086
Dempsey, A. B., Walker, N. R., Splitter, D., Wissink, M., and Reitz, R. D. (2012). “Characterization of reactivity controlled compression ignition (RCCI) using premixed hydrated ethanol and direct injection diesel in heavy-duty and light-duty engines,” in THIESEL 2012 Conference Thermo-Fluid Dynamics Processing Direct Injection Engines (Valencia: CMT-Motores Térmicos, Universitat Politècnica de València), 11–14.
Dickson, C. L., Woodward, P. W., and Bjugstad, P. L. (1987). Trends of Petroleum Fuels. Topical Report No. NIPER-224. Bartlesville, OK: National Inst. for Petroleum and Energy Research.
Edgar, G. (1927). Measurement of knock characteristics of gasoline in terms of a standard fuel1. Ind. Eng. Chem. 19, 145–146. doi:10.1021/ie50205a049
Egloff, G., and Morrell, J. C. (1936). Symposium on motor fuels alcohol-gasoline as motor fuel. Ind. Eng. Chem. 28, 1080–1088. doi:10.1021/ie50321a024
Energy Independence and Security Act of 2007, 42 USC §17001. (2007). Available at: https://www.congress.gov/110/plaws/publ140/PLAW-110publ140.pdf
Energy Information Agency. (2015). Refiner Motor Gasoline Sales Volumes. Available at: http://www.eia.gov/dnav/pet/pet_cons_refmg_d_nus_vtr_mgalpd_m.htm
Energy Information Agency (EIA). (2015a). Monthly Energy Review, Renewable Energy. Available at: http://www.eia.gov/totalenergy/data/monthly/#renewable
Energy Information Agency (EIA). (2015b). Annual Energy Outlook 2015. Available at: http://www.eia.gov/beta/aeo/#/?id=12-AEO2015
Energy Policy and Conservation act 42 USC 6201, PUBLIC LAW 94-163 1975. (2015). To Increase Domestic Energy Supplies and Availability; To Restrain Energy Demand to Prepare for Energy Emergencies and for Other Purposes. Available at http://www.gpo.gov/fdsys/pkg/STATUTE-89/pdf/STATUTE-89-Pg871.pdf
EPA Website. (2015). Proposed Renewable Fuel Standards 2014, 2015 and 2016, and the Biomass-Based Diesel Volume for 2017. Available at: http://www2.epa.gov/renewable-fuel-standard-program/final-renewable-fuel-standards-2014-2015-and-2016-and-biomass-based#additional-resources
Federal Register. (2011). Partial Grant of Clean Air Act Waiver Application Submitted by Growth Energy To Increase the Allowable Ethanol Content of Gasoline to 15 Percent; Decision of the Administrator, Notices, Vol. 76. Available at: http://www.gpo.gov/fdsys/pkg/FR-2011-01-26/pdf/2011-1646.pdf
Federal Register. (2012). Part II Environmental Protection Agency 40 CFR Parts 85, 86, and 600, Vol. 77. 62623–63200. Available at: http://www.gpo.gov/fdsys/pkg/FR-2012-10-15/pdf/2012-21972.pdf
Federal Register. (2015). Part III Environmental Protection Agency 40 CFR Parts 80, Vol. 80. Available at: http://www.gpo.gov/fdsys/pkg/FR-2015-06-10/pdf/2015-13956.pdf
Ferfecki, F. J., and Sorenson, S. C. (1981). Knock-Limited Performance of Ethanol Blends in a Spark-Ignition Engine, DOE/ER/10004-T1. Urbana, IL: Illinois Univ.
Foong, T. M., Morganti, K. J., Brear, M. J., da Silva, G., Yang, Y., and Dryer, F. L. (2014). The octane numbers of ethanol blended with gasoline and its surrogates. Fuel 115, 727–739. doi:10.1016/j.fuel.2013.07.105
Forster, E. J., and Klein, R. H. (1962). Predicting the Road Antiknock Blending Behavior of Gasoline Components. SAE Technical Paper No. 620043.
Foster, D. E. (2012). “Low temperature combustion-a thermodynamic pathway to high efficiency engines,” in National Petroleum Council Fuels Study. Available at https://www.npc.org/FTF_Topic_papers/6-Low_Temperature_Combustion.pdf
Fraser, N., Blaxill, H., Lumsden, G., and Bassett, M. (2009). Challenges for increased efficiency through gasoline engine downsizing. SAE Int. J. Engines 2, 991–1008. doi:10.4271/2009-01-1053
Fueleconomy.gov. (2015). 2015 Best and Worst Fuel Economy Vehicles. Available at: Fueleconomy.gov; http://www.fueleconomy.gov/feg/best-worst.shtml [accessed July 13, 2015].
Gao, Z., Curran, S. J., Parks, J. E., Smith, D. E., Wagner, R. M., Daw, C. S., et al. (2015). Drive cycle simulation of high efficiency combustions on fuel economy and exhaust properties in light-duty vehicles. Appl. Energy 157, 762–776. doi:10.1016/j.apenergy.2015.03.070
Gibbs, L. M. (1996). How Gasoline Has Changed II – The Impact of Air Pollution Regulations. SAE Technical Paper No. 961950.
Greene, D. L. (1989). Motor fuel choice: an econometric analysis. Transp. Res. Part A Gen. 23, 243–253. doi:10.1016/0191-2607(89)90006-X
Hanipah, M. R., Mikalsen, R., and Roskilly, A. P. (2015). Recent commercial free-piston engine developments for automotive applications. Appl. Therm. Eng. 75, 493–503. doi:10.1016/j.applthermaleng.2014.09.039
Harada, J., Tomita, T., Mizuno, H., Mashiki, Z., and Ito, Y. (1997). Development of Direct Injection Gasoline Engine. SAE Technical Paper No. 970540.
Hastings, J., and Shapiro, J. M. (2012). Mental Accounting and Consumer Choice: Evidence from Commodity Price Shocks (No. w18248). National Bureau of Economic Research. doi:10.3386/w18248
Heavenrich, R. M., Murrell, J. D., Cheng, J. P., and Loos, S. L. (1984). Passenger car fuel economy. Trends through 1984 (No. SAE-TP-840850). Warrendale, PA: Society of Automotive Engineers, Inc. doi:10.4271/840499
Hegedus, L. L., Summers, J. C., Schlatter, J. C., and Baron, K. (1979). Poison-resistant catalysts for the simultaneous control of hydrocarbon, carbon monoxide, and nitrogen oxide emissions. J. Catal. 56, 321–335. doi:10.1016/0021-9517(79)90125-8
Hensley, R., Newman, J., and Rogers, M. (2012). Battery technology charges ahead. McKinsey Q. 3, 5–50.
Herold, R. E., Wahl, M. H., Regner, G., Lemke, J. U., and Foster, D. E. (2011). Thermodynamic Benefits of Opposed-Piston Two-Stroke Engines. SAE Technical Paper No. 2011-01-2216.
Heywood, J. B. (1988). Internal Combustion Engine Fundamentals, Vol. 930. New York, NY: McGraw-Hill, 930.
Hickling, R., Feldmaier, D. A., Chen, F. H., and Morel, J. S. (1983). Cavity resonances in engine combustion chambers and some applications. J. Acoust. Soc. Am. 73, 1170–1178. doi:10.1080/00102202.2011.589875
Hirshfeld, D. S., Kolb, J. A., Anderson, J. E., Studzinski, W., and Frusti, J. (2014). Refining economics of US gasoline: octane ratings and ethanol content. Environ. Sci. Technol. 48, 11064–11071. doi:10.1021/es5021668
Holl, W. H. (1980). Air-Fuel Control to Reduce Emissions I. Engine-Emissions Relationships. SAE Technical Paper No. 800051.
Horning, H. L. (1923). Effect of Compression on Detonation and Its Control. SAE Technical Paper No. 230033.
Ikeya, K., Takazawa, M., Yamada, T., Park, S., and Tagishi, R. (2015). Thermal efficiency enhancement of a gasoline engine. SAE Int. J. Engines 8, 1579–1586. doi:10.4271/2015-01-1263
Inagaki, K., Mizuta, J., Fuyuto, T., Hashizume, T., Ito, H., Kuzuyama, H., et al. (2011). Low emissions and high-efficiency diesel combustion using highly dispersed spray with restricted in-cylinder swirl and squish flows. SAE Int. J. Engines 4, 2065–2079. doi:10.4271/2011-01-1393
Jung, H. H., Leone, T. G., Shelby, M. H., Anderson, J. E., and Collings, T. (2013a). Fuel economy and CO2 emissions of ethanol-gasoline blends in a turbocharged DI engine. SAE Int. J. Engines 6, 422–434. doi:10.4271/2013-01-1321
Jung, H. H., Shelby, M. H., Newman, C. E., and Stein, R. A. (2013b). Effect of ethanol on part load thermal efficiency and CO2 emissions of SI engines. SAE Int. J. Engines 6, 456–469. doi:10.4271/2013-01-1634
Kalaskar, V. B., Splitter, D. A., and Szybist, J. P. (2014). Gasoline-like fuel effects on high-load, boosted HCCI combustion employing negative valve overlap strategy. SAE Int. J. Fuels Lubr. 7, 82–93. doi:10.4271/2014-01-1271
Kaneko, Y., Kobayashi, H., Komagome, R., Hirako, O., and Nakayama, O. (1978). Effect of Air-Fuel Ratio Modulation on Conversion Efficiency of Three-Way Catalysts. SAE Technical Paper No. 780607.
Kehoe, R. A., Thamann, F., and Cholak, J. (1934). An appraisal of the lead hazards associated with the distribution and use of gasoline containing tetraethyl lead. Part I. J. Ind. Hyg. 16, 100–128.
Kimura, S., Aoki, O., Ogawa, H., Muranaka, S., and Enomoto, Y. (1999). New Combustion Concept for Ultra-Clean and High-Efficiency Small DI Diesel Engines. SAE Technical Paper No. 1999-01-3681.
Kleeberg, H., Tomazic, D., Lang, O., and Habermann, K. (2006). Future Potential and Development Methods for High Output Turbocharged Direct Injected Gasoline Engines (No. 2006-01-0046). SAE Technical Paper. doi:10.4271/2006-01-0046
Kokjohn, S. L., Hanson, R. M., Splitter, D. A., and Reitz, R. D. (2011). Fuel reactivity controlled compression ignition (RCCI): a pathway to controlled high-efficiency clean combustion. Int. J. Engine Res. 12, 209–226. doi:10.1177/1468087411401548
Komiyama, K., and Heywood, J. B. (1973). Predicting NOx Emissions and Effects of Exhaust Gas Recirculation in Spark-Ignition Engines. SAE Technical Paper No. 730475.
Kosaka, H., Akita, T., Moriya, K., Goto, S., Hotta, Y., Umeno, T., et al. (2014). Development of Free Piston Engine Linear Generator Systemx Part 1-Investigation of Fundamental Characteristics. SAE Technical Paper No. 2014-01-1203.
Kraus, B. J., Godici, P. E., and King, W. H. (1978). Reduction of Octane Requirement by Knock Sensor Spark Retard System. SAE Technical Paper No. 780155.
Kummer, J. T. (1980). Catalysts for automobile emission control. Prog. Energy Combust. Sci. 6, 177–199. doi:10.1016/0360-1285(80)90006-4
Lavoie, G., Ortiz-Soto, E., Babajimopoulos, A., Martz, J. B., and Assanis, D. N. (2012). Thermodynamic sweet spot for high-efficiency, dilute, boosted gasoline engines. Int. J. Engine Res. 14, 260–278. doi:10.1177/1468087412455372
Lavoie, G. A., Heywood, J. B., and Keck, J. C. (1970). Experimental and theoretical study of nitric oxide formation in internal combustion engines. Combust. Sci. Technol. 1, 313–326. doi:10.1080/00102206908952211
Leake, J. P., Kolb, L., Howell, W. H., Chesley, A. J., Edsall, D. L., Hunt, R., et al. (1926). The Use of Tetraethyl Lead Gasoline in its Relation to Public Health. Washington, DC: G.P.O.
Lecointe, B., and Monnier, G. (2003). Downsizing a Gasoline Engine Using Turbocharging with Direct Injection. SAE Technical Paper No. 2003-01-0542.
Leone, T. G., Anderson, J. E., Davis, R. S., Iqbal, A., Reese, R. A., Shelby, M. H., et al. (2015). The effect of compression ratio, fuel octane rating, and ethanol content on spark-ignition engine efficiency. Environ. Sci. Technol. 49, 10778–10789. doi:10.1021/acs.est.5b01420
Leone, T. G., and Pozar, M. (2001). Fuel Economy Benefit of Cylinder Deactivation-Sensitivity to Vehicle Application and Operating Constraints. SAE Technical Paper No. 2001-01-3591.
Leppard, W. (1990). The chemical origin of fuel octane sensitivity. SAE Trans. 99, 862–876. doi:10.4271/902137
Lucas, A. G. (1967). Spark Ignition Engine Progress (No. 670199). SAE Technical Paper. doi:10.4271/670199
MacKenzie, D. W. (2009). Trends and Drivers of the Performance: Fuel Economy Tradeoff in New Automobiles [Doctoral Dissertation]. Massachusetts Institute of Technology. Available at: http://hdl.handle.net/1721.1/52758
Manente, V., Johansson, B., and Tunestal, P. (2009). Partially Premixed Combustion at High Load Using Gasoline and Ethanol, a Comparison with Diesel. SAE Technical Paper No. 2009-01-0944.
McCormick, R. L., Yanowitz, J., Ratcliff, M., and Zigler, B. T. (2013). “Review and evaluation of studies on the use of E15 in light-duty vehicles,” in Prepared for the Renewable Fuels Association 2013 (Golden, CO: National Renewable Energy Laboratory), 53 p. Available at: http://www.ourenergypolicy.org/wp-content/uploads/2013/12/b378858ac325c6e165_sgm6bknd4.pdf [accessed June 10, 2015].
Midgley, T. Jr. (1925). Fuel. U.S. Patent No 1,578,201. Washington, DC: U.S. Patent and Trademark Office.
Moran, M. J., and Shapiro, H. N. (2004). Fundamentals of Engineering Thermodynamics, 5th Edn. Hoboken NJ: Wiley, John & Sons, Incorporated, 875.
Moriarty, K., Kass, M., Michael, D., and Theiss, T. J. (2014). Increasing Biofuel Deployment and Utilization through Development of Renewable Super Premium: Infrastructure Assessment, NREL/TP-5400-61684. Golden, CO: National Renewable Energy Laboratory (NREL).
Murphree, E. V., Cunningham, A. R., Haworth, J. P., and Kaulakis, A. F. (1953). The Trend to High Octane Number Gasoling is Sound. SAE Technical Paper No. 530168.
National Highway Traffic Safety Administration. (2009). CARS Program Official Information. NHTSA. Available at: http://www.nhtsa.gov/Laws+&+Regulations/CARS+Program+Official+Information
National Institute of Standards and Technology Laws and Regulations Committee. (2013) L&R Committee 2013 Final Report Appendix E – Item 237-2: Uniform Engine Fuels and Automotive Lubricants Regulation. Available at: http://www.nist.gov/pml/wmd/pubs/upload/07-lr-appd-e-13-annual-final.docx [accessed November 19, 2015]
Needleman, H. L. (1998). Childhood lead poisoning: the promise and abandonment of primary prevention. Am. J. Public Health 88, 1871–1877. doi:10.2105/AJPH.88.12.1871
Needleman, H. L. (2000). The removal of lead from gasoline: historical and personal reflections. Environ. Res. 84, 20–35. doi:10.1006/enrs.2000.4069
Neligan, R. E., Mader, P. P., and Chambers, L. A. (1961). Exhaust composition in relation to fuel composition. J Air Pollut. Control Assoc. 11, 178–186. doi:10.1080/00022470.1961.10467988
Nevin, R. (2000). How lead exposure relates to temporal changes in IQ, violent crime, and unwed pregnancy. Environ. Res. 83, 1–22. doi:10.1006/enrs.1999.4045
Nriagu, J. O. (1990). The rise and fall of leaded gasoline. Sci. Total Environ. 92, 13–28. doi:10.1016/0048-9697(90)90318-O
Oil Price Information Services. (2015). Renewable Fuels Pricing and News. Available at: http://www.opisnet.com/biofuels-prices.aspx
Oudijk, G. (2005). Fingerprinting and age-dating of gasoline releases – a case study. Environ. Forensics 6, 91–99. doi:10.1080/15275920590913994
Pacyna, J. M., and Pacyna, E. G. (2000). Atmospheric Emissions of Anthropogenic Lead in Europe: Improvements, Updates, Historical Data and Projections, Vol. 31. GKSS-Forschungszentrum Geesthacht GmbH. Available at: http://hdl.handle.net/10068/235543
Patterson, C. (1956). Age of meteorites and the earth. Geochim. Cosmochim. Acta 10, 230–237. doi:10.1016/0016-7037(56)90036-9
Patterson, C. C. (1965). Contaminated and natural lead environments of man. Arch. Environ. Health 11, 344–360. doi:10.1080/00039896.1965.10664229
Patton, W. G. (1962). 1962 Passenger-Car Engineering Trends (No. 620066). SAE Technical Paper. doi:10.4271/620066
Pawlowski, A., and Splitter, D. (2015). SI Engine Trends: A Historical Analysis with Future Projections. SAE Technical Paper No. 2015-01-0972.
Pearce, J. M. S. (2007). Burton’s line in lead poisoning. Eur. Neurol. 57, 118–119. doi:10.1159/000098100
Porter, J. C., and Wiebe, R. (1952). Alcohol as an antiknock agent in automotive engines. Ind. Eng. Chem. 44, 1098–1104. doi:10.1021/ie50509a048
Ricardo, H. R. (1922). Recent Research Work on the Internal-Combustion Engine. SAE Technical Paper No. 220001.
Rivard, J. G. (1973). Closed-Loop Electronic Fuel Injection Control of the Internal Combustion Engine. SAE Technical Paper No. 730005.
Robert, J. C. (1983). Ethyl: A History of the Corporation and the People Who Made It. Charlottesville, VA: University Press of Virginia, 448.
Rosner, D., and Markowitz, G. (1985). A ‘gift of god’? The public health controversy over leaded gasoline during the 1920s. Am. J. Public Health 75, 344–352. doi:10.2105/AJPH.75.4.344
Sellnau, M., Moore, W., Sinnamon, J., Hoyer, K., Foster, M., and Husted, H. (2015). GDCI multi-cylinder engine for high fuel efficiency and low emissions. SAE Int. J. Engines 8, 775–790. doi:10.4271/2015-01-0834
Shahed, S. M., and Bauer, K. H. (2009). Parametric studies of the impact of turbocharging on gasoline engine downsizing. SAE Int. J. Engines 2, 1347–1358. doi:10.4271/2009-01-1472
Shelton, E. M., Whisman, M. L., and Woodward, P. W. (1982). Trends in Motor Gasolines: 1942-1981. Report No. DOE/BETC/RI-82/4. Bartlesville, OK: Department of Energy, Bartlesville Energy Technology Center.
Shimizu, N. (2015). Next Prius Will Have Engine Thermal Efficiency of 40%. Nikkei Technology. http://techon.nikkeibp.co.jp/english/NEWS_EN/20150522/419560/
Sluder, C. S., Szybist, J. P., McCormick, R., Ratcliff, M. A., and Zigler, B. (2016). Exploring the Relationship between Fuel Heat-of-Vaporization and Sensitivity. SAE Technical Paper Series (in press).
Smith, P., and Cheng, W. K. (2013). Assessing the Loss Mechanisms Associated with Engine Downsizing, Boosting and Compression Ratio Change. SAE Technical Paper No. 2013-01-0929.
Smith, P., Heywood, J., and Cheng, W. (2014). Effects of Compression Ratio on Spark-Ignited Engine Efficiency. SAE Technical Paper No. 2014-01-2599.
Splitter, D., Hanson, R., Kokjohn, S., and Reitz, R. D. (2011). Reactivity Controlled Compression Ignition (RCCI) Heavy-Duty Engine Operation at Mid-and High-Loads with Conventional and Alternative Fuels. SAE Technical Paper No. 2011-01-0363.
Splitter, D., and Szybist, J. (2014a). Intermediate alcohol-gasoline blends, fuels for enabling increased engine efficiency and powertrain possibilities. SAE Int. J. Fuels Lubr. 7, 29–47. doi:10.4271/2014-01-1231
Splitter, D. A., and Szybist, J. P. (2014b). Experimental investigation of spark-ignited combustion with high-octane biofuels and EGR. 1. engine load range and downsize downspeed opportunity. Energy Fuels 28, 1418–1431. doi:10.1021/ef401574p
Splitter, D. A., and Szybist, J. P. (2014c). Experimental investigation of spark-ignited combustion with high-octane biofuels and EGR. 2. Fuel and EGR effects on knock-limited load and speed. Energy Fuels 28, 1432–1445. doi:10.1021/ef401575e
Stein, R. A., Anderson, J. E., and Wallington, T. J. (2013). An overview of the effects of ethanol-gasoline blends on SI engine performance, fuel efficiency, and emissions. SAE Int. J. Engines 6, 470–487. doi:10.4271/2013-01-1635
Stein, R. A., Polovina, D., Roth, K., Foster, M., Lynskey, M., Whiting, T., et al. (2012). Effect of heat of vaporization, chemical octane, and sensitivity on knock limit for ethanol-gasoline blends. SAE Int. J. Fuels Lubr. 5, 823–843. doi:10.4271/2012-01-1277
Stokes, J., Lake, T. H., and Osborne, R. J. (2000). A Gasoline Engine Concept for Improved Fuel Economy-The Lean Boost System. SAE Technical Paper No. 2000-01-2902.
Szybist, J., Foster, M., Moore, W. R., Confer, K., Youngquist, A., and Wagner, R. (2010). Investigation of Knock Limited Compression Ratio of Ethanol Gasoline Blends. SAE Technical Paper No. 2010-01-0619.
Szybist, J. P., Chakravathy, K., and Daw, C. S. (2012). Analysis of the impact of selected fuel thermochemical properties on internal combustion engine efficiency. Energy Fuels 26, 2798–2810. doi:10.1021/ef2019879
Szybist, J. P., Steeper, R. R., Splitter, D., Kalaskar, V. B., Pihl, J., and Daw, C. (2014). Negative valve overlap reforming chemistry in low-oxygen environments. SAE Int. J. Engines 7, 418–433. doi:10.4271/2014-01-1188
Szybist, J. P., and Splitter, D. A. (2016). “Effects of fuel composition on EGR dilution tolerance in spark ignited engines,” SAE Technical Paper Series (in press).
Teh, K. Y., Miller, S. L., and Edwards, C. F. (2008). Thermodynamic requirements for maximum internal combustion engine cycle efficiency. Part 1: optimal combustion strategy. Int. J. Engine Res. 9, 449–465. doi:10.1243/14680874JER01508
110th Congress 121 STAT. (2007). 1492 PUBLIC LAW 110–140. Available at: http://www.gpo.gov/fdsys/pkg/STATUTE-121/pdf/STATUTE-121-Pg1492.pdf
Thomas, J. (2014). Drive cycle powertrain efficiencies and trends derived from EPA vehicle dynamometer results. SAE Int. J. Passenger Cars Mech. Syst. 7, 1374–1384. doi:10.4271/2014-01-2562
Trefis Team. (2011). Japan Quake, Tsunami Take Heavy Toll on Toyota. Forbes Investing. Available at: http://www.forbes.com/sites/greatspeculations/2011/04/08/japan-quake-tsunami-take-heavy-toll-on-toyota/
Turner, J. W. G., Popplewell, A., Patel, R., Johnson, T. R., Darnton, N. J., Richardson, S., et al. (2014). Ultra boost for economy: extending the limits of extreme engine downsizing. SAE Int. J. Engines 7, 387–417. doi:10.4271/2014-01-1185
U.S. Department of State, Office of the Historian. (2012). MILESTONES: 1969–1976, OPEC Oil Embargo 1973–1974. Office of the Historian, Bureau of Public Affairs, United States Department of State. Available at: https://history.state.gov/milestones/1969-1976/oil-embargo.
U.S. Energy Information Administration. (2012). EIA Annual Energy Review Table 5.24 Retail Motor Gasoline and On-Highway Diesel Fuel Prices, 1949–2011. Available at: http://www.eia.gov/totalenergy/data/annual/showtext.cfm?t=ptb0524
U.S. EPA (U.S. Environmental Protection Agency). (1973b). Regulation of fuels and fuel additives: notice of proposed rule making. Fed. Reg. 38, 1258–1261.
United States. (1925). Proceedings of a Conference to Determine Whether or Not There is a Public Health Question in the Manufacture, Distribution, or Use of Tetraethyl Lead Gasoline. Washington, DC: Government Printing Office.
United States. (1959). Public Health Aspects of Increasing Tetraethyl Lead Content in Motor Fuel: A Report. Washington, DC: Occupational Health Program, Division of Special Health Services, U.S. Public Health Service. Available at: https://archive.org/details/publichealthaspe022460mbp
United States. (1999). History of Reducing Tailpipe Emissions. Ann Arbor, MI: Office of Mobile Sources, Air and Radiation, U.S. Environmental Protection Agency. Available at: http://www3.epa.gov/otaq/consumer/f99017.pdf
United States Senate, Committee on Public Works. (1966). Hearings before the Subcommittee on Air and Water Pollution. Washington, DC: U.S. Government Printing Office.
Wards Auto. (2000). Domestic Light Vehicle Production by Engine Displacement, ‘00 Model Year. Wards Auto. Available at: http://wardsauto.com/datasheet/domestic-light-vehicle-production-engine-displacement-00-model-year
Wards Auto. (2001). Domestic Light Vehicle Production by Engine Displacement, ‘01 Model Year. Wards Auto. Available at, http://wardsauto.com/datasheet/domestic-light-vehicle-production-engine-displacement-01-model-year
Wards Auto. (2002). Domestic Light Vehicle Production by Engine Displacement, ‘02 Model Year. Wards Auto. Available at, http://wardsauto.com/datasheet/domestic-light-vehicle-production-engine-displacement-02-model-year
Wards Auto. (2003). North America Light Vehicle Engines Availability & Specifications, 2003. Wards Auto. Available at: http://wardsauto.com/datasheet/north-america-light-vehicle-engines-availability-specifications-2003
Wards Auto. (2004). North America Light Vehicle Engines Availability & Specifications, 2004. Wards Auto. Available at: http://wardsauto.com/datasheet/north-america-light-vehicle-engines-availability-specifications-2004
Wards Auto. (2005). North America Light Vehicle Engines Availability & Specifications, 2005. Wards Auto. Available at: http://wardsauto.com/datasheet/north-america-light-vehicle-engines-availability-specifications-2005
Wards Auto. (2006). North America Light Vehicle Engines Availability & Specifications, 2006. Wards Auto. Available at: http://wardsauto.com/datasheet/north-america-light-vehicle-engines-availability-specifications-2006
Wards Auto. (2007). North America Light Vehicle Engines Availability & Specifications, 2007. Wards Auto. Available at: http://wardsauto.com/datasheet/north-america-light-vehicle-engines-availability-specifications-2007
Wards Auto. (2008). North America Light Vehicle Engines Availability & Specifications, 2008. Wards Auto. Available at: http://wardsauto.com/datasheet/north-america-light-vehicle-engines-availability-specifications-2008
Wards Auto. (2009). North America Light Vehicle Engines Availability & Specifications, 2009. Wards Auto. Available at: http://wardsauto.com/datasheet/north-america-light-vehicle-engines-availability-specifications-2009
Wards Auto. (2010). North America Light Vehicle Engines Availability & Specifications, 2010. Wards Auto. Available at: http://wardsauto.com/datasheet/north-america-light-vehicle-engines-availability-specifications-2010
Wards Auto. (2011). North America Light Vehicle Engines Availability & Specifications, 2011. Wards Auto. Available at: http://wardsauto.com/datasheet/north-america-light-vehicle-engines-availability-specifications-2011
Wards Auto. (2012). North America Light Vehicle Engines Availability & Specifications, 2012. Wards Auto. Available at: http://wardsauto.com/datasheet/north-america-light-vehicle-engines-availability-specifications-2012
Wards Auto. (2013). North America Light Vehicle Engines Availability & Specifications, 2013. Wards Auto. Available at: http://wardsauto.com/datasheet/north-america-light-vehicle-engines-availability-specifications-2013
Wards Auto. (2014). North America Light Vehicle Engines Availability & Specifications, 2014. Wards Auto. Available at: http://wardsauto.com/datasheet/north-america-light-vehicle-engines-availability-specifications-2014
West, B. H., Sluder, S., Knoll, K., Orban, J., and Feng, J. (2012). Intermediate Ethanol Blends Catalyst Durability Program, ORNL/TM-2011/234. Oak Ridge, TN: Oak Ridge National Laboratory (ORNL).
Wilcutts, M., Switkes, J., Shost, M., and Tripathi, A. (2013). Design and benefits of dynamic skip fire strategies for cylinder deactivated engines. SAE Int. J. Engines 6, 278–288. doi:10.4271/2013-01-0359
Yao, M., Zheng, Z., and Liu, H. (2009). Progress and recent trends in homogeneous charge compression ignition (HCCI) engines. Prog. Energy Combust. Sci. 35, 398–437. doi:10.1016/j.pecs.2009.05.001
Keywords: octane number, compression ratio, tetraethyl lead, ethanol, fuel economy
Citation: Splitter D, Pawlowski A and Wagner R (2016) A Historical Analysis of the Co-evolution of Gasoline Octane Number and Spark-Ignition Engines. Front. Mech. Eng. 1:16. doi: 10.3389/fmech.2015.00016
Received: 14 July 2015; Accepted: 24 November 2015;
Published: 06 January 2016
Edited by:
Stephen Anthony Ciatti, Argonne National Laboratory, USAReviewed by:
Thomas Leone, Ford Motor Company, USARobert McCormick, The National Renewable Energy Laboratory (NREL), USA
Copyright: © 2016 Splitter, Pawlowski and Wagner. This is an open-access article distributed under the terms of the Creative Commons Attribution License (CC BY). The use, distribution or reproduction in other forums is permitted, provided the original author(s) or licensor are credited and that the original publication in this journal is cited, in accordance with accepted academic practice. No use, distribution or reproduction is permitted which does not comply with these terms.
*Correspondence: Derek Splitter, splitterda@ORNL.gov