Effect of Particle Type on Cyclone Formation Inside a Solar Reactor
 Min-Hsiu Chien1
 Nesrin Ozalp
- 1Department of Mechanical Engineering, Texas A&M University, College Station, TX, USA
- 2Department of Mechanical Engineering, KU Leuven, Leuven, Belgium
Solar reactors featuring a circulating cyclone flow pattern provide enhanced heat transfer and longer residence time increasing the conversion efficiency. Cyclone flow also works in reducing particle deposition on solar reactor walls and exit, which is particularly an important issue in solar cracking reactors to avoid clogging. This paper focuses on the physics of cyclone formation inside a solar cracking reactor and experimentally analyzes the effect of particle entrainment on the flow pattern via two dimensional particle image velocimetry (PIV). The cyclone flow structure in the reactor is reconstructed by capturing images from orientations perpendicular or parallel to the geometrical axis of the reactor. In order to conduct PIV measurements, and to reconstruct the cyclone structure inside the solar reactor, the experiment was operated at room temperature with the flow configuration matching that of a solar reactor operating at high temperatures. Two types of seeding particles were tested, namely triethylene glycol and solid carbon. The effectiveness of the screening flow was evaluated by measuring the quantity of solid particles deposit on the reactor walls. The Stokes flow analysis of each particle species was performed, and the cyclone vector fields generated by using different particles are compared.
Introduction
Hydrogen and carbon black production from solar cracking process is an emission-free alternative to industrially practiced methods that are being used to produce these important commodities. The carbon particles, which are a product of the decomposition reaction, affect the efficiency of the solar reactor in the form of interaction of radiation between the carbon particles and the fluid. A higher carbon particle concentration leads to a larger optical thickness, and thus, a higher attenuation of radiation occurs. A large optical thickness is beneficial in absorbing the solar energy and reducing the temperatures of both reactant and the reactor wall. However, carbon formed during this two-phase process deposits inside the reactor including the window and outlet, which eventually clogs the reactor and presents a major drawback (Abanades et al., 2014). Cyclone flow formation is considered as a promising solution to reduce carbon deposition inside the reactor (Shilapuram et al., 2011; Devanuri and Ozalp, 2013). Concept of cyclone or tornado flow inside a solar reactor to reduce carbon deposition was originally introduced by Kogan and Kogan (2002).
It is important to understand how the carbon particles move inside the solar reactor so that a solution to prevent them from clogging the reactor exit can be found. Natural gas entering the reactor is solar thermally decomposed into hydrogen gas and solid carbon particles. Some of the carbon particles deposit on reactor window and walls, while the remaining carbon particles collectively migrate toward the exit. Because of this collective particle motion, the volume of carbon particles exiting the reactor causes clogging. The blockage of reactor exit leads to increase of reactor pressure, which eventually breaks the quartz window. Therefore, preventing the collective carbon particle movement toward reactor exit is essential in solar cracking of natural gas process. This can be achieved by increasing the residence time and by making the carbon particles fly in circles inside the reactor while moving toward the exit. Such feature can be obtained by adjusting the flow dynamics to serve the purpose. It should be noted that the goal is to produce as much hydrogen and carbon as possible by collecting them after the exit. However, if the carbon particles deposit inside the reactor, or if they block the exit, then the production of these valuable commodities is stopped. As for the carbon deposition on the window, it has been tackled by injecting inert gas flow to sweep the window, whereas carbon deposition on the reactor walls still remains unsolved.
A thorough flow dynamics study to explain the physics behind the tornado formation inside a solar reactor was done experimentally and numerically by Kogan group (Kogan et al., 2004, 2007). According to the flow visualization of a quartz reactor performed (Kogan et al., 2004), a funnel-like jet was the result of radial motion of fluid driven by the pressure gradient provided the centrifugal force to the fluid particles was sharply reduced by the friction within the boundary layer above the reactor window. Kogan group indicated that the main stream entered at periphery of the reactor and then split into two directions. A portion of the main stream converged toward the reactor axis and then made a sharp turn into the axial direction toward the reactor exit, while the majority of the stream flew along the cylindrical wall toward the exit. Upon reaching the exit, part of the fluid traveling along the cylindrical wall separated from the original path and ascended toward the reactor window between the funnel jet and the fluid along the cylindrical wall, while the rest continued to the exit. Part of the ascending fluid impact on the reactor wall and became the source of particle deposition, and the rest rejoined the neighbor fluid traveling toward the exit. They also observed that at high temperature, fluid tended to be laminar, which prevented the ascending fluid from reaching the reactor window. On the other hand, they observed deposition in a duplicated turbulent flow field at room temperature as well.
The performance evaluation of seeding particles was discussed by Melling (1997) and Durst et al. (1981). For a swirling flow, the Stoke’s law is applicable to analyze the tracking capability of seeding particle. The centrifugal effect essentially become significant, however, can be neglected if the particle size is less than 1 μm, which is a prevalent size, provided the velocity of flow is relatively slow. In order to maintain a stable size range of solid particles, a suitable drying preprocessing before injecting into measuring volume is necessary to ensure no particle agglomeration or over dried, which lead to electrostatic charge remaining on the particle surface. The particle frequency response function and energy transfer function are derived by Mei (1996) to evaluate particle trajectory versus fluid motion.
One of the effective ways of studying turbulence is done via particle image velocimetry (PIV) analysis. Effect of the PIV control parameters has been thoroughly outlined by Keane and Adrian (1990, 1991) and Adrian (1997). A high quality particle image should have particle image density more than 10 in an interrogation spot providing velocity gradient less than 5%, maximum displacement of particle less than 1/4 thickness of the light sheet in out-of-plane direction, and 1/4 length of the interrogation spot size in in-plane direction. The signal-to-noise (SNR) ratio should be at least 1.2 to achieve 95% particle detection rate.
In this study, PIV measurements were done for a solar reactor designed to house two-phase natural gas cracking process producing hydrogen gas and solid carbon. Although there have been studies proving the importance of turbulence or cyclone flow inside the natural gas cracking solar reactors, effect of particles on the cyclone formation has not been thoroughly investigated. The present work is an effort to fill that gap by studying the cyclone vector fields generated by using different particles. This research involves two types of seeding particles, namely triethylene glycol (TEG) and solid carbon. The study also presents the effectiveness of the screening flow by measuring the quantity of solid particles that deposit on reactor walls.
Experimental Methodology
Solar Reactor
During the design process of our solar cyclone reactor, carbon deposition problems were addressed by studying one at a time starting from the carbon deposition at the exit. In order to increase the residence time, and to make carbon particles complete several circulations inside the reactor before reaching the exit, a cyclone flow in the center was created via iterative design of the inlet ports by Ozalp and Kanjirakat (2010) and Shilapuram et al. (2011), e.g., identifying the optimum location, injection angle, velocity, etc. The final design to achieve a cyclone of required characteristics at the required swirling effect included 18 inlet jets for the main flow.
In this reactor concept, carbon particles followed the cyclone path in the center; however, some of them escaped from the cyclone and deposited on the walls. To prevent this, a “wall screening” covering the walls like a cage, sweeping off the escaped carbon particles, was added. The simulation shows this laminar flow acted as an aero shield to protect the wall from carbon deposition. A simulation was performed to obtain the configuration of inlet gases where the laminar wall screening was not disturbed by the cyclone flow in the center.
Figure 1 shows the solar reactor model and the assembly parts of the reactor model. The main body of the solar reactor model is constructed of a cylindrical part and a conical part, both made of polycarbonate to allow optical access. The cylindrical part is 125 mm in inner diameter, 135 mm in outer diameter, and 120 mm in height. The conical part is a 45° angled frustum with 125 mm inner diameter on one side and 10 mm diameter on the other. The reactor wall thickness is 5 mm. The internal channels and spaces are formed to create a main flow cyclone, and an auxiliary shield flows in the reactor.
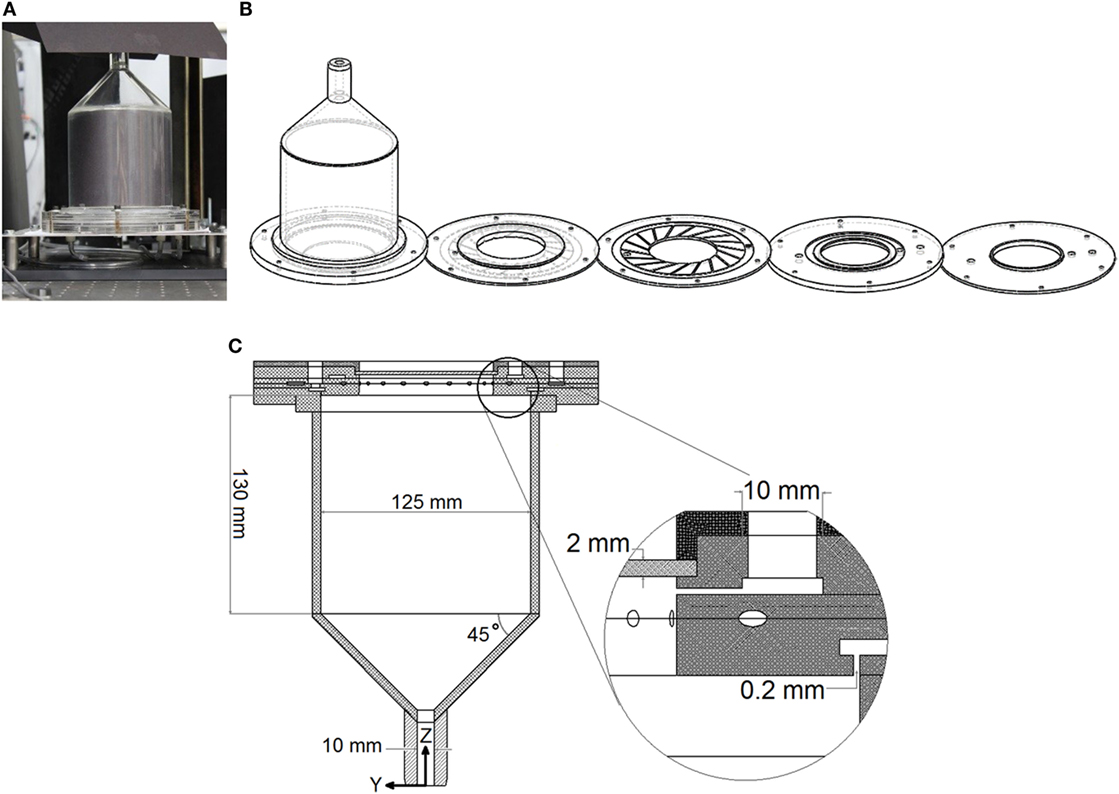
Figure 1. (A) Solar reactor model, (B) assembly parts of the reactor model, and (C) buffering space (Ozalp et al., 2013).
In order to ensure uniform tracking particle distribution over the entire flow field, three annular buffering spaces are created in the passages of the inlet gases in the reactor model. These three cavities act as buffering spaces between the single flow supply inlet and the axial-symmetric flow entrances to allow the particle-fluid mixture to redistribute to reach uniform inlet condition (Chien, 2013). The buffering space is shown in Figure 1C (Ozalp et al., 2013).
The main flow enters the reactor at speed of 2.95 m/s via 18 radial channels with a 45° angle to the inner wall, forming a cyclone structure around the axis of reactor. Two secondary flows act as screening and buffering fluids to protect the window and the inner reactor wall from particle deposition. The window screen flow enters the reactor at speed of 0.33 m/s radially via the annular clearance. The wall screen flow enters the reactor at speed of 2.15 m/s vertically via the ring-shaped clearance attached to the inner wall. Both clearances were 0.2 mm in width. Each clearance is connected to a buffering space, which is 10 mm in width and 2 mm in height, located in the reactor that allows the flows to fully mix with seeding particles uniformly. Another buffer space is also used for the main flow before branching into the 18 jets. The total volumetric flow rate is 21 LPM with 10 LPM for the main flow, 10 LPM for the wall screen flow, and 1 LPM for the window screen flow.
Considering the velocity range and accessibility of measuring a turbulent flow field in solar reactor, the particle image velocimetry (PIV) technique is preferred because it provides non-intrusive measuring advantages. During the development of the PIV technique, Keane and Adrian (1990, 1991) presented the principles to follow in order to obtain images with unbiased information. The maximum particle displacement of in-plane and out-of-plane motions should not exceed one-quarter of the interrogation region size and the thickness of the light sheet, respectively, to avoid loss of particle image pairs, which result in a rise of noise in the image correlation.
Experimental Setup
Based on the previous CFD prediction, an experiment is designed to validate the performance of the solar cyclone reactor designed by CFD. The volumetric flow rates of the three flows in the experiment are kept same as in the CFD simulations by Ozalp et al. (Shilapuram et al., 2011). In order to perform a PIV measurement, the entire reactor is built of transparent polycarbonate. The experiments are performed at room temperature.
The flow control system of the experimental setup is given in Figure 2. Air was used as the single source of three inlet gases to reduce the complexity of the flow field setup. The source air was branched into three streams used to supply the main flow, the window screen flow, and the wall screen flow. The volumetric flow rate, pressure, and temperature of the three flows were controlled respectively before entering the reactor. The pressure was regulated downstream of the reactor before discharging to the atmosphere.
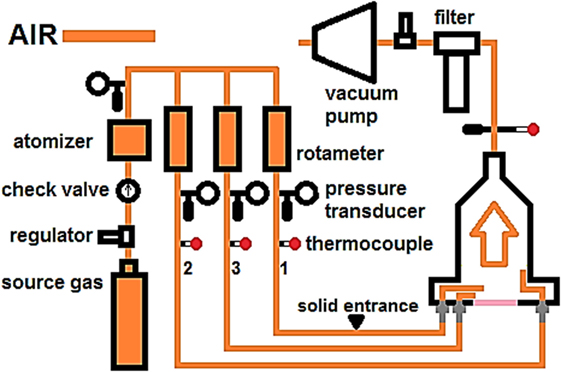
Figure 2. Schematic of the flow control system.
Particle image velocimetry measurement setup seen in Figure 3 demonstrates three beam blocks placed in the path of the reflecting light to prevent reflecting light from entering the optical cavity, and to provide additional indication of light sheet alignment. The alignment between light sheet and the reactor was adjusted by turning bolts at the four screw legs of the base plate of the reactor.
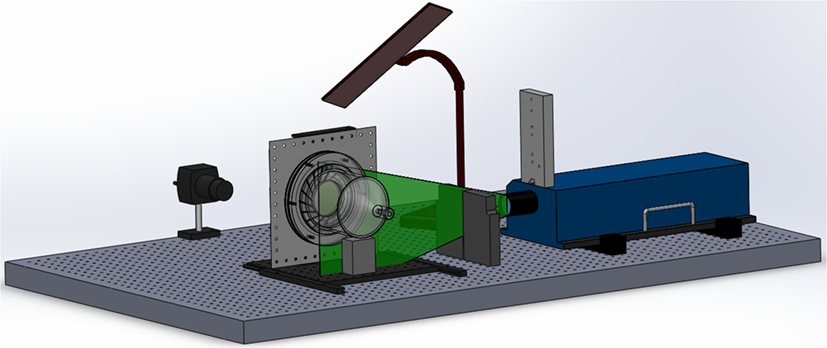
Figure 3. Setup of the PIV measurement.
The measuring volume was illuminated by 532 nm Nd-YAG double-pulsed laser light sheet with 120 mJ at maximum in each pulse. The thickness of the light sheet was 1 mm. The images of flow field were captured by a 12-bit 4M pixel camera, synchronized with the laser by an external synchronizer. The seeding particles were supplied by an atomizer that generates TEG particles of 1 μm in size. The PIV particle images were processed using cross-correlation. Both multi-pass and Rohaly–Hart correlations (Hart, 1998) were utilized in the image processing. The time interval in each pair of frames was estimated to be between 85 and 194 μs according to the interrogation spot size and fluid flow conditions obtained from the CFD prediction. A mean test was performed in post-processing under the spot size setting. The images were recorded at steady state on the basis of formation of a clear vortex line after a period of operating time under fixed input parameters. No vector filling or conditioning was added during the image processing.
It should be noted that the solid carbon particles were injected into volume of measurement by an upstream funnel device with a vibrator attached. The particles were pre-processed to remove moisture before the injection. The actual particle size was in nanometer scale beyond our measurement capability and, therefore, was estimated to be an effective flow tracking medium according to its nominal size from the particle manufacturer. The liquid TEG particle dispersion was controlled by a standardized six-jet atomizer. The mass rate, average particle size, and effective volume of dispersion were calculated to reach the optimal seeding condition according to PIV imaging quality calculations. We did not specifically calculate the particle concentration since the motions of particles and the flow stream were synchronized by the experimental setup before entering the field of measurement according to the Stoke’s flow calculation; instead, we observed the particle density on the captured images to ensure the best imaging quality. The number of particles was controlled by the vibrator frequency or the number of jets of the atomizer to ensure the imaging quality; therefore, the seeding mass rates were different and maintained constant at different flow rates and pressures.
Tracking Particle and Stokes Analysis
Since a high quality PIV image relies on obtaining particle images of sharp particle edges and homogeneous distribution, several theoretical and empirical parameters were developed to be considered to ensure optimal image quality under a fixed measurement setup.
Due to the existence of diffraction limit, a tracking particle with diameter smaller than the diffraction limit will result in a particle image larger than the physical size of the particle, which implies that the particle images on the image plane could overlap when the particles in the light sheet plane are close enough to each other. Therefore, the source density defined as the number of particles within a volume projected from a particle image back to the physical space should follow the criteria as , where C is the number density, the number of particle per unit volume, dτ is the particle image diameter on the recorded medium in pixel, M is the magnification factor between field of measurement and field of recorded image domain, and Δz is the light sheet thickness in meter.
In order to minimize the particle image overlap, the concentration of the tracking particles should be kept below a certain threshold by physically diluting the particle smoke or powder with a particle-free fluid, usually air or water before entering the measuring volume. According to previous optical analysis, the optimal particle images diameter should be kept at least one to two times of the CCD pixel size. This is also the reason that 1 μm diameter of tracking particle is small enough in most of the current PIV measurements.
When a sparse particle distribution in the flow field is obtained, a low (SNR) may occur if the particles numbers is insufficient in a relatively small interrogation spot during correlation. Therefore, a larger interrogation spot size is required to include enough particle images to maintain an acceptable SNR value. The criteria for the image density defined as the number of particle images within an interrogation spot is expressed as where NI is the image density, number of particle images within an interrogation spot.
In most of the conventional PIV measurements, the image density should be at least 10 to hold a good SNR in correlation. It is worthy of notice that in turbulence measurements, the length scale of the turbulence is the Kolmogorov scale, which is too small to be resolved by the current conventional PIV systems due to the diffraction limit of lens.
Tracking fidelity of the seeded particles in fluid is evaluated by the Stokes number, originated from the Stokes flow, to describe the motion of a single homogeneous spherical body suspended in a continuous viscous fluid with a very small particle Reynolds number. The equation of particle motion neglecting non-linear drag and vorticity diffusion can be expressed as
Where up is the particle velocity in meter per second, μ is the dynamic viscosity of fluid in Pascal second, uf is the fluid velocity in meter per second, mf is the fluid mass displaced by particle in kilogram, mp the mass of the particle, dp is the diameter of the particle, γ is the density ratio of tracking particle to the fluid. The term on the left is the time rate change of momentum of a particle, the first term on the right represents the viscous drag, and the second term is the added mass effect, namely the force exerted on the particle by the periphery fluid derived by Auton et al. (1988), the third term is the force exerted on the particle by the fluid displaced by the particle; the last is the body force effect. Since the purpose of particle tracking analysis is to evaluate how well the seeding particles can track the fluid, considering the equation is viscous drag dominant, the response time can be expressed in a simple form as a result of the first-order differential equation.
τp is also called characteristic time or time constant. It is a measure of capability of the tracking particles to follow the fluid. Particle density is given by ρp in kilogram per cubic meter and particle diameter is dp in meter. When taking the body force effect into consideration, the terminal velocity difference can be further expressed as:
According to the above expressions, the velocity lag of the tracking particles can be reduced by selecting a smaller particle diameter or a density ratio close to unity. However, in most of the cases, the particle property is subjected to the experimental limitations.
Under experimental constraints, the response time τp should be small enough to follow the smallest turbulent disturbance of interest. In order to relate the response time of the particle to fluid disturbance, the fluid velocity can be conceptually represented as sum of harmonic functions with the angular frequency ω. Providing that the fluid and particle properties can be evaluated, Mei (1996) proposed that the Stokes number defined by the ratio of response times between the particle and fluid disturbance can be expressed as:
An evaluation of the optical systems as outlined by Adrian (1997), the diameter of the selected seeding particles provides a magnification factor, which is an order of magnitude smaller than the diffraction limit of the system lens, implying the seeding particles are small enough so as to not affecting the optical resolution. Although being suitable for PIV measurement, the seeding particles made of TEG are different from the carbon particles in the dissociation reaction. Fortunately, it is noted that the size of the carbon particle in the CFD prediction is in nanoscale. The Stoke’s number of the carbon particles is found to be smaller than that of the TEG particles. Since the Stoke’s number of the TEG seeding particle is about 0.0065, and this implies that the liquid particle’s trajectory is the same as that of a carbon particle. Therefore, when the fluid dynamics is once determined, the carbon particle paths can be estimated.
The second step of the experiment is to determine the time interval between each image pair. The range of time intervals tested are 500 μs and below. The processed images show a tendency of vector field merge from the wall region toward the axis of the reactor as the time interval decreases, which indicate a tangential free vortex profile. When the time interval is equal to 150 μs, the vector distribution around the vortex line, where the tangential velocity is at maximum, is resolved. Below 150 μs, the vector distribution becomes independent of time interval. The level of light distortion becomes significant when the light sheet deviates by more than 25.4 mm. Thus the deviated images are captured at 12.7 and 25.4 mm in Z position under the distortion limit while considering the depth of field of the camera.
Results and Discussion
The velocity magnitude and vorticity contours at three Z traverse positions at 0, 12.7, and 25.4 mm using the TEG particle is shown in Figure 4. The arrow lines in the velocity contour indicate the directions of the particle displacements. When the light sheet plane is deviated from the axis of the reactor, the tangential components of velocity become dominant.
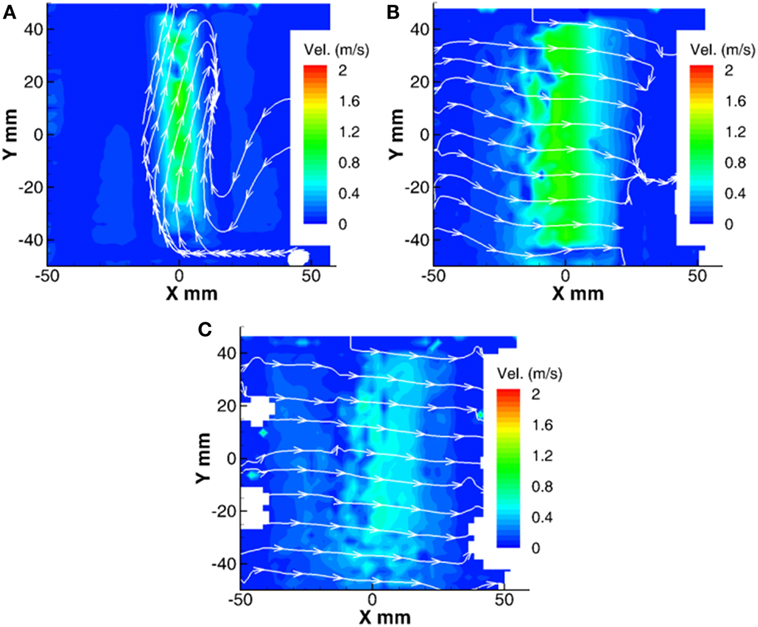
Figure 4. Velocity contours at deviated traverse position (A) 0 mm, (B) 12.7 mm, and (C) 25.4 mm at 300 K and 1 atm.
During the capture, the vortex line precesses around the geometric axis of the reactor. Thus, the vector fields are obtained from ensemble averages. In 12.7 mm case contour, the averaged tangential velocity is 0.993 m/s with 0.992 m/s horizontal component and negligible vertical component. In 25.4 mm case contour, the averaged tangential velocity magnitude is 0.511 m/s with 0.509 m/s horizontal component and negligible vertical component.
According to the CFD simulation, the bulk density of the reactor flow is 0.397 kg/m3. The operating pressure of the room temperature measurement is set to 33 kPa absolute to maintain the flow density. The mass flow rates are calculated with ideal gas assumption. In order to relate the operating pressure to the change of the flow dynamics in the reactor, additional measurements at different pressures are performed at 50, 67, and 101 kPa, respectively, with the same volumetric flow rates for the three inlet flows. The results are shown in Figure 5.
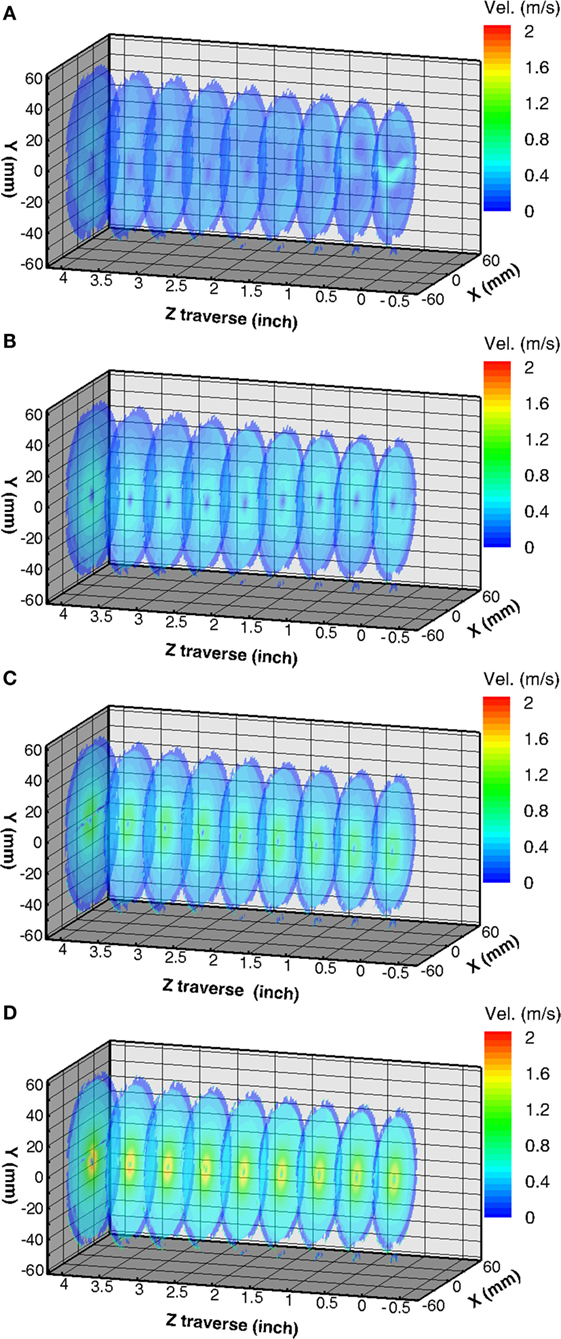
Figure 5. Tangential velocity contours at (A) 33 kPa, (B) 50 kPa, (C) 67 kPa, and (D) 101 kPa using TEG particles.
Figure 5A shows the spatial evolution of the 33 kPa case flow field on nine traverse cross-sectional planes spaced by 12.7 mm. The contour of lowest velocity magnitude near the geometrical center shows the position of the vortex funnel. At cross section one of the image series, a strong jet discharging from the bottom of the image caused by non-uniform distribution of the clockwise main flow is captured. The jet made by 3 out of the 18 radial channels carries higher volume flow rate and impinges the inner wall on the far side. The jet is postulated to drive the fluid along the path out of the window viewing range to circulate around the vortex funnel. In the vorticity contour, it is seen that, at downstream of the jet, the fluid separates from the inner wall, circulates through the geometrical center of the reactor, and finally merges with the jet at upstream to complete the circulation. Therefore, the vortex funnel is deviated and tilted from the reactor axis as a result of non-uniform distributions of the main flow and the wall shield flow.
In 50 kPa case, the contours in Figure 5B shows higher momentum level with stronger fluid rotation compared to the contour of the 33 kPa case. The non-uniform distribution effect of the main flow jet is reduced; however, the vortex tilting remains due to the influence of the wall shield flow. When the pressure further increases to 67 and 101 kPa as shown in Figures 5C,D, the flow becomes axisymmetric. The axial flow region with extremely low tangential velocity at the center of the vortex funnel shrinks, surrounded by fluid of high tangential velocity.
It is seen that as the operating pressure increases, the flow rotation is enhanced because of the increase of momentum level of the fluid. The tangential velocity is proportional to the operating pressure. The structural integrity of the vortex funnel becomes more concentrated and aligned to the reactor axis by its rotating nature.
In order to approach the real two-phase flow condition in a solar reactor, the tracking particles are replaced by the 50 nm size SUPER-P carbon particles. For 50 nm tracking particles made of carbon (SUPER-P), the particle density is 2000 kg/m3, the specific heat is 650 J/kg-K, the thermal conductivity is 165 W/m-K. The Stokes number is 0.0003 and higher since the particles tend to agglomerate due to existence of humidity and static charge. For experiments, the particles were dried and injected at the downstream of the rotameters. The density ratio of carbon to the fluid is 1667. The amplitude ratio is one. The cutoff Stokes number is 0.037, and the cutoff frequency is 10.42 MHz. The maximum cutoff particle diameter is 5.69 μm. By comparison, it is shown that the carbon particle can track the fluid with velocity lag an order smaller than the TEG particles do.
The cutoff eddy diameter is a measure to check how well the particles will follow turbulent eddies under the limitation of spatial resolution of the PIV system. According to the experimental setup, the minimum characteristic lengths or eddy diameters under which the particles can follow the fluid with an amplitude ratio no less than 0.707 are 20 μm for the TEG particles and 90 nm for the carbon particles. Compared to the spatial resolution of a single CCD pixel with a projected physical field size of 71.3 μm, both the tracking particles are synchronized with the fluid at the maximum spatial resolution of the PIV camera.
The minimum detectable eddies can be defined in different ways when considering the spatial resolution of the CCD along with the overlapping percentage of the interrogation spots. For example, an eddy may straddle on two adjacent interrogation spots with different vector directions on each spot. When 50% spot overlapping is applied, the smallest detectable eddy in the vector field is half the spot size. According to the experimental setup, the minimum eddy detectable by the PIV system is more than 56 times of the cutoff eddy size for the TEG particles, which ensures the robustness of the eddy velocity vectors on the image plane.
For experiments, dried carbon particles were loaded into a pulsed vibrating solid injector located between the rotameters and the reactor. The flow fields are captured from the entrance zone to the exit of the reactor as shown in Figure 6.
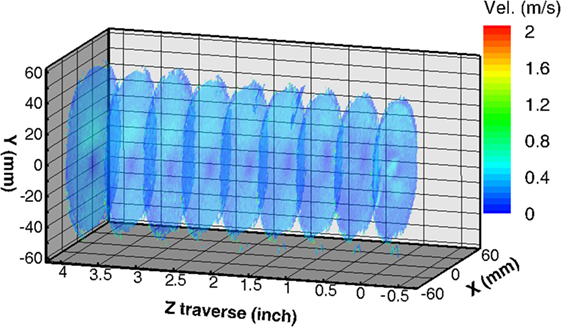
Figure 6. Tangential velocity contours at 33 kPa using 50 nm carbon as tracking particles.
The non-uniform tracking particle distribution is captured at the entrance zone, and a self-homogenization process during spatial evolution is observed. The clockwise spiral path of the vortex core matches the result of the liquid particle experiment at the same flow condition except the particle species used. Downstream of the cyclone, a helical vortex funnel is captured. The average flow speed considering the radius effect is 0.23 m/s compared to the result of 0.19 m/s obtained in the liquid particle measurement in the vacuum case at 33 kPa. It is noticed that, although the path of the vortex funnel in this case matches the result in the 33 kPa vacuum case, the vorticity contour in this case is more chaotic than the previous cases, and the turbulent intensity contour is higher than the previous cases because of the existence of local velocity gradient. The higher velocity gradient can be caused by the variations of the particle size, humidity, particle surface condition, centroid image correlation, static charge, scattering signal quality, etc. However, apart from the local gradient, the measured flow speed and vortex evolution using solid carbon particles still proves that the previous cases using the TEG liquid particles are valid, can correctly predict the solid carbon particle trajectory, and eliminate the local gradient effect.
One of the performance indicators of a solar reactor is the residence time. The longer the residence time the more the chance that the hydrogen rich fuel can be dissociated. When the operating pressure and temperature need to be controlled within the reaction active condition and material tolerance, the only adjustable flow parameter is the volume flow rate. The axial component of main flow rate versus axial velocity per percentages of main flow rates at 50, 100, 125, and 150% with respect to 10 LPM of the CFD settings was studied. These four cases showed that, when the main flow rate increases, a fluid turning occurs at 30 mm of radius from the vortex line due to fluid rotation. As the rotating speed further increases, the drawing effect to the fluid from the periphery to the vortex funnel becomes stronger following the potential flow theory. The maximum axial velocity is proportional to the main flow rate except the lowest main flow rate case because of the viscosity-dominated effect. But, even the lowest main flow rate case also show the existence of the secondary flow at the same position of radius as the rest of the three cases. It was also observed that there is a neutral fluid layer acting as a transition buffering zone between the up-moving vortex funnel flow and the reversed secondary flow. The neutral fluid layer exists at location range between 10 and 20 mm of radius.
Uncertainty Analysis
For a typical digital PIV measurement, the source of uncertainty primarily comes from experimental setup, calibration, data acquisition, and reduction. The uncertainty equation defined by Adrian (1997) is as follows:
The calibration induces uncertainty due to misalignment between the calibration plate and the image plane as shown in Figure 7. A systematic analysis of PIV measuring uncertainty was given by Nishio (2008). The analysis is further divided into two orientations of capture. The first captures the axial velocity component of the vortex transversely from the side of the reactor (side view), and the second captures the tangential velocity components through the reactor window in axial direction (top view).
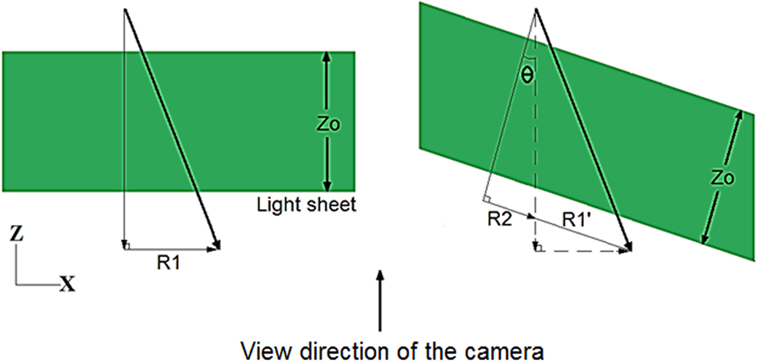
Figure 7. 3-D effect on measuring a vortex flow by PIV.
In a rotating flow, the 3-D effect as a result of out-of-plane motion is more dominant than other flows. For example, in Figure 7, assuming the view of camera is in positive Z direction of traverse, when a perspective angle θ exists between the light sheet and the viewing direction of camera, as shown on the right of the figure, an additional component R2 will be included in the image besides the R1′ component. In a vortex flow, the moving direction of the tracking particles is nearly perpendicular to the light sheet plane, which has only a very small vector component in the light sheet plane. Therefore, the projected velocity component R2 is relatively large compared to the in-plane motion R1′.
Based on parametric analysis, the velocity uncertainty dominates the accuracy of the PIV measurement while the uncertainties in displacement and time are negligible. The velocity uncertainties are 16.2 and 9.7% for side and top views images, respectively. The above results are based on the mean flow speed equal to 0.51 m/s in the atmospheric air case. In the vacuum air case, the mean flow speed decreases to 0.2 m/s, the corresponding uncertainty increases to 28.0 and 24.8% for the side and top view images, respectively. It is seen that the uncertainty of the side view measurement is higher than the other. The primary error sources are the mismatch error and the 3-D effect. The mismatch error comes from the pairing loss during image processing and is prevalent in all PIV applications. In conventional digital PIV system, the mismatch error is also the primary source of measurement uncertainty.
When the time interval is increased, the uncertainty decreases when the particle displacement increases, as shown in Figure 8. However, a larger time interval will increase the chance of losing particle image pairs in high speed region of the flow field, for example, the vortex funnel of a cyclone flow where the flow rotates very fast compared to the periphery. On the other hand, decreasing the time interval will lead to an increasing uncertainty dominated by mismatch error.
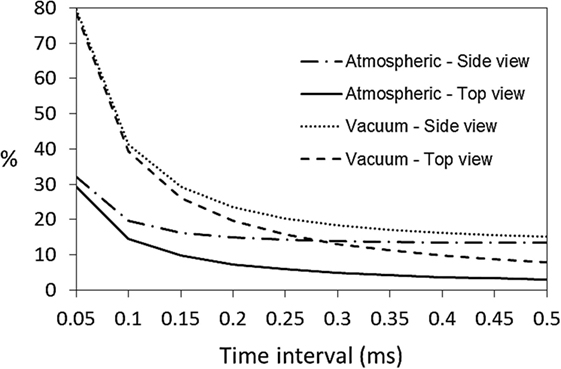
Figure 8. Time interval effect to measuring uncertainties of the atmospheric and 33 kPa vacuum cases.
According to a system parametric analysis, when the time interval is equal to 100 μs, the uncertainty due to mismatch error is equivalent to that of the 3-D effect. The uncertainty becomes mismatch error dominated when the time interval is less than 100 μs. In an optical analysis, the maximum time intervals to avoid in-plane and out-of-plane motions are 194 and 85 μs. In the experiment, an empirical value of time interval is set to 150 μs as a result of the above considerations.
Figure 9 shows that the uncertainty decreases as the pressure increases. Essentially, the operating pressure is proportional to the mean flow velocity. The uncertainty is inversely proportional to the mean flow speed corresponding to different operating pressures. When the mean flow velocity is low, the 3-D effect becomes less significant compared to fixed mismatch error.
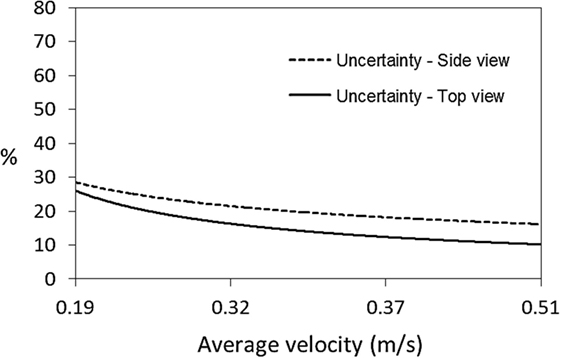
Figure 9. Mean flow speed effect to measuring uncertainties of the atmospheric and the vacuum cases.
Conclusion
A step-by-step experimental study of fluid dynamics of the solar cyclone reactor has been demonstrated. A transparent solar reactor model as well as a multi-task flow control and measurement platform were designed, manufactured, assembled, calibrated, and tested. The inlet flow rates were calculated according to the ideal gas law. The controlled pressure accuracy was up to 0.01 kPa. The temperature variation was less than 0.2 K. A 2-D light tracing simulation was performed according to the geometry of the reactor. The path of the light sheet through the cylindrical part of the reactor model was determined. The interval of the light sheets between each traverse position was maintained before and after the light deflection. An optimal optical setting to the PIV system was analyzed. The dynamic velocity range (DVR) is 34; the dynamic spatial range (DSR) is 330 at f-number equal to 8. The optimal DVR is 36; the optimal DSR is 256 at f-number equal to 10. The image size is 1.84 pixels. The PIV system is diffraction limit dominated.
A particle tracking analysis was done to the fidelity of the two particles species applied in the PIV measurement. The liquid TEG particle size was 1 μm whereas the solid carbon particles were 50 nm to ensure the tracking accuracy. The corresponding marginal incident wavelength of Rayleigh scattering is 750 nm; therefore, the image signal of the seeding particles from a 532 nm laser light sheet is primarily Mie scattering. The two particle species adopted in the PIV measurement ensured over 99% magnitude response. The stagnation circulation of the carbon particles during steady state PIV measurement was observed.
The uncertainty analysis to the PIV system was evaluated. The bias limits and sensitivity factors according to the experimental setup were determined. The maximum uncertainty was 16.2% from the side view and 9.77% from the top view in the atmospheric case; 28 and 24.8%, respectively in the vacuum case.
The experiments using two particles were conducted separately, and the tracking credibility was evaluated when the imaging quality was achieved. The details of particle breakup, shape effect, and size effect were neglected in this research due to equipment limitation; all the particle performance were estimated according to Stoke’s flow theory and the manufacturer’s test data.
A comparison of particle-fluid dynamics between using liquid TEG particles and the solid carbon particle under the same setup condition at room temperature was presented. The tracking capability of both particles was analyzed. The reliability of using 1 μm liquid particle to perform PIV measurement was validated. A higher vorticity and turbulent intensity was observed in the solid particle-fluid due to more irregular shape and size of the carbon particles used in this mixture. The Stokes number is 6.5 × 10⁻³ for liquid particles and 3 × 10⁻⁴ for carbon particles per Stokes flow analysis.
Author Contributions
This research was done as part of Ph.D dissertation of M-HC who was supervised by Professors NO and GM. Simulations, and use of carbon particles were the ideas of Prof. NO and supervised by her. PIV experimental setup and tests were fully supervised by Prof. GM.
Conflict of Interest Statement
The authors declare that the research was conducted in the absence of any commercial or financial relationships that could be construed as a potential conflict of interest.
Funding
This publication was made possible by NPRP grant # 09-671-2-255 from the Qatar National Research Fund (a member of Qatar Foundation). The statements made herein are solely the responsibility of the authors.
References
Abanades, S., Kimura, H., and Otsuka, H. (2014). Hydrogen production from thermos-catalytic decomposition of methane using carbon black catalysts in an indirectly-irradiated tubular packed-bed solar reactor. Int. J. Hydrogen Energy 39, 18770–18783. doi:10.1016/j.ijhydene.2014.09.058
Adrian, R. J. (1997). Dynamic ranges of velocity and spatial resolution of particle image velocimetry. Meas. Sci. Technol. 8, 1393–1398. doi:10.1088/0957-0233/8/12/003
Auton, T. R., Hunt, J. C. R., and Prud’homme, M. (1988). The force exerted on a body in in-viscid unsteady non-uniform rotational flow. J. Fluid Mech. 197, 241–257. doi:10.1017/S0022112088003246
Chien, M. H. (2013). Experimental and Computational Study of Fluid Dynamics in Solar Reactor. Ph.D. Dissertation. College Station, TX: Texas A&M University, Mechanical Engineering Department.
Devanuri, J., and Ozalp, N. (2013). Numerical investigation of particle deposition inside aero-shielded solar cyclone reactor: a promising solution for reactor clogging. Int. J. Heat Fluid Flow 40, 198–209. doi:10.1016/j.ijheatfluidflow.2012.12.004
Durst, F., Melling, A., and Whitelaw, J. H. (1981). Principles and Practice of Laser-Doppler Anemometry. London: Academic Press.
Hart, D. (1998). “PIV error correction,” in 9th International Symposium on Applications of Laser Techniques to Fluid Mechanics, July 13–16, Lisbon, Portugal.
Keane, R. D., and Adrian, R. J. (1990). Optimization of particle image velocimeters. Part I: double pulsed systems. Meas. Sci. Technol. 1, 1202–1215. doi:10.1088/0957-0233/1/11/013
Keane, R. D., and Adrian, R. J. (1991). Optimization of particle image velocimeters. Part II: multiple pulsed systems. Meas. Sci. Technol. 2, 963–974. doi:10.1088/0957-0233/2/10/013
Kogan, A., Israeli, M., and Alcobi, E. (2007). Production of hydrogen and carbon by solar thermal methane splitting IV preliminary simulation of a confined tornado flow configuration by computational fluid dynamics. Int. J. Hydrogen Energy 32, 4800–4810. doi:10.1016/j.ijhydene.2007.08.016
Kogan, A., and Kogan, M. (2002). The tornado flow configuration-an effective method for screening of a solar reactor window. ASME J. Solar Energy Eng. 124, 206–214. doi:10.1115/1.1487882
Kogan, A., Kogan, M., and Barak, S. (2004). Production of hydrogen and carbon by solar thermal methane splitting II room temperature simulation tests of seeded solar reactor. Int. J. Hydrogen Energy 29, 1227–1236. doi:10.1016/j.ijhydene.2003.12.002
Mei, R. (1996). Velocity fidelity of flow tracer particles. Exp. Fluids 22, 1–13. doi:10.1007/BF01893300
Melling, A. (1997). Tracer particles and seeding for particle image velocimetry. Measurement Sci. Technol. 8, 1406–1416. doi:10.1088/0957-0233/8/12/005
Nishio, S. (2008). “Uncertainty analysis and example for PIV measurements,” in Proceedings of 25th ITTC, Fukuoka.
Ozalp, N., Chien, M. H., and Morrison, G. (2013). Computational fluid dynamics (CFD) and particle image velocimetry (PIV) characterization of a solar cyclone reactor. ASME J. Solar Energy Eng. 135, 10031–10035. doi:10.1115/1.4023183
Ozalp, N., and Kanjirakat, A. (2010). Lagrangian characterization of multi-phase turbulent flow in a solar reactor for particle deposition prediction. Int. J. Hydrogen Energy 35, 4496–4507. doi:10.1016/j.ijhydene.2010.02.065
Keywords: particle image velocimetry, cyclone formation, solar reactor, heat transfer and fluid flow, particle entrainment
Citation: Chien M-H, Ozalp N and Morrison G (2016) Effect of Particle Type on Cyclone Formation Inside a Solar Reactor. Front. Mech. Eng. 2:6. doi: 10.3389/fmech.2016.00006
Received: 16 May 2016; Accepted: 04 July 2016;
Published: 18 July 2016
Edited by:
Guillermo Rein, Imperial College London, UKReviewed by:
Amy Rachel Betz, Kansas State University, USAAlexis Cantizano, Universidad Pontificia Comillas (ICAI), Spain
Copyright: © 2016 Chien, Ozalp and Morrison. This is an open-access article distributed under the terms of the Creative Commons Attribution License (CC BY). The use, distribution or reproduction in other forums is permitted, provided the original author(s) or licensor are credited and that the original publication in this journal is cited, in accordance with accepted academic practice. No use, distribution or reproduction is permitted which does not comply with these terms.
*Correspondence: Nesrin Ozalp, nesrin.ozalp@kuleuven.be