State-of-the-art and recent advances in quantification for therapeutic follow-up in oncology using PET
 Thomas Carlier
 Clément Bailly
- 1Nuclear Medicine Department, University Hospital, Nantes, France
- 2CRCNA, INSERM U892, CNRS UMR 6299, Nantes, France
18F-fluoro-2-deoxyglucose (18F-FDG) positron emission tomography (PET) is an important tool in oncology. Its use has greatly progressed from initial diagnosis to staging and patient monitoring. The information derived from 18F-FDG-PET allowed the development of a wide range of PET quantitative analysis techniques ranging from simple semi-quantitative methods like the standardized uptake value (SUV) to “high order metrics” that require a segmentation step and additional image processing. In this review, these methods are discussed, focusing particularly on the available methodologies that can be used in clinical trials as well as their current applications in international consensus for PET interpretation in lymphoma and solid tumors.
1. Introduction
Positron emission tomography (PET) with 18F-FDG plays a major role in the assessment of therapy response and in patient follow-up for oncology applications (1–3). More specifically, PET is being increasingly used to monitor response to therapy in solid tumors (4) and in lymphoma (5). Furthermore, PET imaging is often considered as a quantitative imaging technique since it offers the possibility of measuring in vivo the radiopharmaceutical concentration expressed in Bq/mL. As a consequence, one may benefit from this quantitative information to obtain metrics that may enhance (or probably replace) the visual interpretation that is still widely used in everyday clinical practice (6). In an interesting review, Tomasi and colleagues (7) advocate the use of quantitative metrics in PET for two main reasons: (i) those metrics are less user-dependent, calculated semi-automatically, and allow multi-center trials if acquisition and reconstruction parameters are carefully chosen (8, 9), and (ii) the development of novel radiopharmaceuticals targeting relevant biomarkers (10) imposes the use of an optimal quantitative approach as conventional quantitative metrics (including visual analysis) may not always be adapted for extracting relevant information. Additionally, beyond the usefulness of quantitative imaging for therapy response or prognosis, those metrics are expected to play a pivotal role for tumor characterization in line with the development of personalized medicine.
This short review provides an overview of the current use of quantitative metrics and discusses promising methodological developments in the context of therapy response and patient follow-up using 18F-FDG PET imaging. For this purpose, this review is divided into three sections. The first section is dedicated to a brief description of the main issues of quantitative metrics that are being used in clinical studies. It focuses on quantitative methodologies that have been already investigated and assessed for therapy response and patient follow-up. The ideas developed in this section can be seen as the depiction of “a perfect world,” given that the limits and usefulness of such quantitative approaches can be fully understood without being necessarily implemented in routine practice. Some of those metrics are promising tools while others are already employed clinically. The second section discusses the use of quantification for treatment monitoring and response-adapted therapy in lymphoma from a more clinical point of view. It is now well-established that 18F-FDG PET has great value for monitoring therapy and a tremendous international effort has resulted in an unified interpretation criteria in lymphoma (11). It is impressive that quantitative metrics’ role gains more and more importance in these regularly updated consensual criteria in lymphoma. In this respect, the use of 18F-FDG PET in lymphoma can be considered as an “almost perfect world” as far as quantitative approaches are clinically relevant for assessing therapy response in lymphoma. In contrast, up to now, there is no international consensus in using PET-based quantitative metrics for assessing therapy response in solid tumors (third section). The most recent attempt to standardize interpretation criteria has been proposed by Wahl and colleagues with the PET response criteria in solid tumors (PERCIST) (12), and paves the way toward an unified approach in solid tumors that is not yet used clinically.
2. Metrics for Quantification in PET: A Perfect World
Quantitative metrics derived from PET images are now recognized as valuable tools to improve the robustness of diagnosis especially in the area of therapeutic follow-up. The standardized uptake value (SUV) is now the most popular metric routinely used and is included in 90% of PET reports (13). However, other PET-derived quantitative metrics have emerged to be potentially useful in analyzing PET images or helping nuclear medicine specialists to diagnose patients with confidence. The aim of this section is not to discuss the technical limitations of all quantitative metrics but to highlight the assessment and use of those metrics under clinical situations. The metrics that can be derived directly from reconstructed volume without post-processing are termed hereafter “first order metrics”. SUVmax and SUVpeak are included in this category and are briefly detailed in the first part. “Second order metrics” fall under the category of those measurements that in addition to “first order metrics ” require a segmentation step to be computed, and include SUVmean, total lesion glycolysis (TLG), and the associated metabolic tumor volume (MTV). These are outlined in the second part. In the third part, “high order metrics” that require a segmentation step and additional image processing are briefly detailed. Tumor textural features are typically included in those metrics. Lastly, the usefulness of a new parametric approach exploring the benefit of tracking tumor uptake changes between longitudinal examinations is presented.
2.1. First Order Metrics: SUVmax and SUVpeak
The SUV is widely adopted as a surrogate of the overall net rate of 18F-FDG uptake. The underlying limitations of this assumption can be found, for instance, in the review of Bai and colleagues (6). The SUV is defined as the ratio between the radiopharmaceutical concentration (expressed in Bq/mL) and the decay corrected injected activity normalized by a given factor. Three main normalization factors are used: the widely used body weight (SUVbw expressed in kg/mL), the body surface area (SUVbsa expressed in m2/mL) computed with specific equations (14), and the lean body mass (SUVlbm or SUL expressed in kg/mL). This latter metric is recommended by Wahl (12) when using the PERCIST criteria because of its less dependent variation on body weight especially for obese patients. A recent work discussed the use of appropriate equations for computing the lean body mass (15).
The precise description of technical variabilities of SUV is beyond the scope of this short review and has been widely discussed in the literature. Readers interested in a thorough insight can refer to several excellent studies dealing with this issue (16–20). This paper focuses on the two most used metrics: SUVmax defined as the SUV value of the maximum intensity voxel within a region of interest (ROI) and SUVpeak defined as the average SUV within a small ROI (usually, a 1-cm3 spherical volume). Only these properties assessed with patients’ data are reported, which represents limited studies in spite of their widespread application and description on phantoms data. Additionally, all the following studies share the strong hypothesis that both SUVmax and SUVpeak are not affected by the partial volume effect (PVE). It is well known that this hypothesis is invalidated when the lesion size is less than three times the reconstructed image resolution (21). The PVE results from the combination of the tissue fraction effect due to the point-spread function of the PET system, and the sampling effect due to the finite voxel size of the reconstructed images. An overview of partial volume corrections (PVC) can be found in a recent paper by Erlandsson et al. (22).
In a study including 26 patients with various clinical indications (23), Nahmias et al. reported the reproducibility of SUVmax by acquiring two PET/CT scans within 3±2 days. They concluded that the SUV variability increased when SUVmax increased, but contributed <0.5 (in SUV unit) in 95% of repeated studies. This indicates that an SUV change superior to 0.5 may be clinically relevant in most cases. De Langen et al. extended the study with a meta-analysis based on four studies representing 86 patients and 163 analyzed tumors (24). The main relevant conclusions reported by the authors were that if ΔSUVmax > 30% and ΔSUVmax > 2 or if ΔSUVmax > 25% and ΔSUVmax > 3 between two exams, then the SUV change can be considered as relevant (i.e., the difference is not likely an error measurement) within the 95% confidence limit. The conclusions published by Nahmias et al. (23) were thus partially invalidated or at least more restrictive.
A potential important feature of the SUVmax measurement is that this metric is susceptible to be strongly affected by noise due to its single-voxel determination. Lodge et al. focused on this issue analyzing data from 20 patients acquired by a phase-based respiration gated protocol (total duration: 15 min) for known or suspected malignancies in the chest or abdomen (25). Data were reconstructed in five independent phases and reproducibility was evaluated on two consecutive phases. They also studied SUV bias using different time frame lengths from 1–15 min. They reported several interesting conclusions: (i) the variability of SUVmax that can be attributed to image noise accounts for half of the overall variability, (ii) a ΔSUVmax < 30% is still within the uncertainty of repeated measurement, and (iii) a positive bias of SUVmax can be as high as 30% for short acquisition time (i.e., high noise level), evaluated as 1 min per bed position for the system used in their study. The authors also reported the properties of SUVpeak in this work. As expected, they found that SUVpeak was less biased than SUVmax (positive bias of 10% for the same 1-min acquisition per bed position), and the impact of noise was two times less for SUVmax. They also concluded that SUVpeak was not greatly affected by the voxel size (that is directly related to image noise for a same number of counts recorded). This last conclusion may be of particular interest as a recent study suggested that lesion detectability could be improved using small voxel size (typically, 2 mm × 2 mm × 2 × mm) (26), or for multicenter studies, in which different voxel size can be used. However, as mentioned by Lodge et al., it is worth noting that SUVpeak is likely more sensitive to PVE than SUVmax. Additionally, Vanderhoek et al. raised the important issue of the SUVpeak computation as many authors used their own ROI definition for calculating this metric (27). Their study was based on the analysis of 17 patients that underwent 2 PET/CT 18F-FLT. They surprisingly found that the ROI definition alone could change the tumor response assessment in approximately half the population studied when choosing the response threshold proposed by PERCIST (±30%). Their conclusions underline the need to use a unique ROI definition for computing the SUVpeak such as the one proposed by Wahl (12): a fixed 1-cm3 spherical ROI centered on the high-uptake part of the tumor (which does not necessarily embed the SUVmax value).
Finally, although not directly related to SUVmax or SUVpeak measurements but more generally with first order metrics, we report the recent study of Boktor et al. that aimed at assessing the intrapatient variability of SUV measured in the liver (28). This is a relevant topic as there is an increasing interest to extend visual analysis to semi-quantitative analysis especially in the area of interim 18F-FDG response in lymphoma where the liver is often considered as a reference region (29). A total of 132 patients that underwent two or more PET/CT scans were retrospectively enrolled. The reference range for SUV liver intrapatient variability was found to be [−0.9, 1.1] indicating the intrinsic limit of SUV measurement in the liver when considered as a reference organ.
2.2. Second Order Metrics: SUVmean, TLG, and MTV
When using SUVmax or SUVpeak, all of the tumor information is reduced to the measurement within a very limited region of the tumor (a single voxel for SUVmax). It has been speculated that taking measurements from the whole tumor may better reflect the overall tumor burden than SUVmax or SUVpeak. The SUVmean is the average measure of SUV within calculated boundaries of a tumor. Once this region is determined, it is straightforward to derive the metabolic tumor volume (MTV) and the product SUVmean × MTV which defines the total lesion glycolysis (TLG), first introduced by Larson et al. for evaluating the response of locally advanced aerodigestive tracttumors (30). Obviously, the delineation of tumor involves the use of a segmentation approach. Only automatic methods will be briefly discussed in this section as a manual segmentation is often associated with a higher degree of variability. Automatic segmentation is directly impacted by several image properties that, theoretically, must be accounted for: (i) noise, (ii) spatial resolution (highly post-smoothing level dependent), (iii) voxel size, (iv) heterogeneity in the tumor, and (v) uptake gradient within and outside the tumor. Zaidi et al. recently published an overview of available segmentation approaches (31). The methods used for deriving MTV and the derived SUVmean and TLG could be basically categorized into two groups, namely those that are:
1. available routinely in a clinical environment, from which we can distinguish:
(a) methods that do not need a calibration,
(b) methods that need a calibration,
2. still under development and not routinely available.
Segmentation approaches that fall under the group 1a can be SUVn% where a threshold based on the percentage of the SUVmax is chosen (typically, n ∈ [41 − 70]) or SUVk where all voxel values that are superior to SUV = k (typically, k = 2.5 or k = 3) delineate the tumor. Segmentation techniques that need a calibration (sub-group 1b) are those developed for instance by Schaefer et al. (32) or Vauclin et al. (33). Those methods are often termed as contrast-oriented and need prior calibration. In that respect, they can be considered as specific of a given PET scanner, reconstruction algorithm, and voxel size. Methods that belong to group 2 are advanced automatic methods using only the intrinsic properties of reconstructed images. They do not need a calibration phase and are currently under development and/or assessment. The most popular, as far as PET only datasets are considered, includes edge detection (34), watersheds (35), gradient-based (36), Fuzzy C-Means (37), or fuzzy locally adaptative bayesian (FLAB) (38).
The intrinsic performances of those different approaches have been extensively evaluated with phantom experiments (39–42). The different studies underlined that more advanced methods, such as those falling under group 2, allowed higher accuracy than those of group 1b or 1a (41, 42). All methods were more or less affected by physiological and imaging parameters (40). Cheebsumon et al. avoided the use of SUVk-based segmentation as this may lead to strong bias (40). Interestingly, few studies assessed the repeatability of different segmentation algorithms using clinical data (43–46). For example, Cheebsumon et al. retrospectively enrolled 19 patients (10 patients underwent 18F-FDG and 9 18F-FLT) with non-small cell lung cancer (NSCLC). They were scanned twice 1 week apart. The repeatability was assessed for ten segmentation algorithms (representing all groups previously described) and different noise and spatial resolution properties in reconstructed images. They concluded that all methods performed generally equally for the test-retest variability but some tumor delineation methods are more sensitive to image noise (gradient-based and SUV2.5). While SUV2.5-based method tended to dramatically overestimate volume, contrast-oriented methods appeared to be robust enough against noise and spatial resolution properties. Hatt et al. (44) performed a similar study for patients with esophageal cancer (18F-FDG) and breast cancer (18F-FLT). The segmentation algorithm that led the smallest test-retest variability was always the techniques that rely on group 2 techniques, while the worst were those based on manual delineation.
While the limits were clearly highlighted with both phantom and clinical data, it is striking to note that numerous studies used known-biased method (i.e., SUV2.5) to compute MTV or TLG. An overview of the different segmentation algorithms used in the literature to assess the prognostic value of MTV or TLG for solid tumors is mentioned by Van de Wiele et al. (47) for patients suffering from squamous cell carcinoma of the head and neck, lung carcinoma, esophageal carcinoma, and gynecological carcinoma. A meta-analysis was also recently published by Pak et al. (48) for assessing the prognostic value of MTV and TLG for patients with head and neck cancer and also pointed out the pre-eminence of biased algorithms for computing MTV or TLG. Nevertheless, although the limits of the different tumor delineation techniques used in these studies were reported, most of the studies showed that, whatever the segmentation algorithm used, a higher MTV or TLG in head and neck cancer is associated with a higher risk of adverse events or death (48). The conclusions were almost identical when considering the review published by Van de Wiele (47). MTV and TLG calculation based on basic algorithms (threshold-based or hrmSUVk-based segmentation) succeeded in correctly predicting outcome and were found to be a relevant and independent prognostic biomarker for survival.
It is interesting to note that in the last 2 years, there has been a growing interest in assessing the prognostic value of MTV and/or TLG for solid tumors. For instance, MTV defined by threshold-based algorithms were found to be associated with progression-free survival (PFS) and overall survival (OS) in salivary gland carcinoma (49). Another study showed that MTV and TLG computed with the SUV2.5 technique provided useful prognostic information for patients suffering from pancreatic cancer with curative intent (50). TLG computed with a threshold-based algorithm (40% of the SUVmax) was also an independent prognostic factor for disease progression in epithelial ovarian cancer (51).
There is also a recent tremendous effort to compare the results of MTV, as computed with PET reconstructed images, with the MTV measured after tumor resection. Hatt et al (52) compared four segmentation algorithms with pathological findings (measuring the maximum diameter of the tumor) after lobectomy for 17 patients suffering from NSCLC. They underlined that in a case where tumors tended to be very heterogeneous, all delineation algorithms underestimated the maximum diameter. This result advocates the use of advanced segmentation approaches (group 2) to account correctly for uptake heterogeneity. Zaidi et al. enrolled seven patients suffering from pharyngolaryngeal squamous cell carcinoma (53). Ten PET segmentation methods were compared to surgical specimens after total laryngectomy. The surgical specimens were frozen, cut, and then digitized. This enabled a remarkable 3D-reconstruction to be compared directly with the results based on PET segmentation. Their main findings were that advanced segmentation methods (Fuzzy C-Means-based algorithm) and adaptive thresholding techniques (sub-group 1b) gave the best approximation of volumes measured on surgical specimens. A study conducted by Schaefer et al. (54) after lobectomyand mediastinal lymph node dissection in the context of lung cancer yielded the same conclusions for an adaptive-based thresholding technique.
While MTV and TLG have proven to provide useful prognostic metrics in essentially solid tumors when computed on the primary lesion, many authors suggest that a “whole-body metabolic burden” may best reflect the stage of the disease. This idea has been put forward recently with two interesting editorial commentaries related to evaluation of treatment response in hematological disease (55, 56). This approach was successfully assessed in 19 patients with non-Hodgkin’s lymphomas (NHL) by Berkowitz and colleagues (57). The authors pointed out the potential superiority of whole-body-based metrics over conventional indices in managing NHL patients. Following this, Fonti and colleagues found that total MTV computed with the threshold-based algorithm (40% of the SUVmax) was predictive of survival (PFS and OS) in multiple myeloma patients in a retrospective study including 47 patients (58). Similar results were recently reported by Sasanelli et al. (59) for 114 patients with diffuse large B-cell lymphoma (DLBCL). They also used a threshold-based algorithm (41% of the SUVmax) and found in multivariate analysis that total MTV was the only independent predictor of OS. In a study focusing on 59 patients with hodgkin lymphoma (HL), Kanoun et al. (60) also showed that baseline total MTV (computed with 41% of the SUVmax) was predictive of patients outcome for PFS. Interestingly, they showed that when combining the baseline total MTV and ΔSUVmax between initial and interim PET, an identification of three subsets of patients with different outcomes could be derived. They highlighted the important benefits of such categorization for tailoring therapeutic strategies in HL patients and strengthened the interest of interim PET analysis with a quantitative approach. The sum of TLG for all lesions was also investigated in a study of Kim and colleagues for 140 patients diagnosed with DLBCL (61). They used a threshold-based algorithm (50% of the SUVmax) and found that the sum of TLG was highly predictive of survivals for both PFS and OS. However, as pointed out by Basu et al. (56), the use of a whole-body metric involving TLG could be highly dependent on the severity of PVE. Not accounting for PVE for small lesions could dramatically underestimate the total TLG making the validity of this metric questionable.
Therefore, there is an acute need for defining a robust delineation method, associated with PVC when required, that makes a reliable extraction of those second order indices possible (62).
2.3. High Order Metrics: Textural Features
A new class of metrics has recently emerged in PET imaging and is currently being clinically investigated. Those metrics intend to quantify the heterogeneous intra-tumoral uptake which must in turn be correlated with clinical outcome. They are calculated on reconstructed images and are often referred to as “textural features.” The image texture characteristic is not new, and was originally proposed in the early 1970s by Haralick (63). The underlying concept relies on a possible direct relation between heterogeneity at the cellular and macroscopic levels which in turn remains still unclear (64, 65). Biological heterogeneity of a tumor is conventionally associated with different histological features such as metabolism, proliferation, necrosis, vascular structure, degree of hypoxia. These properties may greatly affect the prognosis and the treatment response. Therefore, extracting textural features directly at the macroscopic level may be of great importance for personalized management of disease.
The computation of heterogeneity in medical imaging has been already applied in a wide variety of indication for several imaging modalities. Interested readers are referred to the recent review of Davnall et al. (66). In PET imaging, textural feature analysis is mainly based on statistical approaches (67). Several steps are required including: (i) tumor segmentation, (ii) derived ROI content resampling (using typically 32, 64, or 128 discrete values), (iii) desired matrix computation (cooccurrence matrix, gray-level run length matrix, neighborhood gray-level different matrix, or gray-level zone length matrix), and (iv) associated textural indices computation. Ideally, the number of resampling values must be reported to avoid misinterpretation.
Galavis et al. (68) investigated the intrinsic performances of textural indices by comparing several metrics to each other and derived a set of indices that are the most independent from matrix size and reconstruction parameters. Several other recent studies reported the significance and robustness of texture metrics using clinical data. Tixier et al. (69) studied the reproducibility of 25 indices using two PET scans acquired within 4 days. They considered 16 patients with esophageal cancer and lesions were delineated with the FLAB algorithm. Only three of their indices were robust and reproducible enough between the two scans (namely: entropy, homogeneity and dissimilarity). The impact of PVC and different tumor delineation were also investigated by Hatt et al. (70) for eight textural metrics. They found that heterogeneity parameters were more dependent on the segmentation algorithm than PVC. Although a significant absolute difference was found as a function of tumor delineation, they also concluded that this difference does not change the predictive value of each parameter (at least for entropy, homogeneity and dissimilarity). The robustness of textural indices with respect to the number of discrete values used for the resampling and the tumor delineation algorithm was also investigated by Orlhac et al. (71) using 28 patients (for a total of 188 tumors) with metastatic colorectal cancer, NSCLC, and breast cancer. They argued that at least 32 gray levels are mandatory and found that only 17 indices out of the 31 studied are robust enough against the segmentation algorithm. Only one study assessed the correlation between heterogeneity evaluated numerically and visually (72). They found a moderate correlation (0.4 < r < 0.6) and underlined the poor inter-observer agreement for the visual assessment of heterogeneity. These results strengthen the need for numerical computation of textural features.
Additionally, controversy remains regarding the number of voxels used for computing reliable textural features (i.e., not dependent on the number of voxels used). Very few authors mentioned this crucial information in their studies. Brooks and Grigsby recently published an interesting study (73) based on 70 cervical cancer tumors. They showed that for a specific metric (entropy), a minimum number of voxels was required (700 voxels) to minimize the dependence with the number of voxels. Another study speculated that the minimum number of voxels must be larger than 3 cm3 (72) without precisely justifying this value. Orlhac et al. (71) suggested that the limit must not be less than 4 × 4 × 4 = 64 voxels and must also take into account the spatial resolution of the PET system (at least three times the measured full width at half maximum). It is worth noting that this methodological aspect must be carefully investigated in future studies.
Another matter for debate is the potential correlation of textural indices with each other and with first or second order metrics described in Sections 2.1 and 2.2 (65). The idea behind this issue is the real additional value brought by textural features with respect to other metrics. Several studies were focused on this problem (70, 71, 74–76). In the work of Orlhac et al. (71), the correlated indices were classified in a same group. The authors succeeded in bringing up several groups of independent texture metrics. The first and second order metric were obviously highly correlated with each other but poorly correlated with the majority of textural metrics. They also focused on the correlation of MTV with textural features and found that some texture indices were strongly correlated with MTV. They concluded that this correlation must be accounted for when using such indices. Hatt et al. (70) came to the same conclusions for a more limited number of textural features.
Whilst the significance and robustness of textural features are not currently fully understood or investigated (65), there is a growing interest for using those metrics in a clinical setting. Studies were dedicated mainly to solid tumors. Tixier et al. (77) reported that textural analysis can differentiate three groups of patients (non-responder, partial-responder, and responder) with a very good sensitivity for 41 patients with esophageal cancer before external radiotherapy and chemotherapy. They showed that few textural metrics performed better than any SUV-based measurements. Cheng et al. (78) also confirmed that one of their analyzed textural metrics, uniformity calculated with the cooccurrence matrix, was an independent prognostic factor for PFS and OS for 70 patients with advanced T-stage oropharyngeal squamous cell carcinoma. In another interesting study, Cook et al. (79) retrospectively enrolled 53 patients with NSCLC and found that three textural metrics can better stratified patients treated with radiochemotherapy than SUV parameters, MTV, or TLG. Two studies recently addressed the use of textural features in response assessment (80, 81). Yang et al. (80) were interested in the temporal evolution of 22 textural metrics during the course of treatment of 20 patients with cervical cancer (three PET/CT scans). They concluded that textural features may be considered as an alternative to SUV changes for better understanding the tumor response. Bundschuh et al. (81) assessed three textural metrics in 27 patients that underwent 3 PET/CT scans in the context of locally advanced rectal cancer treated by neoadjuvant chemotherapy. The coefficient of variation metric was highly correlated to histopathologic response and could predict the disease progression better than any conventional parameters (SUVmax, SUVmean, MTV, or TLG).
Finally, it is worth noting that a better understanding of biological basis of textural features is crucially needed. Multicenter studies must be also be conducted in the future to assess the robustness of textural metrics and associate textural analysis with genomics studies (82). Additionally, the association of textural features with conventional parameters may represent a good opportunity to better stratify patients and trend toward a personalized management of disease (72).
2.4. Parametric Imaging: Nuclear Medicine Specialist’s Best Friend?
The therapeutic response assessment with PET imaging is currently based on tumor uptake change by measuring only one value. This value may reflect the change of a small number of voxels (one voxel for SUVmax) within the tumor as discussed in Section 2.1, or the whole tumor using metrics mentioned in Sections 2.2 and 2.3. None of these approaches take into consideration the heterogeneity of change within the tumor on a voxel-per-voxel basis. These local changes may reflect a heterogeneous response of the tumor or the development of a necrotic area for example.
A method that takes benefit of significant intratumoral evolution was recently proposed by Necib et al. (83) using parametric imaging. This approach relies on the difference of SUV between two PET scans at a voxel level. The local changes are identified by a Gaussian mixture model. The authors applied this methodology to 78 pairs of tumor images acquired at baseline and follow-up for 28 patients with metastatic colorectal cancer. They found that their approach correlated well with RECIST and performed better than the European organization for research and treatment of cancer (EORTC) criteria when RECIST is considered as the gold standard. An example of images yielded by the parametric approach is illustrated in Figure 1. The parametric imaging approach can be extended to more than two PET exams using factor analysis. In this approach, each voxel evolution is modeled by a weighted sum of two or three basis functions representing respectively a stable, decreasing and/or increasing trend. This methodology is currently under investigation and is shown in Figure 2 for illustrative purposes.
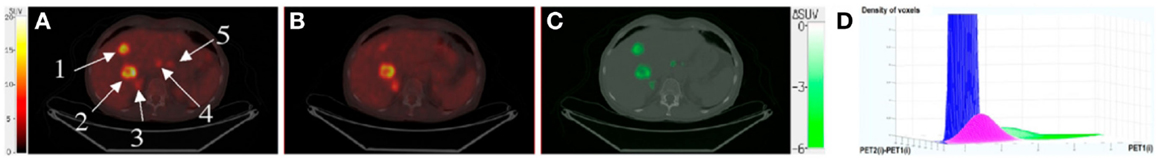
Figure 1. (A) PET1 showing five tumors, superimposed with CT1. (B) PET2 superimposed with CT2. (C) Parametric image (superimposed with CT1) showing only voxels with significant tumor changes between PET1 and PET2. These voxels are shown in green, meaning that SUV decreased between the two scans. For the two biggest tumors, the EORTC-based approach found a responding lesion (SUV decrease of 27% for tumor 1) and a stable lesion (SUV decrease of 10% for tumor 2). Parametric imaging found two responding lesions (ΔSUV = −5.9 and −2.6 for tumors 1 and 2, respectively), which were consistent with RECIST classification derived from late CT. (D) Biparametric graph fitted by the gaussian mixture model, for which three clusters can be distinguished: noise (blue), physiologic changes (pink), and tumor changes (green). This research was originally published in Journal of Nuclear Medicine. Necib et al. (83). ©by the Society of Nuclear Medicine and Molecular Imaging, Inc.
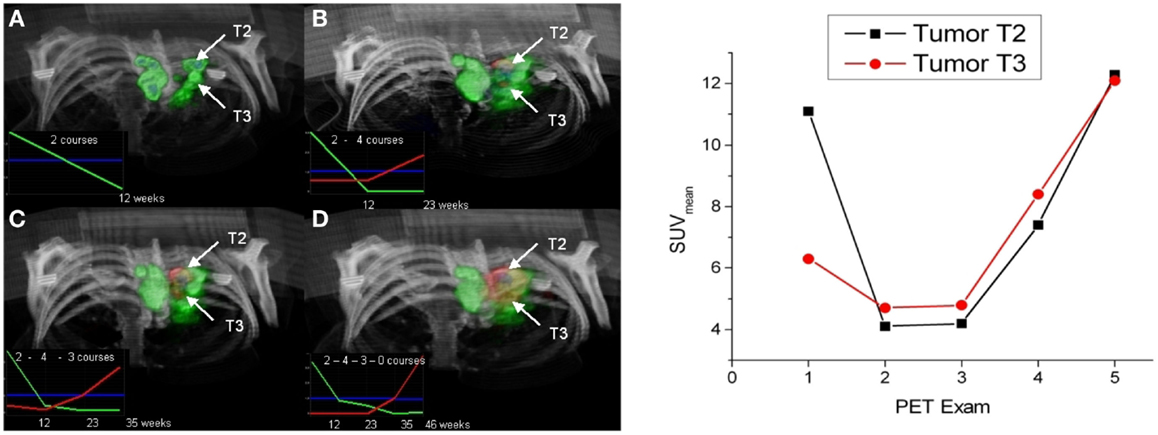
Figure 2. Left: 3D visualization of two tumors (T2 and T3) using parametric imaging with three basis functions: stable (blue), decreasing (green), and increasing (red) represented in the left corner of each image (the number of chemotherapy courses between each PET exam is mentioned). Parametric imaging using 2 (A), 3 (B), 4 (C), and 5 (D) exams. Right: SUVmean evolution (calculated within a ROI defined by 40% of SUVmax) for the two tumors. Note that the non-responding T2 tumor was detected with parametric imaging earlier (exam 2) than applying EORTC criteria that concluded to a stable disease between exam 2 and 3. Reprinted by permission of Necib (Ph.D Thesis).
Another approach proposed by David et al. (84) uses paradoxical theory. This approach models imprecision, uncertainty, and conflict between sources. It can be applied to two PET exams and was found to result in more consistency for partial responders than using conventional methodology that involved SUV or MTV change.
3. PET Scans for the Management of Lymphoma: An Almost Perfect World
The use of 18F-FDG PET for evaluation of HL and NHL has increased dramatically during the last decade both for staging and response assessment. Concerted efforts have been made to standardize practice and according to Cheson’s recommendations recently published (11), 18F-FDG PET should be realized at initial staging in all FDG-avid lymphoma histologies. Moreover, since the International Harmonization Project (IHP), which first published guidelines for the application of 18F-FDG PET in lymphoma in 2007 (85), international consensus recommendations for uniform PET interpretation criteria are regularly updated based on published PET literature (11, 86–88). In this scenario, the Lugano recommendations validated the use of the visual Deauville scale for response assessment in all histological FDG-avid types of lymphoma. Nevertheless, some data suggest that quantitative metrics could be used to improve visual analysis for response assessment in lymphoma and thus, metrics such as SUVmax have been fully integrated in recent standardized response criteria used in clinical trials.
In the 1990s, the first reports of semi quantitative measures in lymphoma staging demonstrated that the degree of uptake was largely dependent on the histology of lymphoma (89). In 2005, Schöder et al. showed that the different levels of 18F-FDG uptake between low-grade and aggressive lymphomas on metabolic imaging could be considered as a useful tool for assessing the transformation of a low-grade lymphoma to a more aggressive disease (90). Based on these conclusions, a prospective study was carried out to assess the value of 18F-FDG PET for guiding biopsies in patients with low-grade lymphoma and with clinical, radiological, or biological signs of aggressive transformation (91). This study confirmed that 18F-FDG PET can be used as an accurate guide for biopsies in suspected transformed tissues: a SUVmax < 11.7 was always associated with indolent lymphoma, whereas a SUVmax > 17 was always associated with histological transformation. Moreover, the 18F-FDG uptake gradient, observed on metabolic imaging recorded at initial DLBCL staging, could suggest transformation of unidentified low-grade lymphoma patients. Multiple authors have also studied the predictive prognostic value of early 18F-FDG on the outcomes of patients. If the Lugano recommendations validated the use of the visual Deauville scale for response assessment, some data suggested that quantitative metrics could also be used to improve visual analysis. The contribution offered by the development of SUVmax has been a great step forward and particularly investigated in DLBCL. Lin et al. were the first, in this histological subtype of lymphoma to measure the reduction of SUVmax in the “hottest” lesion before and during treatment, referred to as ΔSUVmax (92). This continuous variable may represent the dynamic process of tumor log-kill more accurately than a visual scale or a SUV cut-off value. As discussed above, SUV measurement is affected by numerous factors and therefore, it seems difficult to rely on one single SUV at a given time point to appreciate the therapeutic response and to predict outcome. Indeed, the measurement of an inter-scan SUV reduction performed under identical conditions within the same institution is probably a better and more reproducible approach. Despite the intrinsic limitations of SUV, when measured rigorously, it provides a reasonably reproducible measure of uptake that can be used to objectively assess changes related to the tumors only. This is confirmed by the published data which suggest that ΔSUVmax predicts outcome better than visual assessment in DLBCL in terms of progression-free survival and with better interobserver reproducibility (92–96). The optimal threshold to discriminate between good and poor treatment response groups varies between studies with cut-offs ranging from 66 to 91%, suggesting that consistency in scanning protocols and timing are mandatory for general application. Recently, the role of SUVmax reduction was also explored in HL with minimal residual uptake that was regarded as equivocal for the presence of disease. In a study by Rossi et al., ΔSUVmax was more accurate than visual analysis based on the Deauville criteria to predict outcomes of patients with HL (97), and was thought to be more particularly useful in patients with Deauville scores 3–4 in order to characterize the significance of the minimal residual uptake. Hasenclever et al. also described the use of semi-automatic quantification for interim 18FDG-PET response in HL (29). The authors methodology named qTEP extended Deauville scoring to a continuous scale by translating visual categories into thresholds. Yet, as seen before, the use of quantitative metrics rather than visual grading in HL is actually subject to controversy and requires further study. This could be explained by the difference in the cellular architecture and physiological features between HL and aggressive NHL. In HL, neoplastic cells account for <1% of the overall cellularity of the neoplastic tissue, whereas in NHL, they contribute more than 90% of the total cell population. In HL, non-neoplastic lymphocytes produce a cytokine network that ensures the immortalization of the neoplastic cells and works as an amplifier of the PET detection power. This non-neoplastic cellular compartment is switched-off very early by chemotherapy. On the other hand, in DLBCL, a progressive fraction of neoplastic cells are lysed by the chemotherapy, and the percentage of the cell destruction is predictive of the final response to the chemotherapy. For these reasons, a visual assessment seems preferable in HL, whereas a quantitative approach by SUVmax measurement seems more appropriate in DLBCL.
Because even SUVmax is, for a number of reasons described previously, not a reliable metric, other quantitative metrics have been proposed, including MTV or total TLG. In previous analyses, a variety of pre-therapy clinical markers were consistently associated with outcome in lymphoma patients. For example, in NHL, several patient characteristics were analyzed to determine whether they were associated with survival, and the factors that emerged as significant were, in addition to the Ann Arbor stage: age, elevated serum lactate dehydrogenase (LDH), performance status, and number of extranodal sites of disease. These were combined in the International Prognostic Index (IPI), a clinical tool developed by oncologists to aid in predicting the prognosis of patients with aggressive NHL (98). Some of these features reflect the tumor’s growth and invasive potential, to what is currently named tumor burden. Thus, from a clinical point of view, calculation of a global three-dimensional tumor burden with PET could be an important predictor of outcome in almost any type of lymphoma similar to disease bulk at initial presentation which has long been a known adverse prognostic factor, particularly in early stage HL (11). The prognostic value of tumor size using conventional imaging has previously been demonstrated and as functional imaging is more sensitive, it may be used to evaluate tumor burden more accurately. Several studies have evaluated baseline PET-based volume metrics but with very heterogeneous data caused by the lack of standardization on the calculation method. Song et al. evaluated the prognostic impact of MTV in stage II/III DLBCL without extranodal involvement (99), in primary gastrointestinal DLBCL (100), in extranodal T cell lymphoma (101) and in HL (102), using a fixed SUVmax threshold of 2.5. As seen previously, this methodology may overestimate the metabolic tumor volume especially when the background around the tumor has high activity leading to the inclusion of voxels from the background in the calculation. On the other hand, as discussed above, Kanoun et al. in HL (60), Sasanelli et al. in DLBCL (59), and Meignan et al. in both HL and DLBCL (103), all used a SUVmax threshold of 41%, as recommended in European guidelines. This threshold generally determines functional volumes accurately under specific imaging conditions of homogeneous activity “tumor-like” distribution with homogeneous background activity in phantom studies. In clinical practice, however, the lesions are often highly heterogeneous. When the lesion has low uptake, the volume can be overestimated if background activity is erroneously included. Moreover, in lesions with a very high SUVmax, there might be the risk that the 41% threshold would eliminate a fraction of the volume with high SUV but a lower SUV than the threshold. Thus, even if pre-treatment MTV and TLG seem to be negatively correlated with progression-free survival in both HL and NHL, as exposed previously, more sophisticated segmentation algorithms are clearly needed.
Because of its enhanced sensitivity, PET imaging now plays a pivotal role in the management of lymphomas. The impact of quantitative measurement in the management of patients with lymphomas is currently being defined. The methodological concerns related to quantitative metrics are well-identified and studied and could be in a near future of valuable interest and chiefly PET center independent. Recent data suggest that quantitative measures such as SUVmax and more particularly ΔSUVmax could be used to improve visual analysis for response assessment. These latter have been incorporated into recent uniformly adopted response criteria for clinical trials. Recent guidelines enacted to standardize PET protocols and to ensure more reproducible analyses between scans and centers will hopefully soon lead to the full integration of these quantitation tools into daily practice.
4. PET Scans for the Management of Solid Tumors: Toward a Perfect World
Over the past decade, there has been an expansive growth in the use of 18F-FDG for solid tumors as a tool for therapy assessment in oncology. This spread of the PET technique was particularly enabled by its quantification ability based on SUV to allow the use of a reproducible metric for cancer management.
One of the initial roles of SUV was in the differentiation between benign and malignant lesions. This was especially used in indeterminate solitary pulmonary nodules where the standard approach was that nodules with an SUVmax <2.5 could be considered benign with enough confidence to avoid an immediate biopsy; these nodules could safely be monitored with CT. For example, Lowe et al. studied 89 patients and found a sensitivity of 92% and a specificity of 90% with an SUV threshold of 2.5. With visual assessment, sensitivity was 98% and specificity was 69% (104). This method of thresholding with an absolute value was also applied to different tissues. Vansteenkiste et al. found that the optimum SUV threshold for identifying malignant lymph nodes in non-small cell lung cancer was 4.4 (105). In pancreatic carcinoma, Delbeke et al. found an SUV threshold of 3.0 to be appropriate (106). Yet, many data discarded the use of a SUV based “magic line,” above which the malignant character can be affirmed. First of all, as outlined previously, many variables affect the measurement of SUV, limiting its accuracy and reproducibility (20, 107). Moreover, using a predefined absolute SUV value may result in the exclusion of small positive lesions because of a low SUV due to partial volume effect. Additionally, some well-differentiated tumors have low intrinsic SUV, whereas some inflammatory processes may have SUV levels higher than 2.5. Undoubtedly, the use of an arbitrary value for malignancy may give an impression of objectivity over visual interpretation. But, in practice, selection of a threshold involves assessing the trade-off between sensitivity and specificity. It could certainly be argued that very high sensitivity is appropriate because the clinical consequences of a false-negative interpretation are much more serious than those of a false-positive result. In this regard, visual analysis has been reported to be equivalent (104).
In the early 1990s, quantitative measurement of early treatment-induced changes in SUV also became an attractive tool for monitoring response to therapy. The feasibility of detecting small changes in tumor glucose metabolism quantitatively was first demonstrated in studies of neoadjuvant treatment of primary breast cancer, for which declines in 18F-FDG uptake were seen with each successive treatment cycle in good responder patients (108). Soon after, the comparison of pre and post treatment SUV for monitoring the effects of therapy was demonstrated to be correlated with response to treatment for advanced breast cancer (109), liver metastases from colorectal cancer (110), for colorectal cancer (111), glioma (112), and head and neck cancer (113). Thereafter, the percentage of SUV decrease (ΔSUVmax) was recommended in 1999 by the EORTC position paper as a method to assess metabolic response of tumors with PET (114). Yet, given the limited data available at that time, the need for updated criteria and further standardization of PET response through quantitative parameters gradually increased. In this scenario, the PERCIST 1.0 criteria were drafted by Wahl et al. (12) as a framework that may be useful in daily practice and for harmonizing international studies. PERCIST can be considered as an attempt to validate quantitative and semi-quantitative approaches for metabolic treatment response assessment in which cancer responses assessed by PET is a continuous and time-dependent variable. The framework has the advantage of being easily applied, and with high reproducibility. Furthermore, it can be generalized to a wide variety of malignancies and situations and avoids the conceptual limitations associated with defining an optimal SUV threshold. PERCIST criteria include definitions of “lesion measurements at baseline,” “normalization of uptake,” “complete metabolic response,” “partial metabolic response,” “stable metabolic disease,” “progressive metabolic disease,” “overall response” and “duration of response” and pave the way toward an international consensus. Yet, in spite of these important efforts, currently only about 10 studies have used these criteria for response assessment in different types of solid tumors: colorectal (115–118), breast (119), esophageal (120), and lung (121–123) cancers. Some interesting considerations have arisen from these latter studies. In the three studies comparing EORTC and PERCIST criteria for response assessment (115, 119, 120), no significant difference was observed between both, but PERCIST criteria, because of clear definitions, was considered more straightforward to use. It is also important to point out that PERCIST definitions of response to therapy are based on the calculation of SUV normalized for the lean body mass. Unfortunately, SUVlbm values are not easily reproducible because there is yet no agreement on the way in which this index should be determined as nine different predictive equations exist for calculating lean body mass. For this reason, four of the studies used modified PERCIST criteria with SUVmax instead (116–118, 123). Moreover, as pointed out by Maffione (117), there are limitations in the complete metabolic response assessment. For the PERCIST 1.0 version, it should be done visually, with complete resolution of 18F-FDG uptake in the target lesion, less than the mean liver activity, and indistinguishable from surrounding blood pool activity. Yet, in rectal carcinoma for example, 18F-FDG uptake within the tumor site after neoadjuvant chemo-radiotherapy may be higher than the surrounding background blood-pool levels probably due to residual inflammation, or physiological tracer washout via the intestine (117). These considerations lead to the possibility that a single definition of residual disease after therapy may not be valid for every type of tumor. This issue led to the proposal of a new set of criteria to assess metabolic response in rectal cancer called PET residual disease in solid tumor (PREDIST) (124).
On the other hand, even if 18F-FDG PET imaging can substantially benefit from using quantitative measures of uptake, some authors discarded the tendency to analyze imaging data by trusting quantitative parameters and cut-offs. Soon after the publication of the PERCIST criteria, Hofman discussed the advantages of pattern recognition (125). The authors believe that the experienced observer can accurately assess whether a site of increased uptake is probably tumor from knowledge of anatomy and prior observations of the distribution of FDG in normal tissues.
As discussed above, other potential quantitative parameters have also been developed to evaluate patient prognosis and assess therapeutic response in solid tumors. Among these parameters, volume-based PET parameters such as MTV and TLG are especially promising by quantifying tumor burden. Van De Wiele (47) and Moon (126) presented the available data in patients suffering from squamous cell carcinoma of the head and neck, lung carcinoma, esophageal carcinoma, and gynecological malignancies. These reviews of the literature suggested that MTV and TLG have the potential to become valuable as prognostic biomarkers, adding value to clinical staging or for assessment of response to treatment. However, the authors also highlighted the main difficulty of these approaches. As already explained, the lack of robust segmentation techniques for delineating tumor volume makes it difficult to draw general guidelines. However, significant results were observed in the area of prognostic and treatment response assessment in cancer patients even if most reported studies have included heterogeneous groups of patients presenting different disease stages receiving different chemotherapy regimens and used different methods for tumor delineation. However, further large-scale prospective studies are needed in order to confirm the validity of these parameters.
If an approach for response assessment of solid tumors is finally adopted by an international consensus, one should not forget that the expert reader has the task of making the last judgment call for imaging interpretation. Regardless of which system is used, EORTC, PERCIST, or PREDIST criteria, or even if visual interpretation is used, without contradicting the need for standardization for harmonizing PET response in solid tumors and without understating the importance of the efforts already achieved, quantitation remains a key tool but is not a substitute for thinking. In daily practice, referring clinicians expect to find a conclusion in the PET report in terms of “complete metabolic response,” “partial metabolic response,” “stable metabolic disease,” “progressive metabolic disease” rather than a simple percentage of SUV decline or qualitative terms like “mild,” “moderate,” or “severe” uptake.
Conflict of Interest Statement
The authors declare that the research was conducted in the absence of any commercial or financial relationships that could be construed as a potential conflict of interest.
Acknowledgments
The authors wish to thank Dr. Thomas Eugène, Dr. Caroline Bodet-Milin, Dr. Hatem Necib, and Dr. Mathilde Colombié for their very useful comments. We also would like to acknowledge the meaningful contribution from Prof. Françoise Kraeber-Bodéré, Prof. Gérald Bonardel, and Dr. Irène Buvat for discussing the initial idea of this review. This work has been in part supported by a grant from the French National Agency for Research called “Investissements d’Avenir” no ANR-11-LABX-0018-01.
References
1. Juweid M, Cheson B. Positron-emission tomography and assessment of cancer therapy. N Engl J Med (2006) 354(5):496–507. doi: 10.1056/NEJMra050276
2. Allen-Auerbach M, Weber W. Measuring response with FDG-PET: methodological aspects. Oncologist (2009) 14(4):369–77. doi:10.1634/theoncologist.2008-0119
Pubmed Abstract | Pubmed Full Text | CrossRef Full Text | Google Scholar
3. Krause B, Schwarzenbock S, Souvatzoglou M. FDG PET and PET/CT. Recent Results Cancer Res (2013) 187:351–69. doi:10.1007/978-3-642-10853-2_12
4. Herrmann K, Benz M, Krause B, Pomykala K, Buck A, Czernin J. (18)F-FDG-PET/CT in evaluating response to therapy in solid tumors: where we are and where we can go. Q J Nucl Med Mol Imaging (2011) 55(6):620–32.
5. Hutchings M, Barrington S. PET/CT for therapy response assessment in lymphoma. J Nucl Med (2009) 50(Suppl 1):21S–30S. doi:10.2967/jnumed.108.057190
Pubmed Abstract | Pubmed Full Text | CrossRef Full Text | Google Scholar
6. Bai B, Bading J, Conti P. Tumor quantification in clinical positron emission tomography. Theranostics (2013) 3(10):787–801. doi:10.7150/thno.5629
Pubmed Abstract | Pubmed Full Text | CrossRef Full Text | Google Scholar
7. Tomasi G, Turkheimer F, Aboagye E. Importance of quantification for the analysis of PET data in oncology: review of current methods and trends for the future. Mol Imaging Biol (2012) 14(2):131–46. doi:10.1007/s11307-011-0514-2
Pubmed Abstract | Pubmed Full Text | CrossRef Full Text | Google Scholar
8. Boellaard R, O’Doherty M, Weber W, Mottaghy F, Lonsdale M, Stroobants S. FDG PET and PET/CT: EANM procedure guidelines for tumour PET imaging: version 1.0. Eur J Nucl Med Mol Imaging (2010) 37(1):181–200. doi:10.1007/s00259-009-1297-4
9. Boellaard R. Need for standardization of 18F-FDG PET/CT for treatment response assessments. J Nucl Med (2011) 52(Suppl 2):93S–100S. doi:10.2967/jnumed.110.085662
Pubmed Abstract | Pubmed Full Text | CrossRef Full Text | Google Scholar
10. Kraeber-Bodéré F, Barbet J. Challenges in nuclear medicine: innovative theranostic tools for personalized medicine. Front Med (2014) 1:16. doi:10.3389/fmed.2014.00016
Pubmed Abstract | Pubmed Full Text | CrossRef Full Text | Google Scholar
11. Cheson B, Fisher R, Barrington S, Cavalli F, Schwartz L, Zucca E, et al. Recommendations for initial evaluation, staging, and response assessment of Hodgkin and non-Hodgkin lymphoma: the Lugano classification. J Clin Oncol (2014) 32:3059–67. doi:10.1200/JCO.2013.54.8800
Pubmed Abstract | Pubmed Full Text | CrossRef Full Text | Google Scholar
12. Wahl R, Jacene H, Kasamon Y, Lodge M. From RECIST to PERCIST: evolving considerations for PET response criteria in solid tumors. J Nucl Med (2009) 50(Suppl 1):122S–50S. doi:10.2967/jnumed.108.057307
Pubmed Abstract | Pubmed Full Text | CrossRef Full Text | Google Scholar
13. Beyer T, Czernin J, Freudenberg L. Variations in clinical PET/CT operations: results of an international survey of active PET/CT users. J Nucl Med (2011) 52:303–10. doi:10.2967/jnumed.110.079624
Pubmed Abstract | Pubmed Full Text | CrossRef Full Text | Google Scholar
14. Kim C, Gupta N, Chandramouli B, Alavi A. Standardized uptake values of FDG: body surface area correction is preferable to body weight correction. J Nucl Med (1994) 35:164–7.
15. Tahari A, Chien D, Azadi J, Wahl R. Optimum lean body formulation for correction of standardized uptake value in PET imaging. J Nucl Med (2014) 55:1481–4. doi:10.2967/jnumed.113.136986
Pubmed Abstract | Pubmed Full Text | CrossRef Full Text | Google Scholar
16. Boellaard R, Krak N, Hoekstra O, Lammertsma A. Effects of noise, image resolution, and ROI definition on the accuracy of standard uptake values: a simulation study. J Nucl Med (2004) 45:1519–27.
17. Thie JA. Understanding the standardized uptake value, its methods, and implications for usage. J Nucl Med (2004) 45:1431–4.
18. Krak N, Boellaard R, Hoekstra O, Twisk J, Hoekstra C, Lammertsma A. Effects of ROI definition and reconstruction method on quantitative outcome and applicability in a response monitoring trial. Eur J Nucl Med Mol Imaging (2005) 32:294–301. doi:10.1007/s00259-005-1926-5
Pubmed Abstract | Pubmed Full Text | CrossRef Full Text | Google Scholar
19. Kinahan P, Fletcher J. Positron emission tomography-computed tomography standardized uptake values in clinical practice and assessing response to therapy. Semin Ultrasound CT MR (2010) 31:496–505. doi:10.1053/j.sult.2010.10.001
Pubmed Abstract | Pubmed Full Text | CrossRef Full Text | Google Scholar
20. Adams M, Turkington T, Wilson J, Wong T. A systematic review of the factors affecting accuracy of SUV measurements. AJR Am J Roentgenol (2010) 195:310–20. doi:10.2214/AJR.10.4923
Pubmed Abstract | Pubmed Full Text | CrossRef Full Text | Google Scholar
21. Soret M, Bacharach S, Buvat I. Partial-volume effect in PET tumor imaging. J Nucl Med (2007) 48:932–45. doi:10.2967/jnumed.106.035774
22. Erlandsson K, Buvat I, Pretorius P, Thomas B, Hutton B. A review of partial volume correction techniques for emission tomography and their applications in neurology, cardiology and oncology. Phys Med Biol (2012) 57:R119–59. doi:10.1088/0031-9155/57/21/R119
Pubmed Abstract | Pubmed Full Text | CrossRef Full Text | Google Scholar
23. Nahmias C, Wahl L. Reproducibility of standardized uptake value measurements determined by 18F-FDG PET in malignant tumors. J Nucl Med (2008) 49:1804–8. doi:10.2967/jnumed.108.054239
Pubmed Abstract | Pubmed Full Text | CrossRef Full Text | Google Scholar
24. de Langen A, Vincent A, Velasquez L, van Tinteren H, Boellaard R, Shankar L. Repeatability of 18F-FDG uptake measurements in tumors: a metaanalysis. J Nucl Med (2012) 53:701–8. doi:10.2967/jnumed.111.095299
Pubmed Abstract | Pubmed Full Text | CrossRef Full Text | Google Scholar
25. Lodge M, Chaudhry M, Wahl R. Noise considerations for PET quantification using maximum and peak standardized uptake value. J Nucl Med (2012) 53:1041–7. doi:10.2967/jnumed.111.101733
Pubmed Abstract | Pubmed Full Text | CrossRef Full Text | Google Scholar
26. Bal H, Guerin L, Casey M, Conti M, Eriksson L, Michel C, et al. Improving PET spatial resolution and detectability for prostate cancer imaging. Phys Med Biol (2014) 59:4411–26. doi:10.1088/0031-9155/59/15/4411
Pubmed Abstract | Pubmed Full Text | CrossRef Full Text | Google Scholar
27. Vanderhoek M, Perlman S, Jeraj R. Impact of the definition of peak standardized uptake value on quantification of treatment response. J Nucl Med (2012) 53:4–11. doi:10.2967/jnumed.111.093443
Pubmed Abstract | Pubmed Full Text | CrossRef Full Text | Google Scholar
28. Boktor R, Walker G, Stacey R, Gledhill S, Pitman A. Reference range for intrapatient variability in blood-pool and liver SUV for 18F-FDG PET. J Nucl Med (2013) 54:677–82. doi:10.2967/jnumed.112.108530
Pubmed Abstract | Pubmed Full Text | CrossRef Full Text | Google Scholar
29. Hasenclever D, Kurch L, Mauz-Korholz C, Elsner A, Georgi T, Wallace H, et al. qPET – a quantitative extension of the Deauville scale to assess response in interim FDG-PET scans in lymphoma. Eur J Nucl Med Mol Imaging (2014) 41:1301–8. doi:10.1007/s00259-014-2715-9
Pubmed Abstract | Pubmed Full Text | CrossRef Full Text | Google Scholar
30. Larson S, Erdi Y, Akhurst T, Mazumdar M, Macapinlac H, Finn R, et al. Tumor treatment response based on visual and quantitative changes in global tumor glycolysis using PET-FDG imaging. The visual response score and the change in total lesion glycolysis. Clin Positron Imaging (1999) 2:159–71. doi:10.1016/S1095-0397(99)00016-3
Pubmed Abstract | Pubmed Full Text | CrossRef Full Text | Google Scholar
31. Zaidi H, El Naqa I. PET-guided delineation of radiation therapy treatment volumes: a survey of image segmentation techniques. Eur J Nucl Med Mol Imaging (2010) 37:2165–87. doi:10.1007/s00259-010-1423-3
Pubmed Abstract | Pubmed Full Text | CrossRef Full Text | Google Scholar
32. Schaefer A, Kremp S, Hellwig D, Rube C, Kirsch C, Nestle U. A contrast-oriented algorithm for FDG-PET-based delineation of tumour volumes for the radiotherapy of lung cancer: derivation from phantom measurements and validation in patient data. Eur J Nucl Med Mol Imaging (2008) 35:1989–99. doi:10.1007/s00259-008-0875-1
Pubmed Abstract | Pubmed Full Text | CrossRef Full Text | Google Scholar
33. Vauclin S, Doyeux K, Hapdey S, Edet-Sanson A, Vera P, Gardin I. Development of a generic thresholding algorithm for the delineation of 18FDG-PET-positive tissue: application to the comparison of three thresholding models. Phys Med Biol (2009) 54:6901–16. doi:10.1088/0031-9155/54/22/010
Pubmed Abstract | Pubmed Full Text | CrossRef Full Text | Google Scholar
34. Reutter B, Klein G, Huesman R. Automated 3-d segmentation of respiratory-gated pet transmission images. IEEE Trans Nucl Sci (1997) 44:2473–6. doi:10.1109/23.656454
35. Riddell C, Brigger P, Carson R, Bacharach S. The watershed algorithm: a method to segment noisy pet transmission images. IEEE Trans Nucl Sci (1999) 46:713–9. doi:10.1109/23.775604
36. Geets X, Lee J, Bol A, Lonneux M, Gregoire V. A gradient-based method for segmenting FDG-PET images: methodology and validation. Eur J Nucl Med Mol Imaging (2007) 34:1427–38. doi:10.1007/s00259-006-0363-4
Pubmed Abstract | Pubmed Full Text | CrossRef Full Text | Google Scholar
37. Belhassen S, Zaidi H. A novel fuzzy C-means algorithm for unsupervised heterogeneous tumor quantification in PET. Med Phys (2010) 37:1309–24. doi:10.1118/1.3301610
Pubmed Abstract | Pubmed Full Text | CrossRef Full Text | Google Scholar
38. Hatt M, Cheze le Rest C, Turzo A, Roux C, Visvikis D. A fuzzy locally adaptive Bayesian segmentation approach for volume determination in PET. IEEE Trans Med Imaging (2009) 28:881–93. doi:10.1109/TMI.2008.2012036
Pubmed Abstract | Pubmed Full Text | CrossRef Full Text | Google Scholar
39. Tylski P, Stute S, Grotus N, Doyeux K, Hapdey S, Gardin I, et al. Comparative assessment of methods for estimating tumor volume and standardized uptake value in (18)F-FDG PET. J Nucl Med (2010) 51:268–76. doi:10.2967/jnumed.109.066241
Pubmed Abstract | Pubmed Full Text | CrossRef Full Text | Google Scholar
40. Cheebsumon P, Yaqub M, van Velden F, Hoekstra O, Lammertsma A, Boellaard R. Impact of [18F]FDG PET imaging parameters on automatic tumour delineation: need for improved tumour delineation methodology. Eur J Nucl Med Mol Imaging (2011) 38:2136–44. doi:10.1007/s00259-011-1899-5
Pubmed Abstract | Pubmed Full Text | CrossRef Full Text | Google Scholar
41. Hatt M, Cheze Le Rest C, Albarghach N, Pradier O, Visvikis D. PET functional volume delineation: a robustness and repeatability study. Eur J Nucl Med Mol Imaging (2011) 38:663–72. doi:10.1007/s00259-010-1688-6
Pubmed Abstract | Pubmed Full Text | CrossRef Full Text | Google Scholar
42. Prieto E, Lecumberri P, Pagola M, Gomez M, Bilbao I, Ecay M, et al. Twelve automated thresholding methods for segmentation of PET images: a phantom study. Phys Med Biol (2012) 57:3963–80. doi:10.1088/0031-9155/57/12/3963
Pubmed Abstract | Pubmed Full Text | CrossRef Full Text | Google Scholar
43. Frings V, de Langen A, Smit E, van Velden F, Hoekstra O, van Tinteren H, et al. Repeatability of metabolically active volume measurements with 18F-FDG and 18F-FLT PET in non-small cell lung cancer. J Nucl Med (2010) 51:1870–7. doi:10.2967/jnumed.110.077255
Pubmed Abstract | Pubmed Full Text | CrossRef Full Text | Google Scholar
44. Hatt M, Cheze-Le Rest C, Aboagye E, Kenny L, Rosso L, Turkheimer F, et al. Reproducibility of 18F-FDG and 3’-deoxy-3’-18F-fluorothymidine PET tumor volume measurements. J Nucl Med (2010) 51:1368–76. doi:10.2967/jnumed.110.078501
Pubmed Abstract | Pubmed Full Text | CrossRef Full Text | Google Scholar
45. Cheebsumon P, van Velden F, Yaqub M, Frings V, de Langen A, Hoekstra O, et al. Effects of image characteristics on performance of tumor delineation methods: a test-retest assessment. J Nucl Med (2011) 52:1550–8. doi:10.2967/jnumed.111.088914
Pubmed Abstract | Pubmed Full Text | CrossRef Full Text | Google Scholar
46. Heijmen L, de Geus-Oei L, de Wilt J, Visvikis D, Hatt M, Visser E, et al. Reproducibility of functional volume and activity concentration in 18F-FDG PET/CT of liver metastases in colorectal cancer. Eur J Nucl Med Mol Imaging (2012) 39:1858–67. doi:10.1007/s00259-012-2233-6
Pubmed Abstract | Pubmed Full Text | CrossRef Full Text | Google Scholar
47. Van de Wiele C, Kruse V, Smeets P, Sathekge M, Maes A. Predictive and prognostic value of metabolic tumour volume and total lesion glycolysis in solid tumours. Eur J Nucl Med Mol Imaging (2013) 40:290–301. doi:10.1007/s00259-012-2280-z
Pubmed Abstract | Pubmed Full Text | CrossRef Full Text | Google Scholar
48. Pak K, Cheon G, Nam H, Kim S, Kang K, Chung J, et al. Prognostic value of metabolic tumor volume and total lesion glycolysis in head and neck cancer: a systematic review and meta-analysis. J Nucl Med (2014) 55:884–90. doi:10.2967/jnumed.113.133801
Pubmed Abstract | Pubmed Full Text | CrossRef Full Text | Google Scholar
49. Ryu I, Kim J, Roh J, Lee J, Cho K, Choi S, et al. Prognostic value of preoperative metabolic tumor volume and total lesion glycolysis measured by 18F-FDG PET/CT in salivary gland carcinomas. J Nucl Med (2013) 54:1032–8. doi:10.2967/jnumed.112.116053
Pubmed Abstract | Pubmed Full Text | CrossRef Full Text | Google Scholar
50. Lee J, Kang C, Choi H, Lee W, Song S, Lee J, et al. Prognostic value of metabolic tumor volume and total lesion glycolysis on preoperative 18F-FDG PET/CT in patients with pancreatic cancer. J Nucl Med (2014) 55:898–904. doi:10.2967/jnumed.113.131847
Pubmed Abstract | Pubmed Full Text | CrossRef Full Text | Google Scholar
51. Lee J, Cho A, Lee J, Yun M, Lee J, Kim Y, et al. The role of metabolic tumor volume and total lesion glycolysis on (18)F-FDG PET/CT in the prognosis of epithelial ovarian cancer. Eur J Nucl Med Mol Imaging (2014) 41:1898–906. doi:10.1007/s00259-014-2803-x
Pubmed Abstract | Pubmed Full Text | CrossRef Full Text | Google Scholar
52. Hatt M, Cheze-le Rest C, van Baardwijk A, Lambin P, Pradier O, Visvikis D. Impact of tumor size and tracer uptake heterogeneity in (18)F-FDG PET and CT non-small cell lung cancer tumor delineation. J Nucl Med (2011) 52:1690–7. doi:10.2967/jnumed.111.092767
Pubmed Abstract | Pubmed Full Text | CrossRef Full Text | Google Scholar
53. Zaidi H, Abdoli M, Fuentes C, El Naqa I. Comparative methods for PET image segmentation in pharyngolaryngeal squamous cell carcinoma. Eur J Nucl Med Mol Imaging (2012) 39:881–91. doi:10.1007/s00259-011-2053-0
Pubmed Abstract | Pubmed Full Text | CrossRef Full Text | Google Scholar
54. Schaefer A, Kim Y, Kremp S, Mai S, Fleckenstein J, Bohnenberger H, et al. PET-based delineation of tumour volumes in lung cancer: comparison with pathological findings. Eur J Nucl Med Mol Imaging (2013) 40:1233–44. doi:10.1007/s00259-013-2407-x
Pubmed Abstract | Pubmed Full Text | CrossRef Full Text | Google Scholar
55. Meignan M. Baseline metabolic tumour volume in Hodgkin lymphoma: the prognostic value of accessory cells. Eur J Nucl Med Mol Imaging (2014) 41:1732–4. doi:10.1007/s00259-014-2815-6
56. Basu S, Zaidi H, Salavati A, Hess S, Carlsen P, Alavi A. FDG PET/CT methodology for evaluation of treatment response in lymphoma: from “graded visual analysis” and ßemiquantitative SUVmax” to global disease burden assessment. Eur J Nucl Med Mol Imaging (2014) 41:2158–60. doi:10.1007/s00259-014-2826-3
57. Berkowitz A, Basu S, Srinivas S, Sankaran S, Schuster S, Alavi A. Determination of whole-body metabolic burden as a quantitative measure of disease activity in lymphoma: a novel approach with fluorodeoxyglucose-PET. Nucl Med Commun (2008) 29:521–6. doi:10.1097/MNM.0b013e3282f813a4
Pubmed Abstract | Pubmed Full Text | CrossRef Full Text | Google Scholar
58. Fonti R, Larobina M, Del Vecchio S, De Luca S, Fabbricini R, Catalano L, et al. Metabolic tumor volume assessed by 18F-FDG PET/CT for the prediction of outcome in patients with multiple myeloma. J Nucl Med (2012) 53:1829–35. doi:10.2967/jnumed.112.106500
Pubmed Abstract | Pubmed Full Text | CrossRef Full Text | Google Scholar
59. Sasanelli M, Meignan M, Haioun C, Berriolo-Riedinger A, Casasnovas R, Biggi A, et al. Pretherapy metabolic tumour volume is an independent predictor of outcome in patients with diffuse large B-cell lymphoma. Eur J Nucl Med Mol Imaging (2014) 41:2017–22. doi:10.1007/s00259-014-2822-7
Pubmed Abstract | Pubmed Full Text | CrossRef Full Text | Google Scholar
60. Kanoun S, Rossi C, Berriolo-Riedinger A, Dygai-Cochet I, Cochet A, Humbert O. Baseline metabolic tumour volume is an independent prognostic factor in Hodgkin lymphoma. Eur J Nucl Med Mol Imaging (2014) 41(9):1735–43. doi:10.1007/s00259-014-2783-x
Pubmed Abstract | Pubmed Full Text | CrossRef Full Text | Google Scholar
61. Kim T, Paeng J, Chun I, Keam B, Jeon Y, Lee S, et al. Total lesion glycolysis in positron emission tomography is a better predictor of outcome than the international prognostic index for patients with diffuse large B cell lymphoma. Cancer (2013) 119:1195–202. doi:10.1002/cncr.27855
Pubmed Abstract | Pubmed Full Text | CrossRef Full Text | Google Scholar
62. Visvikis D, Hatt M, Tixier F, Cheze Le Rest C. The age of reason for FDG PET image-derived indices. Eur J Nucl Med Mol Imaging (2012) 39:1670–2. doi:10.1007/s00259-012-2239-0
63. Haralick R, Shanmugam K, Dinstein I. Textural features for image classification. IEEE Trans Syst Man Cybern (1973) SMC-3:610–21. doi:10.1109/TSMC.1973.4309314
64. Brooks F. On some misconceptions about tumor heterogeneity quantification. Eur J Nucl Med Mol Imaging (2013) 40:1292–4. doi:10.1007/s00259-013-2430-y
65. Cheng N, Fang Y, Yen T. The promise and limits of PET texture analysis. Ann Nucl Med (2013) 27:867–9. doi:10.1007/s12149-013-0759-8
Pubmed Abstract | Pubmed Full Text | CrossRef Full Text | Google Scholar
66. Davnall F, Yip C, Ljungqvist G, Selmi M, Ng F, Sanghera B, et al. Assessment of tumor heterogeneity: an emerging imaging tool for clinical practice? Insights Imaging (2012) 3(6):573–89. doi:10.1007/s13244-012-0196-6
Pubmed Abstract | Pubmed Full Text | CrossRef Full Text | Google Scholar
67. Chicklore S, Goh V, Siddique M, Roy A, Marsden P, Cook G. Quantifying tumour heterogeneity in 18F-FDG PET/CT imaging by texture analysis. Eur J Nucl Med Mol Imaging (2013) 40:133–40. doi:10.1007/s00259-012-2247-0
Pubmed Abstract | Pubmed Full Text | CrossRef Full Text | Google Scholar
68. Galavis P, Hollensen C, Jallow N, Paliwal B, Jeraj R. Variability of textural features in FDG PET images due to different acquisition modes and reconstruction parameters. Acta Oncol (2010) 49:1012–6. doi:10.3109/0284186X.2010.498437
Pubmed Abstract | Pubmed Full Text | CrossRef Full Text | Google Scholar
69. Tixier F, Hatt M, Le Rest C, Le Pogam A, Corcos L, Visvikis D. Reproducibility of tumor uptake heterogeneity characterization through textural feature analysis in 18F-FDG PET. J Nucl Med (2012) 53:693–700. doi:10.2967/jnumed.111.099127
Pubmed Abstract | Pubmed Full Text | CrossRef Full Text | Google Scholar
70. Hatt M, Tixier F, Cheze Le Rest C, Pradier O, Visvikis D. Robustness of intratumour 18F-FDG PET uptake heterogeneity quantification for therapy response prediction in oesophageal carcinoma. Eur J Nucl Med Mol Imaging (2013) 40:1662–71. doi:10.1007/s00259-013-2486-8
Pubmed Abstract | Pubmed Full Text | CrossRef Full Text | Google Scholar
71. Orlhac F, Soussan M, Maisonobe J, Garcia C, Vanderlinden B, Buvat I. Tumor texture analysis in 18F-FDG PET: relationships between texture parameters, histogram indices, standardized uptake values, metabolic volumes, and total lesion glycolysis. J Nucl Med (2014) 55:414–22. doi:10.2967/jnumed.113.129858
Pubmed Abstract | Pubmed Full Text | CrossRef Full Text | Google Scholar
72. Tixier F, Hatt M, Valla C, Fleury V, Lamour C, Ezzouhri S, et al. Visual versus quantitative assessment of intratumor 18F-FDG PET uptake heterogeneity: prognostic value in non-small cell lung cancer. J Nucl Med (2014) 55:1235–41. doi:10.2967/jnumed.113.133389
Pubmed Abstract | Pubmed Full Text | CrossRef Full Text | Google Scholar
73. Brooks F, Grigsby P. The effect of small tumor volumes on studies of intratumoral heterogeneity of tracer uptake. J Nucl Med (2014) 55:37–42. doi:10.2967/jnumed.112.116715
Pubmed Abstract | Pubmed Full Text | CrossRef Full Text | Google Scholar
74. El Naqa I, Grigsby P, Apte A, Kidd E, Donnelly E, Khullar D, et al. Exploring feature-based approaches in PET images for predicting cancer treatment outcomes. Pattern Recognit (2009) 42:1162–71. doi:10.1016/j.patcog.2008.08.011
Pubmed Abstract | Pubmed Full Text | CrossRef Full Text | Google Scholar
75. Bagci U, Yao J, Miller-Jaster K, Chen X, Mollura D. Predicting future morphological changes of lesions from radiotracer uptake in 18F-FDG-PET images. PLoS One (2013) 8:e57105. doi:10.1371/journal.pone.0057105
Pubmed Abstract | Pubmed Full Text | CrossRef Full Text | Google Scholar
76. Dong X, Xing L, Wu P, Fu Z, Wan H, Li D, et al. Three-dimensional positron emission tomography image texture analysis of esophageal squamous cell carcinoma: relationship between tumor 18F-fluorodeoxyglucose uptake heterogeneity, maximum standardized uptake value, and tumor stage. Nucl Med Commun (2013) 34:40–6. doi:10.1097/MNM.0b013e32835ae50c
Pubmed Abstract | Pubmed Full Text | CrossRef Full Text | Google Scholar
77. Tixier F, Le Rest C, Hatt M, Albarghach N, Pradier O, Metges J, et al. Intratumor heterogeneity characterized by textural features on baseline 18F-FDG PET images predicts response to concomitant radiochemotherapy in esophageal cancer. J Nucl Med (2011) 52:369–78. doi:10.2967/jnumed.110.082404
Pubmed Abstract | Pubmed Full Text | CrossRef Full Text | Google Scholar
78. Cheng N, Fang Y, Chang J, Huang C, Tsan D, Ng S, et al. Textural features of pretreatment 18F-FDG PET/CT images: prognostic significance in patients with advanced T-stage oropharyngeal squamous cell carcinoma. J Nucl Med (2013) 54:1703–9. doi:10.2967/jnumed.112.119289
Pubmed Abstract | Pubmed Full Text | CrossRef Full Text | Google Scholar
79. Cook G, Yip C, Siddique M, Goh V, Chicklore S, Roy A, et al. Are pretreatment 18F-FDG PET tumor textural features in non-small cell lung cancer associated with response and survival after chemoradiotherapy? J Nucl Med (2013) 54:19–26. doi:10.2967/jnumed.112.107375
Pubmed Abstract | Pubmed Full Text | CrossRef Full Text | Google Scholar
80. Yang F, Thomas M, Dehdashti F, Grigsby P. Temporal analysis of intratumoral metabolic heterogeneity characterized by textural features in cervical cancer. Eur J Nucl Med Mol Imaging (2013) 40:716–27. doi:10.1007/s00259-012-2332-4
Pubmed Abstract | Pubmed Full Text | CrossRef Full Text | Google Scholar
81. Bundschuh R, Dinges J, Neumann L, Seyfried M, Zsoter N, Papp L, et al. Textural parameters of tumor heterogeneity in 18F-FDG PET/CT for therapy response assessment and prognosis in patients with locally advanced rectal cancer. J Nucl Med (2014) 55:891–7. doi:10.2967/jnumed.113.127340
Pubmed Abstract | Pubmed Full Text | CrossRef Full Text | Google Scholar
82. Lambin P, Rios-Velazquez E, Leijenaar R, Carvalho S, van Stiphout R, Granton P, et al. Radiomics: extracting more information from medical images using advanced feature analysis. Eur J Cancer (2012) 48:441–6. doi:10.1016/j.ejca.2011.11.036
Pubmed Abstract | Pubmed Full Text | CrossRef Full Text | Google Scholar
83. Necib H, Garcia C, Wagner A, Vanderlinden B, Emonts P, Hendlisz A, et al. Detection and characterization of tumor changes in 18F-FDG PET patient monitoring using parametric imaging. J Nucl Med (2011) 52:354–61. doi:10.2967/jnumed.110.080150
Pubmed Abstract | Pubmed Full Text | CrossRef Full Text | Google Scholar
84. David S, Visvikis D, Quellec G, Le Rest C, Fernandez P, Allard M, et al. Image change detection using paradoxical theory for patient follow-up quantitation and therapy assessment. IEEE Trans Med Imaging (2012) 31:1743–53. doi:10.1109/TMI.2012.2199511
Pubmed Abstract | Pubmed Full Text | CrossRef Full Text | Google Scholar
85. Juweid M, Stroobants S, Hoekstra O, Mottaghy F, Dietlein M, Guermazi A, et al. Use of positron emission tomography for response assessment of lymphoma: consensus of the imaging subcommittee of international harmonization project in lymphoma. J Clin Oncol (2007) 25:571–8. doi:10.1200/JCO.2006.08.2305
Pubmed Abstract | Pubmed Full Text | CrossRef Full Text | Google Scholar
86. Meignan M, Gallamini A, Haioun C, Polliack A. Report on the second international workshop on interim positron emission tomography in lymphoma held in Menton, France, 8-9 April 2010. Leuk Lymphoma (2010) 51:2171–80. doi:10.3109/10428194.2010.529208
Pubmed Abstract | Pubmed Full Text | CrossRef Full Text | Google Scholar
87. Meignan M, Gallamini A, Itti E, Barrington S, Haioun C, Polliack A. Report on the third international workshop on interim positron emission tomography in lymphoma held in Menton, France, 26-27 September 2011 and Menton 2011 consensus. Leuk Lymphoma (2012) 53:1876–81. doi:10.3109/10428194.2012.677535
Pubmed Abstract | Pubmed Full Text | CrossRef Full Text | Google Scholar
88. Barrington S, Mikhaeel N, Kostakoglu L, Meignan M, Hutchings M, Meller S, et al. Role of imaging in the staging and response assessment of lymphoma: consensus of the international conference on malignant lymphomas imaging working group. J Clin Oncol (2014) 32:3048–58. doi:10.1200/JCO.2013.53.5229
Pubmed Abstract | Pubmed Full Text | CrossRef Full Text | Google Scholar
89. Okada J, Oonishi H, Yoshikawa K, Itami J, Uno K, Imaseki K, et al. FDG-PET for predicting the prognosis of malignant lymphoma. Ann Nucl Med (1994) 8:187–91. doi:10.1007/BF03164996
Pubmed Abstract | Pubmed Full Text | CrossRef Full Text | Google Scholar
90. Schöder H, Noy A, Gonen M, Weng L, Green D, Erdi Y, et al. Intensity of 18fluorodeoxyglucose uptake in positron emission tomography distinguishes between indolent and aggressive non-Hodgkin’s lymphoma. J Clin Oncol (2005) 23:4643–51. doi:10.1200/JCO.2005.12.072
Pubmed Abstract | Pubmed Full Text | CrossRef Full Text | Google Scholar
91. Bodet-Milin C, Kraeber-Bodéré F, Moreau P, Campion L, Dupas B, Le Gouill S. Investigation of FDG-PET/CT imaging to guide biopsies in the detection of histological transformation of indolent lymphoma. Haematologica (2008) 93:471–2. doi:10.3324/haematol.12013
Pubmed Abstract | Pubmed Full Text | CrossRef Full Text | Google Scholar
92. Lin C, Itti E, Haioun C, Petegnief Y, Luciani A, Dupuis J, et al. Early 18F-FDG PET for prediction of prognosis in patients with diffuse large B-cell lymphoma: SUV-based assessment versus visual analysis. J Nucl Med (2007) 48:1626–32. doi:10.2967/jnumed.107.042093
Pubmed Abstract | Pubmed Full Text | CrossRef Full Text | Google Scholar
93. Itti E, Lin C, Dupuis J, Paone G, Capacchione D, Rahmouni A, et al. Prognostic value of interim 18F-FDG PET in patients with diffuse large B-Cell lymphoma: SUV-based assessment at 4 cycles of chemotherapy. J Nucl Med (2009) 50:527–33. doi:10.2967/jnumed.108.057703
Pubmed Abstract | Pubmed Full Text | CrossRef Full Text | Google Scholar
94. Casasnovas R, Meignan M, Berriolo-Riedinger A, Bardet S, Julian A, Thieblemont C, et al. SUVmax reduction improves early prognosis value of interim positron emission tomography scans in diffuse large B-cell lymphoma. Blood (2011) 118:37–43. doi:10.1182/blood-2010-12-327767
Pubmed Abstract | Pubmed Full Text | CrossRef Full Text | Google Scholar
95. Itti E, Meignan M, Berriolo-Riedinger A, Biggi A, Cashen A, Vera P, et al. An international confirmatory study of the prognostic value of early PET/CT in diffuse large B-cell lymphoma: comparison between Deauville criteria and SUVmax. Eur J Nucl Med Mol Imaging (2013) 40:1312–20. doi:10.1007/s00259-013-2435-6
Pubmed Abstract | Pubmed Full Text | CrossRef Full Text | Google Scholar
96. Fuertes S, Setoain X, Lopez-Guillermo A, Carrasco J, Rodriguez S, Rovira J, et al. Interim FDG PET/CT as a prognostic factor in diffuse large B-cell lymphoma. Eur J Nucl Med Mol Imaging (2013) 40:496–504. doi:10.1007/s00259-012-2320-8
Pubmed Abstract | Pubmed Full Text | CrossRef Full Text | Google Scholar
97. Rossi C, Kanoun S, Berriolo-Riedinger A, Dygai-Cochet I, Humbert O, Legouge C, et al. Interim 18F-FDG PET SUVmax reduction is superior to visual analysis in predicting outcome early in Hodgkin lymphoma patients. J Nucl Med (2014) 55:569–73. doi:10.2967/jnumed.113.130609
Pubmed Abstract | Pubmed Full Text | CrossRef Full Text | Google Scholar
98. The International Non-Hodgkin’s Lymphoma Prognostic Factors Project. A predictive model for aggressive non-Hodgkin’s lymphoma. N Engl J Med (1993) 329:987–94. doi:10.1056/NEJM199309303291402
Pubmed Abstract | Pubmed Full Text | CrossRef Full Text | Google Scholar
99. Song M, Chung J, Shin H, Lee S, Lee S, Lee H, et al. Clinical significance of metabolic tumor volume by PET/CT in stages II and III of diffuse large B cell lymphoma without extranodal site involvement. Ann Hematol (2012) 91:697–703. doi:10.1007/s00277-011-1357-2
Pubmed Abstract | Pubmed Full Text | CrossRef Full Text | Google Scholar
100. Song M, Chung J, Shin H, Moon J, Lee J, Lee H, et al. Prognostic value of metabolic tumor volume on PET/CT in primary gastrointestinal diffuse large B cell lymphoma. Cancer Sci (2012) 103:477–82. doi:10.1111/j.1349-7006.2011.02164.x
Pubmed Abstract | Pubmed Full Text | CrossRef Full Text | Google Scholar
101. Song M, Chung J, Shin H, Moon J, Ahn J, Lee H, et al. Clinical value of metabolic tumor volume by PET/CT in extranodal natural killer/T cell lymphoma. Leuk Res (2013) 37:58–63. doi:10.1016/j.leukres.2012.09.011
Pubmed Abstract | Pubmed Full Text | CrossRef Full Text | Google Scholar
102. Song M, Chung J, Lee J, Jeong S, Lee S, Hong J, et al. Metabolic tumor volume by positron emission tomography/computed tomography as a clinical parameter to determine therapeutic modality for early stage Hodgkin’s lymphoma. Cancer Sci (2013) 104:1656–61. doi:10.1111/cas.12282
Pubmed Abstract | Pubmed Full Text | CrossRef Full Text | Google Scholar
103. Meignan M, Sasanelli M, Casasnovas R, Luminari S, Fioroni F, Coriani C, et al. Metabolic tumour volumes measured at staging in lymphoma: methodological evaluation on phantom experiments and patients. Eur J Nucl Med Mol Imaging (2014) 41:1113–22. doi:10.1007/s00259-014-2705-y
Pubmed Abstract | Pubmed Full Text | CrossRef Full Text | Google Scholar
104. Lowe V, Fletcher J, Gobar L, Lawson M, Kirchner P, Valk P, et al. Prospective investigation of positron emission tomography in lung nodules. J Clin Oncol (1998) 16:1075–84.
105. Vansteenkiste J, Stroobants S, De Leyn P, Dupont P, Bogaert J, Maes A, et al. Lymph node staging in non-small-cell lung cancer with FDG-PET scan: a prospective study on 690 lymph node stations from 68 patients. J Clin Oncol (1998) 16:2142–9.
106. Delbeke D, Rose D, Chapman W, Pinson C, Wright J, Beauchamp R, et al. Optimal interpretation of FDG PET in the diagnosis, staging and management of pancreatic carcinoma. J Nucl Med (1999) 40:1784–91.
107. Boellaard R. Standards for PET image acquisition and quantitative data analysis. J Nucl Med (2009) 50(Suppl 1):11S–20S. doi:10.2967/jnumed.108.057182
Pubmed Abstract | Pubmed Full Text | CrossRef Full Text | Google Scholar
108. Wahl R, Zasadny K, Helvie M, Hutchins G, Weber B, Cody R. Metabolic monitoring of breast cancer chemohormonotherapy using positron emission tomography: initial evaluation. J Clin Oncol (1993) 11:2101–11.
109. Jansson T, Westlin J, Ahlstrom H, Lilja A, Långstrm B, Bergh J. Positron emission tomography studies in patients with locally advanced and/or metastatic breast cancer: a method for early therapy evaluation? J Clin Oncol (1995) 13:1470–7.
110. Findlay M, Young H, Cunningham D, Iveson A, Cronin B, Hickish T, et al. Noninvasive monitoring of tumor metabolism using fluorodeoxyglucose and positron emission tomography in colorectal cancer liver metastases: correlation with tumor response to fluorouracil. J Clin Oncol (1996) 14:700–8.
111. Haberkorn U, Strauss L, Dimitrakopoulou A, Engenhart R, Oberdorfer F, Ostertag H, et al. PET studies of fluorodeoxyglucose metabolism in patients with recurrent colorectal tumors receiving radiotherapy. J Nucl Med (1991) 32:1485–90.
112. Rozental J, Levine R, Nickles R, Dobkin J. Glucose uptake by gliomas after treatment. A positron emission tomographic study. Arch Neurol (1989) 46:1302–7. doi:10.1001/archneur.1989.00520480044018
Pubmed Abstract | Pubmed Full Text | CrossRef Full Text | Google Scholar
113. Minn H, Paul R, Ahonen A. Evaluation of treatment response to radiotherapy in head and neck cancer with fluorine-18 fluorodeoxyglucose. J Nucl Med (1988) 29:1521–5.
114. Young H, Baum R, Cremerius U, Herholz K, Hoekstra O, Lammertsma A, et al. Measurement of clinical and subclinical tumour response using [18F]-fluorodeoxyglucose and positron emission tomography: review and 1999 EORTC recommendations. European organization for research and treatment of cancer (EORTC) PET study group. Eur J Cancer (1999) 35:1773–82. doi:10.1016/S0959-8049(99)00229-4
115. Skougaard K, Nielsen D, Jensen B, Hendel H. Comparison of EORTC criteria and PERCIST for PET/CT response evaluation of patients with metastatic colorectal cancer treated with irinotecan and cetuximab. J Nucl Med (2013) 54:1026–31. doi:10.2967/jnumed.112.111757
Pubmed Abstract | Pubmed Full Text | CrossRef Full Text | Google Scholar
116. Engels B, Everaert H, Gevaert T, Duchateau M, Neyns B, Sermeus A, et al. Phase II study of helical tomotherapy for oligometastatic colorectal cancer. Ann Oncol (2011) 22:362–8. doi:10.1093/annonc/mdq385
Pubmed Abstract | Pubmed Full Text | CrossRef Full Text | Google Scholar
117. Maffione A, Ferretti A, Grassetto G, Bellan E, Capirci C, Chondrogiannis S, et al. Fifteen different 18F-FDG PET/CT qualitative and quantitative parameters investigated as pathological response predictors of locally advanced rectal cancer treated by neoadjuvant chemoradiation therapy. Eur J Nucl Med Mol Imaging (2013) 40:853–64. doi:10.1007/s00259-013-2357-3
Pubmed Abstract | Pubmed Full Text | CrossRef Full Text | Google Scholar
118. Fendler W, Philippe Tiega D, Ilhan H, Paprottka P, Heinemann V, Jakobs T, et al. Validation of several SUV-based parameters derived from 18F-FDG PET for prediction of survival after SIRT of hepatic metastases from colorectal cancer. J Nucl Med (2013) 54:1202–8. doi:10.2967/jnumed.112.116426
Pubmed Abstract | Pubmed Full Text | CrossRef Full Text | Google Scholar
119. Tateishi U, Miyake M, Nagaoka T, Terauchi T, Kubota K, Kinoshita T, et al. Neoadjuvant chemotherapy in breast cancer: prediction of pathologic response with PET/CT and dynamic contrast-enhanced MR imaging – prospective assessment. Radiology (2012) 263:53–63. doi:10.1148/radiol.12111177
Pubmed Abstract | Pubmed Full Text | CrossRef Full Text | Google Scholar
120. Yanagawa M, Tatsumi M, Miyata H, Morii E, Tomiyama N, Watabe T, et al. Evaluation of response to neoadjuvant chemotherapy for esophageal cancer: PET response criteria in solid tumors versus response evaluation criteria in solid tumors. J Nucl Med (2012) 53:872–80. doi:10.2967/jnumed.111.098699
Pubmed Abstract | Pubmed Full Text | CrossRef Full Text | Google Scholar
121. Ziai D, Wagner T, El Badaoui A, Hitzel A, Woillard J, Melloni B, et al. Therapy response evaluation with FDG-PET/CT in small cell lung cancer: a prognostic and comparison study of the PERCIST and EORTC criteria. Cancer Imaging (2013) 13:73–80. doi:10.1102/1470-7330.2013.0008
Pubmed Abstract | Pubmed Full Text | CrossRef Full Text | Google Scholar
122. Ding Q, Cheng X, Yang L, Zhang Q, Chen J, Li T, et al. PET/CT evaluation of response to chemotherapy in non-small cell lung cancer: PET response criteria in solid tumors (PERCIST) versus response evaluation criteria in solid tumors (RECIST). J Thorac Dis (2014) 6:677–83. doi:10.3978/j.issn.2072-1439.2014.05.10
Pubmed Abstract | Pubmed Full Text | CrossRef Full Text | Google Scholar
123. Tauhardt E, Reissig A, Winkens T, Freesmeyer M. Early detection of disease progression after palliative chemotherapy in NSCLC patients by 18F-FDG-PET. Nuklearmedizin (2014) 53:197–204. doi:10.3413/Nukmed-0644-14-01
Pubmed Abstract | Pubmed Full Text | CrossRef Full Text | Google Scholar
124. Maffione A, Ferretti A, Chondrogiannis S, Rampin L, Marzola M, Grassetto G, et al. Proposal of a new 18F-FDG PET/CT predictor of response in rectal cancer treated by neoadjuvant chemoradiation therapy and comparison with PERCIST criteria. Clin Nucl Med (2013) 38:795–7. doi:10.1097/RLU.0b013e3182a20153
Pubmed Abstract | Pubmed Full Text | CrossRef Full Text | Google Scholar
125. Hofman M, Hicks R. Restaging: should we percist without pattern recognition? J Nucl Med (2010) 51:1830–2. doi:10.2967/jnumed.110.079293
Keywords: nuclear medicine, PET, follow-up, oncology, quantification
Citation: Carlier T and Bailly C (2015) State-of-the-art and recent advances in quantification for therapeutic follow-up in oncology using PET. Front. Med. 2:18. doi: 10.3389/fmed.2015.00018
Received: 09 November 2014; Accepted: 09 March 2015;
Published online: 23 March 2015.
Edited by:
Florent Cachin, Université d’Auvergne, FranceReviewed by:
Zhen Cheng, Stanford University, USABaljinder Singh, Postgraduate Institute of Medical Education and Research, India
Copyright: © 2015 Carlier and Bailly. This is an open-access article distributed under the terms of the Creative Commons Attribution License (CC BY). The use, distribution or reproduction in other forums is permitted, provided the original author(s) or licensor are credited and that the original publication in this journal is cited, in accordance with accepted academic practice. No use, distribution or reproduction is permitted which does not comply with these terms.
*Correspondence: Thomas Carlier, Nuclear Medicine Department, University Hospital, Place Alexis Ricordeau, Nantes 44093, France e-mail: thomas.carlier@chu-nantes.fr