
- Department of Biochemistry and Molecular Biology, The Pennsylvania State University, University Park, PA, USA
The genome of the unicellular, euryhaline cyanobacterium Synechococcus sp. PCC 7002 encodes about 3200 proteins. Transcripts were detected for nearly all annotated open reading frames by a global transcriptomic analysis by Next-Generation (SOLiD™) sequencing of cDNA. In the cDNA samples sequenced, ∼90% of the mapped sequences were derived from the 16S and 23S ribosomal RNAs and ∼10% of the sequences were derived from mRNAs. In cells grown photoautotrophically under standard conditions [38°C, 1% (v/v) CO2 in air, 250 μmol photons m−2 s−1], the highest transcript levels (up to 2% of the total mRNA for the most abundantly transcribed genes; e.g., cpcAB, psbA, psaA) were generally derived from genes encoding structural components of the photosynthetic apparatus. High-light exposure for 1 h caused changes in transcript levels for genes encoding proteins of the photosynthetic apparatus, Type-1 NADH dehydrogenase complex and ATP synthase, whereas dark incubation for 1 h resulted in a global decrease in transcript levels for photosynthesis-related genes and an increase in transcript levels for genes involved in carbohydrate degradation. Transcript levels for pyruvate kinase and the pyruvate dehydrogenase complex decreased sharply in cells incubated in the dark. Under dark anoxic (fermentative) conditions, transcript changes indicated a global decrease in transcripts for respiratory proteins and suggested that cells employ an alternative phosphoenolpyruvate degradation pathway via phosphoenolpyruvate synthase (ppsA) and the pyruvate:ferredoxin oxidoreductase (nifJ). Finally, the data suggested that an apparent operon involved in tetrapyrrole biosynthesis and fatty acid desaturation, acsF2–ho2–hemN2–desF, may be regulated by oxygen concentration.
Introduction
Synechococcus sp. strain PCC 7002 (hereafter Synechococcus 7002) is a euryhaline, unicellular cyanobacterium, which tolerates extremely high-light intensities and grows over a wide range of NaCl concentrations (Batterton Jr. and van Baalen, 1971; Sakamoto and Bryant, 2002; Nomura et al., 2006b). It has the fastest reported doubling time for any cyanobacterium: ∼2.6 h when grown on urea or ammonia and ∼4.0 h when grown on nitrate under optimal conditions [38°C, 1% (v/v) CO2 in air at a saturating light intensity of ∼250 μmol photons m−2 s−1]. The organism is easily transformable genetically (Stevens and Porter, 1980), the complete genome sequence is available (see http://www.ncbi.nlm.nih.gov/), and a versatile system for genetic complementation and gene overexpression is available (Xu et al., 2011). Collectively, these traits make Synechococcus 7002 a robust and promising platform for biotechnological applications, including the production of biofuels.
Using energy provided by sunlight, cyanobacteria produce the reducing equivalents required for CO2 reduction and cellular metabolism from the oxidation of water molecules via two photosystems, denoted photosystem II (PS II) and photosystem I (PS I; Bryant, 1994). The resulting reducing equivalents are mostly used for CO2 fixation and subsequent generation of carbohydrates and other metabolite building blocks, from which other cellular constituents are made. In addition to reducing equivalents, the photosynthetic apparatus generates a proton gradient across the thylakoid membrane, which is used for ATP synthesis. Because light is not continuously available, all phototrophic organisms must switch to another metabolic mode at night to produce the maintenance energy to support basic cell functions. Cyanobacteria have a complete respiratory electron transport chain that allows respiration with oxygen as terminal electron acceptor (Peschek et al., 2004; Bernroitner et al., 2008). However, in many natural environments, oxygen is rapidly consumed in the dark by cyanobacteria or other organisms (Stal, 1995; Steunou et al., 2008), and thus the local environmental conditions may quickly become anoxic. Under these conditions, most cyanobacteria can perform fermentation of stored carbohydrates to produce maintenance energy (Stal and Moezelaar, 1997; McNeely et al., 2010a,b). Thus, cyanobacteria must rapidly adjust to diurnal light availability, changing light intensities, and the availability of inorganic nutrients (N, P, S, Fe, etc.). A consequence of these fluctuating conditions is that cells experience rapid changes in cellular redox states due to changing photosynthetic and respiratory electron transfer processes, as well as oxygen levels, over the course of a day.
In order to maintain cellular levels of reducing equivalents generated by the photosystems within acceptable boundaries, cyanobacteria adjust their cellular contents of PS I, PS II, and light-harvesting phycobilisomes to maximize both ATP and NADPH production (Fujita et al., 1994). However, the availability of CO2, which is the major sink for the electrons produced, is an equally important factor. Thus, it is critical that cells balance reductant generation and CO2 fixation rates to avoid over-reduction of electron carriers, which can lead to the production of reactive oxygen and nitrogen species that can cause potentially lethal photooxidative damage to cells. Such adjustments can be performed at many different stages of gene expression, including mRNA synthesis (transcription); protein biosynthesis (translation); protein maturation, assembly, and stability; post-translational modification and allostery.
Because the complete genome of Synechococcus 7002 is available and the complete set of its predicted genes is known, gene expression in this cyanobacterium can be studied at different levels. This study focused on the transcriptional level and was performed to characterize the expression of all predicted mRNA-encoding open reading frames (ORFs) of Synechococcus 7002 cells grown under selected physiological states. Several methods are available to obtain information about transcript levels. Microarrays have been extensively used to study global gene expression patterns in several cyanobacteria, including Synechocystis sp. PCC 6803, Nostoc sp. PCC 7120, Nostoc punctiforme, Synechococcus sp. PCC 7942, and Synechococcus sp. WH8102 (Hihara et al., 2001, 2003; Gill et al., 2002; Ehira et al., 2003; Postier et al., 2003; Singh et al., 2003; Sato et al., 2004; Kucho et al., 2005; Campbell et al., 2007, 2008; Foster et al., 2007; Nodop et al., 2008; Summerfield et al., 2008; Stuart et al., 2009; Tetu et al., 2009; Ostrowski et al., 2010; Rowland et al., 2010). However, microarrays suffer from a number of problems, including their relatively low sensitivity, accuracy, specificity, and reproducibility (see Draghici et al., 2006 for a review). Quantitative-RT-PCR allows a high degree of specificity and accuracy, but this method is not suitable for global analyses of transcription. Because Next-Generation (Next-Gen) sequencing can provide very large numbers of randomly distributed cDNA sequences over an entire cDNA sample (Cloonan et al., 2008), cDNA sequencing was employed to obtain global transcription information for Synechococcus 7002. In the studies described here, the global transcriptome of Synechococcus 7002 cells that had been grown under a well-defined, standard photolithoautotrophic conditions was determined. Additionally, the transcriptomes of cells that had been subjected to selected perturbations, including exposure to high-light intensity or darkness under oxic respiratory or anoxic fermentative conditions were compared to that of cells grown under standard conditions. Finally, the transcriptome of Synechococcus 7002 cells grown photolithoautotrophically under micro-oxic conditions was determined. The resulting datasets were compared to provide some initial insights into the patterns of gene expression that might be responsible for some of the physiological properties exhibited by Synechococcus 7002.
Materials and Methods
Sample Preparation
Synechococcus 7002 was grown in 20-mm culture tubes containing medium A (25 mL) supplemented with 1 mg of NaNO3 mL−1 as nitrogen source (designated as medium A+; Stevens and Porter, 1980). Medium A is a Tris-buffered (pH 8.2) medium containing 0.3 M NaCl and 20 mM magnesium-sulfate; the exact composition of medium A is 18 g L−1 NaCl, 0.6 g L−1 KCl, 1.0 g L−1 NaNO3, 5.0 g L−1 MgSO4·7H2O, 50 mg L−1 KH2PO4, 266 mg L−1 CaCl2, 30 mg L−1 Na2 EDTA·2H2O, 3.89 mg L−1 FeCl3·6H2O, 1 g L−1 Tris/HCl (pH 8.2), 1 mL L−1 P1 trace metal solution, 4 μg L−1 vitamin B12. P1 trace metal solution (1000×) contains the following substances: 34.26 g L−1 H3BO3, 4.32 g L−1 MnCl2·4H2O, 0.315 g L−1 ZnCl2, 0.03 g L−1 MoO3 (85%), 0.003 g L−1 CuSO4·5H2O, 0.01215 g L−1 CoCl2·6H2O. Unless otherwise specified, cultures were grown at 38°C with continuous illumination at 250 μmol photons m−2 s−1 and were sparged with 1% (v/v) CO2 in air (these optimal growth conditions are here defined as “standard conditions”). Pre-cultures were grown under these “standard conditions” under continuous illumination. Cultures for RNA analyses were inoculated at an OD730 nm between 0.05 and 0.1; and cells were subsequently grown under these conditions to OD730 nm = 0.7 (see Figure 1). For high-light-intensity treatment or for incubation in darkness, cells were grown to OD730 nm = 0.7 under the specified standard conditions and immediately prior to harvest were illuminated at ∼900 μmol photons m−2 s−1 or incubated in the dark for 1 h. For the latter treatment, cells were incubated in the dark while sparging with 1% (v/v) CO2 in N2 for 1 h. Photolithoautotrophic growth under micro-oxic conditions was performed by growing cells in the light while sparging with 1% (v/v) CO2 in N2 under otherwise standard conditions. To identify transcription changes during the growth of a batch culture, cells were harvested at OD730 nm = 0.4, 0.7, 1.0, 3.0, and 5.0 (see Figure 1). Cells were rapidly chilled and centrifuged (5 min, 5000 × g, 4°C), and the cell pellets were quickly frozen in liquid nitrogen and stored at −80°C until required for further processing.
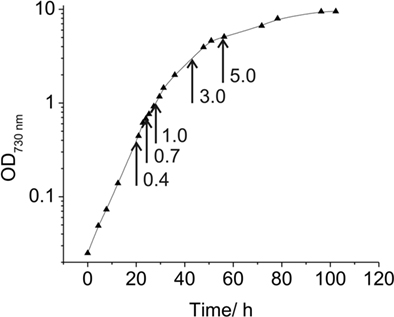
Figure 1. Growth curve for Synechococcus 7002. Growth curve under “standard” conditions in medium A+ indicating the OD730 nm values at which samples for transcription analyses were taken (arrows).
RNA Extraction
Frozen cells from 20 to 30 mL culture were resuspended in 10 mM Tris–HCl, pH 8.0 (400 μL) and lysozyme (40 μL of a 50-mg/mL stock) was added. The sample (220 μL, each) was dispensed into two 1.5-mL reaction tubes and incubated for 2 min at room temperature. For protein denaturation and cell lysis, acidic phenol–chloroform solution [400 μL; 1:1 (v/v), pH 4.3] and BugBuster Protein Extraction Reagent (400 μL; Novagen) were added to each reaction tube, and the samples were vortexed two times for 1 min and stored on ice between treatments. The samples were centrifuged (2 min, 10,000 × g, 22°C), the aqueous phase was extracted once more with phenol–chloroform solution, and the combined extracts were finally extracted once with chloroform–isoamyl alcohol (24:1, v/v). The RNA was precipitated from the aqueous phase by adding one tenth volume of 3.0 M sodium acetate, pH 5.2 and 2.5 volumes of ethanol, and the precipitated RNA was washed twice with 70% (v/v) ethanol. After the resulting pellet was air-dried, the RNA was further processed using the High Pure RNA Isolation Kit (Roche) according to the recommendations of the manufacturer. Briefly, the RNA pellet was resuspended in DNase incubation buffer (460 μL), and RNasin RNase inhibitor (4 μL, Promega) and DNase I (60 μL) were added to the samples, which were incubated for 1 h at 22°C. The RNA was purified by size exclusion on the provided spin-columns, which also removed small RNAs (approximately <300 bp). When rRNA depletion was performed, the RNA was dissolved in TE buffer (10 mM Tris–HCl, pH 8.0, 1 mM EDTA) or twice-distilled H2O when it was used directly for cDNA library synthesis. Depletion of rRNA was performed using MICROBExpress Bacterial mRNA Purification Kit (Ambion) with cyanobacteria-specific capture oligonucleotides. RNA concentrations were determined using a NanoDrop ND-1000 Spectrophotometer (Thermo Scientific); a Qubit System (Invitrogen) was also used to determine RNA and DNA concentrations separately.
cDNA Library Construction and Solid™ Sequencing
Construction of cDNA libraries and SOLiD™ sequencing was performed in the Genomics Core Facility at The Pennsylvania State University (University Park, PA, USA). The cDNA libraries were constructed from 0.5 μg RNA sample using SOLiD™ Whole Transcriptome Analysis Kit (Applied Biosystems) and were barcoded by using the SOLiD™ Transcriptome Multiplexing Kit (Applied Biosystems). SOLiD™ ePCR Kit and SOLiD™ Bead Enrichment Kit (both Applied Biosystems) were used for processing the samples for sequencing, and either the SOLiD™ 3 or 3Plus protocol (Applied Biosystems) was used for sequencing.
The cDNA sequence data have been submitted to the NCBI Sequence Read Archive (SRA) under accession number SRP004049.
Data Analyses
The sequencer datasets were first converted into fastq format using the PERL script supplied with the BWA software package (Li and Durbin, 2009). The resulting fastq sequences were mapped in colorspace against the Synechococcus 7002 genome using the Burrows–Wheeler algorithm, allowing four mismatches (>90% sequence identity). Prior to further analyses, the sequences mapping to rRNA-coding regions (the major portion of all datasets) and non-uniquely mapping reads were removed from the output files generated by BWA. All protein-coding regions were analyzed for cDNA sequences mapping entirely within or partially covering the respective ORF (by at least one nucleotide), and the resulting hits for each ORF were counted. The relative transcript abundances for all ORFs were calculated as the number of sequences mapping in a given ORF divided by the total number of sequences mapping within any protein-coding region. To monitor differences in transcript level between two conditions, the relative transcript abundances under the two conditions were compared for all ORFs. The ratio is given as the relative transcript abundance under condition 2 divided by the relative transcript abundance under condition 1. For the “standard” growth conditions defined above, cDNA sequence data for three independent biological replicates were obtained. Based on these three “standard” datasets the mean and standard deviation for the relative transcript abundance was calculated for each ORF. When “standard” conditions served as the basis for a comparison, the probability for equal transcription was calculated for each ORF using the z-test (Ott and Longnecker, 2000). When conditions were compared, for which only single datasets were available, the chi-square test was applied to determine the probability level for equal transcription for each ORF (Monaghan et al., 2009).
To compare the mRNA levels for different genes within one sample, the number of aligned sequences for a given ORF was normalized by the length of the ORF, and the results are reported as aligned sequences (“hits”) per kilobase. For comparisons of the same gene but in different samples, the number of aligned sequences was normalized relative to the total number of mRNA counts, because the gene length is constant but the total number of mRNA counts was variable and was also dependent upon the sequencing depth.
Results and Discussion
Analyzing the Transcriptome of Synechococcus 7002 by Solid™ Sequencing of cDNA
Under the experimental design and conditions defined as “standard” (see Materials and Methods), cultures of Synechococcus 7002 grow exponentially up to an optical density at 730 nm (OD730 nm) of ∼0.7 (see Figure 1; and Sakamoto and Bryant, 1998). Growth slows at higher OD730 nm values because of light limitation imposed by self-shading. Thus, cultures were harvested at OD730 nm = 0.7 to produce the maximal yield of cells in exponential phase. RNA was extracted as described and used for cDNA sequencing. Depending on how many samples were pooled and barcoded for one sequencing run, and the version of the sequencing chemistry employed (SOLiD™ 3 or 3Plus), between ∼7 and 30 million mapped sequence reads were obtained with SOLiD™ sequencing (Table 1). In the absence of any depletion of rRNA, 89.9–94% of the sequences mapped to the 16S and 23S rRNAs. Because of the presence of some small, multigene families (e.g., psbA, psbD) that have similar sequences, the percentage of uniquely mapped sequences ranged from 94.9 to 98.3%. However, cDNA sequencing allows unique mapping even if only one base is different, and transcription differences can therefore be detected even for very similar genes. This is not possible when using microarrays, at least not with such a high accuracy, because that method is based on hybridization (Hihara et al., 2001).
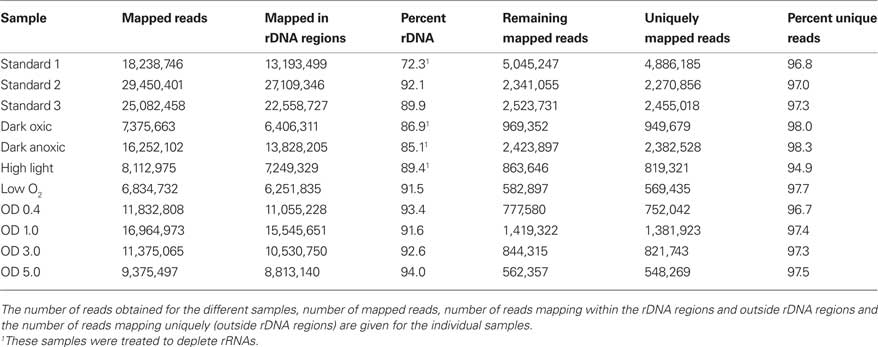
Table 1. Number of sequences obtained by SOLiD™ sequencing for the samples analyzed in this study.
In some early experiments, RNA samples were processed in attempts to remove some of the rRNA sequences (see Materials and Methods for details). In one sample from cells grown under standard conditions, rRNA was depleted to a level about 20% lower than the average value for untreated samples (Table 1), but on average, the depletion resulted in a much smaller reduction in rRNA, generally only ∼5%. Because the depletion protocol employed was relatively ineffective, rRNA depletion was not employed prior to cDNA synthesis for most samples.
In the “standard 1” sample, which had the highest number of non-rRNA sequences, transcripts were detected for nearly all of the 3235 predicted ORFs in the Synechococcus 7002 genome. Table 2 presents the 15 genes that had the highest number of mapped cDNA sequences in cells grown under standard conditions. As expected, most of these genes encoded structural components of the phycobilisomes and the two photosystems. For example, cpcA (SYNPCC7002_A2210), encoding the alpha subunit of phycocyanin (de Lorimier et al., 1984), accounted for 2.2% of the mapped cDNA sequences and psbA (SYNPCC7002_A1418) accounted for 2.0% of the mapped cDNA sequences. Due to the very high number of total sequences provided by SOLiD™ sequencing, transcripts could be detected even for genes transcribed at very low levels; there were only a 12 ORFs (SYNPCC7002_A2187, A2712, A2746, SYNPCC7002_D0029, D0030, SYNPCC7002_F0015, F0016, SYNPCC7002_G0039, G0040, G0050, G0051, and G0052) with no mapped cDNA sequences under standard growth conditions; for two of those (SYNPCC7002_A2187 and A2746) transcripts were found under at least one of the other conditions tested here, but at very low level (one or two mapped sequences only). These ORFs are either annotated as hypothetical proteins or integrases and resolvases, which suggests that they might be wrongly annotated or do not represent functional genes. The transcript levels for all genes and all conditions described in this study are provided in the Table S1 in Supplementary Material.
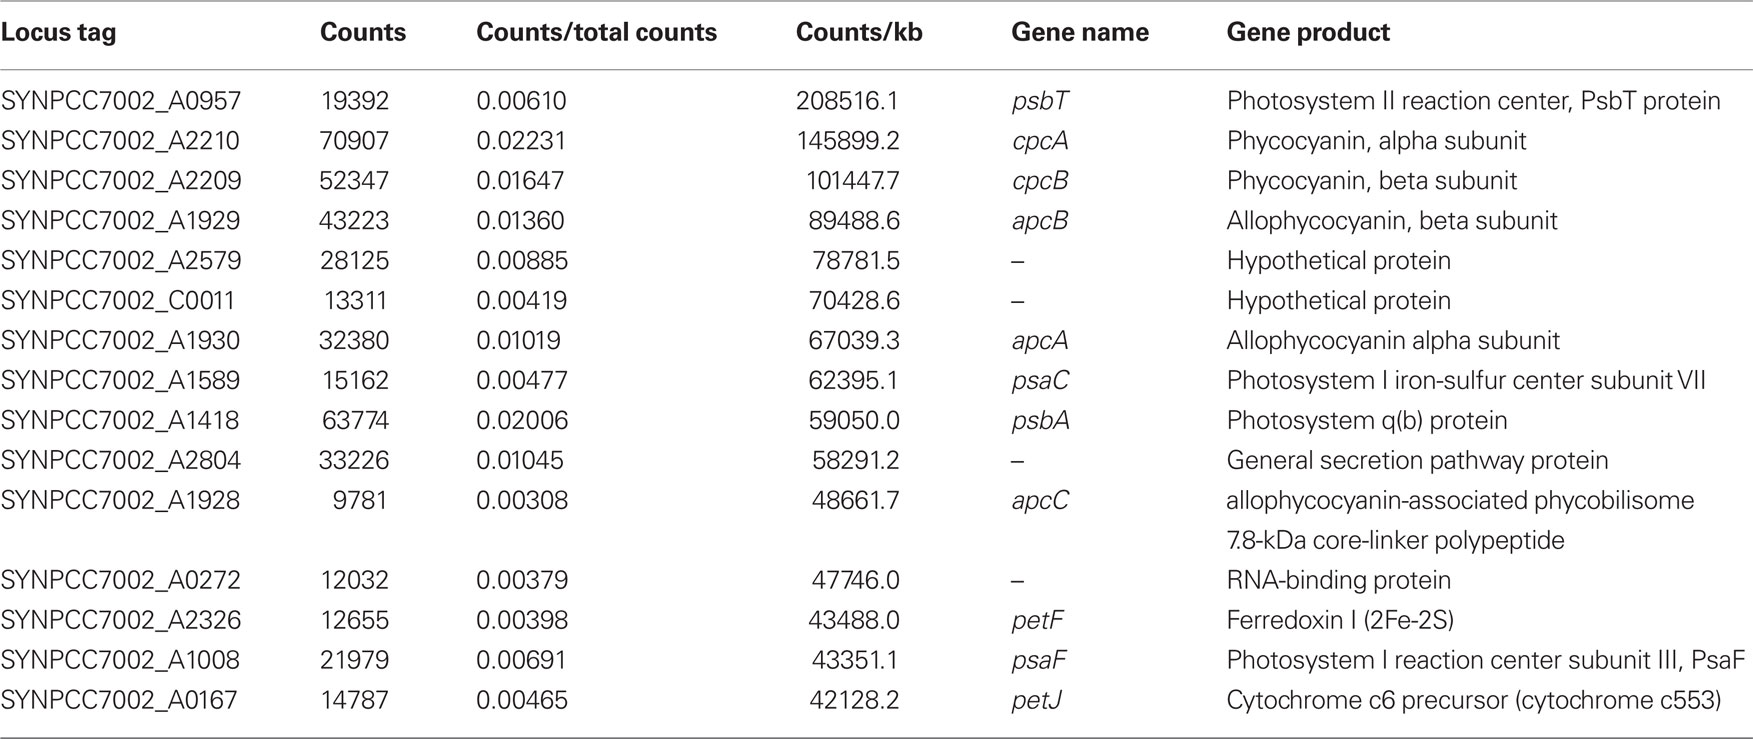
Table 2. The 15 most abundant mRNA species in the “standard 1” sample.
Some cDNA samples were also analyzed by pyrosequencing (data not shown). Although similar results were obtained for the most abundant transcripts, because of the much smaller number of sequences obtained and the much greater cost per sequence, pyrosequencing was not pursued further because it was not a cost-effective method for global transcription profiling.
To assess the reproducibility of the cDNA sequencing approach, RNA samples isolated from three independent cultures grown under “standard conditions” were independently converted to cDNA and subjected to SOLiD™ sequencing. Two of these samples were processed without rRNA depletion, while as described above, one sample (standard 1) was treated to deplete the rRNA sequences in the sample. Figure 2A shows a scatter plot comparing the transcript abundances calculated for the two non-depleted samples (standard 2 and standard 3). The majority of the data points occurred on a line with a slope of ∼1.0, which indicated that the mapped sequence values for each gene obtained from the independent samples were very similar. Very few data points fell outside the lines indicating a two-fold difference (Figure 2A), and most of those points are associated with genes that are transcribed at low levels, for which stochastic processes would produce the largest variation. These data suggested that, much like microarrays, differences reflecting greater than two-fold changes can be considered to be significant. Moreover, much smaller differences (∼25%) might be statistically significant for highly transcribed genes (note that p-values are reported for all comparisons in Table S2 in Supplementary Material).
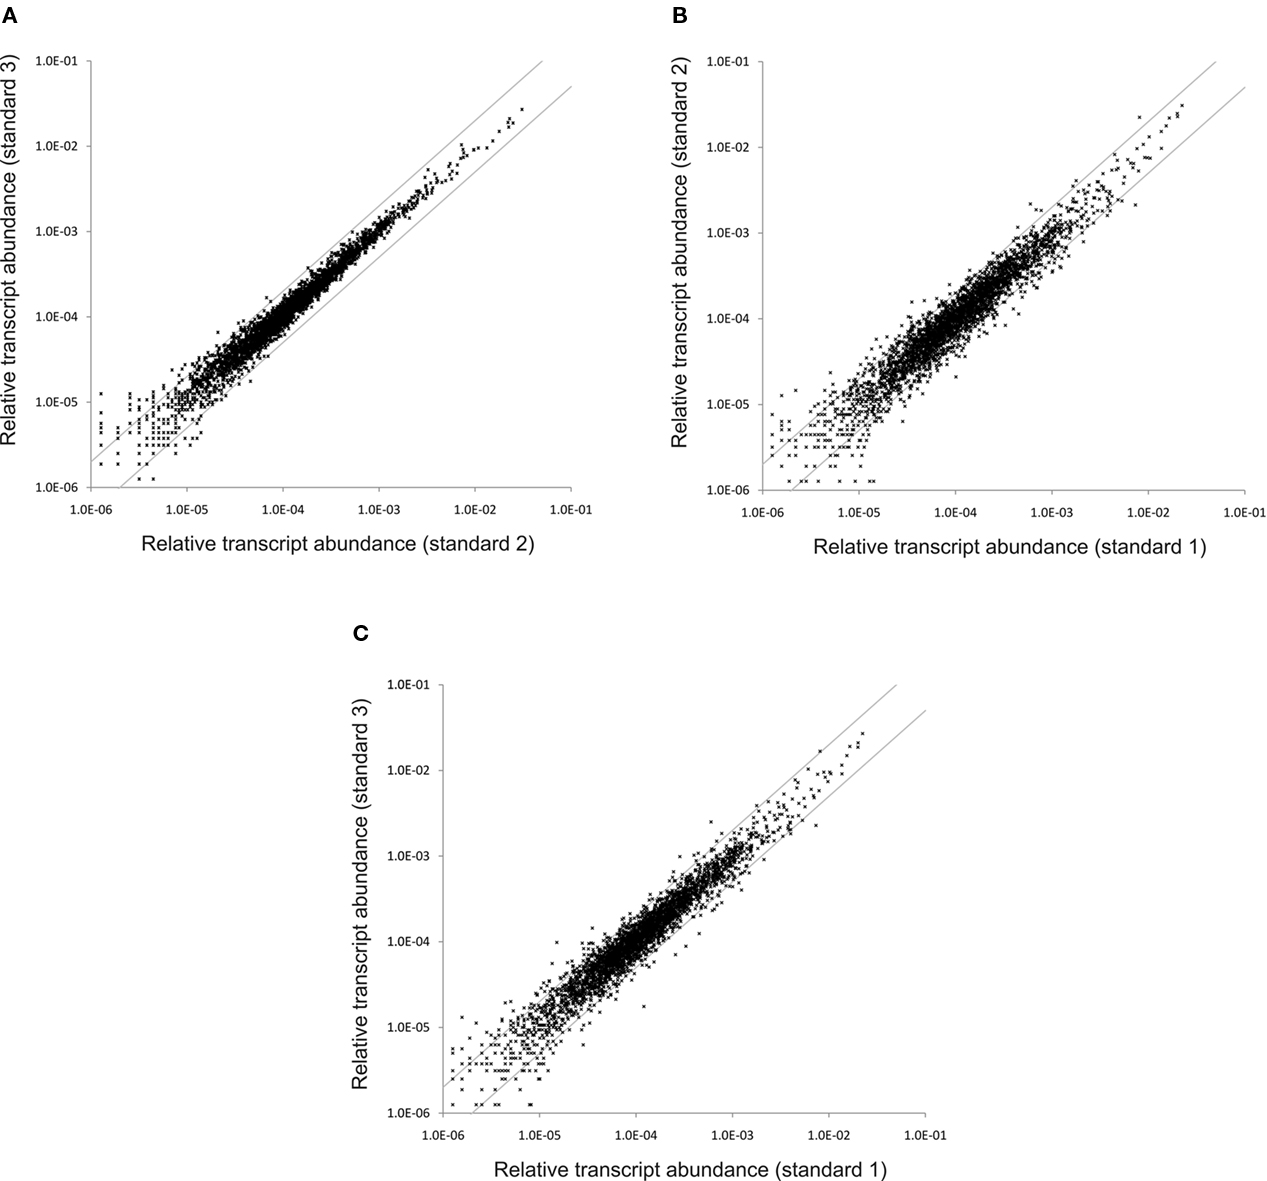
Figure 2. Variation in the relative transcript abundance between standard samples. These scatter plots show the variation in the relative transcript abundance between (A) standard conditions sample 3 compared to standard conditions sample 2; (B) standard conditions sample 2 compared to standard conditions sample 1; and (C) standard conditions sample 3 compared to standard conditions sample 1. The gray lines indicate a two-fold change in either direction.
Figures 2B,C show scatter plot comparisons of the results obtained for the sample subjected to rRNA depletion plotted against the results for the two samples which were not depleted of rRNA. These two scatter plots are very similar to one another, but differ from that shown in Figure 2A by showing lightly greater variance. A larger number of genes showed transcript levels that differed by a factor of 2. This result suggested that the rRNA depletion process slightly altered the levels of some mRNAs. For this reason, and because the depletion method was variable and incomplete, rRNA depletion was abandoned after some initial trials. Because the values obtained for all three datasets were highly comparable, the transcript levels from the three “standard conditions” samples were averaged to produce a list of average transcript abundances for each gene for cells grown under standard conditions. These averages were subsequently used as the basis for comparisons of transcript abundances for other conditions (see Table 3; and Table S2 in Supplementary Material). Further, the high similarity of the datasets obtained for three “standard conditions” samples shows that reliable comparisons can be made even with a single dataset for a specific condition.
Table 3. Changes in the transcript level for genes of selected metabolic pathways.
Transcription Changes in Cells Subjected to High-Light Intensity
Synechococcus 7002 is known to be extremely tolerant to high-light intensity (Sakamoto and Bryant, 2002; Nomura et al., 2006b), and sunlight intensity is one of the most important environmental factors in natural habitats of cyanobacteria. A light intensity of 250 μmol photons m−2 s−1, which is saturating for standard growth of dilute Synechococcus 7002 cultures, is often regarded as a high-light condition for Synechocystis sp. PCC 6803 (hereafter Synechocystis 6803; e.g., Hihara et al., 2001; Mizusawa et al., 2009). To induce high-light stress in Synechococcus 7002, a culture which was grown under standard conditions was exposed for 1 h to a light intensity of 900 μmol photons m−2 s−1. Table S2 in Supplementary Material provides comparisons for all genes under all conditions reported here, and it includes the p-values for the respective comparisons derived from the statistical analyses. Figure 3A shows a scatter plot of the relative transcript abundances for all ORFs in cells exposed to high-light intensity compared to the average value for standard conditions. Many genes show differences greater than two-fold, and the values for a few specific genes are indicated on the panel. The transcript levels of many genes involved in the Calvin–Benson–Bassham cycle were two- to four-fold higher in cells exposed to high light (Table 3). Transcripts for genes encoding the structural components of carboxysomes (ccmK, ccmL, ccmM, ccmN) and for carbonic anhydrase (icfA; Badger and Price, 2003; Yeates et al., 2008; Cannon et al., 2009) also increased 1.5- to 3-fold, and transcripts for sbtA, encoding the sodium-dependent bicarbonate transporter, showed an increase of 3.5-fold. Thus, a 1-h treatment with high light was sufficient to cause the well-known physiological response that high-light intensity is perceived by cyanobacterial cells as CO2 limitation (Badger and Price, 2003; Woodger et al., 2007). Interestingly, transcript levels for the genes encoding the so-called inducible CO2 uptake mechanism (ndhD3, ndhF3, cupA, and cupS; Ogawa and Mi, 2007) were either constant or only slightly higher (maximum two-fold increase); however, the transcript levels for the constitutive CO2-concentrating mechanism (ndhD4, ndhF4, cupB) decreased slightly (maximum decrease of approximately two-fold). Similar results were obtained in a microarray study in Synechocystis 6803; after a shift from low light to high-light intensity, the transcript levels of genes encoding ribulose 1,5-bisphosphate carboxylase/oxygenase (RuBisCO) and carboxysome components increased, whereas mRNA levels of genes encoding the inducible CO2 uptake mechanism increased only transiently or remained unchanged for the constitutive CO2 uptake mechanism (Hihara et al., 2001).
Figure 3. Changes in the relative transcript abundance after different treatments or growth. The scatter plots show the relative transcript abundances (A) after a 1-h high-light treatment, (B) after 1 h incubation in the dark (oxic conditions), and (C) after 1 h incubation in the dark under anoxic conditions compared to that for “standard conditions” (mean of three biological replicates). Scatter plot (D) shows the relative transcript abundances for a culture grown under micro-oxic conditions compared to a culture grown under “standard conditions”. The gray lines give two-fold changes in either direction. Selected genes are identified by name/locus tag number.
The transcript levels for genes encoding the structural subunits of the RNA polymerase and the ribosomal proteins did not change or increased slightly (two-fold at maximum; see Table S2 in Supplementary Material). Similar to results observed with Synechocystis 6803, transcript levels for the genes encoding the GroEL/GroES chaperone increased three- to seven-fold (Table 3; Figure 3A; Hihara et al., 2001).
Transcripts for ndhD2 were 15-fold higher in cells exposed to high light than in standard conditions (Table 3). However, transcripts for ndhD1, encoding a paralogous form of NdhD subunit for the Type-1 NADH dehydrogenase complex, were about four-fold lower in high-light grown cells. Cyanobacterial genomes encode paralogous NdhD and NdhF subunits (Ogawa and Mi, 2007). The NdhD1/NdhD2 and NdhF1/NdhF2 proteins are involved in formation of the Type-1 NADH dehydrogenase complex, which is required for respiration and cyclic electron flow, whereas the NdhD3/NdhD4 and NdhF3/NdhF4 proteins are subunits of specialized NADH dehydrogenase-like complexes required for CO2 concentration in cells (Battchikova and Aro, 2007; Ogawa and Mi, 2007). The higher ndhD2 mRNA level after high-light treatment might suggest a preferential involvement of NdhD2 in cyclic electron flow rather than in respiration. However, very little specific biochemical information is currently available for NADH dehydrogenase complexes containing NdhD2 (Battchikova and Aro, 2007). The transcript levels of the genes encoding other NADH dehydrogenase subunits were more or less constant, or increased slightly (less than or equal to two-fold); this might also indicate a slightly higher requirement for NADH dehydrogenase activity for cyclic electron flow at high-light intensity.
Interestingly, the transcript level for the desB gene, which encodes the Δ15 fatty acid desaturase, was 10-fold higher after the high-light treatment (Table 3), and the mRNA level for desA (Δ12 desaturase) was three-fold higher. A similar observation was made for Synechocystis 6803 in a microarray analysis (Hihara et al., 2001). However, the transcript levels of the other fatty acid desaturases (desC, desE, desF) were unchanged. These results suggested that cells might increase the proportion of polyunsaturated fatty acids after high-light treatment. It has previously been shown that a desA mutant strain for Synechococcus 7002 exhibited a temperature-sensitive phenotype when cultures were grown at high-light intensity (Sakamoto and Bryant, 2002). Transcripts for pstS, encoding the substrate-binding protein of the phosphate transport system, were six-fold higher after high-light treatment (Table 3). However, the transcript levels for other genes for this ABC transport system (pstA, pstB, pstC) only increased approximately two-fold. Together with the higher transcript levels for genes involved in bicarbonate/CO2 uptake, this could point to an increased cell growth. However, the genes coding for components of nitrate and sulfate assimilation mechanisms do not show an increase in the mRNA levels (see Table S2 in Supplementary Material), and it has been reported that the growth rate of Synechococcus 7002 remains constant under moderately high-light conditions (Nomura et al., 2006a). Therefore, the up-regulation of the phosphate ABC transport system probably reflects an increased requirement for phosphate in cells exposed to high light, but this requirement probably is not directly linked to faster cell growth.
Genes showing much lower transcript levels after high-light treatment included glyceraldehyde-3-phosphate dehydrogenase (gap, SYNPCC7002_A2697, ∼15-fold) and a bacterial/plant-type fructokinase (pfkB, SYNPCC7002_A0886, ∼15-fold; Table 3). Transcript levels for an alternative glyceraldehyde-3-phosphate dehydrogenase (gap, SYNPCC7002_A0106) were slightly higher (approximately two-fold) and for a second phosphofructokinase gene (pfkA, SYNPCC7002_A0162) were slightly lower (approximately two-fold). Interestingly, transcript levels for pntA, pntB, and pntC, encoding subunits of pyridine nucleotide transhydrogenase, were 7- to 13-fold lower after high-light treatment (Table 3). These results suggested that electron exchange between the NADH and NADPH pools might be less important in cells under high-light conditions.
The reducing equivalents required for cell growth are provided by the photosystems in the light, and in the absence of photoinhibition effects, high-light intensity should provide more reducing equivalents. On the other hand, when the light intensity is too high, the photosynthetic apparatus could produce excess reducing equivalents, which should cause cells to increase the transcript levels for genes involved in electron-consuming processes, e.g., the enzymes of the Calvin–Benson–Bassham cycle (see above). Phycobilisomes serve as the main antennae for photosynthesis in cyanobacteria, and they transfer excitation energy to both photosystems (Ashby and Mullineaux, 1999; Dong et al., 2009). Acclimation of this system directly affects the efficiency of excitation usage. Further, acclimative changes in the PS II to PS I ratio determines the ratio of linear electron transport (producing reductants (e.g., NADPH) from water oxidation) to cyclic electron transport (involving PS I and the cytochrome b6f complex), which generates proton motive force across the thylakoid membrane for ATP synthesis (Fujita et al., 1994).
The transcript levels of the genes encoding PS I subunits, PS II subunits and other photosystem-related proteins changed upon high-light treatment. Transcript levels for PS II genes generally increased, whereas the transcript levels of PS I genes generally decreased (Figure 4). Similar observations were made for Synechocystis 6803 exposing cells to high light (300 μmol photons m−2 s−1 for 15 min or 1 h; Hihara et al., 2001). In this study for Synechococcus 7002, transcripts for psbN and psbA-II (SYNPCC7002_A0157) increased approximately five-fold, and those for the other two psbA genes (SYNPCC7002_A1418 and SYNPCC7002_A2164) either increased slightly (approximately two-fold) or remained constant, respectively. Due to the high sequence similarity of SYNPCC7002_A0157 and SYNPCC7002_A1418, many psbA sequences did not map uniquely which made inferences difficult. However, transcripts for psbA gene SYNPCC7002_A2164 were present at a very low level compared to those for the other two psbA genes. Compared to the other two psbA paralogs (SYNPCC7002_A0157 and SYNPCC7002_A1418), which encode proteins of nearly identical amino acid sequence, the SYNPCC7002_A2164 PsbA paralog has many differences in the amino acid sequence. Multiple copies of psbA also occur in other cyanobacteria (e.g., Synechocystis 6803, Nostoc sp. PCC 7120, and Thermosynechococcus elongatus), and it has been reported that the transcription of these genes is modulated in response to changes in light intensity and O2 level (Schaefer and Golden, 1989; Summerfield et al., 2008; Sander et al., 2010). Our data suggest that transcripts of SYNPCC7002_A0157 increased five-fold at high-light intensities (Figure 3A), whereas the other tested conditions did not affect its transcription very much. Transcript levels for the other psbA genes were more or less constant under the conditions tested in this study or were slightly lower under dark fermentative conditions (in the case of SYNPCC7002_A1418). Considering the genes for all subunits of both photosystems, the data clearly showed that significant changes in the ratio of PS I and PS II begin with changes at the mRNA level (Figure 4). These changes are well correlated with the observation that the PS II to PS I ratio increases when cells are grown at higher light intensity (Fujita et al., 1994). When energy transfer from phycobilisomes to PS II is impaired in Synechococcus 7002, the PS II content of the cells increases (Zhao et al., 2001), whereas dark acclimation of wild type cells resulted in a state 2 transition (i.e., direct energy transfer from phycobilisomes to PS I; Huang et al., 2003; Dong et al., 2009). A recent microarray study in Synechocystis 6803 showed that direct excitation of either PS I or PS II caused significant changes in transcription. The genes with increased transcript levels were not only restricted to those genes of photosystem that was not being excited, but included genes for diverse metabolic processes as well (Singh et al., 2009).
Figure 4. Relative transcript levels of genes encoding components of photosystem I and photosystem II after a 1-h exposure to high light compared to standard conditions. The transcript level of genes encoding components of PS II (light gray) and PS I genes (dark gray) are displayed as the ratio of the relative transcript abundances for high-light-treated cells compared to the mean of three samples for standard conditions. A value of 1 represents an equal mRNA level under both conditions; values greater than 1 indicate an increase in relative transcript abundance; and values lower than 1 represent a decrease in relative transcript abundance after a 1-h exposure to high light.
Among the components of the photosynthetic electron transport chain, the petH gene, encoding ferredoxin:NADP+ oxidoreductase, showed approximately two-fold higher transcript levels in cells exposed to high light (Table 3). Transcript levels for genes for other components of electron transfer, such as the cytochrome b6f complex and cytochrome c6 also increased up to two-fold. The situation for petF, encoding the ferredoxin electron acceptor for PS I, was more complex, because several genes are annotated as ferredoxins. Some of these genes showed elevated transcript levels at high light (four-fold at maximum), whereas transcript levels for others remained constant. There was an overall decrease in transcript levels for phycocyanin and phycocyanin-associated linker proteins (2- to 10-fold; Figures 3A and 5), whereas the transcript level of allophycocyanin-associated genes decreased to a lesser extent (maximally approximately two-fold reduction; Figure 5). Transcripts for genes encoding the enzymes of heme and chlorophyll biosynthesis generally did not change very much after a 1-h exposure to high light with one major exception. Transcripts for chlB, chlL, and chlN genes, encoding the light-independent (dark-active) protochlorophyllide reductase, decreased ∼6- to 12-fold upon high-light treatment.
Figure 5. Changes in transcript levels of genes encoding phycobiliproteins, linker polypeptides, and enzymes specifically involved in their biogenesis/maturation. The transcript levels for genes encoding phycobiliproteins, linker polypeptides, and enzymes involved in phycobiliprotein biogenesis/maturation are displayed as the ratio of the relative transcript abundances for cells exposed to high light for 1 h (light gray) or incubated under dark oxic conditions for 1 h (dark gray) compared to the mean of abundances for three standard conditions samples.
The genes encoding the F0F1-type ATP synthase showed higher transcript levels (up to four-fold) after high-light treatment than cells grown under standard conditions. This observation suggested that the higher level of electron transport and proton motive force produced under these conditions is probably used to enhance ATP synthesis. Finally, there are two gene clusters, ctaI and ctaII, that encode cytochrome oxidases in Synechococcus 7002 (Nomura et al., 2006a). Transcript levels for the ctaI genes were considerably higher compared to those for the ctaII genes (4- to 20-fold higher under standard conditions); this finding agrees with previous results showing that cytochrome oxidase I is the major terminal oxidase and is responsible for most oxygen uptake in the dark (Nomura et al., 2006b). Furthermore, the cytochrome oxidases are required to maintain cellular redox balance in the light. Previous studies had suggested that cytochrome oxidase II might play a role as a signal transducer to measure redox balance and trigger an oxidative stress response (Nomura et al., 2006b). Transcript levels for the ctaI genes decreased slightly (approximately two-fold) after high-light treatment, whereas the transcript levels for the ctaII genes were essentially unchanged (Table 3).
Flavoproteins related to SYNPCC7002_A1321 and SYNPCC7002_A1743 have previously been reported to act as oxygen photoreductases in Synechocystis sp. PCC 6803 (Helman et al., 2003; Hackenberg et al., 2009). Interestingly, high-light treatment did not increase the transcript levels for these two genes, and in fact, transcript levels for SYNPCC7002_A1743 might have decreased slightly (∼1.5-fold). This observation suggested that these flavoproteins might have functions in addition to their roles in the dissipation of excess electrons via the Mehler reaction.
Transcription Changes in Cells Under Dark Oxic (Respiratory) Conditions
Light is obviously the key factor for photolithoautotrophic growth because it provides the reducing equivalents for CO2 reduction. Light powers the electron transport reactions that generate protonmotive force for ATP synthesis, and thus directly fuels the biosynthesis of all cell components. For cyanobacteria in natural environments, cells are exposed to alternating periods of light and dark during a diel cycle, and light intensity may also increase or decrease depending on cloud cover and other factors. Changes in light availability will produce large changes in the supplies of ATP and reducing power in cyanobacterial cells. Therefore, gene expression patterns must be constantly readjusted to enable cells to cope with these changing circumstances.
To simulate the light-to-dark transition that would occur at dusk, a culture that had been grown under standard conditions was transferred into darkness for 1 h while sparging with 1% (v/v) CO2 in air (i.e., under oxic conditions). Figure 3B shows a scatter plot comparing transcript levels in dark oxic conditions to those for standard conditions. The transcriptional changes that occurred upon dark oxic treatment were generally more severe compared to those associated with high-light treatment (Figure 3A). Both the number of genes showing a greater than two-fold change in transcript abundance, as well as the magnitude of the observed differential transcription changes, were higher. Transcripts for genes encoding components of the photosynthetic apparatus were still relatively abundant after a 1-h dark oxic incubation. Although transcript levels for a few genes remained unchanged, the relative transcript levels for genes encoding components of the photosynthetic apparatus were significantly lower (up to approximately six-fold) compared to their levels in cells under standard conditions (Table 3). These observations for transcript levels of photosystem-related genes are consistent with a comparable study in Synechocystis 6803, in which a culture was incubated in the dark and transcription changes were subsequently monitored as a function of time (Gill et al., 2002).
The transcript levels of genes encoding the enzymes of heme and chlorophyll biosynthesis were generally slightly lower upon dark incubation (approximately two- to three-fold for many of the genes); however, there was one exception: the three genes encoding the light-independent protochlorophyllide reductase (Kada et al., 2003; Bröcker et al., 2010; Muraki et al., 2010). The mRNA levels for the subunits of this enzyme (chlL, chlB, chlN) were four- to eight-fold higher in cells under dark oxic conditions. In the dark the transcript levels of genes encoding the structural subunits of the phycobilisomes and the bilin lyases were either approximately constant [e.g., apcD, cpcG2 (SYNPCC7002_A0639), apcF] or were lower by up to seven-fold (Figure 5). Although transcripts for both allophycocyanin and phycocyanin-related genes were lower in the dark, transcripts for phycocyanin and the peripheral rods were generally affected to a greater extent than genes encoding components of the phycobilisome core. Transcripts for nblA increased about five-fold upon dark incubation. Similar observations were made in a microarray study for the transcript levels for apcAB, cpcBA, and nblA genes in Synechocystis 6803 when a culture was incubated in the dark (Gill et al., 2002). Because NblA causes phycobiliproteins to become sensitive to degradation by Clp proteases (Baier et al., 2004; Karradt et al., 2008), this observation suggests that phycobilisomes and phycobiliproteins are actively degraded in the dark in order to reduce the cellular content of phycobiliproteins and to recycle the reduced carbon and nitrogen contained within the proteins of these antenna structures. Interestingly, the mRNA level for nblA also increased approximately two-fold after high-light treatment, which might be indicative of a similar reduction of light-harvesting components under high light.
After 1 h in the dark the mRNA levels for the Type-1 NADH dehydrogenase genes and for the cytochrome oxidase genes (both ctaI and ctaII) were similar to those in cells grown under standard conditions. However, transcript levels for most genes encoding the F0F1-type ATP synthase were significantly lower, 3- to 14-fold, after 1 h in the dark (Table 3). This correlates well with respiratory electron transport rates that are about 10-fold lower than the rate of oxygen evolution in the light (Nomura et al., 2006a). The Synechococcus 7002 genome encodes a second set of genes for an F0F1-type ATP synthase (annotated as ATPase II; SYNPCC7002_G0144 – SYNPCC7002_G0152). This plasmid-located (on plasmid pAQ7) gene cluster has been suggested to encode a Na+-translocating N-ATPase (Dibrova et al., 2010). The transcript levels for the genes in this particular gene cluster were very low under standard conditions (about 5% of the corresponding ATPase I levels) and were even lower in cells exposed to high light (Table 3). Transcript levels for the ATPase II genes, however, increased upon dark incubation (approximately three-fold). The transcription data thus showed that the genes encoding this putative N-ATPase are transcribed and are regulated; however, the biological function of this putative ATPase is currently unknown.
Genes involved in CO2 uptake, concentration and fixation showed lower transcript levels after 1-h dark incubation (Table 3); transcripts for the rbcL and rbcS genes, encoding RuBisCO, were about three-fold lower and transcripts for genes encoding components of the carboxysome were up to six-fold lower. Transcript levels for two genes (ndhD3, ndhF3) encoding subunits of the inducible CO2-concentrating complex were lower in the dark (approximately three-fold), and even the gene coding for a transcriptional regulator (rbcR/ccmR; Woodger et al., 2007) showed a slightly lower transcript level. However, the mRNA levels encoding subunits of the constitutive CO2-concentrating complex remained more or less constant. These data illustrate that genes involved in CO2 fixation, the major electron sink, are regulated at the transcriptional level and that this regulation includes not only the essential central components but also those for the more peripheral, inducible CO2 uptake system.
The transcript levels for many genes involved in carbohydrate degradation (e.g., glycolysis) increased in cells after a 1-h dark treatment (Table 3). Transcripts increased three-fold for pgi (glucose-6-phosphate isomerase) and pfkA (6-phosphofructokinase), four-fold for fbaB (fructose-bisphosphate aldolase class I), and five-fold for gap (SYNPCC7002_A2697; glyceraldehyde-3-phosphate dehydrogenase, type I). Some of the reactions of glycolysis or the oxidative pentose phosphate cycle and the Calvin–Benson–Bassham cycle are common to more than one of these pathways. Cyanobacteria usually have one enzyme that is used for the oxidative pentose phosphate cycle and another enzyme that is used for the Calvin–Benson–Bassham cycle (Knowles and Plaxton, 2003). The transcription data for genes encoding glyceraldehyde-3-phosphate dehydrogenase (gap), fructose-bisphosphate aldolase (fba), and fructose-1,6-bisphosphatase (fbp) reflect this phenomenon. Transcription of one set of gap and fba/fbp genes (gap/SYNPCC7002_A0106, fba/SYNPCC7002_A1352, glpX/SYNPCC7002_A1301) was regulated in the same way as the RuBisCO genes (i.e., increased transcript levels in high-light-treated cells and lower transcript levels in cells under dark oxic conditions). Transcript levels for the other set of genes was regulated oppositely: i.e., transcript levels for these genes (gap/SYNPCC7002_A2697, fbaB/SYNPCC7002_A0010, fbp/SYNPCC7002_A0329) were higher in cells after dark oxic treatment (or at least at about the same level in the case of SYNPCC7002_A0329) and lower in cells exposed to high light. Thus, although these biochemical pathways share certain reactions, the transcription data suggest that there are probably distinctive enzymes, which are differentially expressed, that change in response to light and/or the availability of reducing equivalents provided through the action of light.
The so-called light-repressed transcript (lrtA), which encodes the “light-repressed protein (Singer and Doolittle, 1974; Tan et al., 1994),” became extremely abundant after dark incubation. The lrtA transcripts increased nine-fold after dark, oxic treatment and increased to an even greater level under dark, fermentative conditions (Table 3). Conversely, the lrtA transcripts were about five-fold lower in cells exposed to high light for 1 h. It has previously been demonstrated that lrtA transcripts are actively degraded after cells are exposed to light (Samartzidou and Widger, 1998).
Two genes in pyruvate metabolism were among those genes for which transcript levels increased the most upon dark incubation (see Figures 3B and 6). Transcripts for ppsA, encoding phosphoenolpyruvate synthase increased 20-fold, and those for nifJ, encoding pyruvate:ferredoxin oxidoreductase increased 25-fold (Figure 6). Conversely, high-light treatment for 1 h caused transcripts for these two genes to decrease about three- and five-fold respectively. After cells were exposed to dark oxic conditions for 1 h, transcript levels for pyruvate kinase (pyk) and pyruvate dehydrogenase (pdhA, pdhB, ipdA, and SYNPCC7002_A0110) decreased approximately two-fold. However, the transcript levels for the genes encoding pyruvate kinase and pyruvate dehydrogenase did not change much (1.5-fold higher) after cells were exposed to high light for 1 h. Micro-oxic growth conditions (see below) likewise did not alter the transcript levels for genes involved in the pyruvate metabolism. The possible implications of these differences for pyruvate metabolism will be discussed below when describing transcription changes that occur during fermentative (dark anoxic) conditions.
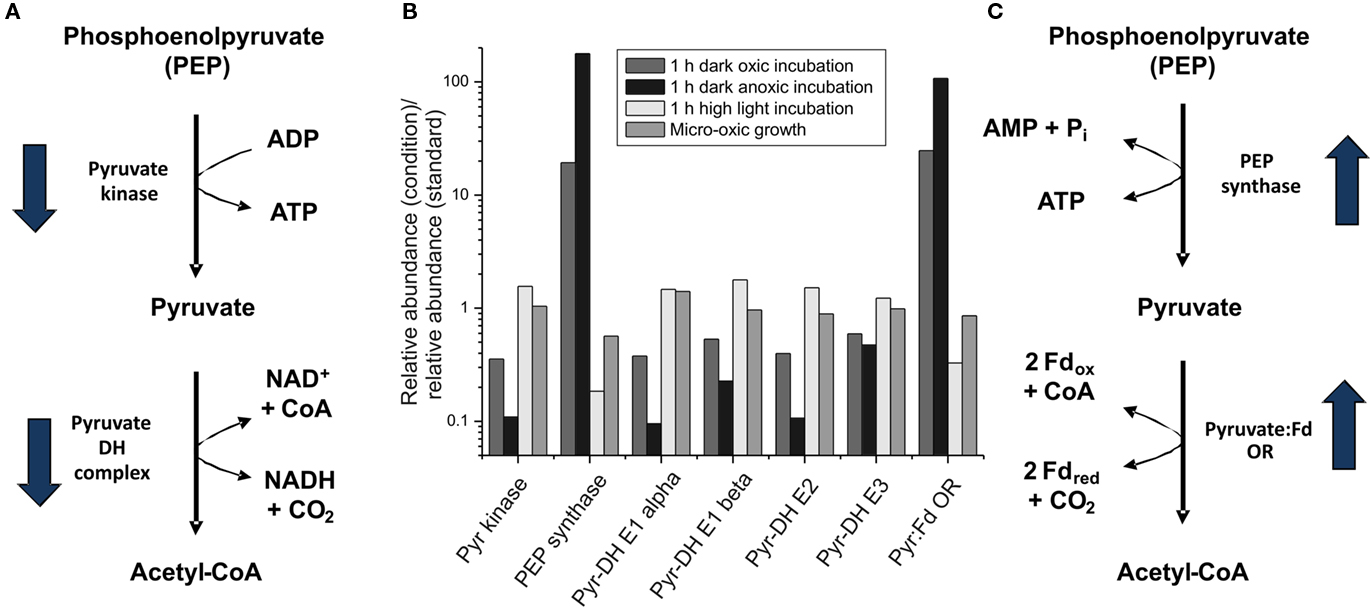
Figure 6. Changes in the transcript levels for genes coding for proteins involved in pyruvate metabolism. Relative transcript levels for genes encoding proteins/enzymes involved in pyruvate metabolism [pyruvate (Pyr) kinase (pyk), phosphoenolpyruvate (PEP) synthase (ppsA), pyruvate dehydrogenase (Pyr-DH) complex (E1 alpha, E1 beta, E2 and E3 proteins; encoded by pdhA, pdhB, SYNPCC7002_A0110, ipdA), and pyruvate:ferredoxin oxidoreductase (Pyr:Fd OR; nifJ)] are shown. The proposed reaction pathways from PEP to acetyl-CoA with the respective enzymes are shown in (A,C); and the change in the mRNA level for the respective genes upon dark incubation is indicated by arrows. (B) The ratio of the transcript levels for cells after a 1-h dark oxic treatment (dark gray), a 1-h dark anoxic treatment (fermentative conditions; black), a 1-h high-light treatment (light gray), and photolithoautotrophic growth under micro-oxic conditions (medium gray) are compared to transcript levels in cells under standard conditions.
As noted above, high-light treatment caused transcript levels for pyridine nucleotide transhydrogenase subunits (pntA, pntB, pntC) to decrease sharply. Dark oxic incubation had the opposite effect on the transcription of the transhydrogenase genes: mRNA levels increased approximately seven-fold for pntB and pntC and increased approximately four-fold for pntA. These transcriptional changes suggested that cells have a much higher requirement for NADH/NADPH electron exchange under dark respiratory conditions than in the light.
The mRNA level for SYNPCC7002_A1442, which encodes dihydroorotate dehydrogenase, an enzyme involved in pyrimidine metabolism, was 30-fold higher after a 1-h dark incubation; under dark fermentative conditions (see below) its transcript level was 50-fold higher than in standard conditions. The gene encoding this particular dihydroorotate dehydrogenase and nifJ are immediate neighbors, have the same orientation, and are separated by only 70 bp; these observations suggest that they maybe transcribed as an operon under a common regulatory mechanism. The transcript level for a second pyrD gene (SYNPCC7002_A2195) did not change much upon dark oxic treatment, but was about five-fold lower after 1 h under dark anoxic incubation when compared to cells grown under standard conditions. The transcript levels of both pyrD genes were similar to those of standard conditions when cells were grown under micro-oxic conditions (see below), suggesting that the regulation is not directly related to oxygen. The biochemical rationale for this exchange of PyrD proteins is not clear, but darkness is usually associated with lower oxygen levels for cyanobacteria. This could result in an indirect acclimation of pyrD transcription in response to changing oxygen levels or cellular redox potential.
Transcription of the genes coding for the two flavoproteins (SYNPCC7002_A1321 and SYNPCC7002_A1743) increased (three- and two-fold, respectively) after dark oxic incubation. A similar change was also observed upon dark anoxic incubation for SYNPCC7002_A1321 (three-fold higher), although no increase of the mRNA level for SYNPCC7002_A1743 was observed (see below). Growth under micro-oxic conditions (see below) resulted in a slight decrease (∼1.5-fold) in transcript levels for both genes, whereas almost no change was observed after high-light incubation. As noted above, these observations suggest that these flavoproteins might not exclusively function as catalysts to eliminate excess electrons in the light.
Transcriptional Changes in Cells Under Dark Anoxic (Fermentative) Conditions
Because PS II cannot oxidize water and evolve O2 in the dark, O2 levels typically decrease in natural habitats of oxygenic photosynthetic organisms at night. The remaining O2 in these environments is often rapidly consumed by the respiratory activities of cyanobacteria and/or other microorganisms, which imposes dark anoxic (i.e., fermentative) conditions on the cyanobacteria. To simulate these conditions, cultures were placed in the dark and were sparged with 1% CO2 (v/v) in N2. Figure 3C shows a scatter plot in which the transcript level for each gene in cells exposed to dark anoxic conditions was plotted against the transcript level in cells grown under standard conditions. It is apparent that a larger number of genes exhibited greater than two-fold changes in transcription level than for dark oxic conditions (compare Figures 3B,C) and that many genes additionally showed transcript levels that were markedly higher or lower than this threshold. This is perhaps not surprising because two important environmental parameters, light and oxygen, were changed in this experiment. The transcript levels for genes encoding the two photosystems, electron transport proteins, phycobilisome components, and heme and chlorophyll biosynthesis were even lower in cells exposed to these fermentative conditions than in cells from dark oxic conditions (Table 3). A few exceptions, e.g., psbW2 and chlH (SYNPCC7002_A1000), had increased transcript levels under fermentative conditions compared to standard conditions. For each of these genes, there is a paralog (psbW/SYNPCC7002_A1258, chlH/SYNPCC7002_A1018) for which transcript levels decreased in cells exposed to fermentative conditions. Furthermore, transcripts for ho2 and acsF2 were much higher under dark anoxic conditions than under standard or dark oxic conditions (see further discussion concerning micro-oxic conditions below).
Transcripts for ppsA (phosphoenolpyruvate synthetase) and nifJ (pyruvate:ferredoxin oxidoreductase) increased dramatically, 180- and 110-fold, respectively, under fermentative conditions. The latter value was in excellent agreement with results from quantitative-RT-PCR, which showed that nifJ transcripts increased 130 ± 23-fold when cells were incubated for 30-min under dark anoxic conditions (McNeely et al., 2010a; Xu, 2010). Conversely, transcripts for pyk (pyruvate kinase) and the pyruvate dehydrogenase complex (pdhA, pdhB, ipdA, and SYNPCC_A0110) were as much as 10-fold lower under dark anoxic conditions compared to standard conditions. Assuming that these very large transcriptional changes also reflect changes in enzyme activity levels in the cells, these results strongly suggested that the normal glycolytic pathway for phosphoenolpyruvate conversion to acetyl-coenzyme A (CoA) via pyruvate kinase and pyruvate dehydrogenase is replaced by an alternative pathway comprising phosphoenolpyruvate synthase and pyruvate:ferredoxin oxidoreductase. Transcription of nifJ has been reported under oxic conditions in several cyanobacteria (Schmitz et al., 2001); however, inactivation of pdhA in Synechococcus 7002 resulted in an acetate-requiring auxotrophic mutant strain (Xu, 2010). This result implies that pyruvate:ferredoxin oxidoreductase (NifJ) activity in cells grown under oxic conditions is insufficient to provide adequate acetyl-CoA to support autotrophic growth.
Phosphoenolpyruvate synthase (PpsA) is the main enzyme involved in the conversion of phosphoenolpyruvate to pyruvate in a modified Embden–Meyerhof pathway that occurs in the archaeon Thermococcus kodakarensis, although both pyruvate kinase and phosphoenolpyruvate synthase are also present in this organism (Imanaka et al., 2006). The conversion of phosphoenolpyruvate into pyruvate by pyruvate kinase generates one ATP from ADP, whereas phosphoenolpyruvate synthase produces one ATP and pyruvate from phosphoenolpyruvate, AMP and phosphate (Imanaka et al., 2006). This means that phosphoenolpyruvate synthase conserves more energy than pyruvate kinase, which is very important under energy-limiting conditions such as fermentation. Pyruvate decarboxylation via the pyruvate dehydrogenase complex yields one equivalent each of NADH, acetyl-CoA and CO2. Pyruvate decarboxylation by the pyruvate:ferredoxin oxidoreductase also generates acetyl-CoA but instead of NADH produces two molecules of reduced ferredoxin, which have a much lower redox potential than the NADH/NAD+ couple (Tittmann, 2009). Reduced ferredoxin can be used directly to reduce nitrate, sulfite, and other substrates or can be used to produce NADPH via ferredoxin:NADP+ oxidoreductase. The availability of reducing equivalents at lower redox potentials should also benefit cells energetically when respiration is not possible. In summary, it appears quite likely that Synechococcus 7002 uses alternate pathways for the conversion of phosphoenolpyruvate into acetyl-CoA in the light and in the dark under fermentative conditions (Figure 6). The fermentative pathway might conserve more energy for cellular metabolism than the pathway that operates in the light or under dark oxic conditions.
Under dark anoxic conditions, no oxidative phosphorylation can be performed because the terminal electron acceptor for the respiratory chain (O2) is missing. These conditions caused dramatic changes in mRNA level for genes coding for the subunits of enzyme complexes involved in electron transport and ATP synthesis. The relative mRNA levels for the genes encoding the Type-1 NADH dehydrogenase complex, cytochrome oxidase and ATP synthase decreased more than 10-fold for some genes when compared to levels in cells under standard conditions (Table 3). Under fermentative conditions ATP synthesis for growth and cellular maintenance is produced by substrate-level phosphorylation. These reactions also typically produce reduced coenzymes or redox proteins, which must be regenerated by reduction of some substrate molecule. As for dark oxic conditions, transcripts for genes encoding components of the CO2 concentration and fixation pathways are lower than in cells grown under standard conditions. Reduction of nitrate and nitrite and excretion of ammonia could potentially provide another sink for electrons. However, transcript levels for narB (nitrate reductase) and nirA (nitrite reductase) were even lower in the dark fermentative sample (7- and 15-fold, respectively compared to levels in cells under standard conditions) than upon dark oxic incubation (seven- and three-fold, respectively, relative to levels in cells under standard conditions). Thus, nitrate reduction is probably not the major electron sink in absence of O2, although studies show that nitrate does compete with other oxidizing agents for electrons under these conditions (Gutthann et al., 2007; McNeely et al., 2010a,b).
Electrons produced during glycolysis can also be used to reduce protons to hydrogen. Like many other cyanobacteria, Synechococcus 7002 produces a so-called bidirectional, NAD(P)H-oxidizing [NiFe]-hydrogenase (McNeelyMcNeely et al., 2010a,b; Xu, 2010). When cells were incubated under dark oxic conditions, transcripts for the genes encoding the hydrogenase increased three- to seven-fold. Interestingly, under dark fermentative conditions, transcripts for the three genes that encode the diaphorase moiety of the enzyme (hoxE, hoxF, hoxU) increased significantly, 2- to 16-fold, but the transcript levels for hoxH and hoxY, which encode the hydrogenase portion of the bidirectional hydrogenase, did not increase. Nevertheless, the reduction of protons to produce hydrogen does occur under these conditions (McNeely et al., 2010a,b), again indicating that post-transcriptional regulatory processes may be important. The diaphorase portion of the bidirectional hydrogenase has sequence similarities to the missing diaphorase subunits of the cyanobacterial Type-1 NADH dehydrogenase complex and has been suggested to connect the bidirectional [NiFe]-hydrogenase to the NADH dehydrogenase complex (Appel and Schulz, 1996; Schmitz and Bothe, 1996). However, it is currently not clear whether such a connection actually occurs, and it is furthermore not clear what advantage such a connection would provide to cells under fermentative conditions.
Interestingly, transcript levels for ldhA (SYNPCC7002_G0164, d-lactate dehydrogenase), acsA (SYNPCC7002_A1838, acetyl-CoA ligase), acs (SYNPCC7002_A2015, acetyl-CoA synthetase), and two putative adh genes (alcohol dehydrogenases, SYNPCC7002_A0868 and SYNPCC7002_A2590) were similar under all conditions tested in this study. Transcript levels for ldhA and the adh genes actually decreased somewhat under dark fermentative conditions. Because it is known that d-lactate is the major fermentation product produced by Synechococcus 7002 (McNeely et al., 2010b), these observations further establish that post-transcriptional regulation processes are important in establishing the fermentative capabilities of Synechococcus 7002.
Transcription Changes in Cells Under Micro-Oxic Conditions
In order to distinguish if transcription changes were resulting from the effects of light or directly from the O2 levels, transcription profiling was performed with cells grown photoautotrophically under micro-oxic conditions. Micro-oxic conditions were achieved by sparging the culture with 1% (v/v) CO2 in N2 to continuously remove the O2 produced by PS II. Interestingly, transcript levels for this sample were similar to those of the standard samples, which were grown at ambient O2 [1% (v/v) CO2 in air; Figure 3D]. However, a few genes showed strongly increased mRNA levels. Specifically, transcripts for acsF2, ho2, hemN2, and desF were 15- to 20-fold higher than in cells grown under standard conditions (Table 3). These four genes are clustered (Figure 7) and could potentially be transcribed as an operon. However, under dark fermentative conditions only acsF2 and ho2 showed a strong up-regulation, whereas hemN2 and desF transcript levels were similar to those for cells in standard conditions. This could either mean that multiple promoters exist that are differentially used, that transcription terminates at different places dependent upon growth conditions, or that transcript segments have different stabilities under some growth conditions. Three of these genes (hemN2, acsF2, ho2) code for enzymes involved in heme, chlorophyll and phycocyanobilin biosynthesis, respectively. The Synechococcus 7002 genome harbors multiple genes for each of these enzymes: acsF (SYNPCC7002_A0707) and acsF2 (SYNPCC7002_A1992), encoding magnesium-protoporphyrin IX monomethyl ester oxidative cyclases; hox1 (SYNPCC7002_A2508) and ho2 (SYNPCC7002_A1991), encoding heme oxygenases that synthesize biliverdin; and hemF (SYNPCC7002_A1828), hemN (SYNPCC7002_A2831), and hemN2 (SYNPCC7002_A1990) encoding coproporphyrinogen III oxidases. In contrast to acsF2, ho2, and hemN2, which exhibited much higher mRNA levels under micro-oxic conditions, the transcript levels of acsF, hox1, and hemF were essentially the same as for cells in standard conditions. Dark incubation, on the other hand, resulted in lower mRNA levels for acsF, hox1, and hemF (two- to three-fold lower under dark oxic conditions and 10- to 20-fold lower under dark anoxic conditions). The transcript levels of hemN, however, were somewhat higher under both micro-oxic (less than two-fold) and dark incubation (both oxic and anoxic; 1.5- to 2-fold) compared to levels in cells grown under standard conditions.
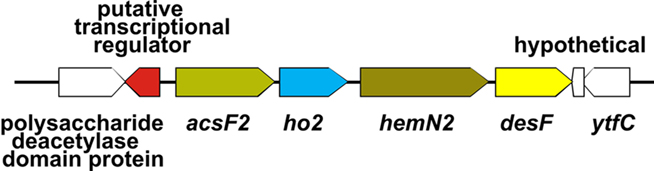
Figure 7. Organization of the acsF2 gene cluster. The acsF2 gene cluster comprises four genes (acsF2, ho2, hemN2, and desF). There is an ORF encoding a putative transcriptional regulator (SYNPCC7002_A1993) in the region upstream from acsF2 but encoded on the opposite strand.
Synechocystis 6803 also has an acsF2–ho2–hemN2 gene cluster encoded by ORFs sll1874, sll1875, sll1876. The expression and/or the activity of the respective enzymes has been reported to depend on oxygen levels (Minamizaki et al., 2008; Yilmaz et al., 2009; Goto et al., 2010). It has further been shown that the oxygen-dependent coproporphyrinogen III oxidase (HemF) is the major enzyme under ambient O2 levels, whereas one of the oxygen-independent HemN (sll1876) proteins is most active under micro-oxic conditions (Goto et al., 2010). The role of the second hemN (sll1917) gene product in Synechocystis 6803, with highest similarity (50% identity) to SYNPCC7002_A2831 (HemN) in Synechococcus 7002, is still unclear. In Synechocystis 6803 transcript levels of the clustered ORFs sll1874 (acsF2), sll1875 (ho2), and sll1876 (hemN2) coordinately increase under micro-oxic conditions (Minamizaki et al., 2008). Our data indicate that in Synechococcus 7002 orthologs of these three genes are possibly transcribed together under micro-oxic conditions with a fourth gene, desF, which encodes a acyl-lipid/fatty acid desaturase, a di-iron containing enzyme that uses O2 as a substrate.
Interestingly, transcripts for isiA, which encodes the iron stress induced, PS I-associated, chlorophyll a-binding IsiA protein, and isiB, which encodes flavodoxin, increased 15- and 30-fold, respectively, under micro-oxic conditions. Transcript levels for isiA and isiB, which are cotranscribed as an operon, greatly increase under Fe-limiting growth conditions (Leonhardt and Straus, 1992). This observation can be explained by lower Fe3+ availability under more reducing conditions than at ambient O2 levels. This suggestion is additionally supported by the fact that transcript levels for many genes coding for iron uptake systems also increased (up to 12-fold) under micro-oxic conditions compared to standard conditions (Table 3). Under both dark oxic and anoxic conditions, the isiA and isiB mRNA levels were lower compared to standard conditions, but genes encoding various iron uptake systems were also transcribed at levels similar to standard conditions, which suggested that a sufficient iron supply is available under these conditions. The requirement for iron is much lower in the dark, because synthesis of the photosynthetic apparatus, which consumes the majority of the iron taken up by cyanobacteria, is down-regulated in the dark (see above).
Transcriptional Changes in a Culture Undergoing Batch Growth Under Standard Conditions
To monitor changes in transcription during the transition from exponential growth to almost stationary phase, cells were harvested at different cell densities (OD730 nm = 0.4, 1.0, 3.0, and 5.0) during batch growth (see Figure 1; and Sakamoto and Bryant, 1998). When the transcription profiles for these samples were compared to those for standard conditions (OD730 nm = 0.7), it was found that transcript levels were relatively constant throughout the exponential growth phase (Figure 8). At OD730 nm values of 0.4 and 1.0, transcription changes differed by at most ∼10-fold compared to transcript levels at OD730 nm = 0.7. However, the reliability for many of these differences was low, because they were associated with ORFs whose expression levels were low. As the cell density increased beyond OD730 nm = 1.0, more differences in transcript levels were observed. At OD730 nm = 3.0 the maximal transcript-level differences increased to ∼17-fold, and at OD730 nm = 5.0, the maximal differences were ∼20-fold. Differences of these magnitudes are likely to be highly significant, but these differences are generally smaller than many of the changes in response to light and oxygen.
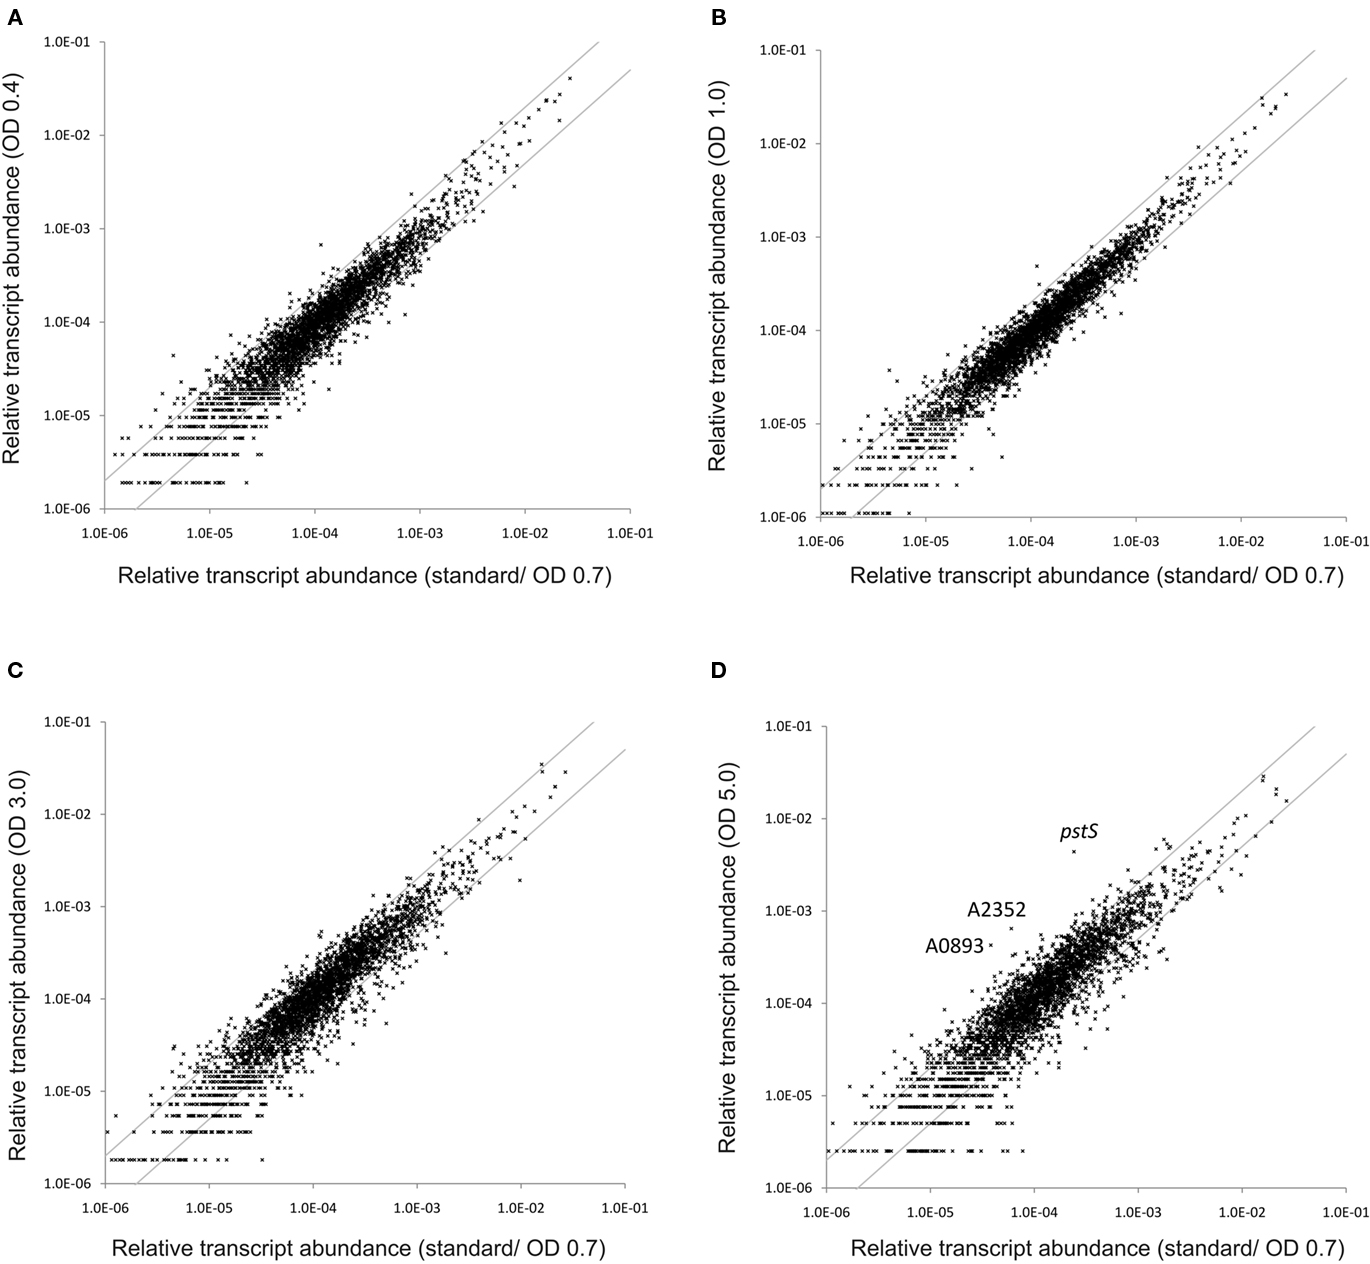
Figure 8. Changes in the relative transcript abundance throughout standard batch growth. The scatter plots show the relative transcript abundances (A) at OD730 nm = 0.4, (B) at OD730 nm = 1.0, (C) at OD730 nm = 3.0, and (D) at OD730 nm = 5.0 compared to those for standard conditions (at OD730 nm = 0.7). The gray lines indicate two-fold changes in either direction; selected genes are identified by name/locus tag number.
Transcripts for the pstS gene, encoding the substrate-binding protein of the phosphate transport system, increased about 20-fold at OD730 nm = 5.0 (Table 4). Transcripts for other genes associated with this phosphate uptake system (pstA, pstB, pstC) also increased two- to four-fold. Furthermore, transcript levels for a predicted phosphatase (SYNPCC7002_A0893) and alkaline phosphatase (SYNPCC7002_A2352) increased about 10-fold. Transcript levels for all of these genes were nearly constant at lower cell densities. Collectively, the results at higher cell densities resembled microarray data that were obtained from Synechococcus sp. WH8102 after phosphate limitation (Tetu et al., 2009; Ostrowski et al., 2010).
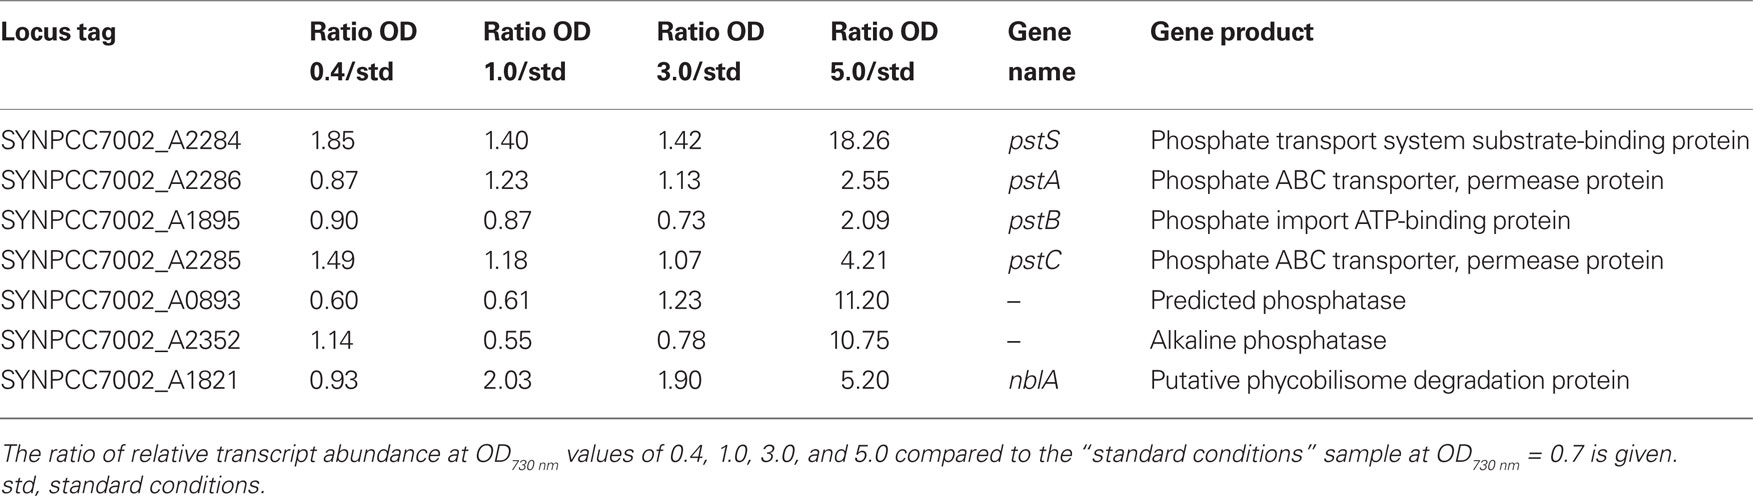
Table 4. Prominent changes in transcript levels at different culture densities of a batch culture.
As the cell density increased in the batch culture, transcript levels for nblA also increased. For example, at OD730 nm = 1.0 and 3.0, nblA transcripts were about two-fold higher than in cells under standard conditions, and at OD730 nm = 5.0, nblA transcripts were five-fold higher. NblA expression is associated with “chlorosis,” which occurs when phycobiliproteins are degraded by cyanobacterial cells in response to nutrient deprivation, high-light intensity and oxidative stress (Collier and Grossman, 1992, 1994; Bienert et al., 2006; Karradt et al., 2008). Nitrogen, sulfur, and carbon limitation generally produce the greatest increases in nblA expression (Collier and Grossman, 1994), but phosphate limitation can also cause chlorosis. For example, previous studies have shown that phosphate starvation was accompanied by extensive degradation of phycobiliproteins in Synechococcus sp. PCC 6301 and PCC 7002 (Batterton and van Baalen, 1968; Stevens et al., 1981). Because transcript levels for both nblA and phosphate acquisition increased in parallel at higher cell densities during batch growth, it is likely that cells growing in medium A+ in batch culture become phosphate-limited at OD730 nm values above ∼3.0. Interestingly, the transcript levels of genes involved in photosynthesis are not subject to major changes with increasing culture density (Table S2 in Supplementary Material), which is different from observations that have been made in Synechocystis 6803 (Foster et al., 2007).
Conclusion
The data presented in this study, which were obtained by deep sequencing of cDNA via SOLiD™ Next-Gen sequencing, identified mRNAs for nearly all annotated genes in the genome of Synechococcus 7002. The reproducibility of the method appears to be as good or better than microarrays, and the sequencing depth can be adapted to achieve virtually any desired dynamic range. The data clearly showed that cells significantly altered their transcription patterns for major metabolic processes (photosynthesis, CO2 fixation, sugar degradation, respiration) in response to changes in light and oxygen, and the observed changes were consistent with previous studies in this cyanobacterium and others. Greatly increased transcript levels for the genes encoding an alternative pathway for the conversion of phosphoenolpyruvate into acetyl-CoA suggests that this process occurs by completely different routes in Synechococcus 7002 during light/oxic and dark/anoxic conditions. Transcription changes for a putative acsF2–ho2–hemN2–desF operon suggest that the transcription of these genes may be directly regulated by oxygen concentration. If this proves to be the case, the transcription of these genes can be monitored as a reporter for attempts to modulate the intracellular oxygen concentrations in cells. Lowering the intracellular oxygen concentrations in cyanobacteria is a very important consideration in attempts to engineer cells for light-driven hydrogen production.
Acknowledgments
This research was supported by the Air Force Office of Scientific Research (MURI Grant FA9550-05-1-0365). The research was also supported by the Genomic Science Program (GSP) of the U.S. Department of Energy (DOE), Office of Biological and Environmental Research (BER). This contribution originates from the GSP Foundational Scientific Focus Area (FSFA) and Biofuels Scientific Focus Area (BSFA) of the Pacific Northwest National Laboratory. The authors also thank Dr. Craig Praul and Candace Price for advice and oversight of cDNA sequencing in the Genomics Core Facility (Huck Institutes for the Life Sciences, Penn State University) and Zhenfeng Liu for assistance in establishing the data processing pipeline. The authors additionally gratefully acknowledge Dr. Stephan C. Schuster, Dr. Nicola Wittekindt, and Lynn Tomsho for assistance in performing the pyrosequencing analyses of cDNA preparations.
Supplementary Material
The Supplementary Material for this article can be found online at http://www.frontiersin.org/microbial_physiology_and_metabolism/abstract/9540
Conflict of Interest Statement
The authors declare that the research was conducted in the absence of any commercial or financial relationships that could be construed as a potential conflict of interest.
References
Appel, J., and Schulz, R. (1996). Sequence analysis of an operon of a NAD(P)-reducing nickel hydrogenase from the cyanobacterium Synechocystis sp. PCC 6803 gives additional evidence for direct coupling of the enzyme to NAD(P)H-dehydrogenase (complex I). Biochim. Biophys. Acta 1298, 141–147.
Ashby, M. K., and Mullineaux, C. W. (1999). The role of ApcD and ApcF in energy transfer from phycobilisomes to PS I and PS II in a cyanobacterium. Photosyn. Res. 61, 169–179.
Badger, M. R., and Price, G. D. (2003). CO2 concentrating mechanisms in cyanobacteria: molecular components, their diversity and evolution. J. Exp. Bot. 54, 609–622.
Baier, K., Lehmann, H., Stephan, D. P., and Lockau, W. (2004). NblA is essential for phycobilisome degradation in Anabaena sp. strain PCC 7120 but not for development of functional heterocysts. Microbiology 150, 2739–2749.
Battchikova, N., and Aro, E. M. (2007). Cyanobacterial NDH-1 complexes: multiplicity in function and subunit composition. Physiol. Plant. 131, 22–32.
Batterton, J. C., and van Baalen, C. (1968). Phosphorus deficiency and phosphate uptake in the blue-green alga Anacystis nidulans. Can. J. Microbiol. 14, 341–348.
Batterton, J. C. Jr., and van Baalen, C. (1971). Growth responses of blue-green algae to sodium chloride concentration. Arch. Mikrobiol. 76, 151–165.
Bernroitner, M., Zamocky, M., Pairer, M., Furtmüller, P. G., Peschek, G. A., and Obinger, C. (2008). Heme-copper oxidases and their electron donors in cyanobacterial respiratory electron transport. Chem. Biodivers. 5, 1927–1961.
Bienert, R., Baier, K., Volkmer, R., Lockau, W., and Heinemann, U. (2006). Crystal structure of NblA from Anabaena sp. PCC 7120, a small protein playing a key role in phycobilisome degradation. J. Biol. Chem. 281, 5216–5223.
Bröcker, M. J., Schomburg, S., Heinz, D. W., Jahn, D., Schubert, W. D., and Moser, J. (2010). Crystal structure of the nitrogenase-like dark operative protochlorophyllide oxidoreductase catalytic complex (ChlN/ChlB)2. J. Biol. Chem. 285, 27336–27345.
Bryant, D. A. (1994). The Molecular Biology of Cyanobacteria. Dordrecht: Kluwer Academic Publishers.
Campbell, E. L., Christman, H., and Meeks, J. C. (2008). DNA microarray comparisons of plant factor- and nitrogen deprivation-induced hormogonia reveal decision-making transcriptional regulation patterns in Nostoc punctiforme. J. Bacteriol. 190, 7382–7391.
Campbell, E. L., Summers, M. L., Christman, H., Martin, M. E., and Meeks, J. C. (2007). Global gene expression patterns of Nostoc punctiforme in steady-state dinitrogen-grown heterocyst-containing cultures and at single time points during the differentiation of akinetes and hormogonia. J. Bacteriol. 189, 5247–5256.
Cannon, G. C., Heinhorst, S., and Kerfeld, C. A. (2009). Carboxysomal carbonic anhydrases: structure and role in microbial CO2 fixation. Biochim. Biophys. Acta 1804, 382–392.
Cloonan, N., Forrest, A. R., Kolle, G., Gardiner, B. B., Faulkner, G. J., Brown, M. K., Taylor, D. F., Steptoe, A. L., Wani, S., Bethel, G., Robertson, A. J., Perkins, A. C., Bruce, S. J., Lee, C. C., Ranade, S. S., Peckham, H. E., Manning, J. M., McKernan, K. J., and Grimmond, S. M. (2008). Stem cell transcriptome profiling via massive-scale mRNA sequencing. Nat. Methods 5, 613–619.
Collier, J. L., and Grossman, A. R. (1992). Chlorosis induced by nutrient deprivation in Synechococcus sp. strain PCC 7942: not all bleaching is the same. J. Bacteriol. 174, 4718–4726.
Collier, J. L., and Grossman, A. R. (1994). A small polypeptide triggers complete degradation of light-harvesting phycobiliproteins in nutrient-deprived cyanobacteria. EMBO J. 13, 1039–1047.
de Lorimier, R., Bryant, D. A., Porter, R. D., Liu, W. Y., Jay, E., and Stevens, S. E. Jr. (1984). Genes for the alpha and beta subunits of phycocyanin. Proc. Natl. Acad. Sci. U.S.A. 81, 7946–7950.
Dibrova, D. V., Galperin, M. Y., and Mulkidjanian, A. Y. (2010). Characterization of the N-ATPase, a distinct, laterally transferred Na+-translocating form of the bacterial F-type membrane ATPase. Bioinformatics 26, 1473–1476.
Dong, C., Tang, A., Zhao, J., Mullineaux, C. W., Shen, G., and Bryant, D. A. (2009). ApcD is necessary for efficient energy transfer from phycobilisomes to photosystem I and helps to prevent photoinhibition in the cyanobacterium Synechococcus sp. PCC 7002. Biochim. Biophys. Acta 1787, 1122–1128.
Draghici, S., Khatri, P., Eklund, A. C., and Szallasi, Z. (2006). Reliability and reproducibility issues in DNA microarray measurements. Trends Genet. 22, 101–109.
Ehira, S., Ohmori, M., and Sato, N. (2003). Genome-wide expression analysis of the responses to nitrogen deprivation in the heterocyst-forming cyanobacterium Anabaena sp. strain PCC 7120. DNA Res. 10, 97–113.
Foster, J. S., Singh, A. K., Rothschild, L. J., and Sherman, L. A. (2007). Growth-phase dependent differential gene expression in Synechocystis sp. strain PCC 6803 and regulation by a group 2 sigma factor. Arch. Microbiol. 187, 265–279.
Fujita, Y., Murakami, A., Aizawa, K., and Ohki, K. (1994).“Short-term and long-term adaption of the photosynthetic apparatus: homeostatic properties of thylakoids,” in The Molecular Biology of Cyanobacteria, ed. D. A. Bryant (Dordrecht: Kluwer Academic Publishers), 677–692.
Gill, R. T., Katsoulakis, E., Schmitt, W., Taroncher-Oldenburg, G., Misra, J., and Stephanopoulos, G. (2002). Genome-wide dynamic transcriptional profiling of the light-to-dark transition in Synechocystis sp. strain PCC 6803. J. Bacteriol. 184, 3671–3681.
Goto, T., Aoki, R., Minamizaki, K., and Fujita, Y. (2010). Functional differentiation of two analogous coproporphyrinogen III oxidases for heme and chlorophyll biosynthesis pathways in the cyanobacterium Synechocystis sp. PCC 6803. Plant Cell Physiol. 51, 650–663.
Gutthann, F., Egert, M., Marques, A., and Appel, J. (2007). Inhibition of respiration and nitrate assimilation enhances photohydrogen evolution under low oxygen concentrations in Synechocystis sp. PCC 6803. Biochim. Biophys. Acta 1767, 161–169.
Hackenberg, C., Engelhardt, A., Matthijs, H. C., Wittink, F., Bauwe, H., Kaplan, A., and Hagemann, M. (2009). Photorespiratory 2-phosphoglycolate metabolism and photoreduction of O2 cooperate in high-light acclimation of Synechocystis sp. strain PCC 6803. Planta 230, 625–637.
Helman, Y., Tchernov, D., Reinhold, L., Shibata, M., Ogawa, T., Schwarz, R., Ohad, I., and Kaplan, A. (2003). Genes encoding A-type flavoproteins are essential for photoreduction of O2 in cyanobacteria. Curr. Biol. 13, 230–235.
Hihara, Y., Kamei, A., Kanehisa, M., Kaplan, A., and Ikeuchi, M. (2001). DNA microarray analysis of cyanobacterial gene expression during acclimation to high light. Plant Cell 13, 793–806.
Hihara, Y., Sonoike, K., Kanehisa, M., and Ikeuchi, M. (2003). DNA microarray analysis of redox-responsive genes in the genome of the cyanobacterium Synechocystis sp. strain PCC 6803. J. Bacteriol. 185, 1719–1725.
Huang, C., Yuan, X., Zhao, J., and Bryant, D. A. (2003). Kinetic analyses of state transitions of the cyanobacterium Synechococcus sp. PCC 7002 and its mutant strains impaired in electron transport. Biochim. Biophys. Acta 1607, 121–130.
Imanaka, H., Yamatsu, A., Fukui, T., Atomi, H., and Imanaka, T. (2006). Phosphoenolpyruvate synthase plays an essential role for glycolysis in the modified Embden–Meyerhof pathway in Thermococcus kodakarensis. Mol. Microbiol. 61, 898–909.
Kada, S., Koike, H., Satoh, K., Hase, T., and Fujita, Y. (2003). Arrest of chlorophyll synthesis and differential decrease of photosystems I and II in a cyanobacterial mutant lacking light-independent protochlorophyllide reductase. Plant Mol. Biol. 51, 225–235.
Karradt, A., Sobanski, J., Mattow, J., Lockau, W., and Baier, K. (2008). NblA, a key protein of phycobilisome degradation, interacts with ClpC, a HSP100 chaperone partner of a cyanobacterial Clp protease. J. Biol. Chem. 283, 32394–32403.
Knowles, V. L., and Plaxton, W. C. (2003). From genome to enzyme: analysis of key glycolytic and oxidative pentose-phosphate pathway enzymes in the cyanobacterium Synechocystis sp. PCC 6803. Plant Cell Physiol. 44, 758–763.
Kucho, K., Okamoto, K., Tsuchiya, Y., Nomura, S., Nango, M., Kanehisa, M., and Ishiura, M. (2005). Global analysis of circadian expression in the cyanobacterium Synechocystis sp. strain PCC 6803. J. Bacteriol. 187, 2190–2199.
Leonhardt, K., and Straus, N. A. (1992). An iron stress operon involved in photosynthetic electron transport in the marine cyanobacterium Synechococcus sp. PCC 7002. J. Gen. Microbiol. 138, 1613–1621.
Li, H., and Durbin, R. (2009). Fast and accurate short read alignment with Burrows–Wheeler transform. Bioinformatics 25, 1754–1760.
McNeely, K., Xu, Y., Ananyev, G., Bennette, N., Bryant, D. A., and Dismukes, C. G. (2010a). Characterization of a nifJ mutant of Synechococcus sp. strain PCC 7002 lacking pyruvate:ferredoxin oxidoreductase. Appl. Environ. Microbiol. doi: 10.1128/AEM.02792-10. [Epub ahead of print].
McNeely, K., Xu, Y., Bennette, N., Bryant, D. A., and Dismukes, G. C. (2010b). Redirecting reductant flux into hydrogen production via metabolic engineering of fermentative carbon metabolism in a cyanobacterium. Appl. Environ. Microbiol. 76, 5032–5038.
Minamizaki, K., Mizoguchi, T., Goto, T., Tamiaki, H., and Fujita, Y. (2008). Identification of two homologous genes, chlAI and chlAII, that are differentially involved in isocyclic ring formation of chlorophyll a in the cyanobacterium Synechocystis sp. PCC 6803. J. Biol. Chem. 283, 2684–2692.
Mizusawa, N., Sakurai, I., Sato, N., and Wada, H. (2009). Lack of digalactosyldiacylglycerol increases the sensitivity of Synechocystis sp. PCC 6803 to high light stress. FEBS Lett. 583, 718–722.
Monaghan, J. R., Epp, L. G., Putta, S., Page, R. B., Walker, J. A., Beachy, C. K., Zhu, W., Pao, G. M., Verma, I. M., Hunter, T., Bryant, S. V., Gardiner, D. M., Harkins, T. T., and Voss, S. R. (2009). Microarray and cDNA sequence analysis of transcription during nerve-dependent limb regeneration. BMC Biol. 7, 1. doi: 10.1186/1741-7007-7-1
Muraki, N., Nomata, J., Ebata, K., Mizoguchi, T., Shiba, T., Tamiaki, H., Kurisu, G., and Fujita, Y. (2010). X-ray crystal structure of the light-independent protochlorophyllide reductase. Nature 465, 110–114.
Nodop, A., Pietsch, D., Höcker, R., Becker, A., Pistorius, E. K., Forchhammer, K., and Michel, K. P. (2008). Transcript profiling reveals new insights into the acclimation of the mesophilic fresh-water cyanobacterium Synechococcus elongatus PCC 7942 to iron starvation. Plant Physiol. 147, 747–763.
Nomura, C. T., Persson, S., Shen, G., Inoue-Sakamoto, K., and Bryant, D. A. (2006a). Characterization of two cytochrome oxidase operons in the marine cyanobacterium Synechococcus sp. PCC 7002: inactivation of ctaDI affects the PS I:PS II ratio. Photosyn. Res. 87, 215–228.
Nomura, C. T., Sakamoto, T., and Bryant, D. A. (2006b). Roles for heme-copper oxidases in extreme high-light and oxidative stress response in the cyanobacterium Synechococcus sp. PCC 7002. Arch. Microbiol. 185, 471–479.
Ogawa, T., and Mi, H. (2007). Cyanobacterial NADPH dehydrogenase complexes. Photosyn. Res. 93, 69–77.
Ostrowski, M., Mazard, S., Tetu, S. G., Phillippy, K., Johnson, A., Palenik, B., Paulsen, I. T., and Scanlan, D. J. (2010). PtrA is required for coordinate regulation of gene expression during phosphate stress in a marine Synechococcus. ISME J. 4, 908–921.
Ott, R. L., and Longnecker, M. (2000). An Introduction to Statistical Methods and Data Analysis. Pacific Grove, CA: Duxbury Press.
Peschek, G. A., Obinger, C., and Paumann, M. (2004). The respiratory chain of blue-green algae (cyanobacteria). Physiol. Plant 120, 358–369.
Postier, B. L., Wang, H. L., Singh, A., Impson, L., Andrews, H. L., Klahn, J., Li, H., Risinger, G., Pesta, D., Deyholos, M., Galbraith, D. W., Sherman, L. A., and Burnap, R. L. (2003). The construction and use of bacterial DNA microarrays based on an optimized two-stage PCR strategy. BMC Genomics 4, 23. doi: 10.1186/1471-2164-4-23
Rowland, J. G., Pang, X., Suzuki, I., Murata, N., Simon, W. J., and Slabas, A. R. (2010). Identification of components associated with thermal acclimation of photosystem II in Synechocystis sp. PCC6803. PLoS ONE 5, e10511. doi: 10.1371/journal.pone.0010511
Sakamoto, T., and Bryant, D. A. (1998). Growth at low temperature causes nitrogen limitation in the cyanobacterium Synechococcus sp. PCC 7002. Arch. Microbiol. 169, 10–19.
Sakamoto, T., and Bryant, D. A. (2002). Synergistic effect of high-light and low temperature on cell growth of the Δ12 fatty acid desaturase mutant in Synechococcus sp. PCC 7002. Photosyn. Res. 72, 231–242.
Samartzidou, H., and Widger, W. R. (1998). Transcriptional and posttranscriptional control of mRNA from lrtA, a light-repressed transcript in Synechococcus sp. PCC 7002. Plant Physiol. 117, 225–234.
Sander, J., Nowaczyk, M., Buchta, J., Dau, H., Vass, I., Deák, Z., Dorogi, M., Iwai, M., and Rögner, M. (2010). Functional characterization and quantification of the alternative PsbA copies in Thermosynechococcus elongatus and their role in photoprotection. J. Biol. Chem. 285, 29851–29856.
Sato, N., Ohmori, M., Ikeuchi, M., Tashiro, K., Wolk, C. P., Kaneko, T., Okada, K., Tsuzuki, M., Ehira, S., Katoh, H., Okamoto, S., Yoshimura, H., Fujisawa, T., Kamei, A., Yoshihara, S., Narikawa, R., Hamano, T., Tabata, S., and Kuhara, S. (2004). Use of segment-based microarray in the analysis of global gene expression in response to various environmental stresses in the cyanobacterium Anabaena sp. PCC 7120. J. Gen. Appl. Microbiol. 50, 1–8.
Schaefer, M. R., and Golden, S. S. (1989). Differential expression of members of a cyanobacterial psbA gene family in response to light. J. Bacteriol. 171, 3973–3981.
Schmitz, O., and Bothe, H. (1996). The diaphorase subunit HoxU of the bidirectional hydrogenase as electron transferring protein in cyanobacterial respiration? Naturwissenschaften 83, 525–527.
Schmitz, O., Gurke, J., and Bothe, H. (2001). Molecular evidence for the aerobic expression of nifJ, encoding pyruvate:ferredoxin oxidoreductase, in cyanobacteria. FEMS Microbiol. Lett. 195, 97–102.
Singer, R. A., and Doolittle, W. F. (1974). Novel ribonucleic acid species accumulated in the dark in the blue-green alga Anacystis nidulans. J. Bacteriol. 118, 351–357.
Singh, A. K., Bhattacharyya-Pakrasi, M., Elvitigala, T., Ghosh, B., Aurora, R., and Pakrasi, H. B. (2009). A systems-level analysis of the effects of light quality on the metabolism of a cyanobacterium. Plant Physiol. 151, 1596–1608.
Singh, A. K., McIntyre, L. M., and Sherman, L. A. (2003). Microarray analysis of the genome-wide response to iron deficiency and iron reconstitution in the cyanobacterium Synechocystis sp. PCC 6803. Plant Physiol. 132, 1825–1839.
Stal, L. J. (1995). Physiological ecology of cyanobacteria in microbial mats and other communities. New Phytol. 131, 1–32.
Stal, L. J., and Moezelaar, R. (1997). Fermentation in cyanobacteria. FEMS Microbiol. Rev. 21, 179–211.
Steunou, A. S., Jensen, S. I., Brecht, E., Becraft, E. D., Bateson, M. M., Kilian, O., Bhaya, D., Ward, D. M., Peters, J. W., Grossman, A. R., and Kühl, M. (2008). Regulation of nif gene expression and the energetics of N2 fixation over the diel cycle in a hot spring microbial mat. ISME J. 2, 364–378.
Stevens, S. E., Paone, D. A. M., and Balkwill, D. L. (1981). Accumulation of cyanophycin granules as a result of phosphate limitation in Agmenellum quadruplicatum. Plant Physiol. 67, 716–719.
Stevens, S. E., and Porter, R. D. (1980). Transformation in Agmenellum quadruplicatum. Proc. Natl. Acad. Sci. U.S.A. 77, 6052–6056.
Stuart, R. K., Dupont, C. L., Johnson, D. A., Paulsen, I. T., and Palenik, B. (2009). Coastal strains of marine Synechococcus species exhibit increased tolerance to copper shock and a distinctive transcriptional response relative to those of open-ocean strains. Appl. Environ. Microbiol. 75, 5047–5057.
Summerfield, T. C., Toepel, J., and Sherman, L. A. (2008). Low-oxygen induction of normally cryptic psbA genes in cyanobacteria. Biochemistry 47, 12939–12941.
Tan, X., Varughese, M., and Widger, W. R. (1994). A light-repressed transcript found in Synechococcus PCC 7002 is similar to a chloroplast-specific small subunit ribosomal protein and to a transcription modulator protein associated with sigma 54. J. Biol. Chem. 269, 20905–20912.
Tetu, S. G., Brahamsha, B., Johnson, D. A., Tai, V., Phillippy, K., Palenik, B., and Paulsen, I. T. (2009). Microarray analysis of phosphate regulation in the marine cyanobacterium Synechococcus sp. WH8102. ISME J. 3, 835–849.
Tittmann, K. (2009). Reaction mechanisms of thiamin diphosphate enzymes: redox reactions. FEBS J. 276, 2454–2468.
Woodger, F. J., Bryant, D. A., and Price, G. D. (2007). Transcriptional regulation of the CO2-concentrating mechanism in a euryhaline, coastal marine cyanobacterium, Synechococcus sp. strain PCC 7002: role of NdhR/CcmR. J. Bacteriol. 189, 3335–3347.
Xu, Y. (2010). Synechococcus sp. PCC 7002: A Robust and Versatile Cyanobacterial Platform for Biofuels Development. Ph.D. thesis, The Pennsylvania State University, University Park, PA.
Xu, Y., Alvey, R. M., Byrne, P. O., Graham, J. E, Shen, G., and Bryant, D. A. (2011). Expression of genes in cyanobacteria: adaptation of endogenous plasmids as platforms for high-level gene expression in Synechococcus sp. PCC 7002. Methods Mol. Biol. 684, 273–293.
Yeates, T. O., Kerfeld, C. A., Heinhorst, S., Cannon, G. C., and Shively, J. M. (2008). Protein-based organelles in bacteria: carboxysomes and related microcompartments. Nat. Rev. Microbiol. 6, 681–691.
Yilmaz, M., Kang, I., and Beale, S. I. (2009). Heme oxygenase 2 of the cyanobacterium Synechocystis sp. PCC 6803 is induced under a microaerobic atmosphere and is required for microaerobic growth at high light intensity. Photosyn. Res. 103, 47–59.
Keywords: cyanobacteria, transcription profiling, Synechococcus 7002, cDNA sequencing, fermentation
Citation: Ludwig M and Bryant DA (2011) Transcription profiling of the model cyanobacterium Synechococcus sp. strain PCC 7002 by Next-Gen (SOLiD™) sequencing of cDNA. Front. Microbio. 2:41. doi: 10.3389/fmicb.2011.00041
Received: 07 January 2011;
Paper pending published: 27 January 2011;
Accepted: 22 February 2011;
Published online: 07 March 2011.
Edited by:
Thomas E. Hanson, University of Delaware, USACopyright: © 2011 Ludwig and Bryant. This is an open-access article subject to an exclusive license agreement between the authors and Frontiers Media SA, which permits unrestricted use, distribution, and reproduction in any medium, provided the original authors and source are credited.
*Correspondence: Donald A. Bryant, Department of Biochemistry and Molecular Biology, The Pennsylvania State University, S-235 Frear Building, University Park, PA 16802, USA. e-mail: dab14@psu.edu