 Wai K. Ma
- Department of Soil Science, University of Saskatchewan, Saskatoon, SK, Canada
Nitrous oxide (N2O) is a greenhouse gas with a global warming potential far exceeding that of CO2. Soil N2O emissions are a product of two microbially mediated processes: nitrification and denitrification. Understanding the effects of landscape on microbial communities, and the subsequent influences of microbial abundance and composition on the processes of nitrification and denitrification are key to predicting future N2O emissions. The objective of this study was to examine microbial abundance and community composition in relation to N2O associated with nitrification and denitrification processes over the course of a growing season in soils from cultivated and uncultivated wetlands. The denitrifying enzyme assay and  pool dilution methods were used to compare the rates of denitrification and nitrification and their associated N2O emissions. Functional gene composition was measured with restriction fragment length polymorphism profiles and abundance was measured with quantitative polymerase chain reaction. The change in denitrifier nitrous oxide reductase gene (nosZ) abundance and community composition was a good predictor of net soil N2O emission. However, neither ammonia oxidizing bacteria ammonia monooxygenase (bacterial amoA) gene abundance nor composition predicted nitrification-associated-N2O emissions. Alternative strategies might be necessary if bacterial amoA are to be used as predictive in situ indicators of nitrification rate and nitrification-associated-N2O emission.
Introduction
Nitrous oxide (N2O) is a greenhouse gas with 300 times the global warming potential of CO2 (Jungkunst and Fiedler, 2007) and can be produced by nitrification (Avrahami et al., 2002; Mintie et al., 2003) and denitrification (Cavigelli and Robertson, 2000; Rich et al., 2003). Nitrification and denitrification are important processes in the global nitrogen (N) cycle. Nitrification is the oxidation of NH3 to  via
via  (Horz et al., 2004) and denitrification is the respiratory reduction of
  and
and  to gaseous products, mainly N2O and N2 (Tiedje, 1994). Consequently, the rates of these two microbially mediated processes, and the controls on the rates of these two processes, are important determinants of soil N2O emissions.
Available C, N, and O2 are three proximal factors that control the rates of N2O production/consumption via nitrification and denitrification (Svensson et al., 1991; Cavigelli and Robertson, 2000; Avrahami et al., 2002). Land-use and landform (together referred to as landscape) are two long-term determinants of these proximal factors. The effects of land-use mainly influence nutrient availability (through fertilization and cropping) and soil disturbance (through tillage; Bruns et al., 1999; Stres et al., 2004). Landform affects O2 availability, nutrient distribution, and biological productivity through redistribution of water (Hayashi et al., 1998; Yates et al., 2006). Furthermore, seasonal changes in precipitation and temperature control the input of water into a landscape and its loss via evapotranspiration (Groffman et al., 2000).
The composition and abundance of the microbial community reflect the long-term climate, soil disturbance history, and resource availability imposed on soils (Cavigelli and Robertson, 2000; Rich et al., 2003) by landscape factors. Understanding the effects of landscape on microbial communities, and the subsequent influences of microbial abundance and composition on the processes of nitrification and denitrification are key to predicting future N2O emissions.
Traditionally, members of a microbial community were thought to be equivalent in function if they have a similar array of genes and enzymes (Cavigelli and Robertson, 2000). Evidence indicates that differences in ammonia oxidizing bacteria (AOB) and denitrifier community composition affect rates of nitrification and denitrification, which in turn may influence N2O emissions (Cavigelli and Robertson, 2000; Avrahami et al., 2002; Mintie et al., 2003; Rich et al., 2003; Webster et al., 2005). These studies indicate that N2O emissions can be altered through whole community adaptation or a change in the relative importance of certain members of the microbial community.
In a previous study, we determined that there was no difference in ammonia oxidizing bacterial amoA and denitrifier nosZ community composition between landforms in cultivated and uncultivated wetlands of a North American prairie pothole region (Ma et al., 2008). However, available soil N (Ma et al., 2008), soil organic carbon content (Bedard-Haughn et al., 2006a), and soil water regime (Yates et al., 2006) are different between land-uses (i.e., cultivated and uncultivated) in these wetland landscapes. We did not include AOA ammonia monooxygenase (archaeal amoA) since the role of AOA in nitrification in agricultural soils is still debatable (Di et al., 2009; Jia and Conrad, 2009) and AOA activity is not linked to nitrous oxide emissions (Di et al., 2010).
The objective of this study was to examine microbial abundance and community composition in relation to N2O associated with nitrification and denitrification processes over the course of a growing season in soils from cultivated and uncultivated wetlands. The abundance and community composition of AOB ammonia monooxygenase (bacterial amoA) and denitrifier nitrous oxide reductase (nosZ) genotypes were observed to (i) determine how these communities respond to different land-use and environmental conditions over time; and (ii) understand the possible correlations with N2O emissions via nitrification and denitrification processes.
Materials and methods
Study Site
The St. Denis National Wildlife Area (SDNWA) in central Saskatchewan, Canada (52°12′N, 106°5′W), is a typical example of the North American prairie pothole region. The wildlife area contains 216 wetlands distributed over an area of 3.84 km2 (Hogan and Conly, 2002). Slope classes range from 10 to 15% (Miller et al., 1985) and soils are in the Dark Brown soil zone with loamy unsorted glacial till parent materials (Weyburn association). Within the SDNWA, six ephemeral wetlands were selected: three cultivated and three uncultivated. Ephemeral wetlands are those depressions in hummocky terrains that contain standing water in the spring, but typically dry out during the growing season (Hayashi et al., 1998).
A detailed topographic survey of the site was completed and a digital elevation model was produced with a 5 m × 5 m grid cell extent (Yates et al., 2006). Locations in cultivated wetlands were classified as convex (CX), concave (CV), or cultivated depression (CD) center. Convex elements were topographically high positions with a positive profile curvature. Concave elements were positions with negative profile curvature. CD elements were level positions that collected rain or snowmelt water.
Uncultivated wetlands were non-agricultural portions of the site and included vegetated depressions, which were further classified as basin center (BC), riparian grass (RG), or riparian trees (RT). BC elements were level areas covered by a variety of 99 non-grasses. RG elements were a non-level fringe area surrounding the BC and covered with grasses such as Bromus inermis Leyss. RT were the outer region of these wetlands and consisted of a partial fringe of mixed trees and shrubs, such as Salix spp., Populus balsamifera L., and P. tremuloides Michx. (Hogan and Conly, 2002). Based on profile curvature, BC elements are analogous to CD elements, and RT elements are analogous to CV elements (Yates et al., 2006). RG elements and CX elements have dissimilar profile curvatures, but they represent the driest landforms within the respective wetland type and were therefore considered to be analogous.
Soil Sampling
Each landform element was replicated (n = 3) in space (Bedard-Haughn et al., 2006b). A total of 18 samples (2 land-uses × 3 wetlands × 3 landform elements) were collected on each of four sampling dates (June 1, July 13, August 16, and September 12, 2006). Each sample was a composite of five cores (0–15 cm depth; 15 cm diameter). Samples were placed on ice in coolers and transported to the laboratory where sub-samples were used immediately for denitrifying enzyme activity (DEA), gravimetric soil water content determination, and DNA extraction. The remainder was air dried (<24 h) to allow passage through a 2 mm sieve without smearing and stored at −20°C.
Soil Denitrifying Enzyme Activity Assay
Each soil sample was assessed for DEA on the day of sampling. The assay involved measuring the N2O formed after incubating anaerobic slurries for 3 h at ∼23°C. Each DEA slurry contained 10 g soil (field moist), 10 ml of a solution containing glucose (10 mM) and  (5 mM), and C2H2 (10%, v/v) in a 70 ml crimp-sealed serum bottle (Rich and Myrold, 2004). Nitrous oxide formation (N2Of) was also measured in anaerobic slurries that received the same treatment as DEA but without the C2H2. The ratio of N2Of to DEA (abbreviated as rN2O) was calculated (Cavigelli and Robertson, 2000). A 20 ml gas sample was withdrawn from the headspace of the slurry using a 20 cc disposable syringe equipped with a 25 gage needle and injected into a pre-evacuated 12 ml Exetainer® vial (Labco Ltd., UK). Concentrations of N2O in the headspace gas were determined using a gas chromatograph equipped with an electron capture detector (Yates et al., 2006). All values are expressed per gram of oven-dried soil (dried at 105°C for 24 h).
15N Stable Isotope Incubation
Soil cores were prepared by packing the processed field soils into a 10 ml volume in 55 ml glass culture tubes (22 mm inner diameter) to yield bulk densities similar to those observed in the field (Ma et al., 2008). Gravimetric soil water content was determined using standard procedures with an assumed particle density of 2.65 g cm−3 (Topp and Ferré, 2002). After packing, tubes were capped with parafilm and pre-incubated in the dark at room temperature (∼23°C) for 5 days. After this pre-incubation period, deionized water (0.5 ml) was added to moisten cores and the tubes were recapped with parafilm and stored for an additional 2 days prior to introduction of the 15N-labeled  . The soils were labeled by adding 1.0 ml of a solution containing 2 mg 98%-enriched
  (0.2 μg
  soil) to each tube. The soils were then brought to 70% water-filled pore space (WFPS) with deionized water. At time = 0 (i.e., immediately after WFPS adjustment), half the repacked cores were destructively sampled for ammonium and nitrate using a 2 M KCl extraction (Maynard et al., 2007). The remaining tubes (plus three blank tubes) were capped with rubber septa and incubated for 24 h at ∼23°C. At t = 24 h, a 20 ml gas sample from each tube was collected with a syringe and injected into pre-evacuated (flushed with He prior to evacuation), 12 ml Exetainer® vials (Labco Ltd., UK). The cores were then destructively sampled for ammonium and nitrate by using 2 M KCl extraction.
Gas and 2 M KCl extractable N samples were analyzed at the University of California at Davis Stable Isotope Facility using gas chromatography coupled with isotope ratio mass spectrometry (Europa Hydra 20/20; SerCon Ltd., Crewe, UK). Total N2O produced in 24 h, together with the 15N2O produced, was used to estimate the relative contribution of nitrification and denitrification to N2O emissions (Stevens et al., 1997). The emitted N2O was attributed to either denitrification  of the 15N-enriched
  pool or nitrification
  of the natural abundance NH4+ pool (Arah, 1997; Laughlin and Stevens, 2002). 15N2O denitrification rates are not reported. The diffusion disk technique (Stark and Hart, 1996) as modified by Bedard-Haughn et al. (2004) was used to collect soil ammonium and nitrate from KCl extracts. Total NH4+/NO3- and 15NH4+/15NO3- was used to determine nitrification rates by the pool dilution method and to check whether cycling of labeled N into the ammonium pool (i.e., dissimilatory nitrate reduction to ammonia) had occurred (Bedard-Haughn et al., 2006b).
DNA Extraction from Soils Treated with Ethidium Monoazide Bromide (EMA)
Prior to DNA extraction, soil samples were treated with EMA to differentiate between DNA from viable versus non-viable microorganisms (Nogva et al., 2003; Cenciarini-Borde et al., 2009; Delgado-Viscogliosi et al., 2009). Ethidium monoazide bromide can intercalate double-stranded DNA, but because EMA cannot enter intact cells, it can only bind to extracellular DNA or DNA in cells with compromised membranes. Therefore, EMA can prevent the replication of DNA from non-viable organisms during polymerase chain reaction (PCR). The EMA treatment of soils followed Pisz et al. (2007). Soil DNA was extracted using the method described by Griffiths et al. (2000), except that soil mass was 1.0 g (field moist), centrifugation was at 14,000 × g and DNA were precipitated in PEG overnight at 20°C.
Quantitative PCR
Quantitative PCR (QPCR) was performed on all samples to determine the abundance of bacterial amoA and denitrifier nosZ, using the procedures and conditions reported by Ma et al. (2008). The primer sets amoA-1F/amoA-2R (Rotthauwe et al., 1997) and nosZ-F/nosZ-R (Rich et al., 2003) were used to amplify amoA and nosZ, respectively. Prior to QPCR, all DNA extracts were diluted to the same concentration. Amplification was carried out using the QuantiTect™ SYBR® Green PCR Master Mix real-time PCR kit (Qiagen). Thermal cycling and quantification was carried out using an ABI 7500 real-time PCR machine (Applied Biosystems). For nosZ, the standard curve was generated with DNA from Pseudomonas stutzeri (ATCC 14405). The standard for amoA was the amoA-1F/amoA-2R amplified PCR product from one of the soil extracts. All standards derived from soil were cloned and sequenced to confirm primer specificity. QPCR were performed in duplicate and amplification efficiencies were between 95 and 99%. Melting curve analysis was performed on each well and only those samples demonstrating melting curves similar to the control samples were used. QPCR results were expressed as number of gene copies per gram oven-dried soil (dried at 105°C for 24 h).
Cloning and RFLP Analysis of PCR Products
At our study site there is no landform difference in bacterial amoA and nosZ community composition (Ma et al., 2008). Therefore, we only evaluated community composition in water-accumulating landforms (i.e., the CD and BC elements). Community composition analysis was also limited to samples from the start (June 1) and end (September 12) of the sampling season, because the greatest difference in gene abundance and measured activity occurred between these two dates.
Fragments of amoA and nosZ were amplified, cloned, and analyzed for restriction fragment length polymorphism (RFLP). Procedures and conditions for amplifying amoA and nosZ fragments follow Ma et al., 2008. PCR products of the expected size (490 bp for bacterial amoA and 700 bp for nosZ) were excised after agarose gel electrophoresis, purified using QIAquick® Gel Extraction Kit (Qiagen), and cloned using TOPO® TA Cloning Kit (Invitrogen). Forty-eight clones were selected for each sample and gene combination. Clones were screened for the proper inserted fragment by PCR product size. The PCR product for each clone was then used in three separate reactions with the endonucleases AluI, HhaI, and RsaI (Invitrogen) and visualized by agarose gel electrophoresis (3% w/v gel; 80 V for 90 min). Clones were classified into operational taxonomic units (OTUs) based on the combination of the three separate RFLP patterns.
Based on indicator species analysis (McCune and Mefford, 2002), five clones from each indicator OTU – clones that differed significantly between land-use and time for each gene – were sequenced at the National Research Council Plant Biotechnology Institute (Saskatoon, SK, Canada) using the amoA-1F or nosZ-F primer. A consensus sequence for each OTU was generated by alignment in ClustalX (v1.81) and edited with GeneDoc (v2.6). Phylogenetic trees using the cloned sequences were created using the programs DNADIST (Jukes–Cantor model), NEIGHBOR (neighbor-joining method; out-group = Nitrosomonas europaea accession L08050 for amoA and Ralstonia eutropha accession X65278 for nosZ), and SEQBOOT available in the PHYLIP (v3.5c) computer package (Felsenstein, 1997).
Statistical Analyses
Data were imported into SPSS 14.0 and log transformed to meet ANOVA assumptions (using the Anderson–Darling test for normality and Bartlett’s and Levene’s tests for homogeneity of variance). Pearson correlations were used to examine the potential temporal relationships between amoA and nosZ abundance with the corresponding N2O emitting functions.
Land-use and temporal differences in the community composition based on the presence/absence of OTUs were graphically examined by non-metric multidimensional scaling (NMS) using the autopilot program with the slow and thorough analysis option and the default settings in PC-ORD v4.0 (McCune and Mefford, 1999). NMS is a non-parametric ordination method suited to community data because it avoids the assumptions about the underlying structure of the data made by other ordination methods (Kenkel and Orlóci, 1986; Clarke, 1993). Functional variables (e.g., nitrification rate for amoA and DEA for nosZ) were correlated to NMS axes to evaluate the relationship between community composition and measured functions. Coefficients of determination (r2) between functional variables and NMS axes were displayed as vectors radiating from the centroid of the NMS plot. The vector is the hypotenuse of a right triangle whose sides represent the r2 of the function to the individual NMS axes (McCune and Mefford, 2002). A multi-response permutation procedure (MRPP; Zimmerman et al., 1985) with Sørensen’s distance was used to test the hypothesis of no difference in community composition between land-use and time. The MRPP T-statistic describes the separation between groups (the more negative the T-value, the stronger the separation); the A-statistic describes within-group relatedness relative to that expected by chance alone (if A = 1, all items in a group are homogeneous; if A = 0, there is no similarity between items in a group; McCune and Mefford, 2002). Indicator species analysis was used to identify OTUs that differentiated communities by land-use and time (Rich et al., 2003; Rich and Myrold, 2004). The significance (α = 0.1) of the indicator values were tested using a Monte Carlo simulation of 1000 runs, where samples were randomly reassigned to groups and indicator values recalculated.
Results
Ammonia Oxidizing Bacteria and Denitrifier Abundance and Activity
Regardless of land-use or landform, AOB abundance increased up to 10-fold during the course of the sampling season (Figures 1A,D). Nitrification rates (Figures 1B,E) and nitrification-associated-N2O emissions (Figures 1C,F), in contrast, declined up to three-fold during the same period. Negative correlations between AOB abundance and nitrification rate (r = −0.466) and nitrification-associated-N2O (r = −0.267) were significant (Table 1). Nitrification rate and nitrification-associated-N2O emission were positively correlated (r = 0.344).
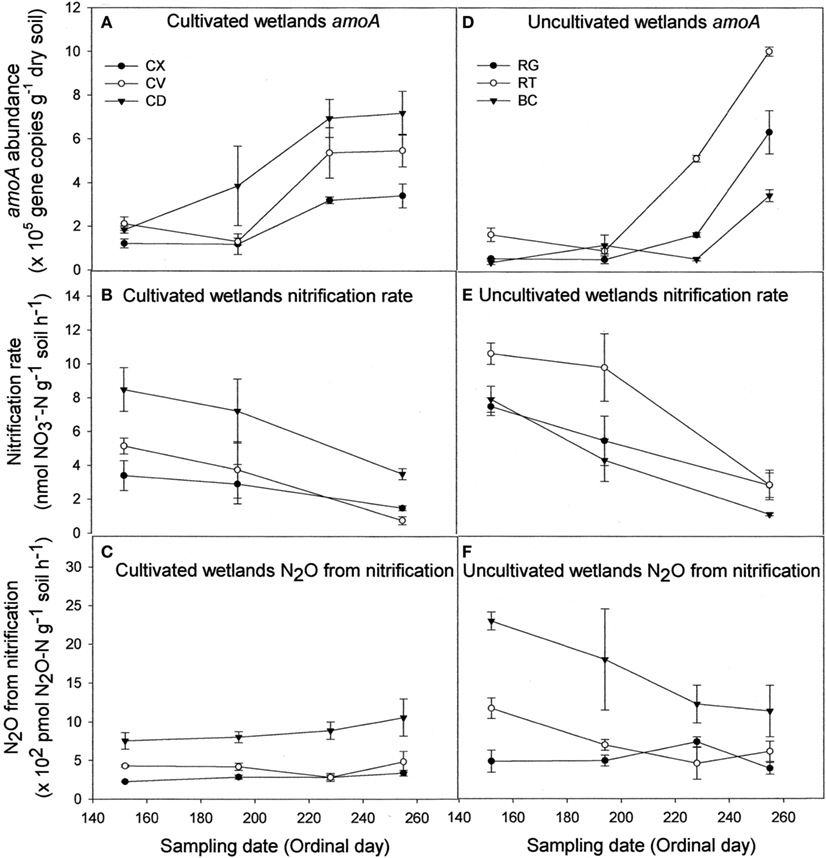
Figure 1. Abundance of nitrifier amoA copies (A,D), nitrification rate (B,E), and N2O emission attributable to nitrification (C,F) for cultivated (A–C) and uncultivated (D–F) wetland soils. Locations in cultivated wetlands (CW) were classified as either convex (CX), concave (CV), or cultivated depression (CD) center. Uncultivated wetlands were divided into three landform elements, basin center (BC), surrounded by a non-level fringe area covered with grasses (RG) and an outer region consisting of trees of shrubs (RT). Based on profile curvature, BC elements are analogous to CD elements, and RT elements are analogous to CV elements. Riparian grass (RG) elements and CX elements represent the driest landforms within the respective wetland type. Reported values are means (n = 3) with SE bars.
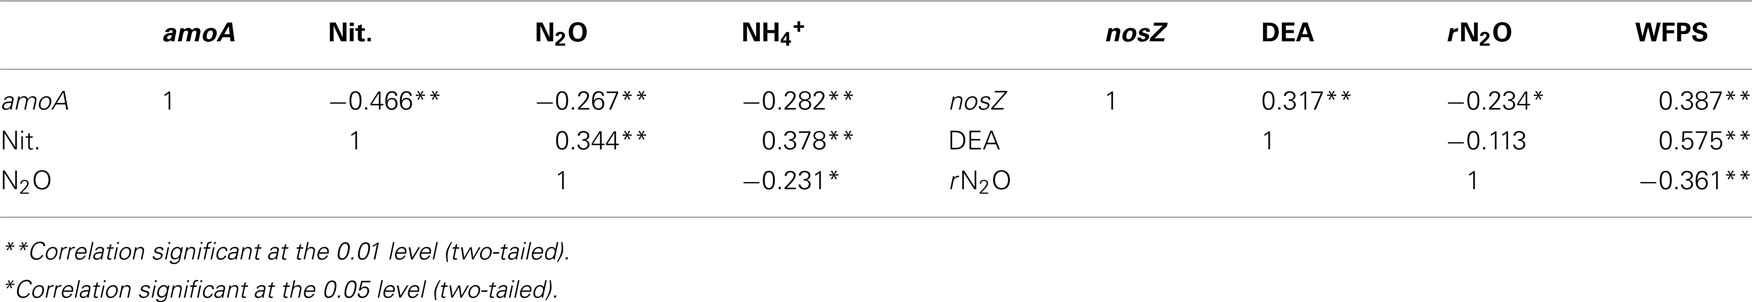
Table 1. Correlations between amoA and nosZ abundance with 15N-N2O produced from nitrification and denitrification enzyme assay and water-filled pore space, respectively.
Contrary to bacterial amoA abundance, denitrifier nosZ abundance declined during the sampling season in all soils (Figures 2A,E). The gross potential N2O production activity as described by the DEA results did not change during the season (Figures 2B,F). However, the rN2O ratio increased over time (Figures 2C,G) and was negatively correlated to nosZ abundance (Table 1). Denitrifier abundance and DEA were positively correlated to percent WFPS at the time of soil sampling, while rN2O was negatively correlated to WFPS (Figures 2D,H; Table 1).
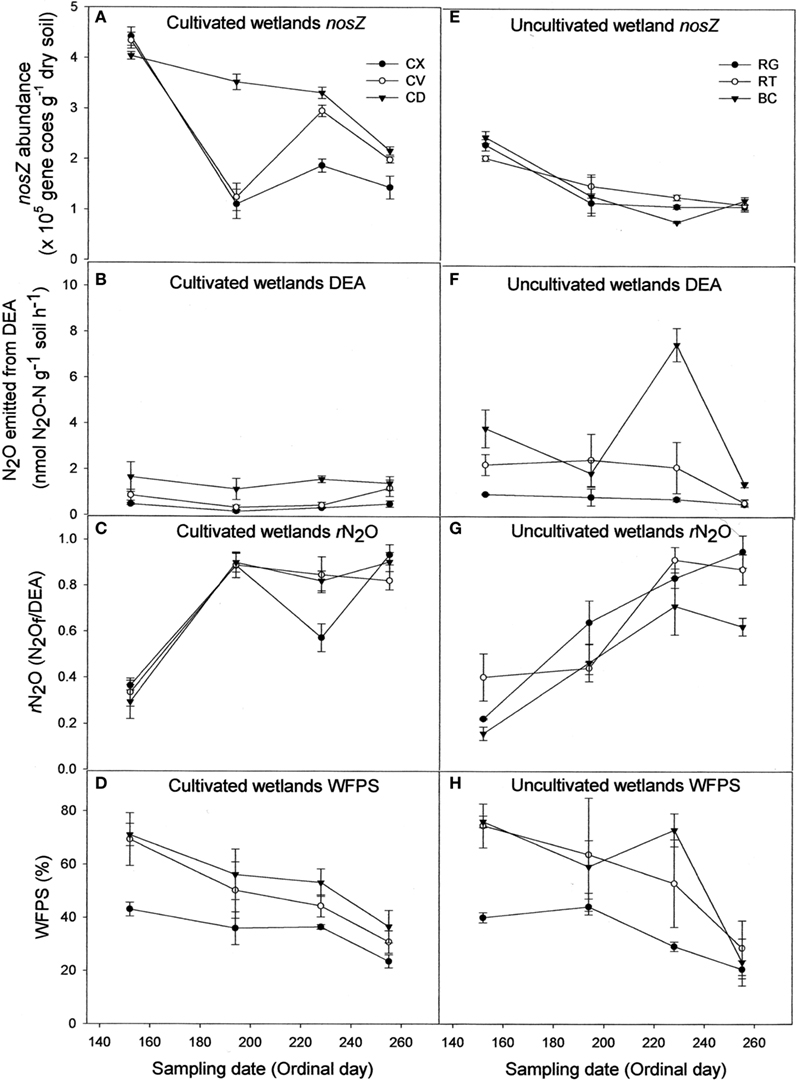
Figure 2. Abundance of denitrifier nosZ copies (A,E), N2O emitted from denitrification enzyme assay [DEA; (B,F)], rN2O [N2Of/DEA; (C,G)], and percentage water-filled pore space [WFPS; (D,H)] for cultivated (A–D) and uncultivated (E–H) wetland soils. Locations in cultivated wetlands (CW) were classified as either convex (CX), concave (CV), or cultivated depression (CD) center. Uncultivated wetlands were divided into three landform elements, basin center (BC), surrounded by a non-level fringe area covered with grasses (RG) and an outer region consisting of trees or shrubs (RT). Based on profile curvature, BC elements are analogous to CD elements, and RT elements are analogous to CV elements. Riparian grass (RG) elements and CX elements represent the driest landforms within the respective wetland type. Reported values are means (n = 3) with SE bars.
Ammonia Oxidizing Bacteria and Denitrifier Community Composition and Activity
The amoA NMS produced a two-dimensional solution, with r2 = 0.42 and 0.54 for Axis 1 (time) and 2 (land-use), respectively (Figure 3).Therefore, nearly all (96%) of the true variance structuring the difference in amoA community composition was a function of time and land-use as represented in this ordination space. The correlation coefficients (r) for nitrification rate and nitrification-associated-N2O emission were −0.86 and 0.10, respectively. Therefore, 75% of the variation (r2) in nitrification rate, but only 1% of the variation in N2O associated with nitrification, can be related to the temporal difference in amoA community composition. WFPS at the time of soil sampling in the field also had a negative correlation to change in amoA community composition over time. In comparison, land-use related difference in amoA community composition can account for 11 and 20% of the variability in nitrification rate and N2O from nitrification, respectively.
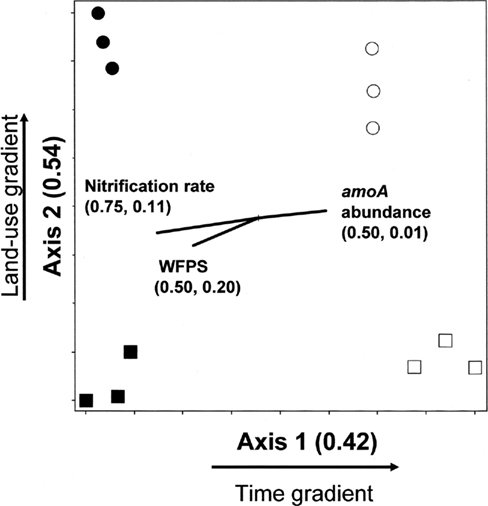
Figure 3. Non-metric multidimensional scaling ordination of nitrifying communities based on presence/absence of operational taxonomic units (OTUs) defined by amoA RFLP patterns. □ = Jun 01; cultivated wetlands. ■ = Sep 12; cultivated wetlands. ○ = Jun 01; uncultivated wetlands. ● = Sep 12; uncultivated wetlands. Vectors show the direction and magnitudes of the correlation coefficient (r2) between NMS ordination axes and functional variables. The r2 for the correlation between functional variable and axis 1 and axis 2 are in parentheses (in the order r2 to axis 1, r2 to axis 2).
Five amoA OTUs were identified as indicator species. Four of the five OTUs grouped within Cluster 3 of AOB (Figure 4). These four OTUs increased in proportional abundance over time in one or both land-uses (Figure 5). Only amoA OTU 17 grouped within Cluster 2, and its proportional abundance declined.
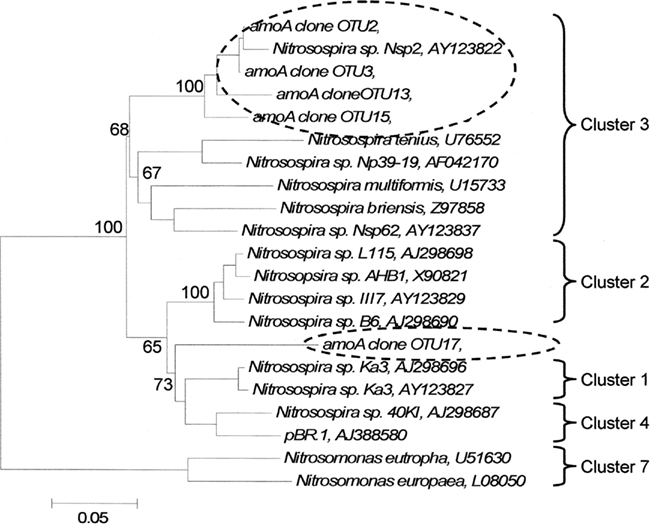
Figure 4. Phylogenetic tree of cloned amoA operational taxonomic units that significantly delineated land-use as determined by indicator species analysis. Broken ovals highlight cloned sequences from this study. The label of the sequence used in the analysis is followed by their respective GenBank accession. Branch nodes with bootstrap values greater than 60 are labeled. Cluster labels based on Horz et al. (2004). OTU17 could not exclusively be included with Cluster 1 or 4, but it has common lineage with both clusters. Scale bar indicates 5 changes per 100 nucleotide positions.
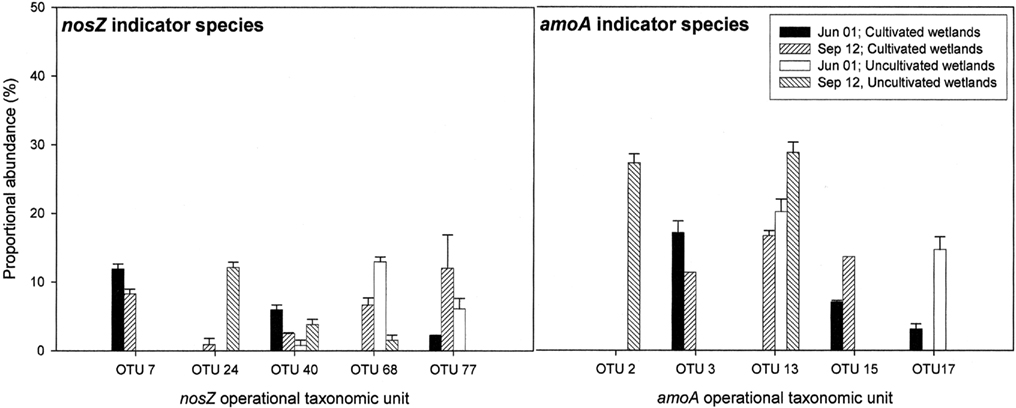
Figure 5. nosZ and amoA operational taxonomic units (as defined by RFLP) that differed significantly between land-use and time based on indicator species analysis (P < 0.1). Results are means with SE (n = 3). Proportional abundance is the percentage of recovered clones with the defined RFLP.
The NMS identified a two-dimensional solution for the differences in denitrifier community composition, with r2 = 0.40 and 0.29 for Axis 1 (land-use) and 2 (time), respectively (Figure 6). Therefore, 69% of the true variance structuring the differences in denitrifier community composition was a function of land-use and time as represented in this ordination solution. The MRPP confirmed that communities differed as the result of land-use and time (Table 2). The joint plot of nosZ abundance, DEA, rN2O, and WFPS indicated these parameters correlated strongly with the time gradient (54, 57, 65, and 43% respectively; Figure 6). The difference in denitrifier community composition over time was correlated to difference in denitrifier abundance and activity and soil moisture at the time of sampling.
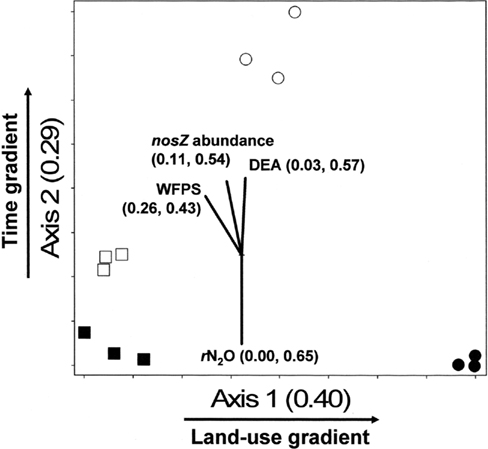
Figure 6. Non-metric multidimensional scaling (NMS) ordination of denitrifying communities based on presence/absence of operational taxonomic units (OTUs) defined by nosZ RFLP patterns. □ = Jun 01; cultivated wetlands (CW). ■ = Sep 12; cultivated wetlands (BC). ○ = Jun 01; uncultivated wetlands. ● = Sep 12; uncultivated wetlands. Vectors show the direction and magnitudes of the correlation coefficient (r2) between NMS ordination axes and functional variables. The r2 for the correlation between functional variable and axis 1 and axis 2 are in parentheses (in the order r2 to axis 1, r2 to axis 2). Note: only functions with r2 ≥ 40% to either NMS axes are shown in joint plots.
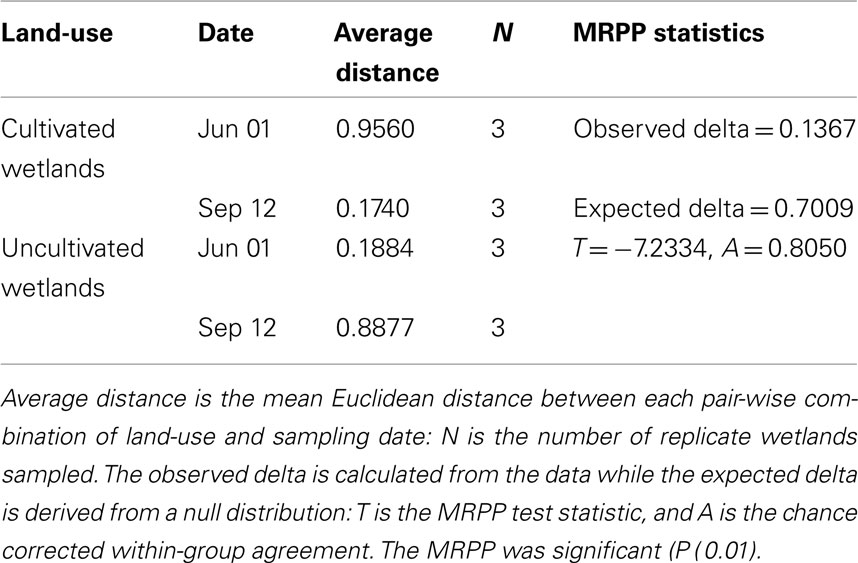
Table 2. Results of the multi-response permutation procedure (MRPP) testing of the null hypothesis of no significant difference in denitrifier nosZ community composition between land-use and time (Date).
Indicator species analysis was used to identify nosZ OTUs that differentiated denitrifier communities based on land-use and time. Five nosZ OTUs were identified that significantly differentiated denitrifier communities (P < 0.1). There was no discernable pattern in proportional abundance for these OTUs (Figure 5). However, OTU 7 was the only nosZ genotype exclusive to cultivated wetland soils, and OTU 24 was the only genotype exclusive to the September 12 sampling date for both land-uses. The majority of these OTUs clustered with Rhizobiaceae of the α-Proteobacteria (Figure 7). Only OTU 24 had greater than 80% sequence similarity to a nosZ sequence from a previously cultured and identified bacteria (100% coverage and 86% identity with Bradyrhizobium japonicum, accession AJ002531).
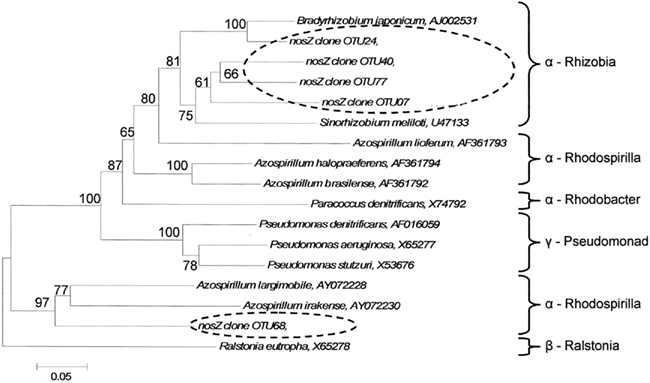
Figure 7. Phylogenetic tree of cloned nosZ operational taxonomic units that significantly delineated land-use and time as determined by indicator species analysis. Broken ovals highlight cloned sequences from this study. The label of the sequence used in the analysis is followed by their respective GenBank accession. Branch nodes with bootstrap values greater than 60 are labeled. Scale bar indicates 5 changes per 100 nucleotide positions.
Discussion
We found abundance and community composition of bacterial amoA and denitrifier nosZ to be structured by both time and land-use. While temporal abundance of denitrifier nosZ appears to be related to potential soil N2O emissions, temporal abundance of bacterial amoA abundance was negatively correlated with nitrification and nitrification-associated-N2O. Environmental conditions, seasonal shifts in community composition and nitrification activity, as well as, methodological limitations may account for this trend in amoA abundance. While differences in community composition between land-use were observed for both bacterial amoA and denitrifier nosZ, these differences were not clearly linked to N2O emitting activity. However, differences in denitrifier nosZ community composition over time were correlated with differences in denitrifier abundance, denitrifier activity and soil moisture at the time of sampling.
The temporal abundance of denitrifier nosZ is related to potential soil N2O emission because nosZ abundance directly affects nitrous oxide reductase activity (NOS). Accordingly, we found NOS activity declined (rN2O increased) as abundance of nosZ declined. The abundance of active denitrifiers based on nosZ abundance reported here is similar to that observed using qPCR-based reports (Baudoin et al., 2009) but approximately 10 to 100 times lower than that reported for cultivation-based enumeration from other soils (McCarty et al., 2007).
A negative correlation between bacterial amoA abundance and nitrification activity is counter-intuitive. Varying environmental conditions, community composition and nitrification activity, as well as, methodological limitations may account for this discrepancy. Changes in environmental conditions (i.e., available water, N, and O2) could cause an increase in abundance of certain populations, which may alter AOB community composition (Table 3). For example, Webster et al. (2005) demonstrated members of Nitrosospira cluster 3a were present in soils at low levels until ammonia concentrations were reduced. Therefore, community composition and abundance of specific AOBs must be considered in combination to assess the rates of different processes, such as nitrification. Within the context of our observations, the resultant AOB communities might shift from a community with populations that are highly active to a community with populations that are less active, over the course of a growing season. Thus, in the latter part of the growing season nitrifier abundance is not directly proportional to activity, because early season growth, results in nitrifier biomass that is no longer active late in the season. Alternatively, another microbial population may be oxidizing ammonia to nitrate, but this nitrification activity is erroneously assigned to AOB due to our inability to separate their independent contributions.
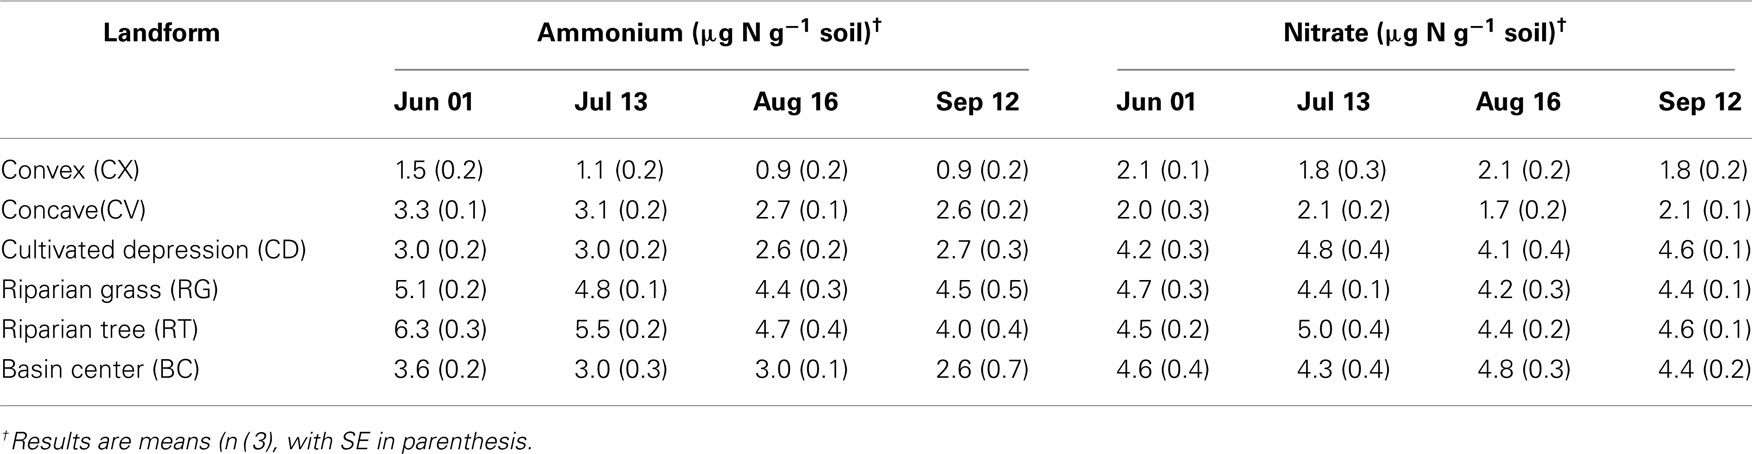
Table 3. Two molar KCl extractable ammonium and nitrate concentrations in soils from each landform class in the St. Denis National Wildlife Area collected June 1st–September 12th, 2006.
Gene copy numbers alone cannot account for the myriad of transcriptional responses a dynamic AOB community might have in response to changes in environmental conditions. Freitag and Prosser (2009) observed an incongruity between methyl coenzyme M reductase sub-unit A gene (mcrA) abundance for methanogens and methanogenesis. However, they found a significant predictive relationship between the ratio of mcrA transcripts to gene copies and the rate of methanogenesis. This ratio might be an improved indicator of process rates because it normalizes the response of each population to environmental condition (i.e., transcripts) and to their relative abundance (i.e., gene abundance). A similar approach might be necessary to better understand the relationship between bacterial amoA abundance, nitrification rate, and nitrification-associated-N2O emissions.
In addition, our 15N isotope labeling methodology has limitations. By using only 15N-labeled ammonium and nitrate, cross feeding of nitrifier produced  and
and  to denitrification is masked. Wrage et al., 2005 present a dual labeling approach that employs an 18O–15N-enrichment method allowing for distinction between nitrous oxide (N2O) from nitrification, nitrifier denitrification and denitrification. Use of a dual labeling approach may have improved our ability to discriminate between the contributions of nitrifier and conventional denitrification to total N2O production.
In our study, amoA abundance is only about 10% of that reported by other investigators (Jia and Conrad, 2009; Offre et al., 2009). Higher amoA abundance reported in other studies, likely reflects measurement of whole community DNA, including non-viable copies of amoA. We measured only the viable organisms because we had pre-treated the soil samples with EMA to isolate these organisms. We previously evaluated EMA efficiency on nitrifiers and found that it worked well, however this evaluation was limited to polar soils (Pisz et al., 2007). It is possible that the EMA technique is under-reporting amoA abundance in these agriculture soils. While all inhibitors have significant drawbacks, an alternative inhibitor, such as propidium monoazide (PMA) may reduce the possibility of under-reporting due to EMA penetrating intact cells and removing target DNA (Nocker et al., 2006). Intact cell membranes are impermeable to PMA and several studies have used PMA to differentiate naked DNA and dead cells from bacteria with an intact cell membrane (Nocker et al., 2007; Yergeau et al., 2010).
In soils from the water-accumulating landforms, differences in nosZ community composition over time were linked to N2O emitting activity. However, differences in community composition between land-use were not linked to N2O emitting activity. The effects of nosZ are greater than what is explained by environmental factors (e.g., soil water content) alone (Rich et al., 2003). We found WFPS accounts for 33 and 13% of the variation in DEA and rN2O, respectively. In contrast, less than 5% of the variation in DEA and rN2O is correlated to the land-use differences in the nosZ community composition (Figure 6). These findings are in agreement with those of Ma et al. (2008), who found no relationship between nosZ community composition and denitrification-associated-N2O emission as a function of landscape. In agricultural systems others have also found no link between nosZ community composition and N2O emission (Rich and Myrold, 2004; Enwall et al., 2005), however, nosZ and N2O have been linked in meadow and forest soils (Rich et al., 2003).
Conclusion
In our study, both amoA and nosZ changed dramatically over the course of the season, but only nosZ was related to differences in potential N2O emissions. Differences in community composition between land-use (i.e., cultivated and uncultivated) were not clearly linked to the N2O emitting activity of amoA or of nosZ. The negative correlation between bacterial amoA abundance and nitrification and nitrification-associated-N2O may be in response to several factors. Changing environmental conditions, seasonal shifts in community composition and nitrification activity, as well as, methodological limitations may act in concert to result in a negative correlation. Regardless, our study indicates that nosZ may be an effective tool to monitor denitrifier contributions to N2O emissions in a field setting. To characterize N2O emissions from ammonia oxidation processes, however, a more refined genetic target or approach is clearly needed.
Conflict of Interest Statement
The authors declare that the research was conducted in the absence of any commercial or financial relationships that could be construed as a potential conflict of interest.
Acknowledgments
This research was supported by a BioCap Strategic Grant to Steven D. Siciliano and Richard E. Farrell and a GreenCrop network grant to Steven D. Siciliano. Wai K. Ma designed the study, collected and processed the molecular and biochemical data, as well as prepared the manuscript. Richard E. Farrell contributed to experimental design, 15N interpretation, and composition of the manuscript. Steven D. Siciliano helped with experimental design, did the molecular data analysis, and contributed to the manuscript. Special thanks to Drs Angela Bedard-Haughn and Eric Lamb for critical evaluation of the manuscript and assistance with specialized data analysis.
References
Arah, J. R. M. (1997). Apportioning nitrous oxide fluxes between nitrification and denitrification using gas-phase mass spectrometry. Soil Biol. Biochem. 29, 1295–1299.
Avrahami, S., Conrad, R., and Braker, G. (2002). Effects of soil ammonium concentrations on N2O release and on the community structure of ammonia oxidizers and denitrifiers. Appl. Environ. Microbiol. 68, 5685–5692.
Baudoin, E., Philippot, L., Cheneby, D., Chapui-Lardy, L., Fromin, N. Bru, D., Rabary, and B., and Brauman, A. (2009). Direct seeding mulch-based cropping increases both the activity and the abundance of denitrifier communities in a tropical soil. Soil Biol. Biochem. 41, 1703–1709.
Bedard-Haughn, A., Jongbloed, F., Akkerman, J., Uijl, A., de Jong, E., Yates, T., and Pennock, D. J. (2006a). The effects of erosional and management history on soil organic carbon stores in ephemeral wetlands of hummocky agricultural landscapes. Geoderma 135, 296–306.
Bedard-Haughn, A., Matson, A. L., and Pennock, D. J. (2006b). Land use effects on gross nitrogen mineralization, nitrification, and N2O emissions in ephemeral wetlands. Soil Biol. Biochem. 38, 3398–3406.
Bedard-Haughn, A., Tate, K. W., and van Kessel, C. (2004). Using nitrogen-15 to quantify vegetative buffer effectiveness for sequestering nitrogen in runoff. J. Environ. Qual. 33, 2252–2262.
Bruns, M. A., Stephen, J. R., Kowalchuk, G. A., Prosser, J. I., and Paul, E. A. (1999). Comparative diversity of ammonia oxidizer 16S rRNA gene sequences in native, tilled, and successional soils. Appl. Environ. Microbiol. 65, 2994–3000.
Cavigelli, M. A., and Robertson, G. P. (2000). The functional significance of denitrifier community composition in a terrestrial ecosystem. Ecology 81, 1402–1414.
Cenciarini-Borde, C., Courtois, S., and La Scola, B. (2009). Nucleic acids as viability markers for bacterial detection using molecular tools. Future Microbiol. 4, 45–64.
Clarke, K. R. (1993). Non-parametric multivariate analyses of changes in community structure. Aust. J. Ecol. 18, 117–143.
Delgado-Viscogliosi, P., Solignac, L., and Delattre, J. M. (2009). Viability PCR, a culture-independent method for rapid and selection quantification of viable Legionella pneumophila cells in environmental water samples. Appl. Environ. Microbiol. 75, 3502–3512.
Di, H. J., Cameron, K. C., Shen, J. P., Winefield, C. S., O’Callaghan, M., Bowatte, S., and He, J. Z. (2009). Nitrification driven by bacteria and not archaea in nitrogen-rich grassland soils. Nat. Geosci. 2, 621–624.
Di, H. J., Cameron, K. C., Sherlock, R. R., Shen, J. P., He, J. Z., and Winefield, C. S. (2010). Nitrous oxide emissions from grazed grassland as affected by a nitrification inhibitor, dicyandiamide, and relationships with ammonia-oxidizing bacteria and archaea. J. Soil Sediments 10, 943–954.
Enwall, K., Philippot, L., and Hallin, S. (2005). Activity and composition of the denitrifying bacterial community respond differently to long-term fertilization. Appl. Environ. Microbiol. 71, 8335–8343.
Felsenstein, J. (1997). An alternating least squares approach to inferring phylogenies from pairwise distances. System. Biol. 46, 101–111.
Freitag, T. E., and Prosser, J. I. (2009). Correlation of methane production and functional gene transcriptional activity in a peat soil. Appl. Environ. Microbiol. 75, 6679–6687.
Griffiths, R. I., Whiteley, A. S., O’Donnell, A. G., and Bailey, M. J. (2000). Rapid method for coextraction of DNA and RNA from natural environments for analysis of ribosomal DNA- and rRNA-based microbial community composition. Appl. Environ. Microbiol. 66, 5488–5491.
Groffman, P. M., Brumme, R., Butterbach-Bahl, K., Dobbie, K. E., Mosier, A. R., Ojima, D. S., Papen, H., Partin, W. J., Smith, K. A., and Wagner-Riddle, C. (2000). Evaluating annual nitrous oxide fluxes at the ecosystem scale. Global Biogeochem. Cycles 14, 1061–1070.
Hayashi, M., Van der Kamp, G., and Rudolph, D. L. (1998). Water and solute transfer between a prairie wetland and adjacent uplands, 1. Water balance. J. Contam. Hydrol. 207, 42–55.
Hogan, J. M., and Conly, F. M. (2002). St. Denis National Wildlife Area Land Cover Classification: 1997. Technical Report Series No. 384. Canadian Wildlife Service, Prairie and Northern Region, Saskatoon.
Horz, H. P., Barbrook, A., Field, C. B., and Bohannan, B. J. M. (2004). Ammonia-oxidizing bacteria respond to multifactorial global change. Proc. Natl. Acad. Sci. U.S.A. 101, 15136–15141.
Jia, Z., and Conrad, R. (2009). Bacteria rather than archaea dominate microbial ammonia oxidation in an agricultural soil. Environ. Microbiol. 11, 1658–1671.
Jungkunst, H. F., and Fiedler, S. (2007). Latitudinal differentiated water table control of carbon dioxide, methane and nitrous oxide fluxes from hydromorphic soils: feedbacks to climate change. Global Change Biol. 13, 2668–2683.
Kenkel, N. C., and Orlóci, L. (1986). Applying metric and nonmetric multidimensional-scaling to ecological studies: some new results. Ecology 67, 919–928.
Laughlin, R. J., and Stevens, R. J. (2002). Evidence for fungal dominance of denitrification and codenitrification in a grassland soil. Soil Sci. Soc. Am. J. 66, 1540–1548.
Ma, W. K., Bedard-Haughn, A., Siciliano, S. D., and Farrell, R. E. (2008). Relationship between nitrifier and denitrifier community composition and abundance in predicting nitrous oxide emissions from ephemeral wetland soils. Soil Biol. Biochem. 40, 1114–1123.
Maynard, D. G., Kalra, Y. P., and Crumbaugh, J. A. (2007). “Nitrate and exchangeable ammonium nitrogen,” in Soil Sampling and Methods of Analysis, 2nd Edn, eds M. R. Carter, and E. D. Gregorich (Boca Raton: CRC Press), 71–80.
McCarty, G. W., Mookherji, S., and Angier, J. T. (2007). Characterization of denitrification activity in zones exfiltration within a riparian wetland ecosystem. Biol. Fertil. Soils 43, 691–698.
McCune, B., and Mefford, M. J. (1999). PC-ORD: Multivariate Analysis of Ecological Data. Gleneden Beach, OR: MjM Software Design.
McCune, B., and Mefford, M. J. (2002). Analysis of Ecological Communities. Gleneden Beach, OR: MjM Software Design.
Miller, J. J., Acton, D. F., and St. Arnaud, R. J. (1985). The effect of groundwater on soil formation in a morainal landscape in Saskatchewan. Can. J. Soil Sci. 65, 293–307.
Mintie, A. T., Heichen, R. S., Cromack, K., Myrold, D. D., and Bottomley, P. J. (2003). Ammonia-oxidizing bacteria along meadow-to-forest transects in the Oregon Cascade Mountains. Appl. Environ. Microbiol. 69, 3129–3136.
Nocker, A., Cheung, C. Y., and Camper, A. K. (2006). Comparison of propidium monoazide with ethidium monoazide for differentiation of live vs. dead bacteria by selective removal of DNA from dead cells. J. Microbiol. Methods 67, 310–320.
Nocker, A., Sossa-Fernandez, P., Burr, M. D., and Camper, A. K. (2007). Use of propidium monoazide for live/dead distinction in microbial ecology. Appl. Environ. Microbiol. 73, 5111–5117.
Nogva, H. K., Drømtorp, S. M., Nissen, H., and Rudi, K.. (2003). Ethidium monoazide for DNA-based differentiation of viable and dead bacteria by 5′-nuclease PCR. BioTechniques 34, 804–813.
Offre, P., Prosser, J. I., and Nicol, G. W. (2009). Growth of ammonia-oxidizing archaea in soil microcosms is inhibited by acetylene. FEMS Microbiol. Ecol. 70, 99–108.
Pisz, J. M., Lawrence, J. R., Schafer, A. N., and Siciliano, S. D. (2007). Differentiation of genes extracted from non-viable versus viable micro-organisms in environmental samples using ethidium monoazide bromide. J. Microbiol. Methods 71, 312–318.
Rich, J. J., Heichen, R. S., Bottomley, P. J., Cromack, K., and Myrold, D. D. (2003). Community composition and functioning of denitrifying bacteria from adjacent meadow and forest soils. Appl. Environ. Microbiol. 69, 5974–5982.
Rich, J. J., and Myrold, D. D. (2004). Community composition and activities of denitrifying bacteria from adjacent agricultural soil, riparian soil, and creek sediment in Oregon, USA. Soil Biol. Biochem. 36, 1431–1441.
Rotthauwe, J. H., Witzel, K. P., and Liesack, W. (1997). The ammonia monooxygenase structural gene amoA as a functional marker: molecular fine-scale analysis of natural ammonia-oxidizing populations. Appl. Environ. Microbiol. 63, 4704–4712.
Stark, J. M., and Hart, S. C. (1996). Diffusion technique for preparing salt solutions, Kjeldahl digests, and persulfate digests for nitrogen-15 analysis. Soil Sci. Soc. Am. J. 60, 1846–1855.
Stevens, R. J., Laughlin, R. J., Burns, L. C., Arah, J. R. M., and Hood, R. C. (1997). Measuring the contributions of nitrification and denitrification to the flux of nitrous oxide from soil. Soil Biol. Biochem. 29, 139–151.
Stres, B., Avgustin, G., and Tiedje, J. M. (2004). Nitrous oxide reductase gene fragments differ between native and cultivated Michigan soils. Appl. Environ. Microbiol. 70, 301–309.
Svensson, B. H., Klemedtsson, L., Simkins, S., Paustian, K., and Rosswall, T. (1991). Soil denitrification in three cropping systems characterized by differences in nitrogen and carbon supply.1. Rate-distribution frequencies, comparison between systems and temporal N-losses. Plant Soil 138, 257–271.
Tiedje, J. M. (1994). “Denitrifiers,” in Microbiological and Biochemical Properties, Vol. 5, Methods of Soil Analysis, Part 2, eds R. W. Weaver, J. S. Angle, and P. Bottomley (Madison, WI: Soil Science Society of America), 245–267.
Topp, G. C., and Ferré, P. A. (2002). ”Water Content,” in Methods of Soil Analysis, Part 1, Physical and Mineralogical Properties, eds J. Dane, and C. Topp (Madison, WI: Soil Science Society of America), 417–545.
Webster, G., Embley, T. M., Freitag, T. E., Smith, Z., and Prosser, J. I. (2005). Links between ammonia oxidizer species composition, functional diversity and nitrification kinetics in grassland soils. Environ. Microbiol. 7, 676–684.
Wrage, N., van Groenigen, J. W., Oenema, O., and Baggs, E. M. (2005). A novel dual-isotope labelling method for distinguishing between soil sources of N2O. Rapid Commun. Mass Spectrom. 19, 3298–3306.
Yates, T. T., Si, B. C., Farrell, R. E., and Pennock, D. J. (2006). Wavelet spectra of nitrous oxide emission from hummocky terrain during spring snowmelt. Soil Sci. Soc. Am. J. 70, 1110–1120.
Yergeau, E., Hogues, H., Whyte, L. G., and Greer, C. W. (2010). The functional potential of high Arctic permafrost revealed by metagenomic sequencing, qPCR and microarray analyses. ISME J. 4, 1206–1214.
Keywords: bacterial amoA, denitrification, nitrous oxide emissions, nitrification, nosZ, agriculture
Citation: Ma WK, Farrell RE and Siciliano SD (2011) Nitrous oxide emissions from ephemeral wetland soils are correlated with microbial community composition. Front. Microbio. 2:110. doi: 10.3389/fmicb.2011.00110
Received: 02 February 2011; Accepted: 05 May 2011;
Published online: 10 June 2011.
Edited by:
Josh David Neufeld, University of Waterloo, CanadaReviewed by:
Marc Gregory Dumont, Max-Planck-Institute for Terrestrial Microbiology, GermanyThomas Erich Freitag, University of Aberdeen, UK
Copyright: © 2011 Ma, Farrell and Siciliano. This is an open-access article subject to a non-exclusive license between the authors and Frontiers Media SA, which permits use, distribution and reproduction in other forums, provided the original authors and source are credited and other Frontiers conditions are complied with.
*Correspondence: Steven D. Siciliano, Department of Soil Science, University of Saskatchewan, 51 Campus Drive, Saskatoon, SK, Canada S7N 5A8. e-mail: steven.siciliano@usask.ca