
- 1 Hawaii Institute of Marine Biology, School of Ocean and Earth Science and Technology, University of Hawaii, Kaneohe, HI, USA
- 2 Limnology, Department of Ecology and Genetics, Uppsala University, Uppsala, Sweden
- 3 Department of Microbiology, University of Hawaii, Honolulu, HI, USA
The exploration of bacterial diversity in the global ocean has revealed new taxa and previously unrecognized metabolic potential; however, our understanding of what regulates this diversity is limited. Using terminal restriction fragment length polymorphism (T-RFLP) data from bacterial small-subunit ribosomal RNA genes we show that, independent of depth and time, a large fraction of bacterioplankton co-occurrence patterns are non-random in the oligotrophic North Pacific subtropical gyre (NPSG). Pair-wise correlations of all identified operational taxonomic units (OTUs) revealed a high degree of significance, with 6.6% of the pair-wise co-occurrences being negatively correlated and 20.7% of them being positive. The most abundant OTUs, putatively identified as Prochlorococcus, SAR11, and SAR116 bacteria, were among the most correlated OTUs. As expected, bacterial community composition lacked statistically significant patterns of seasonality in the mostly stratified water column except in a few depth horizons of the sunlit surface waters, with higher frequency variations in community structure apparently related to populations associated with the deep chlorophyll maximum. Communities were structured vertically into epipelagic, mesopelagic, and bathypelagic populations. Permutation-based statistical analyses of T-RFLP data and their corresponding metadata revealed a broad range of putative environmental drivers controlling bacterioplankton community composition in the NPSG, including concentrations of inorganic nutrients and phytoplankton pigments. Together, our results suggest that deterministic forces such as environmental filtering and interactions among taxa determine bacterioplankton community patterns, and consequently affect ecosystem functions in the NPSG.
Introduction
The bulk of the world’s ocean is oligotrophic and, in terms of both biomass and ecosystem function, is dominated by microorganisms (Cho and Azam, 1988). Microbes with diverse, yet specific physiological requirements and ecological roles mediate nearly all energy and material fluxes within this vast biome (Azam, 1998; Herndl et al., 2008). These fluxes have been suggested to be products of multiple interactions within the microbial community, rather than those of single populations (Little et al., 2008; Strom, 2008). Therefore, an understanding of the processes that determine the composition of bacterioplankton communities is imperative in order to formulate accurate estimates and models of open ocean biogeochemistry. Despite increasing efforts to understand emergent patterns in the abundances and distributions of microbial taxa in seawater (e.g., Morris et al., 2002; Fuhrman et al., 2006; Johnson et al., 2006; Carlson et al., 2009; Eiler et al., 2009), the mechanisms that determine patterns observed in entire microbial communities remain largely unknown (Fuhrman and Steele, 2008; Steele et al., 2011). This stands in contrast to macroorganismal ecology, where the ecological mechanisms that underlie and maintain community patterns (beta-diversity) and (alpha-) diversity (often termed “assembly rules”) have been a central theme (e.g., Keddy and Weiher, 2001). Patterns in alpha- and beta-diversity of macroorganisms have been suggested to be the result of the interplay between regional and local processes: regional processes include dispersal, historical legacies, speciation, extinction, and geographic and climatic conditions, whereas local processes include interactions among organisms, and between organisms and their local environment.
Recently, microbial ecologists have begun to adopt many theoretical ecological frameworks upon which the microbial world can be explored and, eventually, predicted (e.g., Horner-Devine et al., 2004; Green and Bohannan, 2006; Martiny et al., 2006; Prosser et al., 2007). For example, microbial ecologists are now exploring whether microbial communities are distinct in (or specific to) different habitats, and if metrics of microbial diversity (alpha- and beta-diversity) show explainable patterns comparable to those of macroorganisms (e.g., Fuhrman et al., 2006; Horner-Devine et al., 2007; Prosser et al., 2007).
The balance between stochastic and deterministic processes in determining the structure of pelagic microbial communities in the open ocean has received little direct attention. If stochastic processes dominate, then open ocean communities may appear as random combinations of taxa, whereas, if deterministic processes dominate, then predictable patterns of taxa distributions and abundances may be observed. In order to test if community assembly is mainly established non-randomly and thus by deterministic forces, computer simulations can be used that compare simulated, randomly assembled communities with experimental data. Such an assessment can be achieved by analyzing taxa co-occurrence patterns via the approach proposed by Diamond (1975) and modified by Gotelli and McCabe (2002). Using this approach, non-random co-occurrence patterns have been shown to be the rule for macroorganisms (Gotelli and McCabe, 2002), and have also been demonstrated for microorganisms in a number of habitats (Horner-Devine et al., 2007). Environmental filtering and competition (Diamond, 1975; Gotelli and McCabe, 2002), and/or biogeographic and evolutionary history (Vuilleumier and Simberloff, 1980; Cracraft, 1988) are thought to be important deterministic processes that determine community composition.
However, in order to explore the mechanisms that determine community composition, it is not sufficient to describe patterns in community structure and to demonstrate that co-occurrence patterns are random or non-random; the explicit mechanisms that underlie the emergent community patterns need to be identified. Statistical tools allow for the exploration of community drivers through the correlation and/or correspondence among taxa and between taxa and environmental variables.
In the present study, we aimed to explore patterns in bacterioplankton community structure within water samples collected from various depths over a 3-year period at Station ALOHA in the North Pacific subtropical gyre (NPSG), the world’s largest oligotrophic marine ecosystem (Karl, 1999). Our analysis revealed that deterministic mechanisms prevail in assembling the bacterioplankton community at Station ALOHA, and that associations among taxa, as well as between taxa and environmental variables such as nutrient and pigment concentrations, are common and predictable.
Materials and Methods
Site Description and Ancillary Data
Station ALOHA (22°45’N, 158°00’W) is located in the NPSG 100 km north of Oahu, Hawaii. The Hawaii Ocean Time-series (HOT) program1 (Karl and Lukas, 1996) has made repeated observations of the hydrography, chemistry, and biology of the water column at Station ALOHA approximately once per month since October 1988. Sampling and analytical protocols are described elsewhere (Dore and Karl, 1996; Karl and Lukas, 1996; Letelier et al., 1996; Karl et al., 2001; Church et al., 2005). Metadata used for multivariate statistical analyses were downloaded from the HOT Data Organization and Graphical System (HOT-DOGS) website2. Environmental variables used in this study are listed in Table A2 in Appendix.
Sample Collection and DNA Extraction
Seawater samples were collected from discrete depths using 12 L polyvinyl chloride (PVC) bottles attached to a CTD rosette sampler, and sub-sampled into acid-rinsed 4 L polypropylene bottles. Three different sampling protocols were used throughout the study period (November 2004 to July 2008). For samples from cruises conducted between 2004–2006 (HOT cruises 165–185), 1–2 L of each sub-sample was filtered through 25 mm diameter, 0.22 μm pore-sized hydrophilic polyvinylidene difluoride (PVDF) membrane filters (Durapore; Millipore Corp., Billerica, MA, USA). The filters were placed in 2.0 mL microcentrifuge tubes containing 500 μL of Tris–EDTA (TE) buffer, immediately quick frozen in liquid nitrogen, and stored at −80°C until further processing. DNA was extracted and stored at −20°C following the protocol described by Church et al. (2009). For samples from cruises 186–193, 0.5–4 L of each sub-sample was filtered onto 13 mm diameter, 0.2 μm pore-sized polyethersulfone membrane filters (Supor-200; Pall Corp., Port Washington, NY, USA). The membrane filters were subsequently stored in 2 mL screw-cap tubes containing 250 μL of DNA lysis buffer [20 mM Tris HCl (pH 8.0), 2 mM EDTA (pH 8.0), 1.2% (vol/vol) Triton X100, and 20 μg/mL lysozyme] at −80°C until extraction. For HOT cruises 197–200, ca. 4 L sub-samples were filtered onto 25 mm diameter, 0.2 μm pore-sized polyethersulfone membranes (Pall Corp.), and subsequently stored at −80°C in 500 μL of DNA lysis buffer. DNA was extracted from cruises 185–200 using the Qiagen DNeasy 96 Tissue Kit (Qiagen Inc., Valencia, CA, USA) following the manufacturer’s recommended protocol for bacteria. Extracts were quantified using the PicoGreen fluorescent assay (Invitrogen Corp., Carlsbad, CA, USA) on a SpectraMax M2 plate reader (Molecular Devices Corp., Sunnyvale, CA, USA).
Terminal Restriction Fragment Length Polymorphism Analysis
Two microliter of each DNA extract (equivalent to ca. 1–100 ng of genomic DNA) was used as template for the polymerase chain reaction (PCR) amplification of bacterial small subunit (SSU) ribosomal RNA (rRNA) genes. Individual 50 μL reactions contained 1× PicoMaxx reaction buffer (Stratagene, La Jolla, CA, USA), 200 μM of each deoxynucleotide, 200 nM each of the fluorescently labeled general bacterial SSU rRNA gene oligonucleotide primer 27F-B-6FAM (5′-[6∼FAM]AGRGTTYGATYMTGGCTCAG-3′) and universal SSU rRNA gene oligonucleotide primer 1492R (5′-GGYTACCTTGTTACGACTT-3′; Lane, 1991) and 0.625 units PicoMaxx thermostable DNA polymerase (Stratagene). Cycling conditions consisted of an initial denaturation step of 95°C for 5 min, followed by 35 cycles of 95°C denaturation for 30 sec, 55°C annealing for 1 min, and 72°C extension for 2 min, with a final extension step at 72°C for 20 min. PCR products were purified using the QIAquick Multiwell PCR Purification system (Qiagen Inc.), and digested in 20 μL reactions containing 4 μg acetylated bovine serum albumin (BSA), 1X MULTI-CORE enzymatic reaction buffer (Promega, Madison, WI, USA), and 10 units of HaeIII restriction endonuclease (Promega). After a 6-h incubation at 37°C, the digests were terminated by incubation at 70°C for 20 min, and purified using the Millipore MultiScreen Assay System (Millipore Corp.) in conjunction with Sephadex G-50 Superfine (GE Healthcare, Piscataway, NJ, USA). Approximately 100 ng of the purified products were electrophoresed on an ABI 3100 Genetic Analyzer (Applied Biosystems, Foster City, CA, USA). Operational taxonomic units (OTUs) were identified as peaks between 30 and 600 bp in length, using GeneMapper v4.0 software (Applied Biosystems, Foster City, CA, USA). Terminal restriction fragment length polymorphism (T-RFLP) profiles were first run through an in-house MATLAB (The MathWorks, Natick, MA, USA) script that corrects for instrumental drift while rounding fractional peaks to whole numbers. In brief, this script identified peaks with ambiguous decimal increments (i.e., x.3–x.6) and ensured that they were rounded to the same integer throughout all profiles by using a majority rule (i.e., rounded up if most were > x.5 and vice versa). Non-ambiguous decimal increments (i.e., <x.3 and >x.6) were simply rounded to their nearest integer. The profiles then underwent a limited manual curation in order to further compensate for instrumental drift, and finally normalized using a variable threshold (Osborne et al., 2006). Peaks were transformed into relative units by dividing integrated peak areas by the total peak area for that sample. Diversity (evenness) was estimated from the relative units using the Gini coefficient (Wittebolle et al., 2009). The Gini coefficient provides a proxy for the equality of taxa distributions: the higher the Gini coefficient, the more uneven a community is.
Putative identification of abundant OTUs was performed using clone library data obtained from both coastal and open ocean sites in the vicinity of Hawaii, including Station ALOHA. Representative clones were characterized by Sanger sequencing and fragment sizing after restriction digests to correlate phylogenetic identity with terminal restriction fragment length. Sequences were deposited in Genebank under accession number JN166096 to JN166367.
Statistical analyses. Statistical analyses were performed using the software packages PRIMER 6 (PRIMER-E Ltd., Ivybridge, UK), EcoSim (Gotelli and McCabe, 2002), PAST (Hammer et al., 2001), and MATLAB (The Mathworks). Sorenson (Bray–Curtis) distances were calculated from rank-transformed T-RFLP data using a natural weighting as recommended by McCune and Grace (2002), and visualized using non-metric multidimensional scaling (NMS; McCune and Grace, 2002).
Statistical analyses required the exclusion of samples with missing values. In order to account for such gaps in the availability of metadata, environmental variables were grouped into biological, chemical, and physical data classes in order to increase sample size for analyses (Table A2 in Appendix). Within PRIMER 6, BIOENV procedures were used to explore the correspondence between microbial community structure and environmental metadata (Clarke and Warwick, 2001). In this analysis, the environmental variables were first Log(X + 1) transformed and normalized by subtracting the mean from each entry of a single variable and dividing by the standard deviation for that variable. This allowed the identification of variables or combinations of variables that best corresponded with the community data. As this analysis was based on a limited number of samples due to missing data, the best fitting combinations were re-analyzed after adding samples with non-missing values (in the identified variable combination) using the RELATE test (Clarke and Warwick, 2001) in PRIMER 6 (PRIMER-E Ltd.). The Analysis of Similarity (ANOSIM in PRIMER 6; Clarke, 1993; Clarke and Warwick, 2001) test was used to examine for differences between bacterial communities from different depth horizons in the water column.
Two taxa co-occurrence indices were calculated using the EcoSim 700 software package (Gotelli and McCabe, 2002). The Checkboard index (C-board) calculates the number of taxa that never co-occur, which can be interpreted as evidence for competitive exclusion (segregation) or differences in habitat preference. The second index (C-score) is calculated by: CU = (Ri − S)(Rj − S) where Ri and Rj are the number of sites where taxon i and j occur, and S is the number of sites containing both taxa. The C-score is then calculated from the mean number of all pair-wise CUs. Monte Carlo simulations were used to test if the observed co-occurrence measures were random following the most conservative permutation procedure. Following Gotelli and McCabe (2002), we calculated a standardized effect size (SES) that allowed comparing the degree of co-occurrence across temporal and spatial scales.
Spearman’s rank correlation coefficient (ρs) was calculated in MATLAB in a pair-wise fashion between OTUs, using the relative contribution of each OTU to the total community for each sample. Only OTUs that were detected in more than two independent samples were included in the analysis (n = 397). A significance level of p < 0.05 was used to calculate the percentage of significant positive and negative correlations from the total number of pair-wise comparisons. In addition, Bonferroni correction was used to address the problem of multiple comparisons. In the same way, ρs between relative contributions of each OTU and depth were calculated.
To test if the number and distribution of significant pair-wise correlations was different from random, Monte Carlo simulations were performed. Following a permutation procedure where the rank of OTUs within samples was randomized, a total of 1000 randomized matrices were created and subsequently used in pair-wise correlations. The maximum and minimum ρs values of correlations within each 0.01 interval (from 1 to −1) were determined from all 1000 randomized matrices.
Results
Co-Occurrence Patterns and Correlations between OTUs
A total of 461 different OTUs, each represented by a specific terminal restriction fragment length, were detected in 296 samples collected over 3.5 years (November 2004 to February 2008) from depths ranging from 5 to 4000 m at Station ALOHA. Of these, 397 OTUs were present in at least two T-RFLP profiles, and so were used for further analyses. Co-occurrence indices calculated from this dataset differed significantly from random simulations: more OTU pairs exhibited larger C-scores and C-boards than expected by chance (Table 1). A higher C-score than expected by chance indicates low co-occurrence, whereas a lower C-score than expected by chance indicates high co-occurrence. Low co-occurrence can be interpreted as evidence for competitive exclusion (segregation), or differences in habitat preference. Of the Spearman’s rank correlation coefficients (ρs) from all pair-wise comparisons of OTUs (n = 78,607), 27.3% were significant at a 5% significance level, of which 6.6% were negatively correlated (ρs < 0) and 20.7% were positively correlated (ρs > 0; Figure 1A). Both significantly positive and negative correlations occurred more often than expected by chance when compared to simulations where the rank order of species were randomized within a community. In addition, maximum ρs values were much higher for the observed matrix compared to the simulated matrices (Figure 1A). Using Bonferroni correction for addressing the problem of multiple comparisons, the number of significant correlations decreased from 21,485 to 3,276 (3.5% significant positive and 0.5% significant negative correlations).
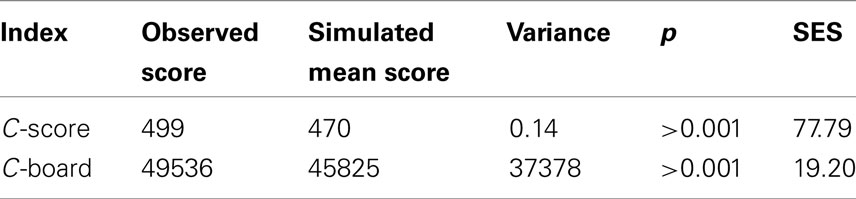
Table 1. Co-occurrence indexes (C-score and C-board) and their standardized effective sizes (SES) for bacterioplankton communities from Station ALOHA sampled during the course of this study (n = 296).
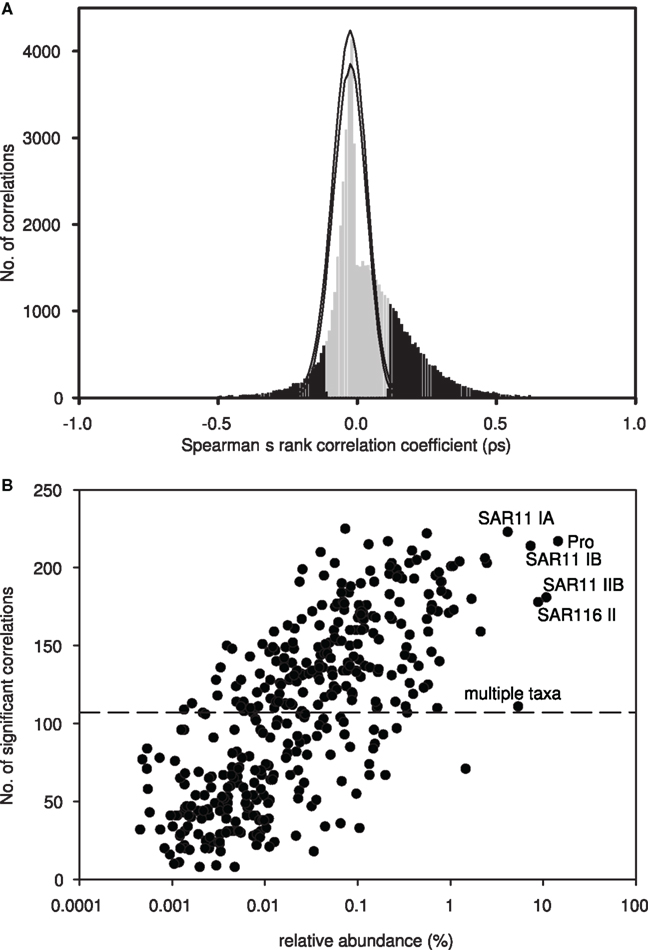
Figure 1. (A) Spearman’s rank correlation coefficients (ρs) from pair-wise correlations of all OTU pairs (n = 78,607), plotted as a frequency histogram using 0.01 intervals. Significant correlations (p < 0.05) are indicated in black. Monte Carlo simulations were used to test if the observed histogram was different from random. Following a permutation procedure where OTUs were randomized within sites, a total of 1000 randomized matrices were created, and pair-wise correlations were performed on each matrix. The maximum and minimum numbers of correlations within each 0.01 interval (from 1 to −1) were determined from all 1000 randomized matrices (hismax and hismin; black lines). (B) Plot of the average relative abundance of each OTU, determined via T-RFLP, against the number of significant pair-wise correlations to other OTUs. Putative identities are indicated for the most abundant OTUs. The dashed line indicates the median number of significant pair-wise correlations.
On average, 108 significant correlations were observed per OTU; 22 OTUs were correlated with more than 50% of the 397 OTUs included in the dataset. This subgroup of 22 included the most abundant OTUs, which are putatively identified as Prochlorococcus and SAR11 subclades IB and IA. Other abundant OTUs putatively identified as SAR116 subclade II and SAR11 subclade IIB were significantly correlated with >150 OTUs. However, many OTUs contributing <1% in relative abundance (on average) to the total bacterioplankton community exhibited a high number of significantly correlations with other OTUs in our dataset (Figure 1B). Hence, we did not observe a significant correlation between the average relative abundance of an OTU and the number of correlations it exhibited.
Variation in the C-score along the depth gradient was investigated in detail by calculating the SES from C-score calculations grouped by depth (SEScscore; Figure 2). A positive SEScscore significantly different from random (p < 0.01) was observed at all depths, indicating low co-occurrence. The SEScscore was not correlated with depth, but exhibited intriguing variability along the vertical axis (Figure 2). The highest value was estimated at 400 m, and decreased again toward the oxygen minimum zone at ca. 800 m. The SEScscore did not vary with the size of the data set, as measured by either the number of samples or the number of different OTUs included in a given incidence matrix (ρ = 0.103, p = 0.696, and ρ = 0.359, p = 0.137, respectively). It could also be argued that the number of OTUs represents an estimate of community richness. Hence, this apparent lack of relationship between richness and SEScscore, together with evenness and SEScscore also not being related (ρ = −0.279, p = 0.276) indicates that co-occurrence patterns are not related to alpha diversity at least in our study.
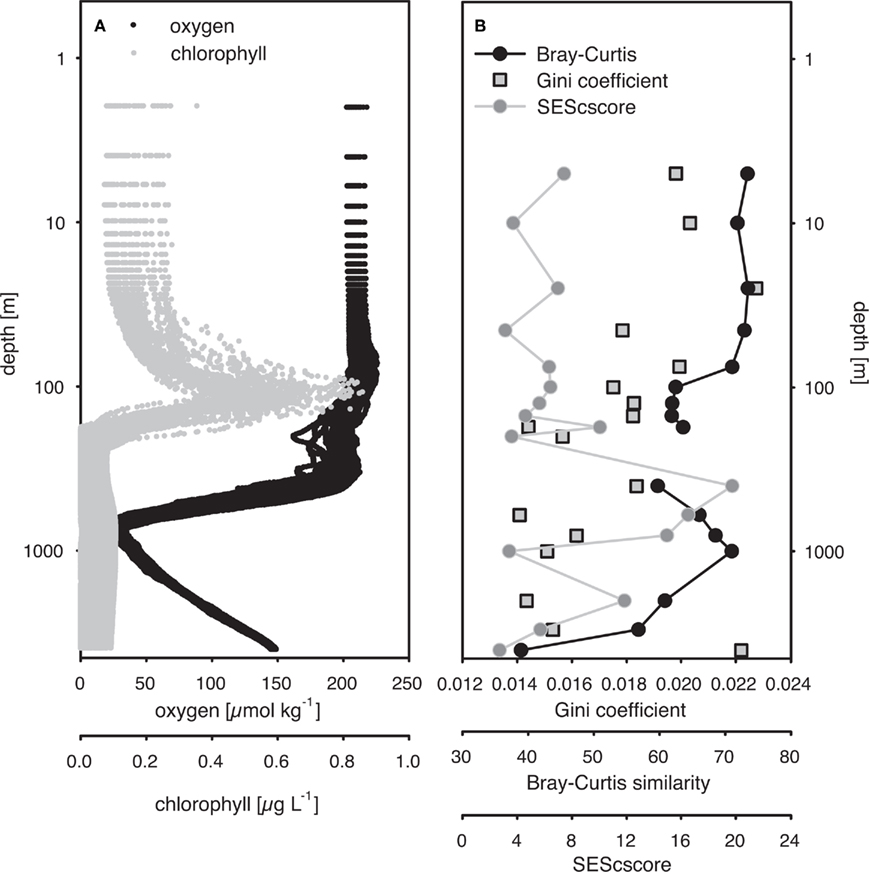
Figure 2. (A) Depth-specific distribution of oxygen and chlorophyll a concentrations from HOT cruises 165–200 (November 2004 to February 2008). (B) Standardized effective size of C-score (SEScscore), average Bray–Curtis similarity from all pariwise comparisons within a single depth, and Gini coefficients from depth-specific communities. Average Bray–Curtis similarity and Gini coefficients were calculated from T-RFLP-based community structure profiles pooled by depth. SESscore was calculated by adapting the procedure proposed by Gotelli and McCabe (2002), using all time points for a specific depth.
The Gini coefficient, an estimate of community evenness, ranged from 0.007 to 0.067 in the 296-sample dataset. These low values indicate a high degree of equality, as a value of 0 indicates complete equality while a value of 1 indicates maximal inequality among OTUs. Spearman’s rank correlation analysis revealed a significant negative relationship between the Gini coefficient and depth (ρ = −0.27, p < 0.001) indicating an increase in community evenness with depth (Figure 2).
Correspondence between Microbial Community Structure and Environmental Variables
In order to visualize potential spatial and temporal patterns in community structure, communities were plotted using NMS to two dimensions based on a Bray–Curtis distance matrix (Figure 3). ANOSIM and RELATE analyses corroborated initial visual observations of depth-specific clustering of bacterioplankton communities at Station ALOHA (R = 0.613, p < 0.001, and ρ = 0.67, p < 0.001, respectively). An R-value of 0 resulting from the ANOSIM analysis indicates that there were no differences among the communities from different depths, while an R-value of close to 1 would indicate that the dissimilarities between communities from different depths were larger than those from each individual depth. However, pair-wise ANOSIM revealed that community structure from different depth horizons in the upper 100 m were not significantly different whereas, below 100 m, all depth horizons were significantly different from each other (Table A1 in Appendix). Exceptions were adjunct depths where, in most cases, differences were not significant (Table A1 in Appendix).
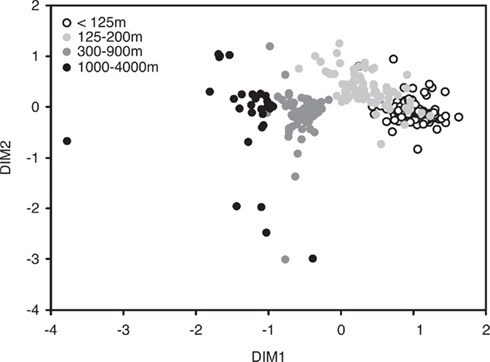
Figure 3. Non-metric multidimensional scaling (NMS) of bacterial community structure based on a T-RFLP analysis of bacterial SSU rRNA genes amplified from bacterioplankton samples collected approximately monthly at Station ALOHA from November 2004 to February 2008 (n = 296; stress-value = 12.1).
Average Bray–Curtis dissimilarities between communities from different depths increased with increasing distance along the vertical (i.e., depth) profile. The significant ρ value of the RELATE analysis indicated that communities from more distant depth horizons were more different than communities from adjunct depths. When Bray–Curtis similarities were averaged over the sampling period for each depth, values stayed rather constant above the mixed layer (Figure 2). In the depth layers where the mixed layer and chlorophyll maximum temporally oscillate, Bray–Curtis similarity averages were low. The relative abundance of nearly early half (46%) of all OTUs was significantly correlated with depth (p < 0.05), of which 32% were positive and 14% negative (Figure 4).
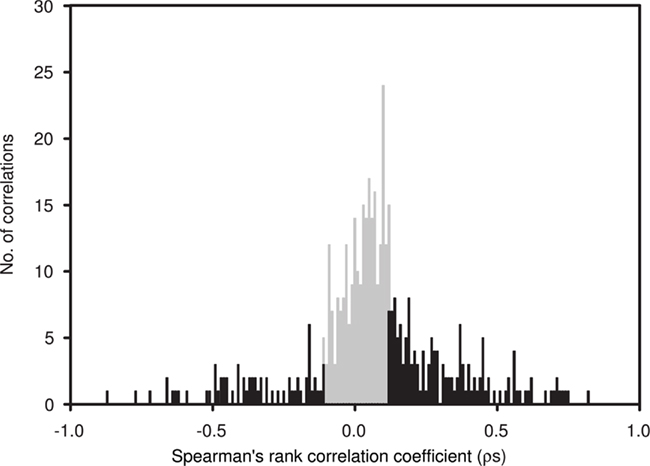
Figure 4. Spearman’s rank correlation coefficients (ρs) between depth and the relative abundance of individual OTUs, determined by T-RFLP (number of OTUs = 397), plotted in a frequency histogram using 0.01 intervals. Significant correlations (p < 0.05) are indicated in black. ρs Values indicate the strength of the relationship, with positive values indicating an increase in the relative contribution of an OTU with depth and negative values indicating a decrease.
Unlike the clear depth-specific zonation of bacterioplankton communities, temporal patterns were not readily apparent in NMS plots (data not shown). However, we were able to statistically test for temporal patterns in bacterioplankton community structure, since the sampling schema spanned over more than three consecutive years. When months and seasons were used as discriminating factors in ANOSIM analyses, and when months, seasons, and Julian days were used in cyclic RELATE analyses, significant temporal patterns were observed at various depths. However, significant annual cycles in bacterioplankton community composition were only found in the upper 200 m of the water column (Table 2) and were not detected in the deeper horizons.
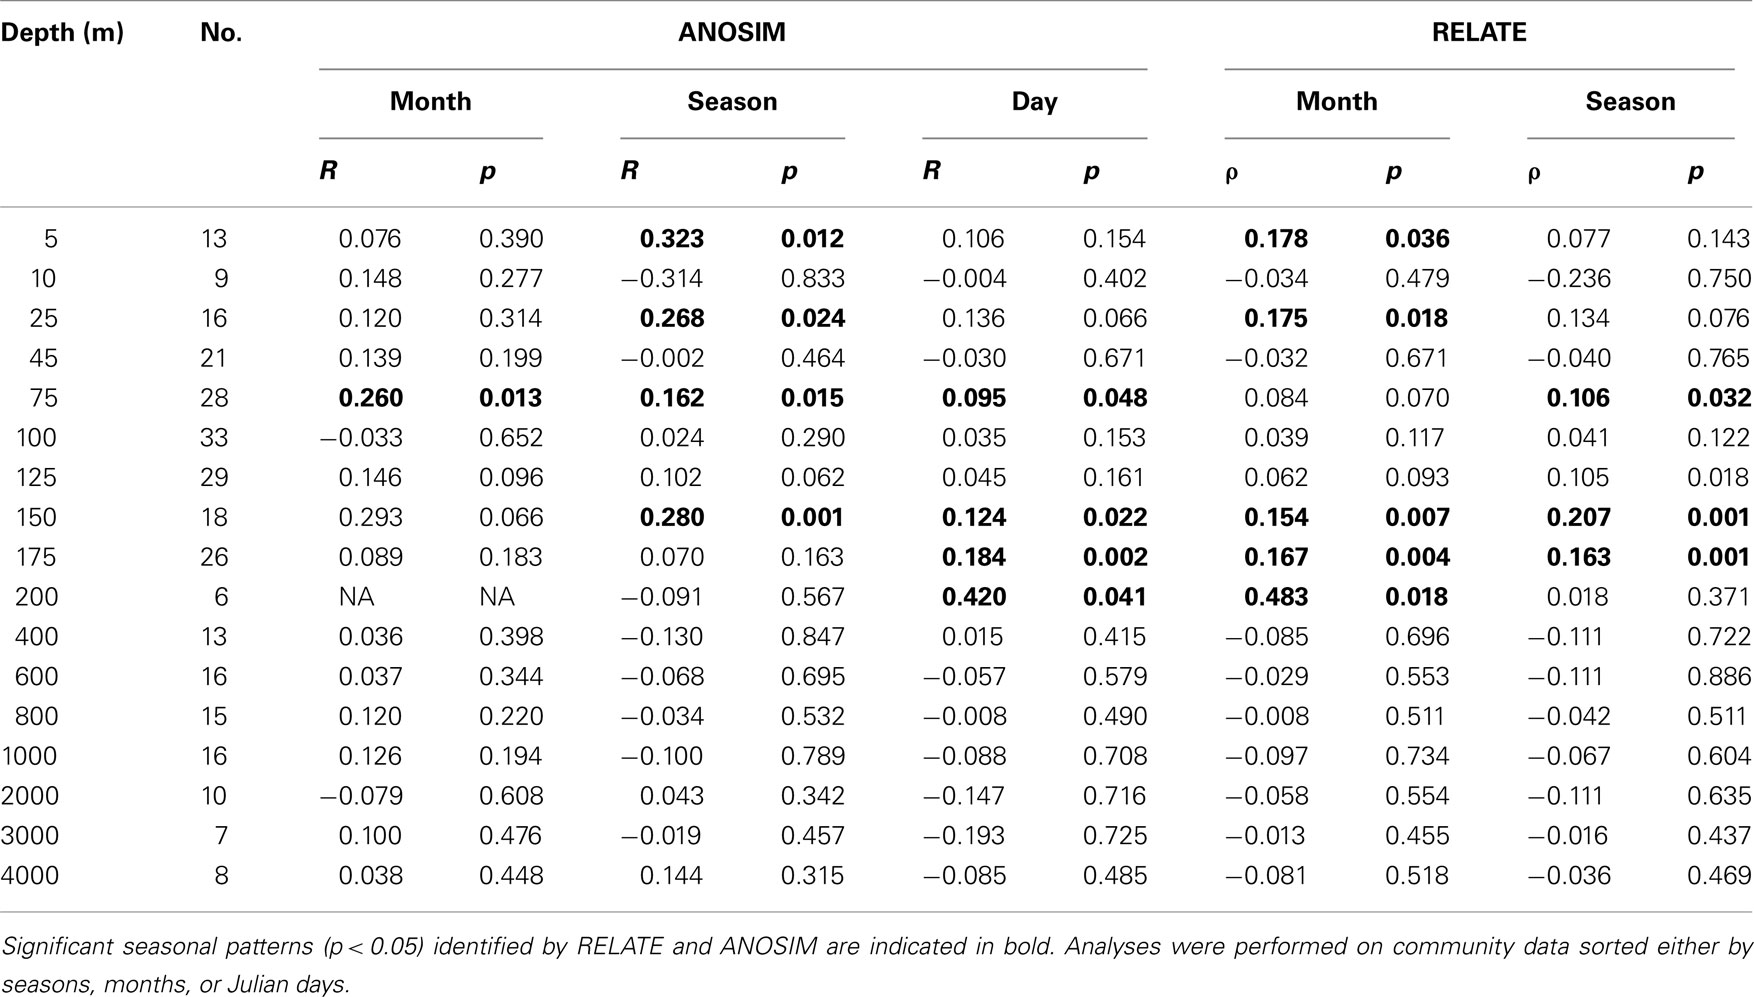
Table 2. Statistical analyses of temporal patterns in bacterioplankton community structure at Station ALOHA.
BIOENV procedures were employed to search for relationships (correspondence) between community and environmental variability, and to identify the strongest relationships. Since the environmental dataset was incomplete, variables were divided into three categories: physiochemical, biogeochemical, and biological (Table A2 in Appendix). Data from each category was used separately in the BIOENV procedure, and the variable combinations that best matched the patterns in community composition were identified and then analyzed by RELATE after inflating the number of samples (Table 3). Parameters from all three general categories revealed significant correspondence along the sampled spatial and temporal scales (Table 3). This included depth, which represented the single variable that corresponded the best with community composition. Variation in bacterioplankton community structure in the upper 200 m of the water column was highly correlated with concentrations in heterotrophic prokaryotes, Prochlorococcus, Synechococcus, and pigments such as chlorophyll a and phaeopigments. In addition, inorganic nutrients such as nitrite, nitrate, and particulate carbon corresponded well with community composition. Most of these variables were also correlated with depth (Table A3 in Appendix), and annual periodicity in these variables was either weak or not present (data not shown).
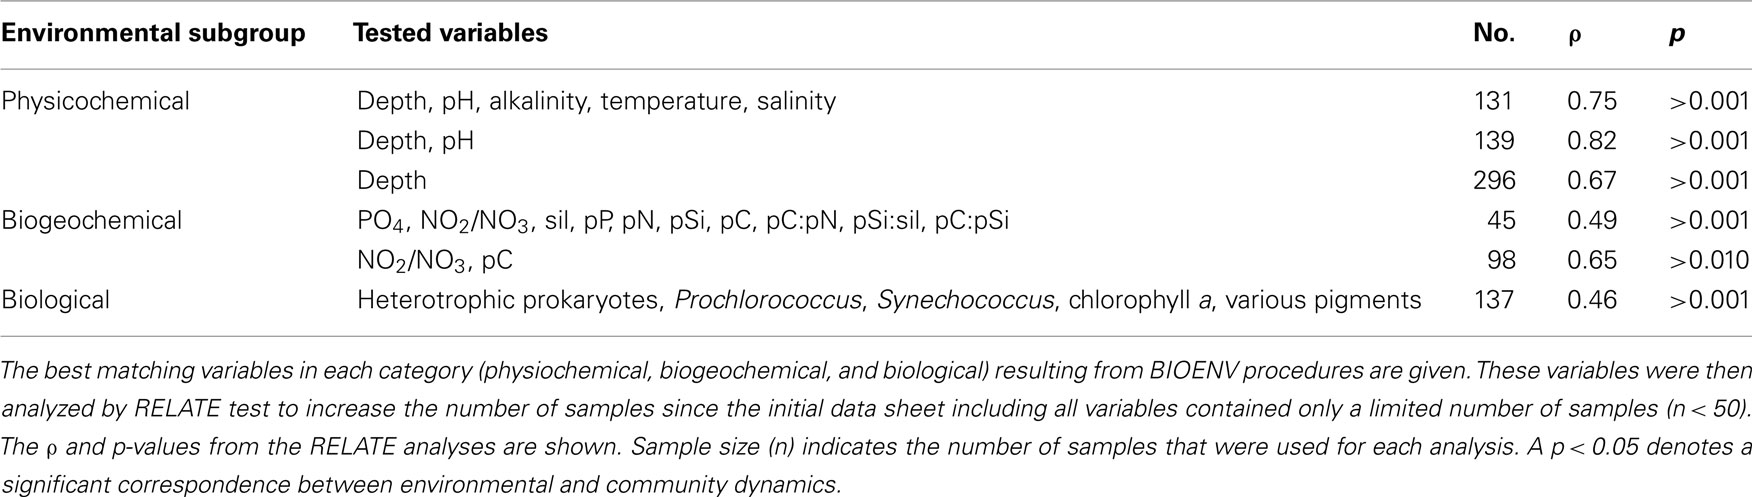
Table 3. Statistical analysis of correspondence between bacterioplankton community structure and environmental parameters.
Discussion
In this study, we sought to understand the mechanisms that underlie the patterns of community composition and maintain biodiversity over space and time (in other words, “to formulate community assembly rules”). Our results suggest that non-random patterns of co-occurrence are common between bacterioplankton lineages in the NPSG. This is consistent with observations made previously in other ocean provinces (Fuhrman et al., 2006; Gilbert et al., 2009; Steele et al., 2011), and demonstrates that both the emergent depth-dependent and temporal patterns in bacterioplankton taxa distributions in the NPSG derive mainly from deterministic forces, like controlling environmental conditions and taxa interdependencies. Documenting non-random patterns of co-occurrence for members of natural microbial communities is an important step in establishing generalities for community assembly, and confirms previous predictions regarding the non-random assembly of microbial communities in other environments (Horner-Devine et al., 2007). In this meta-analysis, no clear trends in co-occurrence patterns could be observed in relation to microbial habitats or phylogenetic groups but trends could be attributed to the variability in sample sizes and analysis methods of the different studies.
In our analysis, SEScscore values were not related to sample size, even though the number of samples analyzed from each depth ranged from 6 to 33. In addition, proxies for alpha-diversity (GINI index and the total number of OTUs) and beta-diversity (Bray–Curtis similarity) were not related to SEScscore values, suggesting that community properties are not likely effecting co-occurrence estimates. Still, we observed depth-specific variability in co-occurrence indices (SEScscore) within the predominantly stratified water column of the NPSG that could be attributed to the presence of complex and depth-specific ecological forces structuring bacterioplankton communities in the oligotrophic ocean. High SEScscore values appear to coincide with steep, depth-specific gradients in such environmental variables as chloropigments and oxygen concentrations (Figure 2). When coupled with the observation that bacterioplankton communities are stratified in the NPSG, it appears that deterministic mechanisms, such as environmental selection and competition, are stronger in these deep horizons of the water column than, for example, stochastic mixing events that transport nutrients and organisms through the water column. In addition, these stratified bacterial communities were maintained consistently for 3.5 years. An exception to this was observed above the depth of the mixed layer, where communities were fairly homogeneous (Figure 3; Table A2 in Appendix). This stands in contrast to the deep mixing events that disrupt the stratified bacterioplankton communities at the Bermuda Atlantic Time-series Study (BATS) site in winter, producing large shifts in community composition in the epipelagic and upper mesopelagic (Morris et al., 2005; Treusch et al., 2009).
While simple randomization tests like those applied in this study are useful statistical tools for recognizing non-random patterns of distribution (Gotelli, 2001), they do not allow for the identification of the causal underlying mechanisms shaping bacterioplankton communities in this system (Roughgarden, 1983). If the goal is to predict bacterioplankton community composition in the oligotrophic ocean, the causal underlying mechanisms need to be disentangled and their relative importance quantified. The application of statistical tools to identify relationships between community structure and abiotic and biotic environmental properties, as well as relationships among bacterial groups, is a first step toward such predictions (e.g., Fuhrman et al., 2006; Gilbert et al., 2009; Treusch et al., 2009). Using permutation-based procedures such as ANOSIM, we observed highly structured bacterioplankton communities along depth gradients, and a high number of individual OTUs either positively or negatively correlated with depth, allowing predictions on their distribution along the stratified water column. Numerous studies have demonstrated that specific groups of planktonic microorganisms are vertically stratified in the open ocean (e.g., DeLong, 1992; Giovannoni et al., 1996; Field et al., 1997; Church et al., 2005; DeLong et al., 2006; Johnson et al., 2006; Pham et al., 2008). While not surprising when considering the existence of strong environmental gradients along the vertical profile (Table A3 in Appendix), disentangling depth from correlations with key environmental parameters remains an important but unresolved task.
In addition to identifying that different depths harbor distinct bacterioplankton communities, we were able to characterize these differences in evenness, SEScscore and variance in community similarity (Figure 2B). Community evenness increased with depth, whereas the variability in community composition (as indicated by Bray-Curtis similarities) decreased with depth, clearly showing that the epipelagic bacterioplankton community was more dynamic than the bathylopelagic community. Higher variability in epipelagic communities was also reflected by the subtle but statistically significant seasonal oscillations, suggesting re-occurring temporal patterns as proposed for other ocean sites (Fuhrman et al., 2006; Treusch et al., 2009). There was also a clear correspondence between epipelagic bacterioplankton community structure and environmental variables that do exhibit some seasonality at Station ALOHA (Karl, 2002). The relationship between bacterioplankton community composition and nitrite, nitrate, and particulate carbon concentrations and the abundance of Prochlorococcus, Synechococcus, and pigments indicate that resource availability (or bottom up control) plays a dominant role in the assembly of bacterioplankton communities in the NPSG (Torsvik et al., 2002). Previous studies also point to the importance of top down controls such as viruses and grazers (Thingstad and Lignell, 1997; Fuhrman, 1999; Hewson et al., 2006). Besides trophic interactions such as bacterivory and viral lysis, other forms of interdependencies have attracted little attention, especially antagonism and mutualism among open ocean bacterioplankton taxa.
Correlations among taxa may provide preliminary indications regarding the nature of bacterioplankton interactions. For example, a positive correlation may reflect syntrophy or other interdependency between two taxa, though it may also reflect similar responses to controlling environmental conditions, leading to the two taxa following a similar environmental trend. A negative correlation, on the other hand, may reflect either direct competition, or differences in growth constraints between taxa. Still, the higher number of positive than negative correlations among taxa observed in this study could partially result from a higher degree of mutualistic than antagonistic interactions. Metagenomic sequence data obtained along a depth profile in the NPSG support this view, as many genes with potential interactive functions have been identified, such genes encoding for chemotaxis, antibiotics, pili, and flagellate synthesis (DeLong et al., 2006). However, metabolic interactions between microorganisms resulting from the biotransformation of metabolites (e.g., from reduced to oxidized states and vice versa) do not rely on close spatial association, and hence may be far more important than interactions requiring close physical proximity. Many transformations in the carbon, nitrogen, and sulfur cycles are reliant on appropriate cellular and ambient microenvironmental redox conditions (see for example, Paerl and Pinckney, 1996, and references therein). Genome analyses have also emphasized the importance of metabolites for interactions in pelagic marine environments (Tripp et al., 2008). Although many of the identified correlations among taxon-pairs may be the result of such metabolic interactions, experimental validation is required in order to explore the causality behind the observed correlations. A logical starting point for such studies are the highly correlating taxa, which may represent groups with extensive and strong interactions to other taxa. The high relative abundance of some of these taxa (i.e., Prochlorococcus and SAR11) already suggests a key role in open ocean bacterioplankton communities.
Conclusion
The non-random temporal and spatial patterns in microbial community structure we observed are an important starting point for investigating microbial ecosystem services in the NPSG (Fuhrman et al., 2006). For example, if interdependencies including mutualism, antagonism, trophodynamics (predation and parasitism), and competition determine community structure, then it can be speculated that these interactions directly underlay ecosystem processes by modifying pathways of energy and material flow, or indirectly by modifying the abundances of organisms or traits with strong ecosystem effects. Thus, understanding community interactions is essential if we want to predict ecosystem functioning of the oligotrophic ocean in an era of anthropogenic induced environmental change.
Conflict of Interest Statement
The authors declare that the research was conducted in the absence of any commercial or financial relationships that could be construed as a potential conflict of interest.
Acknowledgments
We thank Matthew J. Church for his comments and suggestions on an early version of this manuscript, and for providing genomic DNA samples from a portion of the HOT cruises investigated here. We thank J. Becker, M. Miller, T. Campbell, S. Yeo, J. Coloma, N. Wagoner, E. Hambleton, and all HOT personnel for assistance in sampling and contextual data. This research was supported by funding from the Center for Microbial Oceanography: Research and Education (NSF Science and Technology Center Award EF-0424599). This is SOEST contribution 8206 and HIMB contribution 1452.
Footnotes
References
Carlson, C. A., Morris, R., Parsons, R., Treusch, A. H., Giovannoni, S. J., and Vergin, K. (2009). Seasonal dynamics of SAR11 populations in the euphotic and mesopelagic zones of the northwestern Sargasso Sea. ISME J. 3, 283–295.
Cho, B. C., and Azam, F. (1988). Major role of bacteria in biogeochemical fluxes in the oceans interior. Nature 332, 441–443.
Church, M. J., Mahaffey, C., Letelier, R. M., Lukas, R., Zehr, J. P., and Karl, D. M. (2009). Physical forcing of nitrogen fixation and diazotroph community structure in the North Pacific subtropical gyre. Global Biogeochem. Cycles 23, GB2020.
Church, M. J., Short, C. M., Jenkins, B. D., Karl, D. M., and Zehr, J. P. (2005). Temporal patterns of nitrogenase gene (nifH) expression in the oligotrophic North Pacific Ocean. Appl. Environ. Microbiol. 71, 5362–5370.
Clarke, K. R. (1993). Non-parametric multivariate analyses of changes in community structure. Aust. J. Ecol. 18, 117–143.
Clarke, K. R., and Warwick, R. M. (2001). Change in Marine Communities, An Approach to Statistical Analysis and Interpretation, 2nd Edn. Plymouth: PRIMER-E.
Cracraft, J. (1988). Deep-history biogeography, retrieving the historical pattern of evolving continental biotas. Syst. Zool. 37, 221–236.
DeLong, E. F. (1992). Archaea in coastal marine environments. Proc. Natl. Acad. Sci. U.S.A. 89, 5685–5689.
DeLong, E. F., Preston, C. M., Mincer, T., Rich, V., Hallam, S. J., Frigaard, N.-U., Martinez, A., Sullivan, M. B., Edwards, R., Brito, B. R., Chisholm, S. W., and Karl, D. M. (2006). Community genomics among stratified microbial assemblages in the ocean’s interior. Science 311, 496–503.
Diamond, J. M. (1975). “Assembly of species communities,” in Ecology and Evolution of Communities, eds M. L. Cody, and J. M. Diamond (Cambridge, MA: Harvard University Press), 342–444.
Dore, J. E., and Karl, D. M. (1996). Nitrite distributions and dynamics at station ALOHA. Deep Sea Res. Part II Top. Stud. Oceanogr. 43, 385–402.
Eiler, A., Hayakawa, D. H., Church, M. J., Karl, D. M., and Rappé, M. S. (2009). Dynamics of the SAR11 bacterioplankton lineage in relation to environmental conditions in the oligotrophic North Pacific subtropical gyre. Environ. Microbiol. 11, 2291–2300.
Field, K. G., Gordon, D., Wright, T., Rappé, M., Urbach, E., Vergin, K., and Giovannoni, S. J. (1997). Diversity and depth-specific distribution of SAR11 cluster rRNA genes from marine planktonic bacteria. Appl. Environ. Microbiol. 63, 63–70.
Fuhrman, J. A. (1999). Marine viruses and their biogeochemical and ecological effects. Nature 399, 541–548.
Fuhrman, J. A., Hewson, I., Schwalbach, M. S., Steele, J. A., Brown, M. V., and Naam, S. (2006). Annually reoccurring bacterial communities are predictable from ocean conditions. Proc. Natl. Acad. Sci. U.S.A. 103, 13104–13109.
Fuhrman, J. A., and Steele, J. A. (2008). Community structure of marine bacterioplankton, Patterns, networks, and relationships to function. Aquat. Microb. Ecol. 53, 69–81.
Gilbert, J. A., Field, D., Swift, P., Newbold, L., Oliver, A., Smyth, T., Somerfield, P. J., Huse, S., and Joint, I. (2009). The seasonal structure of microbial communities in the Western English Channel. Environ. Microbiol. 11, 3132–3139.
Giovannoni, S. J., Rappé, M. S., Vergin, K. L., and Adair, N. L. (1996). 16S rRNA genes reveal stratified open ocean bacterioplankton populations related to the green non-sulfur bacteria. Proc. Natl. Acad. Sci. U.S.A. 93, 7979–7984.
Gotelli, N. J. (2001). Research frontiers in null model analysis. Glob. Ecol. Biogeogr. 10, 337–343.
Gotelli, N. J., and McCabe, D. J. (2002). Species co-occurrence, a meta-analysis of J. M. Diamond’s assembly rules model. Ecology 83, 2091–2096.
Green, J., and Bohannan, B. J. M. (2006). Spatial scaling of microbial biodiversity. Trends Ecol. Evol. (Amst.) 21, 501–507.
Hammer, Ø., Harper, D. A. T., and Ryan, P. D. (2001). PAST, paleontological statistics software package for education and data analysis. Palaeontol. Electronica 4, 9.
Herndl, G. J., Agogué, H., Baltar, F., Reinthaler, T., Sintes, E., and Varela, M. M. (2008). Regulation of aquatic microbial processes, the “microbial loop” of the sunlit surface waters and the dark ocean dissected. Aquat. Microb. Ecol. 53, 59–68.
Hewson, I., Steele, J. A., Capone, D. G., and Fuhrman, J. A. (2006). Temporal and spatial scales of variation in bacterioplankton assemblages of oligotrophic surface waters. Mar. Ecol. Prog. Ser. 311, 67–77.
Horner-Devine, M. C., Carney, K. M., and Bohannan, B. J. M. (2004). An ecological perspective on bacterial biodiversity. Proc. R. Soc. Lond. B Biol. Sci. 271, 113–122.
Horner-Devine, M. C., Silver, J. M., Leibold, M. A., Bohannan, B. J. M., Colwell, R. K., Fuhrman, J. A., Green, J. L., Kuske, C. R., Martiny, J. B., Muyzer, G., Ovreås, L., Reysenbach, A. L., and Smith, V. H. (2007). A comparison of taxon co-occurrence patterns for macro- and microorganisms. Ecology 88, 1345–1353.
Johnson, Z. I., Zinser, E. R., Coe, A., McNulty, N. P., Woodward, E. M. S., and Chisholm, S. W. (2006). Niche partitioning among Prochlorococcus ecotypes along ocean-scale environmental gradients. Science 311, 1737–1740.
Karl, D. M. (1999). A sea of change, biogeochemical variability in the North Pacific subtropical gyre. Ecosystems 2, 181–214.
Karl, D. M., Bjorkman, K. M., Dore, J. E., Fujieki, L., Hebel, D. V., Houlihan, T., Letelierc, R. M., and Tupasa, L. M. (2001). Ecological nitrogen-to phosphorus stoichiometry at station ALOHA. Deep Sea Res. Part II Top. Stud. Oceanogr. 48, 1529–1566.
Karl, D. M., and Lukas, R. (1996). The Hawaii Ocean Timeseries (HOT) program, background, rationale and field implementation. Deep Sea Res. Part II Top. Stud. Oceanogr. 43, 129–156.
Keddy, P., and Weiher, E. (2001). “Introduction, the scope and goals of research on assembly rules,” in Ecological Assembly Rules – Perspecitives, Advances, Retreats, eds E. Weiher, and P. Keddy (Cambridge: Cambridge University Press), 1–22.
Lane, D. J. (1991). “16S/23S rRNA sequencing,” in Nucleic Acid Techniques in Bacterial Systematics, eds E. Stackebrandt, and M. Goodfellow (New York: John Wiley and Sons), 115–175.
Letelier, R. M., Dore, J. E., Winn, C. D., and Karl, D. M. (1996). Seasonal and interannual variations in photosynthetic carbon assimilation at station ALOHA. Deep Sea Res. Part II Top. Stud. Oceanogr. 43, 467–490.
Little, A. E. F., Robinson, C. J., Peterson, S. B., Raffa, K. E., and Handelsman, J. (2008). Rules of engagement, interspecies interactions that regulate microbial communities. Annu. Rev. Microbiol. 62, 375–401.
Martiny, J. B. H., Bohannan, B. J. M., Brown, J. H., Colwell, R. K., Fuhrman, J. A., Green, J. L., Horner-Devine, M. C., Kane, M., Krumins, J. A., Kuske, C. R., Morin, P. J., Naeem, S., Ovreås, L., Reysenbach, A. L., Smith, V. H., and Staley, J. T. (2006). Microbial biogeography, putting microorganisms on the map. Nat. Rev. Microbiol. 4, 102–112.
McCune, B., and Grace, J. B. (2002). Analysis of Ecological Communities. Gleneden Beach, OR: MjM Software Design.
Morris, R. M., Rappé, M. S., Connon, S. A., Vergin, K. L., Siebold, W. A., Carlson, C. A., and Giovannoni, S. J. (2002). SAR11 clade dominates ocean surface bacterioplankton communities. Nature 420, 806–810.
Morris, R. M., Vergin, K. L., Cho, J.-C., Rappé, M. S., Carlson, C. A., and Giovannoni, S. J. (2005). Temporal and spatial response of bacterioplankton lineages to annual convective overturn at the Bermuda Atlantic time-series study site. Limnol. Oceanogr. 50, 1687–1696.
Osborne, C. A., Rees, G. N., Bernstein, Y., and Janssen, P. H. (2006). New threshold and confidence estimates for terminal restriction fragment length polymorphism analysis of complex bacterial communities. Appl. Environ. Microbiol. 72, 1270–1278.
Paerl, H. W., and Pinckney, J. L. (1996). A mini-review of microbial consortia, their roles in aquatic production and biogeochemical cycling. Microb. Ecol. 31, 225–247.
Pham, V. D., Konstantinidis, K. T., Paiden, T., and DeLong, E. F. (2008). Phylogenetic analyses of ribosomal DNA-containing bacterioplankton genome fragments from a 4000 m vertical profile in the North Pacific subtropical gyre. Environ. Microbiol. 10, 2313–2330.
Prosser, J. I., Bohannan, B. J. M., Curtis, T. P., Ellis, R. J., Firestone, M. K., Freckleton, R. P., Green, J. L., Green, L. E., Killham, K., Lennon, J. J., Osborn, A. M., Solan, M., van der Gast, C. J., and Young, J. P. (2007). Essay – The role of ecological theory in microbial ecology. Nat. Rev. Microbiol. 5, 384–392.
Steele, J. A., Countway, P. D., Xia, L., Vigil, P. D., Beman, J. M., Kim, D. Y., Chow, C. E. T., Sachdeva, R., Jones, A. C., Schwalbach, M. S., Rose, J. M., Hewson, I., Patel, A., Sun, F., Caron, D. A., and Fuhrman, J. A. (2011). Marine bacterial, archaeal and protistan association networks reveal ecological linkages. ISME J.
Strom, S. L. (2008). Microbial ecology of ocean biogeochemistry, a community perspective. Science 320, 1043–1045.
Thingstad, T. F., and Lignell, R. (1997). Theoretical models for the control of bacterial growth rate, abundance, diversity and carbon demand. Aquat. Microb. Ecol. 13, 19–27.
Torsvik, V., Ovreas, L., and Thingstad, T. F. (2002). Prokaryotic diversity – magnitude, dynamics and controlling factors. Science 296, 1064–1066.
Treusch, A. H., Vergin, K. L., Finlay, L. A., Donatz, M. G., Burton, R. M., Carlson, C. A., and Giovannoni, S. J. (2009). Seasonality and vertical structure of microbial communities in an ocean gyre. ISME J. 3, 1148–1163.
Tripp, H. J., Kitner, J. B., Schwalbach, M. S., Dacey, J. W. H., Wilhelm, L. J., and Giovannoni, S. J. (2008). SAR11 marine bacteria require exogenous reduced sulphur for growth. Nature 452, 741–744.
Vuilleumier, F., and Simberloff, D. (1980). Ecology versus history as determinants of patchy and insular distribution in high Andean birds. Evol. Biol. 12, 235–379.
Keywords: 16S rRNA gene, assembly, community, gyre, oligotrophic, time series
Citation: Eiler A, Hayakawa DH and Rappé MS (2011) Non-random assembly of bacterioplankton communities in the subtropical North Pacific Ocean. Front. Microbio. 2:140. doi: 10.3389/fmicb.2011.00140
Received: 11 April 2011;
Accepted: 14 June 2011;
Published online: 01 July 2011.
Edited by:
Peter R. Girguis, Harvard University, USAReviewed by:
J. Michael Beman, University of California, Merced, USAFrank Stewart, Georgia Institute of Technology, USA
Jed Fuhrman, University of Southern California, USA
Copyright: © 2011 Eiler, Hayakawa and Rappé. This is an open-access article subject to a non-exclusive license between the authors and Frontiers Media SA, which permits use, distribution and reproduction in other forums, provided the original authors and source are credited and other Frontiers conditions are complied with.
*Correspondence: Alexander Eiler, Limnology, Department of Ecology and Genetics, Norbyvägen 18D, SE-75236 Uppsala, Sweden. e-mail: alexander.eiler@ebc.uu.se