 Jill A. Sohm
- Department of Biological Sciences, University of Southern California, Los Angeles, CA, USA
Unicellular dinitrogen (N2) fixing cyanobacteria have only recently been identified in the ocean and recognized as important contributors to global N2 fixation. The only cultivated representatives of the open ocean unicellular diazotrophs are multiple isolates of Crocosphaera watsonii. Although constituents of the genus are nearly genetically identical, isolates have been described in two size classes, large ∼5 μm and small ∼3 μm cell diameters. We show here that the large size class constitutively produces substantial amounts of extracellular polysaccharides (EPS) during exponential growth, up to 10 times more than is seen in the small size class, and does so under both N2 fixing and non-N2 fixing conditions. The EPS production exceeds the amount produced by larger phytoplankton such as diatoms and coccolithophores by one to two orders of magnitude, is ∼22% of the total particulate organic C in the culture, and is depleted in N compared to cellular material. The large difference in observed EPS production may be accounted for by consistently higher photochemical efficiency of photosystem II in the large (0.5) vs. small (∼0.35) strains. While it is known that Crocosphaera plays an important role in driving the biological carbon (C) pump through the input of new nitrogen (N) to the open ocean, we hypothesize that this species may also contribute directly to the C cycle through the constitutive production of EPS. Indeed, at two stations in the North Pacific Subtropical Gyre, ∼70% of large Crocosphaera cells observed were embedded in EPS. The evolutionary advantage of releasing such large amounts of fixed C is still unknown, but in regions where Crocosphaera can be abundant (i.e., the warm oligotrophic ocean) this material will likely have important biogeochemical consequences.
Introduction
Dinitrogen (N2) fixation is the process by which diazotrophs can access the largest nitrogen (N) reservoir on earth, N2 gas, and turn it into a biologically usable form. This process is exclusively prokaryotic, carried out by relatively few organisms, and represents an important source of new N to the N-starved open ocean (Capone et al., 2005). In the tropics and subtropics, the filamentous colony-forming cyanobacterium Trichodesmium is the most well studied diazotroph; however, it is now known that unicellular cyanobacteria also contribute significantly to N2 fixation in these areas (Montoya et al., 2004). There are currently three groups of unicellular, diazotrophic cyanobacteria defined: UCYN-A, which is most closely related to Cyanothece ATCC 51142 but appears to be a photoheterotroph based on genomic research; group B, or Crocosphaera watsonii; and UCYN-C, a sister taxa to UCYN-A (Foster et al., 2007; Zehr et al., 2008; Tripp et al., 2010). Of these three marine groups, only Crocosphaera is represented in culture collections.
Crocosphaera appears to be widespread in the tropical and subtropical oceans; it has been identified by nifH abundance (a gene encoding for a subunit of the enzyme responsible for N2 fixation) in large areas of the North Atlantic (Langlois et al., 2008), and the North Pacific (Church et al., 2008) and by flow cytometry and direct counting in the South Pacific (Campbell et al., 2005; Webb et al., 2009). In the North Atlantic, Crocosphaera is not always present; however, when it is, the abundance (determined as copies of nifH) can be quite high for an N2-fixer, in the range of 104 L−1 (Langlois et al., 2008). In the North Pacific, Crocosphaera nifH abundance appears to be closer to 103 L−1, but concentrations up to 104 L−1 have also been seen (Church et al., 2005, 2008), while in the warm pool of the South Pacific, concentrations up to 106 L−1 were recently shown (Moisander et al., 2010). Despite the potential biogeochemical importance of Crocosphaera, we are only just beginning to understand the ecology and physiology of this genus.
The type strain of group B is C. watsonii WH8501 and the laboratory isolates of this genus can be divided into two cell size classes, <4 and >4 μm, that are essentially phylogenetically indistinguishable (Zehr et al., 2007; Webb et al., 2009). Nevertheless, the bigger size class produces large amounts of extracellular material that becomes so abundant that it makes the media gel-like (Webb et al., 2009). Herein this material is identified as extracellular polysaccharides (EPS) that is similar in composition to transparent exopolymeric particles (TEP). The major difference between TEP and EPS is that TEP is defined as discrete particles of EPS, while EPS remains as a matrix around cells (Passow, 2002b). Past work suggests that the large Crocosphaera-like cells produce this material in the field; cells of the large size class (∼5–6 μm) are retained on an 8-μm pore size filter, and are seen in loose groupings (Webb et al., 2009). Presumably, these cells exist in a matrix of EPS and can therefore be caught on a filter with pore size larger than the cell diameter. Fitting with this hypothesis, similar groupings of Crocosphaera-like cells in a matrix were seen in a sample from a coral lagoon in the southwest Pacific Ocean (Biegala and Raimbault, 2008). These observations suggest that Crocosphaera produces this EPS in situ as well, however it is not known if this production is constitutive, confined to a specific growth phase or impacted by nutrient limitation.
The purpose of EPS production in Crocosphaera is unknown; however, in other phytoplankton, it appears that photosynthetically fixed carbon (C) is channeled into exopolymers during nutrient limited growth (Corzo et al., 2000). Many cyanobacteria have been reported to produce EPS, and some strains appear to produce this material exclusively under N2-fixing conditions (Otero and Vincenzini, 2003). While TEP is mainly recognized as a diatom product, it is also produced by cyanobacteria, other phytoplankton, and bacteria (Passow, 2002a; Berman-Frank et al., 2007). These exopolymers are an important aspect of the global C cycle, as they comprise the matrix of marine snow particles that are a major contributor to C flux to the deep sea (Passow et al., 2001).
In this study we tracked exopolymer production in both large and small strains of Crocosphaera in culture and compared the values obtained with published data from other marine phytoplankton. Furthermore, we also investigated the controls of EPS production (i.e., could it be increased, reduced, or eliminated) by growing Crocosphaera in different nutrient and light regimes, and documented EPS production by Crocosphaera-like cells in the North Pacific Ocean.
Materials and Methods
Strains and Culture Conditions
In this experiment, six strains of C. watsonii were tested for EPS production under diazotrophic growth conditions: three strains of the small size class (WH8501, WH0002, WH0401) and three strains of the large size class (WH0003, WH0005, WH0402). These cultures were isolated from diverse locations. These cultures are not currently available axenic and thus were not axenic for the experiments described here; however, EPS production was qualitatively observed when each strain was originally isolated and rendered axenic by John Waterbury. WH8501 was isolated in the South Atlantic, WH0002, WH0003, and WH0005 were isolated in the North Pacific and WH0401 and WH0402 were isolated in the North Atlantic (Webb et al., 2009). Thus, the strains used originate from many different areas, with both EPS and non-EPS producing strains from the same basin. All cultures were grown in triplicate batches on N free YBCII media (Chen et al., 1996), an artificial seawater media, in an incubator with a 14-h:10-h light:dark cycle at 27°C, and kept in constant motion on a shaker table (∼100 RPM). With the exception of the light/N experiment (see below) all cultures were grown at 75–80 μmol m−2 s−2 light intensity; the light/N experiment was carried out at 45 μmol m−2 s−1. All cultures were tested for EPS production over the growth cycle, although only four strains (two large and two small) reached stationary phase before the termination of the experiments after about 3 weeks (these are shown in Figure 2). A number of additional experiments were also carried out with a representative of the large (WH0005) and small (WH0401) strains in order to answer the following questions: (1) is EPS production in the large strains controlled by light intensity or the presence of fixed N, as is seen in some other N2-fixing cyanobacteria (Otero and Vincenzini, 2003), and (2) given previous work showing that nutrient limitation can induce EPS production in cyanobacteria (see Berman-Frank et al., 2007), can the levels of production seen in the large strains be induced in the small strains grown in nutrient deficient conditions? The following experiments were carried out to address these questions: (1) quantifying EPS production in WH0005 during exponential growth at a light intensity of half that used in the standard growth curves and on media with no N (−N) and with 1 mM  (+N) added (named the light/N experiment), (2) measuring EPS production in a small strain (WH0401) grown on media with 1 mM
  for purposes of comparison to the experiment with WH0005, and (3) monitoring EPS production in WH0401 under low Fe and
  conditions (20 and 25 times less than standard YBCII, respectively).
Sampling of cultures was carried out at the beginning of the light period. One sample for cell counts, chlorophyll (chl) a and EPS concentration was taken from each replicate culture over the exponential and stationary growth phase – values reported are the average of the three samples from the biological replicates. Cell numbers were counted with an epifluorescent microscope using a hemacytometer where replicate fields were counted until whichever came first: 10 fields or 200 cells. Chl a was determined in a fluorometer after samples were dissolved in acetone for 24 h at −20°C (Parsons et al., 1984). During early exponential growth, cell counts were the more accurate (less variable) way to quantify biomass and growth in the large strain cultures; however, in late log and stationary phase, the cells began to form large groupings (see Figures 1A,B) that could not be accurately counted with microscopy, as the distribution of cells in the field was not uniform. Therefore, growth of the large strain cultures was tracked with Chl a concentration only in experiments extending into stationary phase while both cell density and Chl a was used with the small size strains and in the light/N experiment where growth was tracked in early exponential phase only.
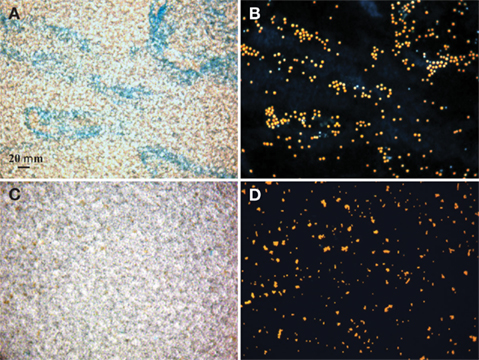
Figure 1. Bright field microscopic images of EPS stained with Alcian Blue (A,C) and epifluorescence images of Crocosphaera cells under the DAPI longpass filter set (B,D). Stain and cell images show the same field of view of the large cell type WH0005 (A,B) and small cell type WH0401 (C,D) under 40× magnification.
EPS Quantification
To visualize and quantitatively measure the EPS, methods developed for staining and quantification of TEP were used (Passow and Alldredge, 1994, 1995b). Briefly, samples for microscopic evaluation of the EPS were filtered onto a 0.4-μm filter and stained for 2 s with a 0.02% Alcian Blue solution in 0.06% acetic acid, followed by rinsing with milli-Q water (Passow and Alldredge, 1994). The filter was mounted onto a slide and examined at 40× magnification on a Zeiss Axiostar plus microscope using light microscopy for the exopolymers and epifluorescent microscopy to visualize the location of the cells with relation to the EPS. Whole images were minimally adjusted in Adobe Photoshop CS4 for contrast, brightness, and hue in order to accentuate the borders of the cells and stained EPS. Samples for quantitative measurement of EPS were stained as above, placed dry into a glass test tube and stored in the dark for ∼3 weeks until processing. For quantification, the filters with stained samples were placed in 3 mL 80% H2SO4 for 2 h to dissolve the EPS, and the absorbance was read on a Bio-Rad SmartSpec 3000 spectrophotometer (Philadelphia, PA, USA) at 787 nm (Passow and Alldredge, 1995b). Xanthan gum standards were made in ethanol according to Claquin et al. (2008) and values are reported in microgram Xanthan gum equivalents per milliliter (abbreviated μg Xeq. mL−1). The volume filtered was adjusted throughout the growth curve to account for the increase in EPS, 3–5 mL in the early stages of growth, down to 0.2–0.5 mL by the time late log or stationary phase were reached. Chl a and cell normalized EPS values for each strain are reported as the average of these values taken over the exponential growth period, as this is the period of active production.
Elemental Analyses
To assess the C and N content of the EPS, 30 mL of log phase WH0005 was centrifuged at 4000 × g for 10–15 min to separate the cells from the EPS. This strain was chosen, as it appears to be easier to separate from the EPS than the other isolates. The cell pellet and the supernatant containing the EPS were filtered separately onto pre-combusted GF/F filters and dried. These filters were then pressed into a pellet and analyzed on a Carlo Erba elemental CHN analyzer (Currently – CE Elantech, Lakewood, NJ, USA). The number of cells that did not separate from the EPS was determined by microscopy (as described above) using a subsample of the supernatant, and the final C and N values of the EPS reported were corrected for the C and N present as cells. The total particulate organic C or N (POC and PON) is defined as the C or N in EPS plus cells, as all this material is caught on a GF/F filter.
Photosynthetic Efficiency
To test for intrinsic photosynthetic differences between the two size classes of Crocosphaera, the quantum yield of photosystem II (Fv/Fm) of the six strains was tested with 3-(3,4-dichlorophenyl)-1,1-dimethylurea (DCMU) as described in Samuelsson and Öquist (1977). Briefly, triplicate 30 mL cultures of each strain were grown in 50 mL glass tubes in YBCII medium at ∼75 μmol m−2 s−2 and the growth was followed with fluorescence. During acclimated exponential growth, the Chl a fluorescence was measured in dark adapted cells before (Fo) and after (Fm) the addition of DCMU to a final concentration of 10 μM using a Turner TD-700 fluorometer. The quantum yield of photosystem II was then calculated as (Fm − Fo)/Fm.
Field Sampling
Large Crocosphaera-like cells were investigated at two stations (27°19.19 N, 157°46.65 W, and 23°35.59 N, 157°40.24 W) in the North Pacific Subtropical Gyre (NPSG) in July 2010 on the R/V Kilo Moana, at depths of 5 and 25 m. About 100–150 mL samples were filtered onto 8 μm filters, stained with Alcian Blue as described above, and Crocosphaera-like cells and EPS were observed under epifluorescence and light microscopy, respectively. For the second station, the number of large cells on the filter was counted, noting the number that were embedded in stainable EPS.
Results
Cell Staining
Alcian Blue is a stain specific to acid mucopolysaccharides (Passow and Alldredge, 1995b). The large strains produced material that was stainable with Alcian Blue (Figure 1), therefore we conclude that it is chiefly composed of polysaccharides and is similar to the Alcian Blue stainable exopolymers released by other phytoplankton (EPS and TEP; Passow, 2002b). Microscopic observations showed that large strains (e.g., WH0005) do not appear to be releasing particles of exopolymers (or TEP) into the media, but rather a matrix loosely bound to the cells (or EPS; Figures 1A,B). To be consistent with the literature, the previously designated ECM of Crocosphaera (Webb et al., 2009) will be referred to as EPS. Images of a small strain representative (WH0401) show little to no stainable material under microscopic observation during stationary phase (Figures 1C,D).
EPS Production
To determine the timing and magnitude of EPS production in Crocosphaera, three strains each of the large and small size class were grown under N2-fixing conditions (no N added) and EPS production was quantified. Two of the large strains, WH0005 and WH0402, grew at the same rate based on the increase in Chl a, 0.29 day−1, while WH0003 grew somewhat slower in the same conditions, at a rate of 0.17 day−1. Regardless of the difference in growth rate, all three large strains showed EPS production during exponential growth that increased exponentially at a rate similar to its growth rate: EPS increased in large cell cultures at a rate of 0.31, 0.26, and 0.20 day−1 in WH0005, WH0402, WH0003, respectively. The amount of EPS produced by the cells during exponential growth, normalized to Chl a content, averaged 374 ± 33 μg Xanthan gum equivalents (μg chl a)−1 for WH0005, 209 ± 92 μg Xanthan gum equivalents (μg chl a)−1 for WH0402, and 392 ± 116 μg Xanthan gum equivalents (μg chl a)−1 for WH0003 (Table 1), and in the cultures of WH0005 and WH0003, plateaued just after cultures reached stationary phase (Figure 2). This pattern was also seen in two of the small strains, WH0401 and WH0002 (Figure 2). This shows that EPS production occurs mainly in exponential phase in both large and small strains and stationary phase production is not a large contributor to EPS production in Crocosphaera. While visual observations indicated that the small size class strains were not producing EPS, when measured spectrophotometrically, all three small strains tested (WH8501, WH0002, and WH0401) did produced small amounts of EPS, ∼10 times less than is produced by the large size class. Accumulation rates were very similar to their growth rates of 0.1 (WH0401) and 0.28 day−1 (WH0002; Table 1; Figure 2).
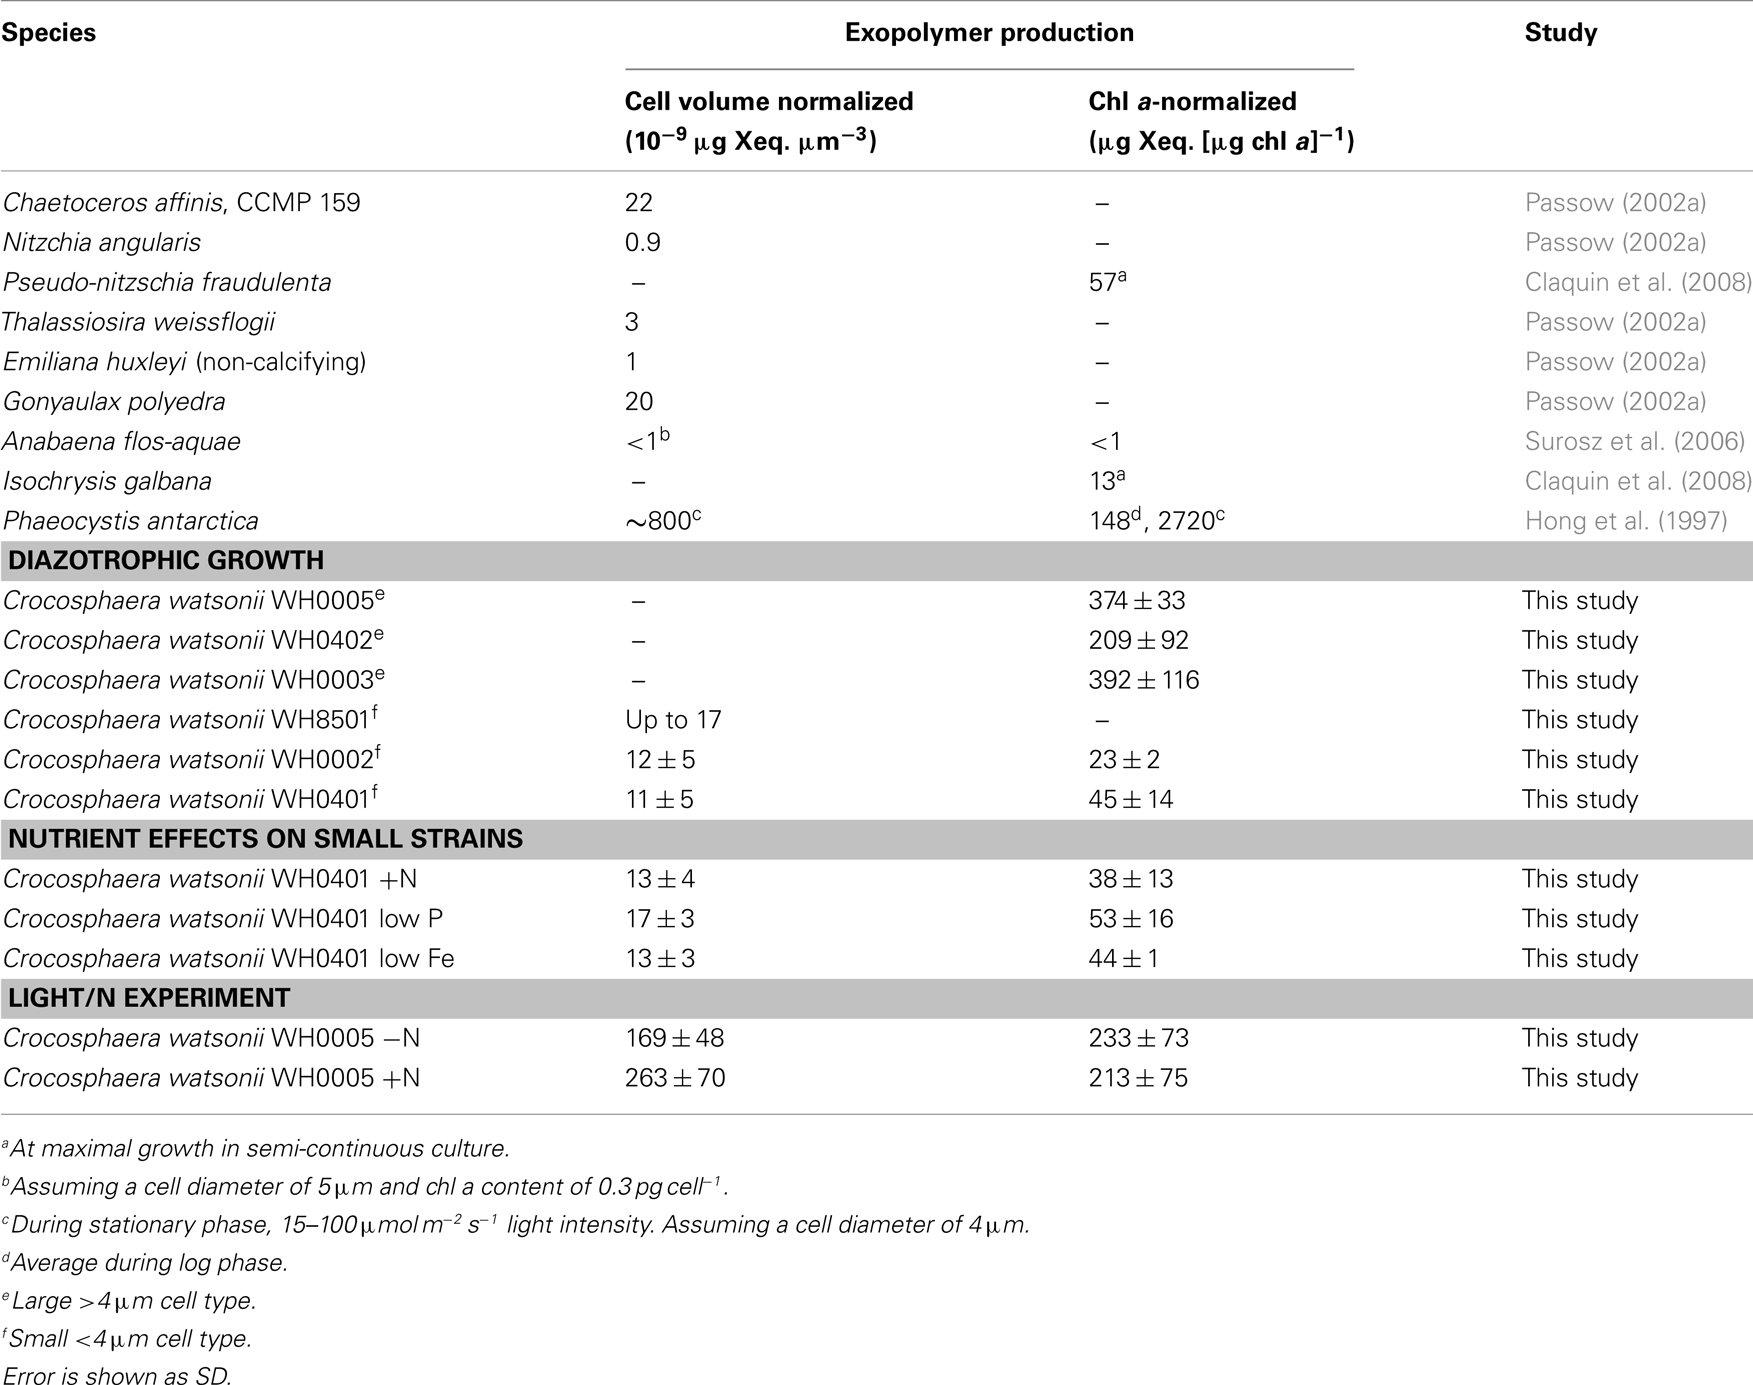
Table 1. Exopolymer production by batch cultures of Crocosphaera in log phase compared to other marine phytoplankton, normalized to both cellular volume and chl a content.
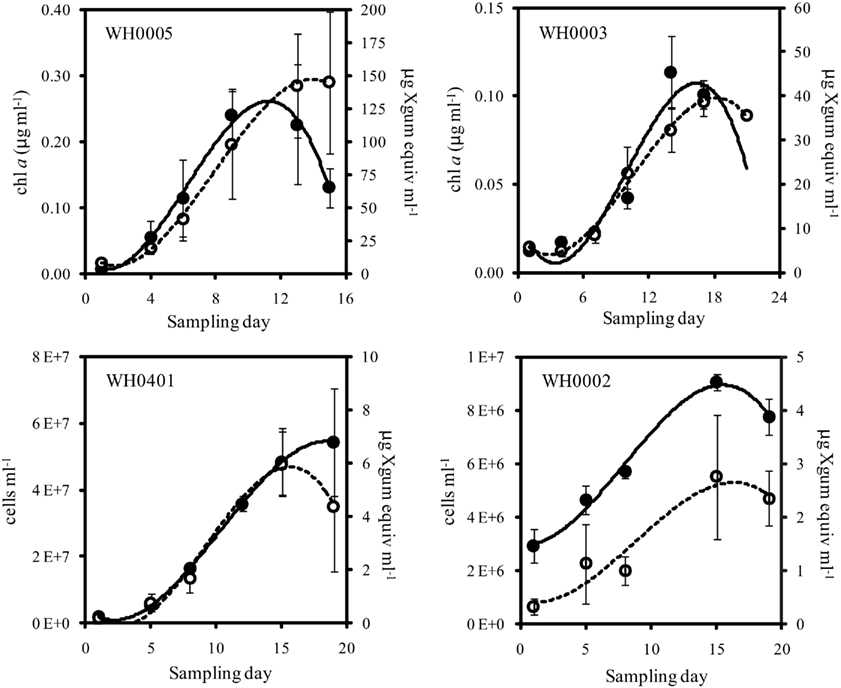
Figure 2. Quantity of Chl a or cells (closed symbols, solid line) and EPS (open symbols, dashed line) from late log phase into stationary phase of large (top) and small (bottom) strains of Crocosphaera. Note that y-axis scales are different. Culture growth in the large strains is represented here with Chl a content, as it is difficult to accurately count cells in late log/stationary phase due to the growth of cells in large clusters. Error bars show SD.
While it is possible that differential cell lysis between large and small size classes could contribute to the order of magnitude difference in EPS production between the two classes, microscopic investigation of large and small strains determined that small, but similar, numbers of lysing cells were identifiable in cultures of both (data not shown). This is consistent with EPS being produced by living Crocosphaera cells.
Nutrient and Light Effects on EPS Production
The addition and depletion of different nutrients in the media and growth on low light levels appeared to have little effect on the amount of EPS produced by representatives of the large and small strains. A comparison of EPS production in cultures of Crocosphaera WH0005 grown at low light (half the intensity of the growth curves described above) and with and without fixed N shows that lower light reduces the growth rates of the culture (from 0.29 to 0.20 day−1) but the accumulation of EPS still occurs at a similar rate to growth (0.23 day−1). The total amount of EPS produced per unit Chl a was somewhat reduced compared to cells grown on higher light (Table 1), but still an order of magnitude greater than produced by small cells. This may be due to higher Chl a production in cells grown under lower light conditions, rather than reduced EPS production; however, because cell counts were not possible through the entirety of the growth curve in standard conditions, these data are not available.
The addition of fixed N did not reduce the rate of EPS accumulation compared to the culture grown without fixed N (0.20 vs. 0.21 day−1, respectively, p = 0.80). EPS was also produced in similar amounts in the +N and −N treatments (Figure 3, Table 1). WH0401, a small strain, also did not alter its EPS production when grown with fixed N, or when grown under Fe or  deficient conditions (Table 1). Chl a and cell normalized EPS concentrations in WH0401 were not significantly different between the three nutrient treatments and the control (p > 0.05).
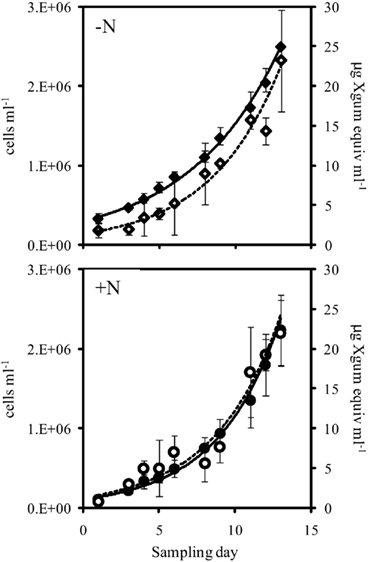
Figure 3. Cell abundance (closed symbols, solid line) and EPS production (open symbols, dashed line) during exponential growth of the large cell class Crocosphaera strain WH0005 without N (top) and with 1 mM  added (bottom). Error bars show SD.
Elemental Analyses
To determine the elemental composition of large Crocosphaera cells and the EPS they produce, a total of six separate culture replicates of WH0005 grown on YBCII with no fixed N added were analyzed for the C and N content. Cellular content of WH0005 averaged 6.4 ± 1.5 pg C cell−1 and 1.3 ± 0.4 pg N cell−1 while the EPS averaged 1.8 ± 0.3 pg EPS-C cell−1 and 0.12 ± 0.03 pg EPS-N cell−1 (Table 2). The contribution of EPS to total POC (EPS-C plus cellular C) was 22% during exponential growth. The contribution of EPS to total PON is much less than the contribution to POC (8.5%), as evidenced by an EPS C:N ratio of 25 compared to a cellular ratio of 7.2 (Table 2). Despite the possibility that heterotrophic bacteria are contributing N to the EPS value, the EPS C:N ratios determined show that the material is depleted in N relative to the cellular fraction and thus is an incomplete nutrient source.
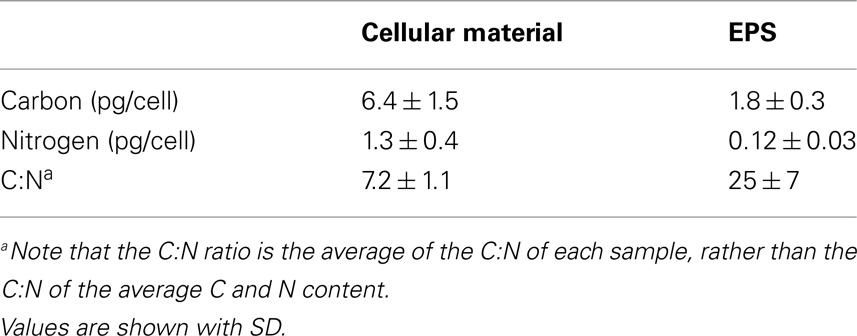
Table 2. Average carbon and nitrogen content of Crocosphaera WH0005 cells and EPS (normalized to cell number) and the average C:N ratio of cellular material and EPS.
Photosynthetic Efficiency
The photochemical efficiency of photosystem II was determined for all six strains of Crocosphaera and it was found that the Fv/Fm of the large strains was ∼0.5, whereas the small strains were ∼0.35 (Figure 4). Comparisons among the large and small strains showed that Fv/Fm within each group was statistically indistinguishable (p > 0.3 and 0.1, respectively). Additionally, pairwise t-tests between all large and small strains showed that Fv/Fm was statistically significantly different between these two phenotypes (p < 0.05). Hence the large strains show a greater quantum yield of photosystem II than the small strains.
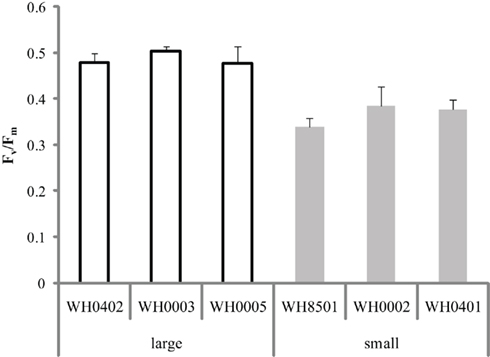
Figure 4. Quantum yield of photosystem II (Fv/Fm) in replicate cultures of six Crocosphaera strains. All large strain samples were statistically significantly different than all small strain samples (p < 0.05), while among each size class, values were statistically indistinguishable. Error bars show SD.
Crocosphaera and EPS in the Field
Extracellular polysaccharides production by field populations of large size class Crocosphaera was investigated using Alcian Blue staining and microscopy. Groupings of large Crocosphaera-like cells were observed at two stations in the North Pacific (Figure 5). Quantification at the second station showed that 74 and 65% of large Crocosphaera-like cells observed were embedded in stainable EPS at depths of 5 and 25 m, respectively. These observations support previous evidence that the large phenotype not only produces EPS in cultures, but in the field as well. These particles of Crocosphaera-like cells and EPS were also found in high abundance in a floating sediment trap deployed at 75 m for 24 h.
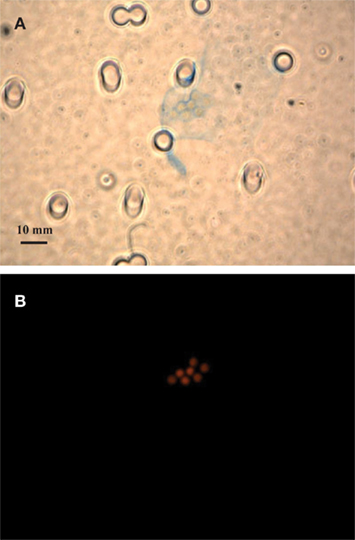
Figure 5. Bright field microscopic images of EPS (A) and epifluorescence images of Crocosphaera-like cells under the DAPI longpass filter set (B) at 27°19.19 N, 157°46.65 W in the NPSG. Both images show the same field of view, at 63× magnification.
Discussion
This study shows that Crocosphaera strains with cells >4 μm produce large amounts of EPS in exponential growth, which is consistent with the qualitative observation previously reported by Webb et al. (2009). However, small amounts of EPS were also measured in the three small strains tested. Therefore, the previous conclusion based on visual observations that the small strains produce no EPS, does not appear to be the case. Rather, the phenotypic difference between large and small strains is an order of magnitude difference in EPS production, along with a previously described difference in chl a-normalized N2 fixation rates (Webb et al., 2009). This result is remarkable considering that laboratory strains of Crocosphaera are nearly identical based on sequence divergence (Zehr et al., 2007; Webb et al., 2009) and that large metagenomic fragments isolated from the subtropical North Pacific showed 97–99% similarity to the WH8501 genome (Zehr et al., 2007). Thus, despite low apparent genomic diversity, there are two distinct phenotypic groups identified with different potential biogeochemical consequences, and this should be considered when quantifying Crocosphaera in the field by microscopy, flow cytometry, or nifH sequence abundance.
Early work on dissolved organic C (DOC) production by phytoplankton suggested that it is released in much greater quantities in stationary phase, compared to exponentially growing cultures (Berman and Holmhansen, 1974). However, like Crocosphaera, many phytoplankton have since been shown to produce EPS and TEP during the exponential growth phase, for example, the diatoms Chaetoceros affinis, Thalassiosira weissflogii, and Nitzchia angularis, the dinoflagellate Gonyaulax polyedra (Passow, 2002a) and the N2-fixing cyanobacterium Anabaena flos-aquae (Surosz et al., 2006). Furthermore, Claquin et al. (2008) found that TEP was produced in semi-continuous cultures kept in log phase, and that maximal TEP production occurred at the optimal growth temperature in five out of seven marine phytoplankton species tested, indicating that for some species, TEP production is greatest when growth is optimal, rather than the more commonly held view that it is maximal in unbalanced growth (Nagata, 2000). The production of EPS in Crocosphaera fits with this model of extracellular release under optimal conditions and exponential growth. The timing of exopolymer release and response to environmental factors could depend on the function of exopolymers in different species (Passow, 2002a). In most cases, the purpose of these materials are not well understood, but some of the proposed functions of exopolymers are the absorption of nutrients (Sutherland, 1988), creation of a protective microenvironment (Reddy et al., 1996), and a sink of excess fixed C during growth imbalance (Otero and Vincenzini, 2004).
While Crocosphaera is not atypical in producing EPS during exponential growth, the amount that the large strains WH0005, WH0402, and WH0003 produce, compared to other tested species, is quite large. Conversely, the small strains (WH0002, WH8501, and WH0401) produced EPS quantities comparable to other phytoplankton (Table 1). Furthermore, the quantity of EPS produced by WH0005 by the end of the light/N experiment, normalized to cell volume, was 1–2 orders of magnitude greater than Passow (2002a) measured (as TEP) in nine species of marine phytoplankton from four phyla during both exponential and stationary growth (Table 1). Chl a-normalized EPS production varied somewhat among the three large strains; however WH0003, WH0005, and WH0402 all produced an order of magnitude more than other phytoplankton (Table 1). Phaeocystis antarctica is the only phytoplankton we found that produces an amount of exopolymeric material equal to or greater than that measured in the three large strains, but it does so in stationary and death phase (Hong et al., 1997), while Crocosphaera produces EPS mainly in exponential phase (Figure 2). However, the contribution of mucopolysaccharides to total POC of Phaeocystis is 2–11% in exponential phase (Alderkamp et al., 2007), compared to 22% that we found during exponential growth in WH0005. Thus, EPS production appears fundamentally different between these two species with high production values of exopolymers.
A number of strains of Nostoc, a freshwater, diazotrophic cyanobacterium, have been shown to produce EPS under N2-fixing conditions, only to reduce or eliminate production when grown on an exogenous N source (Otero and Vincenzini, 2003). It is hypothesized that N2-fixing Nostoc are N limited, leading to the fixation of extra CO2 that is shunted to EPS, while growth on fixed N causes CO2 limitation and cessation of EPS production (Otero and Vincenzini, 2004). In contrast, both the large (WH0005) and small (WH0401) strains produced similar amounts of EPS when grown with or without fixed N. This disparity between Crocosphaera and Nostoc suggests that neither WH0005 nor WH0401 are producing EPS as a sink of overflow production, and instead are producing it constitutively. Furthermore, nutrient depletion for P and Fe did not cause EPS production to increase in a small strain representative (WH0401, Table 1), data that stands in contrast to increases in exopolymer production under Fe stress observed in the diazotrophic cyanobacterium Trichodesmium (Berman-Frank et al., 2007). It remains to be seen if there are other conditions where EPS production in large or small strain Crocosphaera can be altered.
One potential explanation for the difference in EPS produced between the two size classes may be that large strains of Crocosphaera have more efficient CO2 fixation mechanisms than small strains, leading them to fix more CO2 than the small strains and release the excess as EPS. While it is not a direct measure of the efficiency of CO2 fixation, the difference in the quantum yield of photosystem II (Fv/Fm) between the large and small strains (0.5 vs. 0.35 respectively) shows that the large strains are more efficient at using available photons for photochemistry (Falkowski and Raven, 2007). It is important to note, however, that the connection between quantum yield and EPS is shown here to be correlative, not causative. In fact, recent genomic study has revealed the presence of polysaccharide production genes in the genome of a large strain, but not a small strain (Bench et al., in press). The Fv/Fm values determined for the large strains were similar to those seen in other phycoerythrin-containing cyanobacterial cultures; Trichodesmium IMS101 and three Synechococcus strains have Fv/Fm values ∼0.55 (Berman-Frank et al., 2007; Six et al., 2007). Considering these data, the large Crocosphaera appear to have a “typical” efficiency for phycoerythrin-containing cyanobacteria, while the small strains have a low efficiency by comparison. It remains to be seen, however, why the smaller Crocosphaera isolates are less photochemically efficient.
The fact that EPS production has an associated energy cost suggests that it provides some benefit to the large cells. The lower surface area to volume ratio of the large size class could make them more susceptible to nutrient limitation than the small size class. There is evidence that these acidic polysaccharide exudates could act as metal chelators (Geesey et al., 1988), making micronutrients that are scarce in the open ocean more available to the large Crocosphaera. Another possibility is that the EPS production by large cells serves as a grazing deterrent to protistan grazers (Liu and Buskey, 2000).
Regardless, this EPS excretion has a number of hypothetical biogeochemical consequences in the field, as we have shown that a majority of large cells produce EPS there. EPS could feed into the microbial loop by providing a C source for heterotrophic bacteria. Additionally, Crocosphaera EPS might have some nutritional value as appears to contain some N, but this amount would not likely provide complete N nutrition to organisms feeding on it. Alternatively, particles of EPS with Crocosphaera embedded could be grazed directly by larger zooplankton, short-circuiting the microbial loop. This would be a direct input of C and newly fixed N into the classical food chain and up into higher trophic levels. Calanoid copepods collected off coastal California were able to feed on TEP (Ling and Alldredge, 2003), and the cladoceran Ceriodaphnia cornuta showed better growth and reproductive performance when feeding on EPS of the freshwater N2-fixing cyanobacterium Anabaena spiroides compared to feeding on seston (Choueri et al., 2007), suggesting particles of EPS containing Crocosphaera cells could be eaten successfully by larger zooplankton and sustain their growth.
The most well known characteristic of exopolymers is their role in the aggregation of phytoplankton into marine snow (Passow and Alldredge, 1995a). Since the sinking of marine snow is a major pathway of C flux to the deep sea (Passow et al., 2001), Crocosphaera produced EPS may provide a substrate for aggregation of smaller particles that could then sink out of the euphotic zone. We have observed large Crocosphaera-like cells in EPS in shallow sediment traps in the NPSG, providing evidence for the direct sinking of these particles, and showing that EPS production could have a biogeochemical impact in this way. However, more work on the in situ fate of the Crocosphaera produced EPS is needed to resolve its absolute biogeochemical impact.
Conflict of Interest Statement
The authors declare that the research was conducted in the absence of any commercial or financial relationships that could be construed as a potential conflict of interest.
Acknowledgments
This work was supported by National Science Foundation grants OCE-0623499 and OCE-0825922 to Eric A. Webb, and the NSF USC Research Experience for Undergraduates grant OCE-0552988 for Bethanie R. Edwards. The authors would also like to thank Will Berelson and Lisa Collins for carrying out the elemental analysis, Linda Duguay, and the rest of USC REU program team for support and guidance, Chief Scientist Ben Van Mooy for providing the opportunity to collect field data, and the Captain and crew of the R/V Kilo Moana.
References
Alderkamp, A. C., Buma, A. G. J., and Van Rijssel, M. (2007). The carbohydrates of Phaeocystis and their degradation in the microbial food web. Biogeochemistry 83, 99–118.
Bench, S. R., Ilikchyan, I. N., Tripp, H. J., and Zehr, J. P. (in press). Two strains of crocosphaera watsonii with highly conserved genomes are distinguished by strain-specific features. Front. Aquat. Microbiol.
Berman, T., and Holmhansen, O. (1974). Release of photoassimilated carbon as dissolved organic-matter by marine phytoplankton. Mar. Biol. 28, 305–310.
Berman-Frank, I., Rosenberg, G., Levitan, O., Haramaty, L., and Mari, X. (2007). Coupling between autocatalytic cell death and transparent exopolymeric particle production in the marine cyanobacterium Trichodesmium. Environ. Microbiol. 9, 1415–1422.
Biegala, I. C., and Raimbault, P. (2008). High abundance of diazotrophic picocyanobacteria (<3 μm) in a Southwest Pacific coral lagoon. Aquat. Microb. Ecol. 51, 45–53.
Campbell, L., Carpenter, E. J., Montoya, J. P., Kustka, A. B., and Capone, D. G. (2005). Picoplankton community structure within and outside a Trichodesmium bloom in the southwestern Pacific Ocean. Vie et Milieu 55, 185–195.
Capone, D. G., Burns, J. A., Montoya, J. P., Subramaniam, A., Mahaffey, C., Gunderson, T., Michaels, A. F., and Carpenter, E. J. (2005). Nitrogen fixation by Trichodesmium spp.: an important source of new nitrogen to the tropical and subtropical North Atlantic Ocean. Global Biogeochem. Cycles 19, GB2024.
Chen, Y., Zehr, J. P., and Mellon, M. (1996). Growth and nitrogen fixation of the diazotrophic filamentous nonheterocystous cyanobacterium Trichodesmium sp. IMSl01 in defined media: evidence for circadian rhythm. J. Phycol. 32, 916–923.
Choueri, R. B., Melao, M., Lombardi, A. T., and Vieira, A. A. H. (2007). Effects of cyanobacterium exopolysaccharides on life-history of Ceriodaphnia cornuta SARS. J. Plankton Res. 29, 339–345.
Church, M. J., Bjorkman, K. M., Karl, D. M., Saito, M. A., and Zehr, J. P. (2008). Regional distributions of nitrogen-fixing bacteria in the Pacific Ocean. Limnol. Oceanogr. 53, 63–77.
Church, M. J., Jenkins, B. D., Karl, D. M., and Zehr, J. P. (2005). Vertical distributions of nitrogen-fixing phylotypes at Stn ALOHA in the oligotrophic North Pacific Ocean. Aquat. Microb. Ecol. 38, 3–14.
Claquin, P., Probert, I., Lefebvre, S., and Veron, B. (2008). Effects of temperature on photosynthetic parameters and TEP production in eight species of marine microalgae. Aquat. Microb. Ecol. 51, 1–11.
Corzo, A., Morillo, J. A., and Rodriguez, S. (2000). Production of transparent exopolymer particles (TEP) in cultures of Chaetoceros calcitrans under nitrogen limitation. Aquat. Microb. Ecol. 23, 63–72.
Falkowski, P. G., and Raven, J. A. (2007). Aquatic Photosynthesis, 2nd Edn. Princeton: Princeton University Press.
Foster, R. A., Subramaniam, A., Mahaffey, C., Carpenter, E. J., Capone, D. G., and Zehr, J. P. (2007). Influence of the Amazon River plume on distributions of free-living and symbiotic cyanobacteria in the western tropical north Atlantic Ocean. Limnol. Oceanogr. 52, 517–532.
Geesey, G. G., Jang, L., Jolley, J. G., Hankins, M. R., Iwaoka, T., and Griffiths, P. R. (1988). Binding of metal-ions by extracellular polymers of biofilm bacteria. Water Sci. Technol. 20, 161–165.
Hong, Y., Smith, W. O., and White, A. M. (1997). Studies on transparent exopolymer particles (TEP) produced in the Ross Sea (Antarctica) and by Phaeocystis antarctica (Prymnesiophyceae). J. Phycol. 33, 368–376.
Langlois, R. J., Hummer, D., and Laroche, J. (2008). Abundances and distributions of the dominant nifH phylotypes in the Northern Atlantic Ocean. Appl. Environ. Microbiol. 74, 1922–1931.
Ling, S. C., and Alldredge, A. L. (2003). Does the marine copepod Calanus pacificus consume transparent exopolymer particles (TEP)? J. Plankton Res. 25, 507–515.
Liu, H., and Buskey, E. J. (2000). The exopolymer secretions (EPS) layer surrounding Aureoumbra lagunensis cells affects growth, grazing, and behavior of protozoa. Limnol. Oceanogr. 45, 1187–1191.
Moisander, P. H., Beinart, R. A., Hewson, I., White, A. E., Johnson, K. S., Carlson, C. A., Montoya, J. P., and Zehr, J. P. (2010). Unicellular cynanobacterial distributions broaden the oceanic N2 fixation domain. Science 327, 1512–1514.
Montoya, J. P., Holl, C. M., Zehr, J. P., Hansen, A., Villareal, T. A., and Capone, D. G. (2004). High rates of N2 fixation by unicellular diazotrophs in the oligotrophic Pacific Ocean. Nature 430, 1027–1031.
Nagata, T. (2000). “Production mechanisms of dissolved organic matter,” in Microbial Ecology of the Oceans, ed. D. L. Kirchman (New York, NY: Wiley-Liss), 121–152.
Otero, A., and Vincenzini, M. (2003). Extracellular polysaccharide synthesis by Nostoc strains as affected by N source and light intensity. J. Biotechnol. 102, 143–152.
Otero, A., and Vincenzini, M. (2004). Nostoc (Cyanophyceae) goes nude: extracellular polysaccharides serve as a sink for reducing power under unbalanced C/N metabolism. J. Phycol. 40, 74–81.
Parsons, T. R., Maita, Y., and Lalli, C. M. (1984). A Manual of Chemical and Biological Methods for Seawater Analysis. Oxford: Pergamon Press, 173.
Passow, U. (2002a). Production of transparent exopolymer particles (TEP) by phyto- and bacterioplankton. Mar. Ecol. Prog. Ser. 236, 1–12.
Passow, U. (2002b). Transparent exopolymer particles (TEP) in aquatic environments. Prog. Oceanogr. 55, 287–333.
Passow, U., and Alldredge, A. L. (1994). Distribution, size and bacterial-colonization of transparent exopolymer particles (TEP) in the ocean. Mar. Ecol. Prog. Ser. 113, 185–198.
Passow, U., and Alldredge, A. L. (1995a). Aggregation of a diatom bloom in a mesocosm – the role of transparent exopolymer particles (TEP). Deep Sea Res. Part II Top. Stud. Oceanogr. 42, 99–109.
Passow, U., and Alldredge, A. L. (1995b). A dye-binding assay for the spectrophotometric measurement of transparent exopolymer particles (TEP). Limnol. Oceanogr. 40, 1326–1335.
Passow, U., Shipe, R. F., Murray, A., Pak, D. K., Brzezinski, M. A., and Alldredge, A. L. (2001). The origin of transparent exopolymer particles (TEP) and their role in the sedimentation of particulate matter. Cont. Shelf Res. 21, 327–346.
Reddy, K. J., Soper, B. W., Tang, J., and Bradley, R. L. (1996). Phenotypic variation in exopolysaccharide production in the marine, aerobic nitrogen-fixing unicellular cyanobacterium Cyanothece sp. World J. Microbiol. Biotechnol. 12, 311–318.
Samuelsson, G., and Öquist, G. (1977). A method for studying photosynthetic capacities of unicellular algae based on in vivo chlorophyll fluorescence. Plant Physiol. 40, 315–319.
Six, C., Finkel, Z. V., Irwin, A. J., and Campbell, D. A. (2007). Light variability illuminates niche-partitioning among marine picocyanobacteria. PLoS ONE 2, e1341. doi: 10.1371/journal.pone.0001341
Surosz, W., Palinska, K. A., and Rutkowska, A. (2006). Production of transparent exopolymer particles (TEP) in the nitrogen fixing cyanobacterium Anabaena flos-aquae OL-K10. Oceanologia 48, 385–394.
Sutherland, I. W. (1988). Bacterial surface polysaccharides: structure and function. Int. Rev. Cytol. 113, 187–231.
Tripp, H. J., Bench, S. R., Turk, K. A., Foster, R. A., Desany, B. A., Niazi, F., Affourtit, J. P., and Zehr, J. P. (2010). Metabolic streamlining in an open-ocean nitrogen fixing cyanobacterium. Nature 464, 90–94.
Webb, E. A., Ehrenreich, I. M., Brown, S. L., Valois, F. W., and Waterbury, J. B. (2009). Phenotypic and genotypic characterization of multiple strains of the diazotrophic cyanobacterium, Crocosphaera watsonii, isolated from the open ocean. Environ. Microbiol. 11, 338–348.
Zehr, J. P., Bench, S. R., Carter, B. J., Hewson, I., Niazi, F., Shi, T., Tripp, H. J., and Affourtit, J. P. (2008). Globally distributed uncultivated oceanic N2-fixing cyanobacteria lack oxygenic photosystem II. Nature 322, 1110–1112.
Keywords: Crocosphaera, extracellular polysaccharides, diazotroph
Citation: Sohm JA, Edwards BR, Wilson BG and Webb EA (2011) Constitutive extracellular polysaccharide (EPS) production by specific isolates of Crocosphaera watsonii. Front. Microbio. 2:229. doi: 10.3389/fmicb.2011.00229
Received: 20 September 2011;
Accepted: 28 October 2011;
Published online: 15 November 2011.
Edited by:
Rex Malmstrom, DOE Joint Genome Institute, USAReviewed by:
Kathleen Scott, University of South Florida, USAHans Paerl, University of North Carolina–Chapel Hill, USA
Copyright: © 2011 Sohm, Edwards, Wilson and Webb. This is an open-access article subject to a non-exclusive license between the authors and Frontiers Media SA, which permits use, distribution and reproduction in other forums, provided the original authors and source are credited and other Frontiers conditions are complied with.
*Correspondence: Eric A. Webb, Department of Biological Sciences, University of Southern California, 3616 Trousdale Parkway, AHF 107, Los Angeles, CA 90089-0371, USA. e-mail: eawebb@usc.edu