
- Geomicrobiology Group, Institute of Earth and Environmental Science, University of Potsdam, Potsdam, Germany
Hydrocarbons can be found in many different habitats and represent an important carbon source for microbes. As fossil fuels, they are also an important economical resource and through natural seepage or accidental release they can be major pollutants. DNA-specific stains and molecular probes bind to hydrocarbons, causing massive background fluorescence, thereby hampering cell enumeration. The cell extraction procedure of Kallmeyer et al. (2008) separates the cells from the sediment matrix. In principle, this technique can also be used to separate cells from oily sediments, but it was not originally optimized for this application. Here we present a modified extraction method in which the hydrocarbons are removed prior to cell extraction. Due to the reduced background fluorescence the microscopic image becomes clearer, making cell identification, and enumeration much easier. Consequently, the resulting cell counts from oily samples treated according to our new protocol are significantly higher than those treated according to Kallmeyer et al. (2008). We tested different amounts of a variety of solvents for their ability to remove hydrocarbons and found that n-hexane and – in samples containing more mature oils – methanol, delivered the best results. However, as solvents also tend to lyse cells, it was important to find the optimum solvent to sample ratio, at which hydrocarbon extraction is maximized and cell lysis minimized. A volumetric ratio of 1:2–1:5 between a formalin-fixed sediment slurry and solvent delivered highest cell counts. Extraction efficiency was around 30–50% and was checked on both oily samples spiked with known amounts of E. coli cells and oil-free samples amended with fresh and biodegraded oil. The method provided reproducible results on samples containing very different kinds of oils with regard to their degree of biodegradation. For strongly biodegraded oil MeOH turned out to be the most appropriate solvent, whereas for less biodegraded samples n-hexane delivered best results.
Introduction
Hydrocarbons in the environment constitute an important energy source for microorganisms (Bushnell and Haas, 1941). Phylogenetically diverse groups of microorganisms are present in and around oily sediments (Joynt et al., 2006), the oil coming from either natural seepage or man-made oil spills. The world’s largest natural oil reserves are found on the flanks of foreland basins in the Americas (Head et al., 2003; Oil and Gas Journal, 2005), where the general capability for hydrocarbon oxidation was proven in the Athabasca River System (Wyndham and Costerton, 1981). Hydrocarbons enter natural ecosystems by either seepage from geologic reservoirs or through anthropogenic activities (Paisse et al., 2010). They act as environmental pollutants and can cause significant damage to their surrounding but also constitute a carbon source for microorganisms. Natural oils are a mixture of thousands of different compounds. Oil composition depends not just on its source material but also on its degree of biological degradation. Biodegradation preferentially removes n-alkanes, isoprenoid-alkanes, cyclo-alkanes, and aromatic compounds from the oil, with the residue containing increasing amounts of alcohols, acids and other water-soluble compounds (Huang et al., 2008; Head et al., 2010).
Oily sediments have received increased attention over the last few years, especially because of their microbial richness and diversity (Edgcomb et al., 2002). In order to obtain an accurate picture of the microbial community in oily sediments, it is important first to quantify the number of cells.
Unfortunately, enumeration of cells in oily sediments seems to be hampered by hydrocarbons, which tend to interact with the DNA-specific stains and molecular probes (Teske et al., 2002). This causes high background fluorescence and makes oily sediments hard to count, thereby lowering the number of detectable cells.
One possible way to overcome the problem of strong background fluorescence is to extract the cells from the sample. Such techniques are usually used in cases where cell abundance is too low for a direct cell count (Fry, 1988; Cragg et al., 1990). Kallmeyer et al. (2008) developed a method to efficiently extract cells from marine sediments and thereby lowering the minimum detection limit from around 105 cells cm−3 to 103 cells cm−3. The method works well with oil-free sediments from the deep marine subsurface, but does not produce satisfactory results with oily sediments.
To overcome the problem of oil-induced background fluorescence, we developed a method that in a first step extracts hydrocarbons from the sediment and in a second step separates the cells from the sediment matrix prior to counting. Solvents not only dissolve hydrocarbons, they also tend to lyse cells. Different solvents in a wide sample-to-solvent ratio were tested in order to find the most effective solvent and the optimal ratio at which cell lysis does not exceed the positive effect of hydrocarbon removal.
Materials and Methods
Sampling Locations and Samples
Canadian oil sand and processed oil sand
The samples come from an oil sand mining site in the Athabasca Oil Sand area near Ft. McMurray (Alberta, Canada). The crude oil sand, consisting mainly of clays, silicates, water, and hydrocarbons, is dark brown to black and the particle size ranges from fine sand to silt. Clay lenses are common, which gives the sample a very inhomogeneous character. The oil sand sample has a total organic carbon (TOC) content of 13.2%. The extracted oil sand is medium brown and its particle size ranges from fine sand to very fine sand. It contains no clay lenses, but in between the sand, some black nodules are found. The extracted oil sand sample has a TOC content of 0.24%. The mature (biodegraded) oil is the residue of a secondary microbiological degradation (Strausz et al., 2010).
Oily sediments from the Gulf of Mexico
The samples from the Gulf of Mexico are highly diverse. Their total oil content varies significantly, also the sites are affected by either natural hydrocarbon seepage (Beggi Meadow, Orca Basin), or anthropogenic oil spill (Deep Water Horizon wellhead). Other samples are almost devoid of oil (Garden Banks). In contrast to the Canadian oil sand, the oil found in sediment samples from the Gulf of Mexico is rather light and immature (Anderson et al., 1983; Holba et al., 1996).
Beggi Meadow. The sampling site is located in the northern part of the Gulf of Mexico, east of the Mississippi delta (Cooper and Hart, 2002). The sediment sample was taken on Nov 23rd 2010 during Alvin Dive 4652 from the seafloor at 27°N 42.128′; 90°W 38.892′ in a water depth of 834 m. The ambient temperature was 6.3°C. The sediment is very fine-grained, dark gray to black, and very oily.
Orca Basin. The Orca Basin is located in the northern Gulf of Mexico, off the coasts of Texas and Louisiana (26°N 56.25′; 91°W 17.10′). This depression covers an area of about 400 km2 and has a maximum depth of about 600 m below the surrounding seafloor. In the bottom 200 m it contains anoxic, hypersaline (about 250 g kg−1) water. Its bathymetry is attributed to salt diapirism and resulting slump features. The salt diapirism is also responsible for the brine (Shokes et al., 1977; Van Cappellen et al., 1998). The sample was taken from the upper 20 cmbsf (cm below the sea floor) with a multicorer on Nov 21st 2010. Ambient water temperature was 3.6°C. The slightly oily sediment is red and very fine-grained.
Near deep water horizon wellhead (Macondo oilfield). The sample was taken from 1.5 nautical miles south of the wellhead of the Deep Water Horizon Drilling Platform (Macondo wellhead) in the Mississippi Canyon (28°N 43.35′; 88°W 21.77′). The drilling rig is now located in a water depth of 1.5 km, about 66 km off the coast of Louisiana (Kessler et al., 2011). The sample was taken with a multicorer on Nov 30th 2010 from a depth of 5–6 cmbsf. Ambient temperature was 4.3°C. The very fine-grained sediment is ochre to slightly greenish brown and only slightly oily.
Garden Banks. Garden Banks is located 170 km south southeast of Galveston, TX, USA, and is a topographic high (lowest water depth about 40 m) resulting from diapirism of Jurassic-age salt (Rezak et al., 1985). Massive, head-forming corals dominate the summits of both of the banks. Surrounding depths range between 100 m in the north and 150 m in the south. The sample was taken southeast of Garden Banks at 27°N 33.207′; 92°W 32.430′ in a water depth of 568 m with a multicorer on Nov 15th 2010 from a sediment depth of 0–10 cmbsf. Ambient temperature was 6.4°C. The sediment is gray and very fine-grained.
Lake Van
Lake Van is located on a plateau in eastern Anatolia, Turkey. It covers an area of 3570 km2, has a maximum depth of 460 m (Litt et al., 2009), and is the largest soda lake in the world (Kadioglu et al., 1997). The samples were taken during the ICDP drilling operation PALEOVAN in summer 2010 using a hydraulic piston corer. The sample is from the Northern Basin site from a depth of about 3 m below the sea floor (mbsf). It is gray and fine-grained and does not contain any hydrocarbons.
Reagents and Materials
The materials used for the cell extraction have to be absolute cell-free. To achieve this, all glassware used during the cell extraction procedure is combusted before use. In order to increase turnover times, the glass filter towers for the preparation of the filters are not combusted but first washed in a sodium hypochlorite solution, then rinsed first with distilled water then ethanol, followed by a final flaming with a blow-torch directly before use. Reagents were autoclaved if possible and always 0.2 μm filter sterilized immediately before use to remove all cells. The following reagents were used:
• Sodium chloride/formalin solution for preparation of primary marine slurries. To avoid osmotic stress on the cells, the salinity is adjusted to in situ conditions, i.e., 25 g L−1 NaCl for normal marine samples. 20 mL L−1 of formalin is added as a fixative.
• Sodium chloride/sodium azide (NaCl/NaN3) solution for further dilution of the primary marine slurries. Salinity is identical to the respective primary slurry, i.e., 25 g L−1 NaCl for normal marine samples. About 0.1% NaN3 is added as a biocide to prevent growth of accidentally introduced foreign cells, it has the advantage over formalin of not forming any hazardous volatiles.
• Phosphate buffered saline (PBS) for preparation of the primary slurries from terrestrial samples: 8 g L−1 NaCl, 0.2 g L−1 KCl, 1.44 g L−1 Na2HPO4, and 0.24 g L−1 KH2PO4. When preparing primary slurries, 20 mL L−1 of formalin is added.
• Carbonate dissolution mix (CDM) for dissolution of carbonates: 20 mL L−1 (0.43 M) glacial acetic acid and 35 g L−1 (0.43 M) sodium acetate. NaCl and PBS, respectively, are added to correspond to the salinity of the samples. After autoclaving, 20 mL L−1 of formalin is added.
• Tris-aminomethane–ethylenediaminetetraacetic acid buffer (TE-buffer): 1.211 g L−1 tris-aminomethane and 0.372 g L−1 ethylenediaminetetraacetic acid. TE-buffer is used for further dilution of terrestrial samples and for the final rinse of all samples after filtration before staining.
• Detergent mix (DM) for detachment of the cells from sediment particles: 37.2 g L−1 (100 mM) disodium EDTA dihydrate, 44.6 g L−1 (100 mM) sodium pyrophosphate decahydrate, and 10 mL L−1 Tween 80. After autoclaving, formalin is added to a final concentration of 20 mL L−1. The solution is kept under constant stirring during cooling to avoid separation of Tween 80.
• Calcium chloride/sodium acetate (CaCl2/NaAc) solution to neutralize the HF and buffer the pH: 110.984 g L−1 CaCl2 and 82.04 g L−1 Na-acetate.
• Nycodenz for the density separation: 50 g 100 mL−1 Nycodenz.
• The following solvents were used: n-hexane, methanol (MeOH), propanol, n-octane, n-decane, ethanol (EtOH), dichloromethane (DCM), acetone.
Methods
In order to prevent the DNA-specific stains to interact with the hydrocarbons and to increase the minimum detection limit for cell enumeration, hydrocarbons and cells have to be separated from the oily sediment in two consecutive extraction steps. The cell extraction method of Kallmeyer et al. (2008) serves as basis for the new method, therefore parts of the previous method are reiterated for clarity. Figure 1 gives an overview of the complete procedure. The primary sediment slurry is prepared by suspending a sediment sample in a fixative solution of similar salinity and thoroughly shaken to form a homogenous slurry. For marine and terrestrial samples, 2.5% (w/v) sodium chloride solution and 1 × PBS solution are used, respectively. For the sample from the hypersaline Orca Basin, the sodium chloride concentration was increased to 250 g NaCl L−1. Independent of the type and salinity of the samples, formalin is added to the solution to a final concentration of 2%.
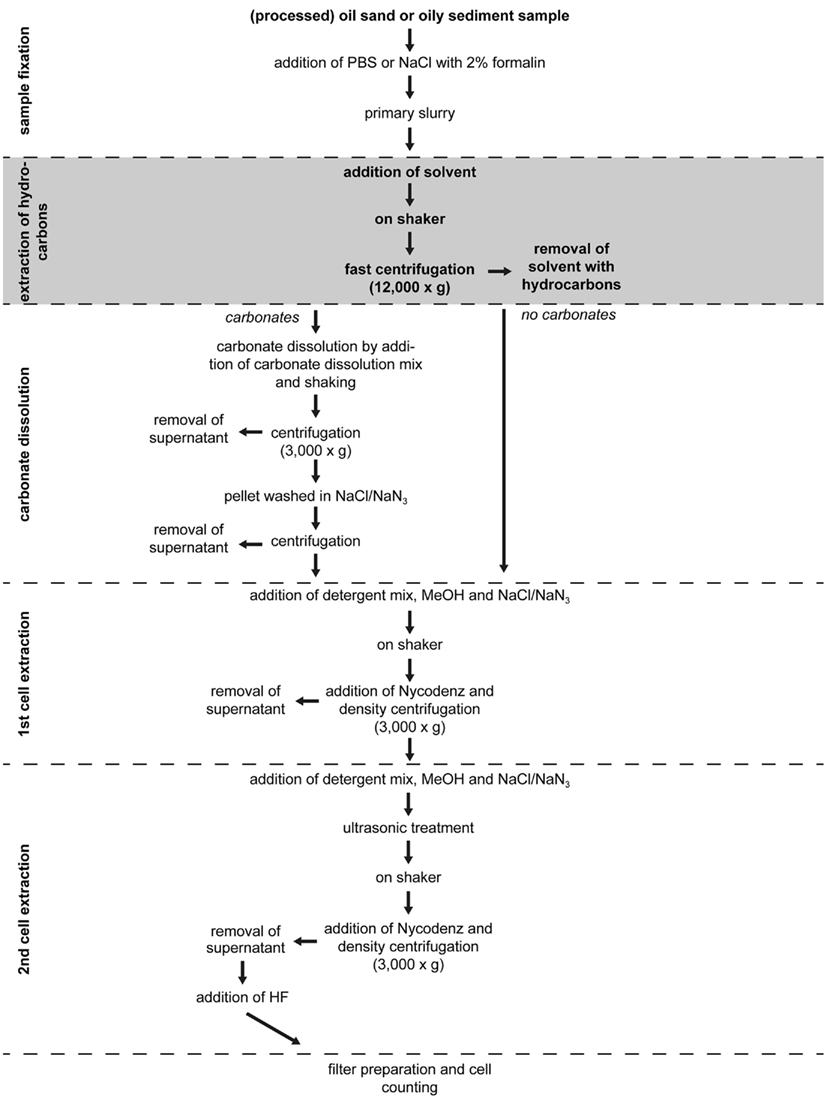
Figure 1. The flow chart shows the complete hydrocarbon and cell extraction procedure for oily sediments. The method is based on the cell extraction procedure of Kallmeyer et al. (2008). The hydrocarbon extraction step is shaded. Details about incubation times and amounts of reagents are provided in the text.
Ratios between sediment and fixative solution vary widely between different users. For all our experiments we use slurries with a 1:5 (v:v) sediment to fixative ratio.
Prior to the actual cell extraction, the hydrocarbons have to be removed from the oily sediments, because they interact with DNA-specific stains used for marking the cells and cause high background fluorescence, thereby preventing exact cell enumeration. We found the optimal ratio of slurry to solvent to be between 1:2 and 1:5, i.e., one part of the slurry combined with two to five parts of the solvent. The slurry and solvent mixture is shaken (Vortex-Genie 2 shaker) for 20 min to allow for dissolution of oil compounds. After the oil extraction, the sample is centrifuged for 15 min at 12,000 × g in order to collect all free floating cells in the pellet. The solvent with the dissolved oil compounds remains in the supernatant and can be decanted off. The cells can then be extracted from the remaining sediment pellet.
Carbonates interfere with the dissolution of the extracellular polymers that bind the cells to the mineral grains. Therefore they have to be dissolved prior to cell detachment (Kallmeyer et al., 2008).
Before performing this time-consuming step, it is advisable to check all samples for their carbonate content under a low magnification stereomicroscope by adding some drops of HCl to a small amount of slurry. All samples used in this study were free of carbonates; we therefore did not perform this step.
After dissolution of hydrocarbons and carbonates, the remaining pellet is suspended with 350 μL of either TE-buffer for the terrestrial samples or with NaCl/NaN3 solution for the marine samples. Then, 50 μL each of DM and methanol (MeOH) are added (Kallmeyer et al., 2008). The mixture of slurry, NaCl/NaN3, or TE-buffer, DM, and MeOH is vortexed at maximum speed for 30 min.
A cushion of 500 μL 50% (wt/vol) Nycodenz is injected into the bottom of the vial according to Kallmeyer et al. (2008), followed by centrifugation at 2,000 × g for 15 min in a swing out rotor centrifuge. The cells are separated from the sediment particles by density centrifugation. The supernatant is treated according to Kallmeyer et al. (2008). The pellet is resuspended in 350 μL TE-buffer or NaCl/NaN3 solution, and again 50 μL each of DM and MeOH are added. After sonicating for 10 min in a sonication bath (Bandelin Sonorex Digitec) at room temperature, the vials are vortexed for 15 min, followed by density separation as described above. The supernatants from the density separation and the carbonate dissolution step are pooled and can be used for cell counting or other applications (Kallmeyer et al., 2008). Prior to filtration, 100 μL of 1% hydrofluoric acid (HF) is added to the supernatant and left for 10 min to reduce non-specific background fluorescence from sediment particles. The filters are rinsed inside the filter towers with a few ml of TE-buffer to remove any remaining HF. One or two blank samples were processed with each batch of samples processed for cell extraction.
For cell counting, the supernatants are filtered onto 0.2 μm polycarbonate filters (Whatman Cyclopore Track Etched Membrane; Jones et al., 1989; Stockner et al., 1990). To ensure an even distribution of the cells on the filter, 5 mL of 0.2 μm filtered TE-buffer or NaCl/NaN3, should be placed into the filter tower prior to the addition of supernatant. Staining and embedding is carried out according to Morono et al. (2009). Cell counting is performed using an epifluorescence microscope.
Results
At the beginning of the experiments, we tried to count cells directly from completely untreated samples similar to the protocol of Cragg et al. (1990). No cells could be detected due to massive background fluorescence caused by the SYBR Green I stain binding to hydrocarbons. The same effect was observed using Acridine Orange instead of SYBR Green I. By using the cell extraction procedure of Kallmeyer et al. (2008) it was possible to see a few cells, but due to the hydrocarbons still being present, there was considerable background fluorescence (Figure 2A). We therefore developed a hydrocarbon extraction step prior to cell extraction, that effectively removed the oil from the sample, thereby drastically reducing background fluorescence (Figure 2B).
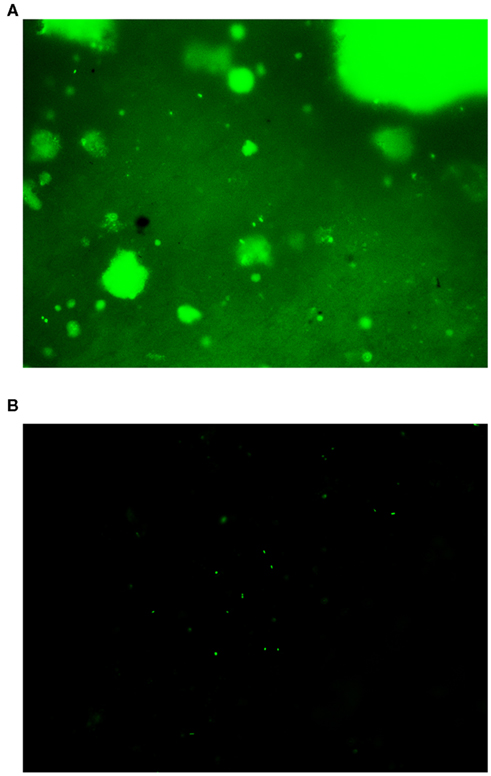
Figure 2. Image of an oil sand sample under the fluorescence microscope. (A) Sample processed according to the extraction procedure of Kallmeyer et al. (2008) without hydrocarbon extraction. Cells are difficult to identify due to strong background fluorescence. (B) Sample after hydrocarbon extraction prior to cell extraction. Background fluorescence is drastically reduced and cells are much easier to detect.
Due to the large range of total cell abundances in the different samples, all results are presented as percent values relative to cell counts obtained by the extraction procedure of Kallmeyer et al. (2008).
For initial tests only a subset of samples (crude and processed oil sand, Garden Banks) was treated with a wide range of solvents: MeOH, n-hexane, propanol, acetone, EtOH, n-octane, n-decane, a mixture of n-hexane and MeOH, a mixture of n-hexane and DCM, and a double extraction with n-hexane. MeOH and n-hexane showed the most promising results (Figures 3A–C), because they delivered high and reproducible cell counts on all samples tested. The other solvents delivered results that were either consistently below 100% (EtOH, acetone, DCM) or did not show high extraction efficiency with all types of samples (n-octane and n-decane).
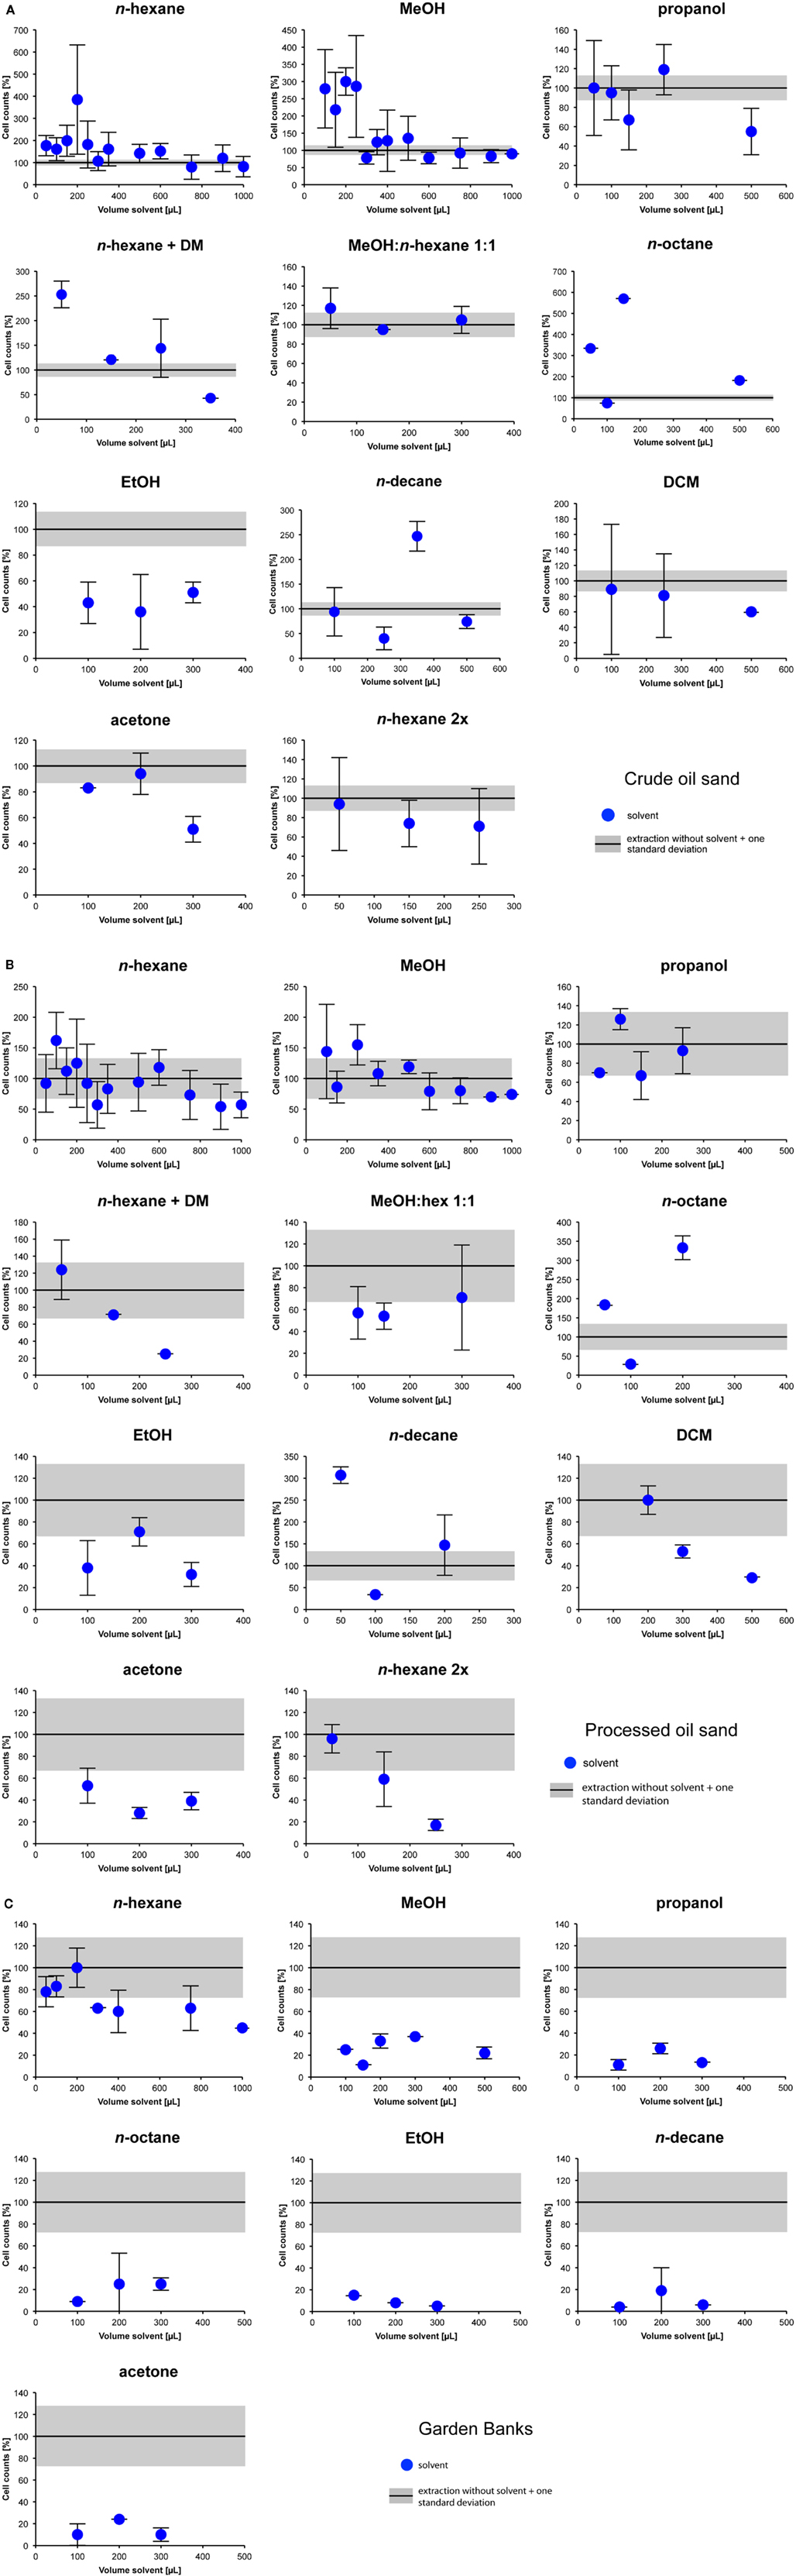
Figure 3. (A) Extraction of hydrocarbons with different solvents applied to a crude oil sand from Athabasca, Canada. To compare the extraction results, cell counts are given as percentages of the results of the standard procedure of Kallmeyer et al. (2008). The obtained cell counts after counting cells from untreated (i.e., without solvent) samples is set to 100%. The shaded areas represent 1 × SD for standard cell extractions without solvent treatment. (B) Extraction of hydrocarbons with different solvents applied to a processed oil sand from Athabasca, Canada. To compare the extraction results, cell counts are given as percentages of the results of the standard procedure of Kallmeyer et al. (2008). The obtained cell counts after counting cells from untreated (i.e., without solvent) samples is set to 100%. The shaded areas represent 1 × SD for standard cell extractions without solvent treatment. (C) Extraction of hydrocarbons with different solvents applied to an oily marine sediment sample from Garden Banks. To compare the extraction results, cell counts are given as percentages of the results of the standard procedure of Kallmeyer et al. (2008). The obtained cell counts after counting cells from untreated (i.e., without solvent) samples is set to 100%. The shaded areas represent 1 × SD for standard cell extractions without solvent treatment. None of the indicated solvents worked well at this sample, because it was almost free of hydrocarbons.
MeOH and n-hexane were therefore tested on a greater variety of samples (Figure 4). For all samples, highest cell counts were achieved with solvent volumes between 100 and 250 μL (i.e., a ratio of primary slurry to solvent of 1:2–1:5). When using lower volumes, the filters still showed some background fluorescence, thereby hampering cell detection. Using higher volumes, the cell extraction efficiency decreased again toward efficiency values of the standard extraction procedure or even below that.
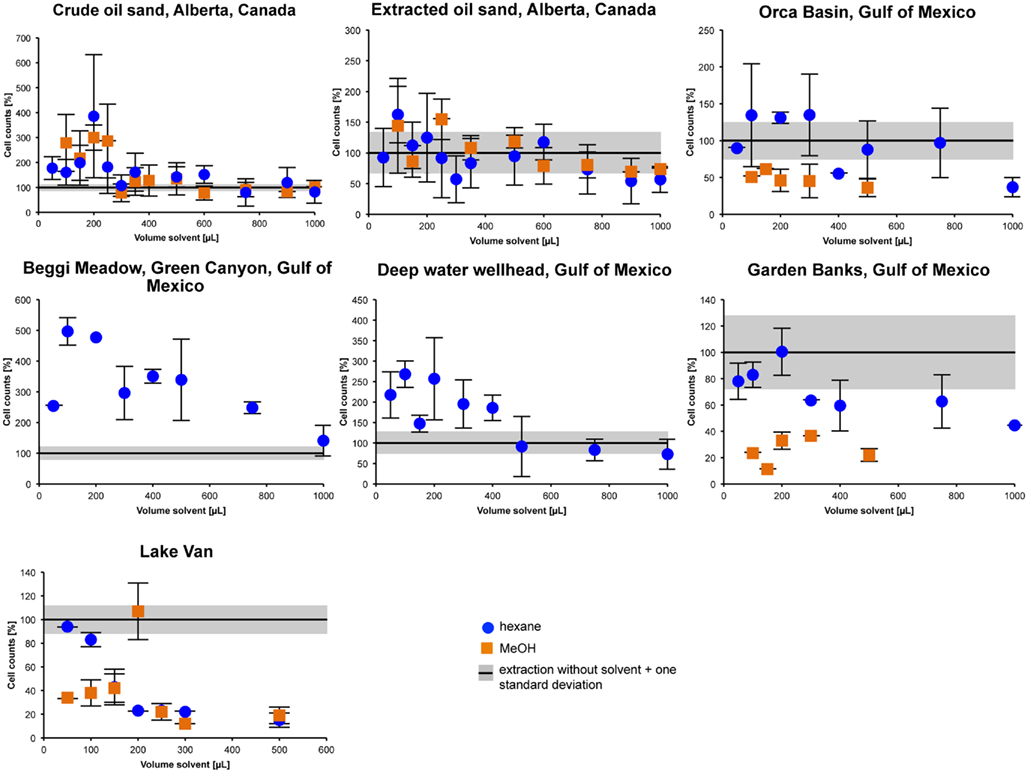
Figure 4. Cell extraction efficiencies for different sample types treated with either n-hexane or MeOH. Cell counts are given as percentages of the results of the standard procedure of Kallmeyer et al. (2008). In most samples a typical pattern becomes obvious. Cell extraction efficiencies are highest for a slurry to solvent ratio of 1:2–1:5 (i.e., between 100 and 250 μL).
Two competing factors appear to control the efficiency of the solvent extraction. The first one is the gain in counting efficiency due to the removal of oil; the second one is lysis of cells by the solvents, which reduces the number of cells in the sample. It is therefore necessary to find the threshold at which the positive effect is maximized and the negative minimized. Therefore we exposed a formalin-fixed culture of E. coli to solvents, using the same sample-to-solvent ratios as for the sediment slurries. About 20% of the cells were lysed by the procedure. To test the efficiency of our new cell extraction method, we added a known amount of E. coli cells to the crude oil sand sample. Of these added cells, 55% could be recovered by the cell separation with solvent extraction (data not shown). This indicates that some of the added cells are either lysed or not extracted.
To further test the effect of solvents on cells in the sediment, we applied our method to a completely oil-free sample from Lake Van and one with very low, barely detectable, oil content (Garden Banks; Figure 4). On these two samples we expected little to no positive effect from the solvent addition and could therefore use them to test whether there is a certain threshold for addition of solvents, above which cell lysis occurs or if cell lysis starts even at very small additions of solvent.
The pattern of extraction efficiency vs. solvent addition in the n-hexane extracted Garden Banks sample follows the same general trend observed in all samples, just shifted to lower values (Figure 4). Maximum efficiency reached 100% at 200 μL of solvent addition. The MeOH extraction did not show any clear trend and remained <50% for all slurry to solvent ratios. The use of other solvents did not lead to higher extraction efficiencies for the Garden Banks sample (Figure 3A).
For the oil-free Lake Van sample the extraction with either solvent (MeOH and n-hexane) did not increase efficiency above the normal extraction, both solvents reached maximum values around 100%. However, for the n-hexane extraction the pattern is somewhat different; highest extraction efficiency (95%) is reached with the lowest amount of solvent added, all higher additions led to much lower efficiencies. For the MeOH extraction, efficiency is generally low (<50%), except for the addition of 200 μL, with which an efficiency of about 100% is achieved.
It appears that MeOH seems to work better in samples containing heavy, mature oil, or bitumen, whereas n-hexane is the most appropriate solvent to remove hydrocarbons in oily sediment samples containing light and rather immature oil (Figure 4).
There is large scatter in the range of best extraction efficiencies. In the sample from Beggi Meadow, all solvent to sample ratios tested delivered higher cell counts than the standard method, even up to 1,000 μL of n-hexane. Still, highest efficiencies were achieved with 100–250 μL of solvent (Figure 4).
To test whether there is a loss of cells from the centrifugation step after hydrocarbon extraction (12,000 × g for 15 min) some supernatants were filtered and counted. No cells were found on any filter indicating that the centrifugation step works well and that all cells remain in the pellet.
We also added light oil (non-biodegraded, API gravity of 32.9°), and heavy oil (strongly biodegraded, API gravity <10°) to oil-free Lake Van sediment. Due to very strong background fluorescence no cells could be detected using the standard method of Kallmeyer et al. (2008). The spiked samples were then processed according to our new solvent extraction method. In the sample spiked with the light oil, it was possible to detect 11 and 33% of the cells with MeOH and n-hexane, respectively, as compared to the oil-free sample. In the sample spiked with the heavy oil, MeOH extraction delivered higher cell counts (47%) than n-hexane (38%). This indicates that the choice of a solvent used depends on the biodegradative state of the oil.
Discussion
By removal of hydrocarbons prior to cell extraction the microscopic image becomes much clearer, making it possible to detect significantly more cells on the filter. The remaining background fluorescence is very low (Figure 2B). Especially the use of n-hexane and MeOH in a slurry to solvent ratio of 1:2–1:5 (50 μL of primary slurry and 100–250 μL of solvent) delivers the best (i.e., highest) cell counts (Figure 4). When using a higher solvent to slurry ratio, cell counts decrease again. Apparently the effect of cell lysis is greater than the improvement of the microscope image by removing interfering hydrocarbons.
The concentration above which cell lysis exceeds the positive effect of hydrocarbon dissolution appears to be dependent on the type of solvent. This might be the reason why for DCM cell counts are lower than those from the standard cell extraction procedure, not just above a certain solvent to slurry ratio, but uniformly over all ratios tested. DCM is also impractical to handle, as it needs special filters, vials and glass syringes, because it dissolves most plastics.
Some solvents might be less suitable than others to dissolve hydrocarbons, especially propanol, EtOH, or acetone. After the treatment with these solvents, the filters still showed background fluorescence, indicating that hydrocarbons were still present in the sample. Concomitantly, the supernatants of the propanol, EtOH, and acetone extraction were almost colorless. In contrary, the supernatants of the n-octane, n-decane, DCM, or n-hexane extraction were dark red to brown, indicating that hydrocarbon extraction was successful.
Although n-octane delivers high cell counts, we do not recommend its use. The samples extracted with n-octane and n-decane showed murky supernatants, containing small flocs of particulate (organic?) matter that settled on the filter and made cell enumerations difficult or even impossible. Given the difficulties with these filters, the reported cell numbers should be treated with caution.
Surprisingly, extractions with a mixture of the two best working solvents (n-hexane and MeOH) lead to lower results than with a single solvent. Also, two consecutive extractions with n-hexane did not lead to higher results either (Figures 3A–C). This is probably due to the fact that the cells were lysed by the long exposure to the solvent.
The discrepancy in the increase of the extraction efficiency between the samples (especially for MeOH) might result from the different compositions of the oils. The more biodegraded or mature the oil is, the less paraffinic compounds it contains (Huang et al., 2008; Head et al., 2010). MeOH – a more polar solvent than n-hexane – might be more useful in strongly mature samples, whereas n-hexane works better with light, more paraffinic oil. This might also explain, why in the terrestrial samples, containing heavy, mature oil, most solvents delivered results coming close to 100% extraction efficiency, whereas in marine samples, containing light oil, the results usually fell below 50% for most solvents (Figures 3A–C).
The increase in extraction efficiency after the solvent extraction is much higher for the original oil sand than for the processed one. This seems to be logical, because there are much more hydrocarbons in the fresh oil sand before the extraction of the oil (TOC of 13.2%) than after the extraction (TOC of 0.24%).
The solvent extraction did not improve cell counting in the oil-poor sediments from Garden Banks and in the oil-free sample from Lake Van. That was expected, because there is no oil in the sediment, which could hamper cell detection. We expected cell lysis to either start at a certain threshold, or to be proportional to the ratio of solvent vs. slurry. The oil-poor Garden Banks sample basically showed such a threshold; with up to 200 μL of n-hexane addition cell abundances were in the same range as the standard extraction, then drop sharply at higher solvent additions. This would be an indication that cell lysis starts even at very low solvent concentrations. The positive effect of hydrocarbon dissolution dominates over the negative effect of cell lysis at low solvent concentrations. This is confirmed by the fact, that the optimal amount of solvent (i.e., 200 μL of n-hexane or MeOH) lyses 20% of the cells of a formalin-fixed pure culture, whereas at higher solvent concentrations up to 90% of the cells were lysed (data not shown). The recovery of only 55% of E. coli cells added to a crude oil sand sample indicates that lysis by the solvent treatment is not the only factor that reduces cell recovery. The most likely other reason is that cells become stuck on oil-coated mineral grains and thereby end up in the sediment pellet and not in the supernatant.
The n-hexane extraction of the oil-free Lake Van sample also shows a similar trend, however, cell numbers decrease even by the smallest solvent addition. There does not seem to be a threshold but rather an immediate negative effect due to solvent addition. The MeOH extraction shows a rather surprising trend with one single sample reaching about 100% efficiency, whereas all other solvent to slurry ratios remain <50%. So far we have no satisfactory explanation for this observation. There is a good chance that this high result is an artifact, because all other results fall into a narrow range.
The recovery of about one third of cells after spiking an oil-free sample with a light (non-biodegraded) oil shows that it is not yet possible to retrieve all cells out of sediment that contains light oil.
It was possible to retrieve about half of the cells from a sample that was spiked with strongly biodegraded oil, using MeOH as a solvent. This is quite surprising because biodegraded oils are much more viscous and sticky and we assumed that these properties would cause more cells to remain stuck on sediment particles and therefore avoid cell extraction.
The fact that n-hexane produces better results in samples containing fresh oils, whereas MeOH works better for samples with heavy oils may be explained by the fact that fresh oils contain more alkanes, which dissolve preferentially in other alkanes like n-hexane. Heavy oils contain a higher fraction of alcohols and water-soluble compounds for which MeOH is a better solvent. Although solvent extraction improves cell extraction efficiency, it has to be kept in mind that cell abundances will always be underestimated.
For the solvent extraction of hydrocarbon-containing sediments, the maximum cell extraction efficiency is achieved with a ratio of primary slurry to pure solvent between 1:2 and 1:5. Outside of this optimum ratio, extraction efficiency is drastically reduced.
Conclusion
Based on the method of Kallmeyer et al. (2008) we developed a cell extraction procedure for hydrocarbon-containing sediments. The focus of this method lies on the removal of hydrocarbons, because they prevent cell enumerations by interacting with the DNA-binding stain causing high background fluorescence. For the dissolution of hydrocarbons, n-hexane turned out to be the most appropriate solvent for light (non-biodegraded) oils whereas MeOH is most appropriate for heavy (biodegraded) oils.
This method works well with sediments from a wide variety of environments containing either heavy or light oils. However, the extraction protocol needs to be tested and individually fine-tuned for every type of sediment and oil in order to find the best working solvent and the optimum solvent to sample ratio at which hydrocarbon extraction is maximized and the effect of cell lysis kept at a minimum. In hydrocarbon-free sediments, the method does not show any positive effects.
Although we developed this extraction technique primarily for cell enumeration, parts or all of it may also be useful for other microbiological and molecular techniques that require hydrocarbon-free samples.
Conflict of Interest Statement
The authors declare that the research was conducted in the absence of any commercial or financial relationships that could be construed as a potential conflict of interest.
Acknowledgments
The marine sediment samples from the Gulf of Mexico were provided by Andreas P. Teske (UNC Chapel Hill). The oil sand and the extracted oil sand samples were provided by the University of Alberta as part of the HAI (Helmholtz Alberta Initiative) project. Clemens Glombitza provided the Lake Van sample. We would like to thank Mareike Noah and Heinz Wilkes from the GFZ (GeoForschungsZentrum) Potsdam for measuring the TOC content of the samples.
References
Anderson, R. K., Scalan, R. S., Parker, P. L., and Behrens, E. W. (1983). Seep oil and gas in gulf of mexico slope sediment. Science 222, 619–621.
Bushnell, L. D., and Haas, H. F. (1941). The utilization of certain hydrocarbons by microorganisms. J. Bacteriol. 41, 653–673.
Cooper, A. K., and Hart, P. E. (2002). High-resolution seismic-reflection investigation of the northern Gulf of Mexico gas-hydrate-stability zone. Mar. Petrol. Geol. 19, 1275–1293.
Cragg, B. A., Parkes, R. J., Fry, J. C., Herbert, R. A., Wimpenny, J. W. T., and Getliff, J. M. (1990). Bacterial biomass and activity profiles within deep sediment layers. Proc. Ocean Drill. Prog. Sci. Results 112, 607–619.
Edgcomb, V. P., Kysela, D. T., Teske, A., Gomez, A. D., and Sogin, M. L. (2002). Benthic eukaryotic diversity in the Guaymas Basin hydrothermal vent environment. Proc. Natl. Acad. Sci. U.S.A. 99, 7658–7662.
Fry, J. C. (1988). “Determination of biomass,” in Methods in Aquatic Bacteriology, ed. B. Austin (John Wiley & Sons Ltd.), 27–72.
Head, I. M., Jones, D. M., and Larter, S. R. (2003). Biological activity in the deep subsurface and the origin of heavy oil. Nature 426, 344–352.
Head, I. M., Larter, S. R., Gray, N. D., Sherry, A., Adams, J. J., Aitken, C. M., Jones, D. M., Rowan, A. K., Huang, H., and Röling, W. F. M. (2010). “Hydrocarbon degradation in petroleum reservoirs,” in Handbook of Hydrocarbon and Lipid Microbiology, ed. K. N. Timmis (Berlin: Springer-Verlag), 3097–3109.
Holba, A. G., Dzou, L. I. P., Hickey, J. J., Franks, S. G., May, S. J., and Lenney, T. (1996). Reservoir geochemistry of South Pass 61 Field, Gulf of Mexico: compositional heterogeneities reflecting filling history and biodegradation. Org. Geochem. 24, 1179–1198.
Huang, H. P., Zhou, S. Q., and Liu, Y. M. (2008). Biodegradation and origin of oil sands in the Western Canada sedimentary basin. Petrol. Sci. 5, 87–94.
Jones, S. E., Ditner, S. A., Freeman, C., Whitaker, C. J., and Lock, M. A. (1989). Comparison of a new inorganic membrane-filter (anopore) with a Track-etched polycarbonate membrane-filter (nuclepore) for direct counting of bacteria. Appl. Environ. Microbiol. 55, 529–530.
Joynt, J., Bischoff, M., Turco, R., Konopka, A., and Nakatsu, C. H. (2006). Microbial community analysis of soils contaminaed with lead, chromium and petroleum hydrocarbons. Microb. Ecol. 51, 209–219.
Kadioglu, M., Sen, Z., and Batur, E. (1997). The greatest soda-water lake in the world and how it is influenced by climatic change. Ann. Geophysicae 15, 1489–1497.
Kallmeyer, J., Smith, D. C., Spivack, A. J., and D’hondt, S. (2008). New cell extraction procedure applied to deep subsurface sediments. Limnol. Oceanogr. Methods 6, 236–245.
Kessler, J. D., Valentine, D. L., Redmond, M. C., Du, M. R., Chan, E. W., Mendes, S. D., Quiroz, E. W., Villanueva, C. J., Shusta, S. S., Werra, L. M., Yvon-Lewis, S. A., and Weber, T. C. (2011). A persistent oxygen anomaly reveals the fate of spilled methane in the deep Gulf of Mexico. Science 331, 312–315.
Litt, T., Krastel, S., Sturm, M., Kipfer, R., Orcen, S., Heumann, G., Franz, S. O., Ulgen, U. B., and Niessen, F. (2009). ‘PALEOVAN,’ International Continental Scientific Drilling Program (ICDP): site survey results and perspectives. Quat. Sci. Rev. 28, 1555–1567.
Morono, Y., Terada, T., Masui, N., and Inagaki, F. (2009). Discriminative detection and enumeration of microbial life in marine subsurface sediments. ISME J. 3, 503–511.
Paisse, S., Goni-Urriza, M., Coulon, F., and Duran, R. (2010). How a bacterial community originating from a contaminated coastal sediment responds to an oil input. Microb. Ecol. 60, 394–405.
Rezak, R., Bright, T. J., and Mcgrail, D. W. (1985). Reefs and Banks of the Northern Gulf of Mexico: Their Geological, Biological and Physical Dynamics. New York: John Wiley and Sons, 259.
Shokes, R. F., Trabant, P. K., Presley, B. J., and Reid, D. F. (1977). Anoxic, hypersaline basin in Northern Gulf of Mexico. Science 196, 1443–1446.
Stockner, J. G., Klut, M. E., and Cochlan, W. P. (1990). Leaky filters – a warning to aquatic ecologists. Can. J. Fish. Aquat. Sci. 47, 16–23.
Strausz, O. P., Morales-Izquierdo, A., Kazmi, N., Montgomery, D. S., Payzant, J. D., Safarik, I., and Murgich, J. (2010). Chemical composition of Athabasca bitumen: the saturate fraction. Energy Fuels 24, 5053–5072.
Teske, A., Hinrichs, K.-U., Edgcomb, V., De Vera Gomez, A., Kysela, D., Sylva, S. P., Sogin, M. L., and Jannasch, H. W. (2002). Microbial diversity of hydrothermal sediments in the guaymas basin: evidence for anaerobic methanotrophic communities. Appl. Environ. Microbiol. 68, 1994–2007.
Van Cappellen, P., Viollier, E., Roychoudhury, A., Clark, L., Ingall, E., Lowe, K., and Dichristina, T. (1998). Biogeochemical cycles of manganese and iron at the oxic-anoxic transition of a stratified marine basin (Orca Basin, Gulf of Mexico). Environ. Sci. Technol. 32, 2931–2939.
Keywords: cell enumeration, hydrocarbons, cell separation, subsurface microbiology
Citation: Lappé M and Kallmeyer J (2011) A cell extraction method for oily sediments. Front. Microbio. 2:233. doi: 10.3389/fmicb.2011.00233
Received: 11 July 2011; Accepted: 04 November 2011;
Published online: 21 November 2011.
Edited by:
Andreas Teske, University of North Carolina at Chapel Hill, USAReviewed by:
Slava Epstein, Northeastern University, USACasey R. J. Hubert, Newcastle University, UK
Copyright: © 2011 Lappé and Kallmeyer. This is an open-access article subject to a non-exclusive license between the authors and Frontiers Media SA, which permits use, distribution and reproduction in other forums, provided the original authors and source are credited and other Frontiers conditions are complied with.
*Correspondence: Michael Lappé, Geomicrobiology Group, University of Potsdam, Karl-Liebknecht-Straße 24-25, 14476 Potsdam-Golm, Germany. e-mail: lappe@geo.uni-potsdam.de