
- 1 Department of Ecology and Evolutionary Biology, University of California Irvine, Irvine, CA, USA
- 2 Division of Planning, Science and Resource Management, Santa Monica Mountain National Recreation Area, U.S. National Park Service, Thousand Oaks, CA, USA
- 3 IFEVA, Facultad de Agronomía, CONICET – Universidad de Buenos Aires, Buenos Aires, Argentina
Methane (CH4) flux from ecosystems is driven by C1-cycling microorganisms – the methanogens and the methylotrophs. Little is understood about what regulates these communities, complicating predictions about how global change drivers such as nitrogen enrichment will affect methane cycling. Using a nitrogen addition gradient experiment in three Southern California salt marshes, we show that sediment CH4 flux increased linearly with increasing nitrogen addition (1.23 μg CH4 m−2 day−1 for each g N m−2 year−1 applied) after 7 months of fertilization. To test the reason behind this increased CH4 flux, we conducted a microcosm experiment altering both nitrogen and carbon availability under aerobic and anaerobic conditions. Methanogenesis appeared to be both nitrogen and carbon (acetate) limited. N and C each increased methanogenesis by 18%, and together by 44%. In contrast, methanotrophy was stimulated by carbon (methane) addition (830%), but was unchanged by nitrogen addition. Sequence analysis of the sediment methylotroph community with the methanol dehydrogenase gene (mxaF) revealed three distinct clades that fall outside of known lineages. However, in agreement with the microcosm results, methylotroph abundance (assayed by qPCR) and composition (assayed by terminal restriction fragment length polymorphism analysis) did not vary across the experimental nitrogen gradient in the field. Together, these results suggest that nitrogen enrichment to salt marsh sediments increases methane flux by stimulating the methanogen community.
Introduction
Methane (CH4) is an important greenhouse gas that is over 20 times more effective at trapping heat than carbon dioxide. The primary biological source of methane is microbial (methanogens in the domain Archaea), as is the primary biological sink (methanotrophs among the Bacteria and Archaea). Therefore, understanding the controls on these microorganisms is important for predicting methane flux from ecosystems, especially in the face of global change drivers such as nitrogen enrichment.
Recently, atmospheric methane has been rising non-linearly, increasing steadily by ∼1% per year (Lelieveld et al., 1993), leveling off between 1999 and 2007 (Rigby et al., 2008) and now rising again (Heimann, 2011). One hypothesis for these dynamics is changes in agricultural practices (including chemical fertilizers) that impact microbial sources of methane (Kai et al., 2011). Thus, understanding the controls of C1-cycling microorganisms may be central to predicting future atmospheric methane dynamics.
A variety of microbial taxa are involved in methane flux, and C1-cycling in general. Methanogens are strictly anaerobic organisms that can use a narrow range of C1 compounds and acetate (e.g., organic acids, methanol, methylamines, and H2 with CO2) for energy and assimilation, with methane as the final byproduct of this metabolism. In terrestrial systems, the C compounds that methanogens use derive from plants (root exudates or detritus) and the metabolic byproducts of heterotrophic microorganisms. Methanotrophs, which utilize methane for energy and assimilation, are a subset of the broader group of all C1-consumers known as methylotrophs. The biological oxidation of methane by methanotrophs (methanotrophy) occurs both aerobically and anaerobically. Non-methanotrophic methylotrophs, utilizing C1 compounds other than methane, are also intimately involved in the methane cycle. There is a close physical association between aerobic methanotrophs and non-methanotrophic methylotrophs in the environment (Moussard et al., 2009; Qiu et al., 2009), where methylotrophs likely consume the key intermediate of methane metabolism (methanol) that would otherwise inhibit methanotrophy (Wilkinson et al., 1974; Neufeld et al., 2008).
Anthropogenic nitrogen (N) enrichment through atmospheric deposition and terrestrial runoff (Galloway et al., 2004; Dentener et al., 2006) impacts the biodiversity and functioning of a wide variety of ecosystems (Vitousek et al., 2002). In particular, runoff from storm water, agriculture, and industrial sources increases N inputs in coastal ecosystems such as salt marshes (Conley et al., 2009). This increased nutrient availability clearly alters salt marsh functioning by altering plant growth and plant community composition (Fitch et al., 2009; Graham and Mendelssohn, 2010; Cardoni et al., 2011). However, much less is known about how N enrichment will alter microbially mediated biogeochemical cycles such as C1-cycling. Nitrogen inputs may alter C1-cycling directly by affecting the abundance, composition or efficiency of C1-cycling taxa (Bodelier and Laanbroek, 2004; Aronson and Helliker, 2010). Alterations may also occur indirectly, through changes in the plant community and C availability to sediment microorganisms. Salt marsh plants are usually N limited (Caffrey et al., 2007; Crain, 2007), therefore N typically stimulates aboveground plant biomass and possibly, the amount and quality of carbon exudates leaked into the sediments (Dakora and Phillips, 2002).
It is unclear whether methanogens might be N limited in natural ecosystems. However, most evidence suggests that nitrate strongly suppresses methane production, whereas ammonium-based fertilizers may sometimes have a minor suppressive effect (Conrad, 2007). In salt marshes, N addition might also indirectly increase methanogen abundance or metabolic efficiency through increased root exudates by reducing competition for C from sulfate-reducers. Indeed, methanogens in anaerobic marine sediments are thought to be out-competed for labile carbon substrates by sulfate-reducing bacteria (Oremland and Polcin, 1982) and are therefore subject to chronic C limitation.
Methylotrophs (including methanotrophs) are probably not N limited in salt marshes, as many can assimilate ammonium and some can fix nitrogen (Hanson and Hanson, 1996; Auman et al., 2001; Bodelier and Laanbroek, 2004). However, high N levels can permanently or reversibly inhibit methanotrophy (Shimel and Gulledge, 1998). N addition might also shift the methanotroph community toward better competitors in N-replete conditions (Type I methanotrophs) over those that prevail in N-limited conditions (Type II methanotrophs; Graham et al., 1993). Methylotrophs, many of which are facultative and can use non-C1 compounds, might also respond to increased C through plant root exudates, perhaps altering cross-feeding interactions between methanotrophs and other methylotrophs.
Apart from the unclear effects of N addition on methanotrophy and methanogenesis, we lack quantitative predictions about the relationship between N availability and net CH4 flux. Experimental gradients with multiple treatment levels allow the estimation of “response curves” to a range of N enrichment conditions. In this way, one might also identify critical thresholds, beyond which an ecosystem dramatically changes its functioning (Cottingham et al., 2005). Such quantitative results can then be incorporated into ecosystem models. However, the vast majority of field experiments investigating the effect of N addition on ecosystem functioning have used single N doses, making it difficult to extrapolate these results to the wide range of N enrichment scenarios projected in the future. Indeed, of 48 studies reviewed about the effect of N addition on gas fluxes (Liu and Greaver, 2009), only one had three experimental levels of N addition. Another meta-analysis focused specifically on methane flux showed that methane flux increases linearly with the amount of N added in upland soils (Aronson and Helliker, 2010); however, it remains unclear whether this cross-ecosystem pattern holds within any one ecosystem, let alone salt marshes.
To investigate the effect of nitrogen addition on C1-cycling microorganisms and methane flux in coastal salt marsh sediments, we conducted a nitrogen addition gradient experiment in three Southern California salt marshes. This experiment allowed us to ask quantitatively how methane flux changes in response to increased N addition in the field. Using laboratory microcosms, we then tested whether this response was likely due to changes in methanotrophy and/or methanogenesis via increased nitrogen or carbon availability. Finally, we tested whether N addition changed the abundance and composition of the methylotrophs, a broad but major player in C1-cycling.
Materials and Methods
Study Site Description
We selected three southern California salt marshes for this study, Morro Bay National Estuary (MBE), Carpinteria Salt Marsh (CSM) Reserve, and Tijuana River Reserve Estuary (TRE). All include intertidal estuarine wetlands with deep channel sub-tidal habitat (natural and artificial channels) and receive intermittent and chronic nitrogen inputs from urban and agricultural runoff. We chose these marshes for their similarities of vegetation types, Mediterranean-type coastal climate, protected status, and having areas within the marsh with similar tidal flooding regimes (i.e., plots flood during a ≥ +1.6 m tide). We determined sediment salinity (using a refractometer), pH (in a 1:1 mixture with distilled water), and total carbon and nitrogen content (by dry combustion with a Flash EA1112 Series NC Analyzer) from sediment cores taken to a depth of 10 cm in the three sites (Table 1).
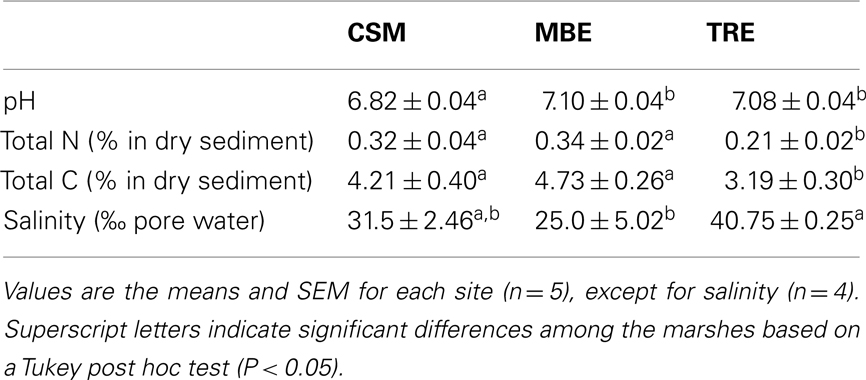
Table 1. Sediment properties by marsh in the control (no N added) plots.
Morro Bay National Estuary (35°20′00′′N, 120°49′51′′W) is the northernmost marsh in our study located in Morro Bay, California (San Luis Obispo County). The 930 ha estuary is protected as a U.S. National Estuary. MBE is at the terminus of a 19,424 ha watershed that drains the Los Padres National Forest, agricultural fields, ranches and parks. MBE is fed directly by the Los Osos and Chorro Creeks. Much of the area directly surrounding the marsh is protected parkland (California State Parks) with the cities of Morro Bay and Los Osos adjacent.
Carpinteria Salt Marsh (34°24′03′′N, 119°32′09′′W) is located in Carpinteria, California (Santa Barbara County) and is part of the University of California Natural Reserve System. At ∼93 ha, CSM is the smallest of our three study sites. CSM receives year-round nutrient inputs and other pollutants directly from culverts draining a large upstream nursery complex and the Carpinteria Creek watershed (3884 ha) that drains open field agriculture, orchards, and receives runoff from densely populated urban areas.
Tijuana River Reserve Estuary (32°32′59′′N, 117°07′22′′W) is the largest and southernmost study site located just north of the Mexico–United States border in Imperial Beach, California (San Diego County). The Tijuana River Reserve is part of the National Estuarine Research Reserve System. The 1024 ha estuary is at the terminus of a 453,248 ha watershed that drains the Tijuana River Valley, three quarters of which is located in Mexico. The Tijuana River has been used as a wastewater conduit for several decades. Though progress has been made to reduce the sewage that flows into the estuary with upstream treatment facilities, moderate rain events will cause raw sewage to overflow into the estuary.
Experimental Design
In the three study sites, we established seven levels of N addition: 0, 10, 20, 40, 80, 160 and 320 g N m−2 year−1. We randomly assigned treatments to 1 m2 plots spaced 2 m apart from each other (N = 105 plots; 3 marshes × 7 treatment levels × 5 replicates/treatment). Each fertilization treatment was replicated five times. This gradient included the most common fertilization rates used in N addition studies in wetlands (100–300 g N m−2 year−1; Boyer and Zedler, 1998; Boyer et al., 2001; Crain, 2007) as well as fertilization rates used in studies to evaluate the effect of N deposition (10–100 g N m−2 year−1) on ecosystem functioning (Bradford et al., 2008). In each marsh, we located the plots in areas with vegetation dominated by Salicornia virginica (pickleweed) and in similar positions in the marsh (i.e., distance to main channel, distance to the ocean, similar tidal flooding regime).
We added nitrogen as slow-release granular urea to provide a sustained enrichment over time (∼10 weeks) rather than in a single pulse. Granular urea converts rapidly to ammonium upon contact with water. We buried nine perforated 50-ml centrifuge tubes (8 cuts, 4 cm long × 4 mm wide) per plot, leaving only the caps exposed above the sediment. Tubes were placed evenly (33 cm apart) for homogeneous fertilizer delivery within the plot. The tubes remained in place during the experiment, and we replaced nylon mesh fertilizer bags in these tubes every 10 weeks during the course of the experiment. Urea-free tubes in unfertilized plots were used as disturbance controls. We applied the first fertilizer treatment in July 2008. Here we report results from February 2009, after 7 months of fertilization. We sampled each site over the course of 2 days and all sites within 1 week.
Field Gas Sampling
We measured methane flux using static gas chambers (16 cm high with a surface area of 104 cm2) that were gently secured 2.5 cm deep into the sediment of each plot at the time of sampling. We clipped the plant biomass just above the sediment surface of this space at the beginning of the experiment to limit our measurements to microbial and root emissions and let the system stabilize for 7 months before sampling. We sampled gases (5 ml) from the capped headspace by syringe. Before withdrawing the sample, we mixed the headspace gases first by pumping the syringe several times and injected it into an evacuated gas-tight vial. Each plot was sampled at four time points after securing the chamber (0, 30, 60, and 90 min). We also intermittently collected positive control (1000 ppm CO2) and atmospheric samples to test for leakages, but none were detected. We analyzed CH4 concentrations with a gas chromatograph (Shimadzu GC2014, equipped with a Thermal Conductivity Detector for measuring CO2 connected in series to a Flame Ionization Detector to measure CH4, and fitted with a 2-ml sample loop, Shimadzu Corporation, Kyoto, Japan). We calculated CH4 flux rates for each plot as the slope of the linear regression of gas concentration over time. The detection limit was 0.7 ppm CH4. In a few cases, we eliminated outliers and estimated the production rate without that time point.
Nutrient Addition Microcosm Experiments
To assess potential N and C limitation for salt marsh methanotrophs and methanogens, we conducted two companion microcosm experiments in the laboratory. Using a fully factorial replicated design we added N, C, and both N and C to sediment cores (5 cm deep, 1.5 cm diameter) collected aseptically from an area adjacent to the established plots at Tijuana River Estuary in July 2009. To establish an aerobic environment for the methanotroph experiment and inhibit the methanogens present, each core was removed from the corer in the laboratory and homogenized thoroughly in the presence of air for 5 min (6 cores/treatment, N = 24 microcosms). We then placed the homogenized core in the microcosm tube, added the treatments described above and sealed the tube. To establish an anaerobic environment for the methanogen experiment and inhibit the methanotrophs present, other cores were kept intact in the sterile plastic corers to reduce their exposure to oxygen (N = 24 microcosms).
To test for N limitation, we added an amount of ammonium chloride solution equivalent to 7 days of fertilization in the 160 g N m−2 year−1 field treatment in one dose at the beginning of the experiment (41.4 mg ammonium chloride in a 2-ml injection, or 383.2 mM). Ammonium chloride was used because it dissolves rapidly in water, delivering the N (as ammonium) immediately instead of the slow-release urea that was used in the field experiment. To test for C limitation, we added the C substrate in two forms depending on the experiment. To the methanotroph experiment, we added methane gas (10 ml of 10 ppm CH4 balanced in air for an average starting concentration of 5.87 ppm CH4 ± 0.45 ppm). In comparison, the control treatment had an ambient CH4 concentration (1.7 ppm CH4; lab air verified by gas chromatography). To the methanogen experiment, we added sodium acetate as the carbon substrate (2 mg sodium acetate in a 2-ml injection, or 12.2 mM). Sodium acetate was chosen because it is labile but does not encourage fermentation reactions. We added it at approximately double the weight of microbial biomass (Allison and Vitousek, 2005), which was estimated at 0.8 mg/g dry sediment based on total C analysis of the sediments. The control microcosms received a sterile sodium chloride solution to account for the extra ions and water added by the treatments. After adding the nutrients by syringe throughout the cores, we sealed the tubes, and for the methanogen experiment, flushed them with pure nitrogen gas. Finally, we incubated the sealed microcosms from both experiments at 20°C.
We collected gas samples (5 ml) from the headspace of the microcosms at 18, 48, and 72 h incubation. We analyzed the first 3 day’s samples; however, we report only the results from the first time point (0–18 h) due to the high accumulation of CO2 in the microcosms, which could alter microbial functioning. We determined CH4 concentrations with gas chromatography and CH4 flux as described above.
Methylotroph Diversity
To examine the background methylotroph diversity in each salt marsh, we prepared clone libraries targeting the methanol dehydrogenase gene (mxaF). This gene occurs in all gram-negative methylotrophs and is diagnostic for methylotrophy (McDonald et al., 2008). Therefore mxaF should target aerobic obligate and facultative methanotrophs as well as other methylotrophs. We collected one sediment core (10 cm deep, 3 cm diameter core) just outside the experiment plots at each marsh in September 2008. We extracted total genomic DNA using the FastDNA® Spin Kit for Soil (MP Biomedicals, Santa Ana, CA, USA). PCR conditions for the mxaF gene were: (25-μl reaction vol.) initial denaturing 95°C (5 min), anneal at 55.6°C (30 s), extension at 72°C (40 s), 30 cycles total with a final extension step of 72°C (5 min) (PTC-100 Thermocycler, Bio-Rad, Hercules, CA, USA). [Final concentration: forward and reverse primers 250 nM (mxaF forward 5′-TGGAACGAGACCATGCGTC, reverse 5′-CATGCAGATGTGGTTGATGC (Moosvi et al., 2005), 1 unit Taq polymerase, MasterAmp™ 1x Premix F (Epicentre Biotechnologies, Madison, WI, USA).] We visualized the ∼455 bp product on a 0.8% agarose gel, and this fragment was then excised, purified (QIAquick Gel extraction kit, Qiagen, Valencia, CA, USA), and cloned (Invitrogen PCR4Topo kit, Carlsbad, CA, USA) following the manufacturer’s protocols. Finally, 48 clones per marsh were sequenced (Beckman-Coulter Genomics, Danvers, MA, USA). We compared the sequences to the GenBank database using the nr blastx algorithm. The sequences have been submitted to GenBank under the accession numbers JQ254993–JQ255023.
Phylogenetic Analysis
We screened the sequences recovered from the mxaF clone library for three criteria: quality (≥80% HQ reads), length (≥300 bp), and identity (most similar to a methylotrophic bacteria using blastx). We aligned the remaining sequences (N = 99) in protein space using Geneious Pro 5.03 (Biomatters, Auckland, New Zealand) and created a nucleotide sequence similarity matrix using Dnadist in the Phylip package (version 3.68; Felsenstein, 2005). We defined operational taxonomic units (OTUs) as sequences sharing 99% sequence similarity (using the nearest neighbor algorithm) and classified them using the MOTHUR software (version v1.16.0; Schloss et al., 2009). We constructed a neighbor-joining tree (Geneious 5.0, Tamura–Nei distance model) using representative sequences (oturep function in MOTHUR) from this study and cultured strains from other studies, including Methylophilus methylotrophus as an outgroup.
Quantitative PCR
To quantify the abundance of methylotrophs in the experimental plots, we used the same primer pair described above. We isolated DNA from sediment cores (10 cm deep, 3 cm diameter) collected from each plot (N = 105) in February 2009. We extracted total genomic DNA in the same manner described above. We prepared a standard by cloning the PCR product of a Methylobacterium extorquens isolate into a vector (see above) and linearizing the DNA (SphI, New England BioLabs, Ipswich, MA, USA). To reduce the effect of PCR inhibition, we determined the appropriate environmental template concentration by performing qPCR on a dilution series (1:100, 1:250, 1:500, and 1:750) of three random samples from each marsh in triplicate. For the remaining samples, qPCR was performed on a 1:750 dilution, the dilution at which the copy number stabilized for all three marshes. Quantitative PCR was carried out in 25 μl total volume: 5 μl template (1:750), 12.5 μl iQ SybrGreen mix (Bio-Rad), forward primer 0.4 μM, reverse primer 0.4 μM. The reactions were run on an iCycler (Bio-Rad) with the following conditions: initial denature at 95°C for 15 min, denature at 95°C for 45 s, anneal at 59°C for 20 s, extension at 72°C for 30 s – repeated 45 cycles; with a final extension at 72°C for 10 min. Real time data was collected at the annealing step. The amplification was followed by a melting curve to check for unspecific priming or primer dimers starting with 50°C for 150 cycles, increasing 0.3°C per cycle.
Terminal Restriction Fragment Length Polymorphism Analysis
We performed terminal restriction fragment length polymorphism analysis (T-RFLP) analysis on the same DNA isolated above in the qPCR assays. We targeted the mxaF gene with 5′ 6-FAM-labeled primers (Moosvi et al., 2005) using the same endpoint PCR conditions as above. We gel purified the PCR products as before and standardized the DNA concentration (20 ng DNA/μl) for restriction enzyme digestion (TaqI Fast Digest®, Fermentas, Glen Burnie, MD, USA). Enzyme deactivation and product purification was carried out following the manufacturers’ protocols (Qiaquick Nucleotide Removal Kit®, Qiagen, Valencia, CA, USA). We stored the products at −20°C until fragment analysis (Laragen, Los Angeles, CA, USA).
Terminal restriction fragment length polymorphism analysis peaks were identified using GeneMarker® 1.7 with AFLP settings. To identify “true” peaks from background noise, we followed Abdo et al. (2006) using data points with values larger than four SD. If more than 25 peaks were detected in a sample, we manually inspected peaks within two base pairs of each other to decide if these were true peaks, then re-standardized the peak heights in these corrected samples by total fluorescence.
Statistical Analysis
For the field experiment, we used a generalized linear model (GLM) to test the effects of N addition, marsh site, and their interaction (marsh × N) on CH4 flux rates, the initial CH4 concentration (T = 0 min), and mxaF gene copy number with marsh as a categorical factor (MBE, CSM, and TRE) and N addition treatment as a continuous factor (0, 10, 20, 40, 80, 160, 320 g N m−1 year−1). (The mxaF gene copy number was log-transformed to improve normality and we report untransformed values in Figure 3C.) To provide a model for N addition effects on CH4 flux rates, we averaged observations for each marsh (n = 21, 3 marshes × 7 treatments) because neither marsh identity (marsh), nor an interaction between marsh and N treatment (marsh × N), had a significant effect on CH4 flux in the GLM analyses. We then used a linear regression to test whether the CH4 flux differed at each plot depending upon the CH4 concentration in the chamber headspace at the initial time point (T = 0 min). These statistics were performed in JMP 8 (SAS Corporation).
To investigate mxaF gene composition among the plots, we first square root transformed the T-RFLP peak data (to downweight very abundant peaks) and calculated the Bray–Curtis similarity (Magurran, 1988) between the samples. We then used PERMANOVA (Primer 6; Anderson et al., 2008) to test whether N treatment and/or marsh location affected mxaF composition, with marsh as a random, categorical factor and N treatment as a continuous covariate. (Log-transforming the N treatment variable did not change the results, so we report only the untransformed test.) To visualize the PERMANOVA results, we performed principle coordinates analysis (PCO) on the Bray–Curtis similarity matrix in Primer 6.
For the microcosm experiments, we used two-way ANOVA to test for the differences of the rates of CH4 production or oxidation between our treatments (factors: C addition, N addition and C × N addition) with JMP 8.
Results
Methane Emissions in the Field
Across all the marshes, methane flux increased linearly with N addition (linear regression, R2 = 0.23, P = 0.025, Figure 1A). The linear increase of methane flux was 1.23 μg CH4 m−2 day−1 ± 0.42 for each g N m−2 year−1 applied, and all marshes showed similar rates (GLM, F2,103 = 1.9886, P = 0.1424). At the two lowest fertilization rates (control and 10 g N m−2 year−1), net methane oxidation was dominant, whereas over 9.89 g N m−2 year−1 we observed net methanogenesis.
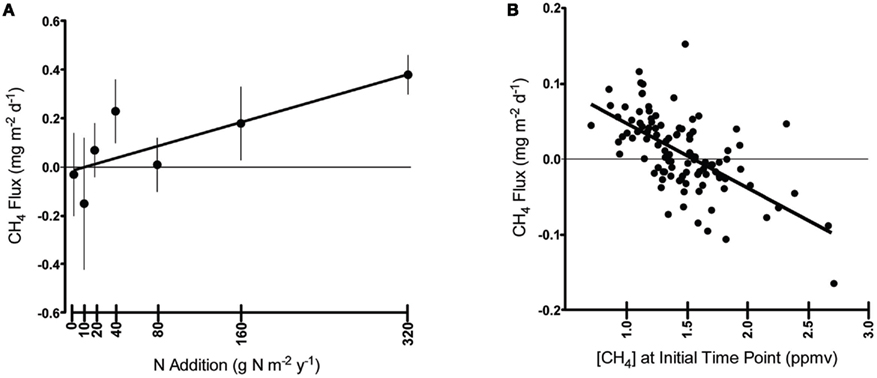
Figure 1. Salt marsh field methane flux after 7 months of fertilization: (A) CH4 flux along the N gradient. Regression: Flux (mg CH4 m−2 day−1) = 0.00123* N addition (mg CH4 m−2 day−1) – 0.0122, R2 = 0.23, P = 0.023, N = 21, (B) CH4 flux given the initial CH4 concentration. Regression: Flux (mg CH4 m−2 day−1) = −0.08551* Initial (ppmv) + 0.01374, R2 = 0.39, P < 0.0001, N = 103. Error bars in (A) were constructed with 1 SEM.
We also observed that methane flux depended on the initial CH4 concentration measured above the sediment surface (linear regression, R2 = 0.397, P < 0.0001, Figure 1B). If the initial (T = 0 min) headspace concentration was below 1.56 ppmv (i.e., 1.10 mg m−3), then on average we observed a positive net flux. In contrast, if the initial CH4 concentrations were above that value, we generally observed a negative net flux. This cutoff is similar to the current atmospheric CH4 concentration of 1.77 ppmv (i.e., 1.25 mg m−3, source: http://www.ncdc.noaa.gov/oa/climate/gases.html). Although the reason for this relationship is unclear, it does not account for the observed effect of N addition on CH4 flux. Initial CH4 concentration varied significantly by marsh (GLM, F2,103 = 21.459, P < 0.0001), but not by N treatment (GLM, F2,103 = 0.738, P = 0.392). Further, N treatment still had a significant effect on the residuals of the initial CH4 concentration versus CH4 flux regression (GLM, F5,97 = 3.133, P = 0.0115).
Nutrient Addition Microcosms
The microcosm experiments aimed to test whether the positive relationship between CH4 flux and N addition in the field was, on balance, due to stimulating methanogens or inhibiting methanotrophs. We found no evidence for N limitation or inhibition of methanotrophy with the single dose of N that the microcosms received (two-way ANOVA, F3,18 = 1.3194, P = 0.2657). However, the methanotrophs appeared to be significantly C-limited (F3,18 = 231.7242, P < 0.0001, Figure 2A). With C (methane) addition, the average methane oxidation rate increased by 830% over controls and N addition treatments but there were no interactive effects of C × N addition (F3,18 = 3.1134, P = 0.0946).
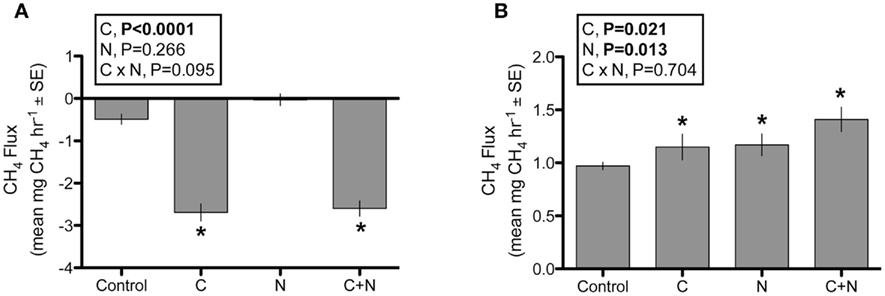
Figure 2. Methane flux in the nutrient addition microcosms after 18 h of incubation. (A) Methanotroph response to nutrient addition; (B) Methanogen response to nutrient addition. Six replicates per treatment/group, N = 48. Error bars were constructed using 1 SEM. Results of the two-way ANOVA are reported in the figure insert.
In contrast, the methanogens appeared to be both N (two-way ANOVA, F3,18 = 7.6547, P = 0.0127) and C limited (F3,18 = 6.3870, P = 0.0211) with no significant C × N interaction (F3,18 = 0.1487, P = 0.7043, Figure 2B). Adding either C or N increased methane production rates by 18% over controls. Adding C and N together increased methane production by 44%, indicating that salt marsh methanogens may be co-limited.
Methylotroph Community Composition
The clone libraries created from sediments outside the experiment plots revealed mxaF sequence diversity that falls outside of known lineages (Figure 3A). Phylogenetic analysis placed about a third of the sequences most closely related (92% similar) to a novel marine Methylococcus capable of growth on methane, ethane, or propane (Redmond et al., 2010). The only other known culture that was similar to these sequences is an mxaF mutant created from a Hyphomicrobium strain (Fesefeldt et al., 1997). The remaining clones clustered into two distinct clades that appear to fall outside of known methylotroph lineages. None of our clones clustered with known obligate methanotroph clades.
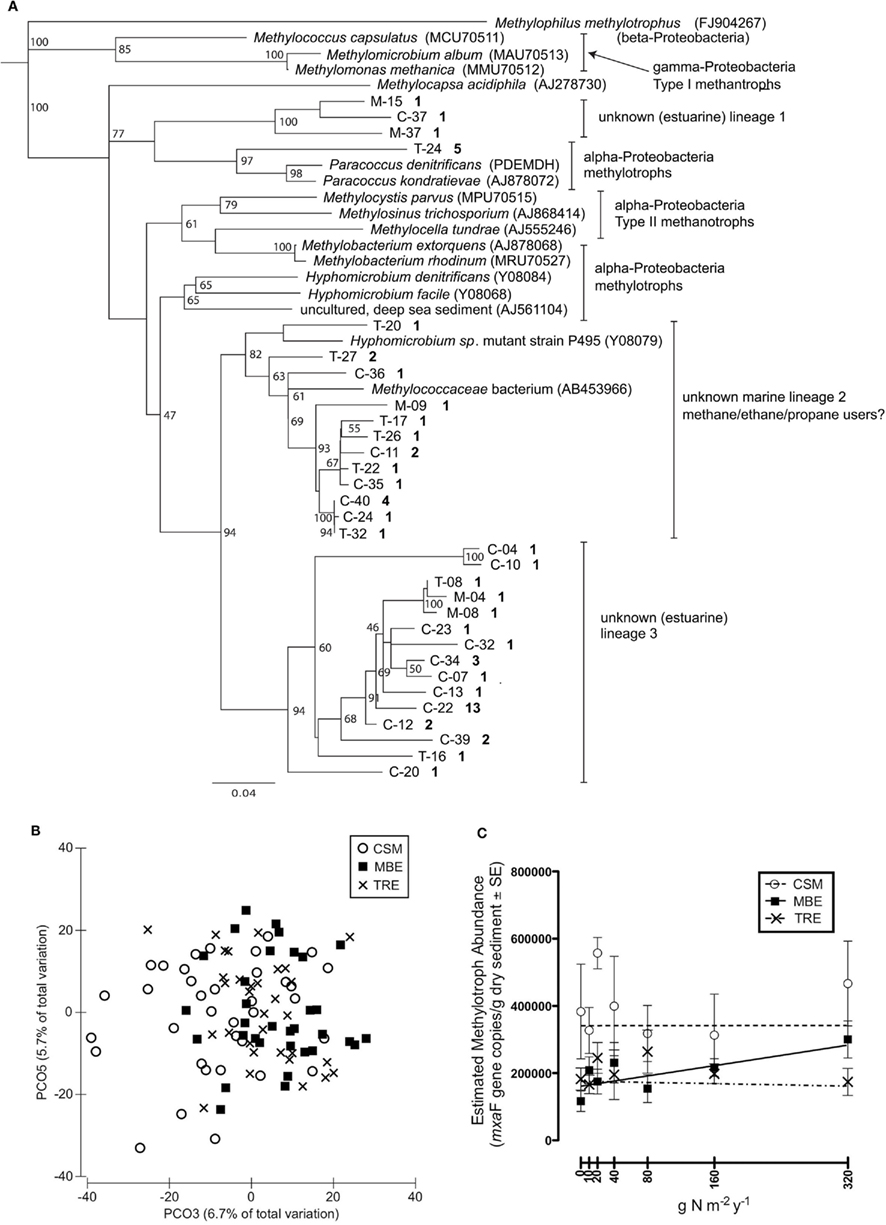
Figure 3. The salt marsh sediment methylotroph community as assayed by the methanol dehydrogenase functional gene (mxaF). (A) Neighbor-joining tree of representative OTUs (≥99% similar) based on nucleotide mxaF sequences. The OTUs are designated by marsh and sequence number, where C = Carpinteria Salt Marsh, M = Morro Bay Estuary, T = Tijuana River Estuary. The bold number is the number of sequences that fall within the OTU; only bootstrap values ≥50 are shown; (B) Two PCO axes of the T-RFLP profiles that illustrate differences by marsh location (N = 103); (C) Mean mxaF gene copy number per gram dry sediment (N = 105).
Nitrogen addition did not affect methylotroph composition as assayed with T-RFLP either directly (PERMANOVA F1,100 = 0.635, P = 0.867) or indirectly through a marsh-by-N interaction (F2,100 = 0.698, P = 0.868). Methylotroph composition varied significantly among the three marshes (F2,100 = 2.203, P = 0.002), although marsh location was estimated to explain relatively little (∼10%) of the variation in composition. The PCO plots supported this result; marsh differences were apparent primarily along PCO3, which explained only 6.7% of total variation in community composition (Figure 3B).
Methylotroph abundance also did not respond to N addition (GLM, N addition: F2,103 = 1.594, P = 0.209; marsh × N addition: F2,103 = 1.875, P = 0.159). Only in the MBE marsh, was there was a trend of a linear increase in mxaF copies with increasing N addition (Figure 3C). However, the marshes differed significantly in average methylotroph abundance (GLM, marsh: F2,103 = 10.962, P < 0.0001). CSM had nearly twice as many mxaF gene copies as both MBE and TRE, which had similar abundances (CSM: 341,401 ± 34,771 SEM; MBE: 195,489 ± 16,942; TRE: 171,884 ± 15,378).
Discussion
Temperate salt marshes generally emit low levels of methane, but these values are also highly spatially and seasonally variable (King and Wiebe, 1978; Bartlett et al., 1985; Magenheimer et al., 1996; Cheng et al., 2010). Thus, the range and variability of methane flux values observed in this study (−0.045 to 0.377 mg CH4 m−2 day−1) are similar to those reported previously for other salt marshes. Despite the high variability observed, however, our field experiment suggests that increased N availability increases methane emissions in southern California salt marshes, as in other ecosystems (Liu and Greaver, 2009).
Further, the effect of N addition in these salt marshes appears to be quantitatively predictable. Methane flux increased linearly with N addition in all three marshes despite differences in their macrosystem features (e.g., size, tidal flow constriction, and the nature of their watersheds). With each added g N m−2 year−1, we predict an additional 1.23 μg CH4 m−2 day−1 will be emitted from the temperate low salt marsh zone during this time of the winter season (February). Further, the sediments switched from negative net CH4 fluxes to net positive CH4 fluxes at around 10 g N m−2 year−1. While these results should be confirmed in other seasons and other salt marshes, they agree with a recent meta-analysis of upland soils; methane flux was also positively and linearly related to the amount of N added, although the vast majority of these soils were still net consumers of methane (Aronson and Helliker, 2010).
What accounts for this increase in methane flux with N addition? Our results are consistent with the hypothesis that N addition stimulates methanogenesis rather than inhibiting methanotrophy. In particular, the microcosm experiment provides evidence that N addition directly stimulates short-term increases in methane production under constrained conditions for aerobic methanotrophy (low oxygen conditions). In contrast, nitrogen addition did not affect methanotroph activity, either by changes in methane consumption rate in the microcosms or by changes in methylotrophic community composition or abundance in the field. Numerous studies across a variety of ecosystems suggests that N addition stimulates methanotrophy until a threshold, beyond which higher amounts inhibit it (Bodelier et al., 2000; Bodelier and Laanbroek, 2004; Aronson and Helliker, 2010). Thus, one interpretation is that methanotrophs in salt marshes are not N limited and further, the level of N addition in the microcosms were not inhibitory. Alternatively, we cannot exclude the possibility that some methanogenesis was occurring in the aerobic chambers, which if stimulated by N addition, might have masked equivalent increases in methane consumption.
Addition of a carbon substrate (sodium acetate) in the microcosms also greatly increased methanogenesis. Most likely this was due to direct stimulation of acetoclastic methanogens, which use organic acids. Hydrogenotrophic methanogens, which use H2 + CO2, might also have been indirectly stimulated through the byproducts of heterotrophic taxa that can use acetate.
Thus, in the field experiment, methanogenesis may have been stimulated by N directly and/or indirectly through an increase in plant biomass and therefore, C availability to sediment microorganisms. Indeed, our field experiment showed significant (linear) increases in aboveground plant biomass with increasing N addition (Vivanco et al., unpublished) similar to many past salt marsh studies (Boyer and Zedler, 1998; Bertness et al., 2002; Crain, 2007). Zhang and colleagues also found greater CH4 emissions in a brackish Chinese marsh, where exogenous N deposition increased biomass of an invasive plant (Spartina alterniflora) (Zhang et al., 2010).
Both the microcosm and field observations are in accordance with the hypothesis that salt marsh methanotrophy is limited by methane (carbon) availability. In the field in particular, we measured more negative methane fluxes for higher levels of initial methane concentration (Figure 1B), where sediments switched from positive net CH4 fluxes to negative net CH4 fluxes at around 1.56 ppmv CH4. Similarly, a study of eastern U.S. salt marshes showed an inverse relationship between methane availability and net negative methane fluxes (Bartlett et al., 1985). This dynamic association leads us to the following speculative hypothesis: that increases in CH4 due to N stimulation of methanogenesis might eventually be compensated for, if methanotrophy is not otherwise limited.
Even our small sampling of methylotroph sequences revealed a high degree of undescribed diversity. Similar genetic work in estuaries using 16S rDNA, methane monooxygenase (MMO) and mxaF probes has also found a wide variety of taxa that share ≤90% similarity with isolated methylotrophs (McDonald et al., 2005b; Moosvi et al., 2005; Nercessian et al., 2005). From the phylogenetic analysis, it is difficult to know whether these new clades are gamma- or alpha-Proteobacteria, let alone what carbon substrates they may be using and specifically, whether any are methanotrophs. From work in other marine systems, we might have expected to find Type II methanotrophs (alpha-Proteobacteria; e.g., Valentine, 2011).
Further complicating the matter, new discoveries of microorganisms with novel methyl metabolism are increasingly blurring the lines between which methylotrophs can use methane and whether this function is obligate or facultative (Dedysh et al., 2005; Redmond et al., 2010). A number of methylotrophic species lack the mxaF gene (Chistoserdova et al., 2009). Thus, in the future it would be useful to combine several complementary approaches such as targeting both the particulate and soluble MMO as well as mxaF (or mdh2 and xoxF for taxa lacking mxaF; Kalyuzhnaya et al., 2008) with stable isotope probes (McDonald et al., 2005a) to disentangle the complex web of processes performed by the methylotrophic community (Jensen et al., 2008).
Despite these uncertainties, the clone library sequences suggest that our abundance (qPCR) and compositional (T-RFLP) assays most likely targeted non-methanotrophic bacteria. Although the composition of this group varied among marsh locations, it did not appear to respond (in abundance or composition) to N addition, at least as could be detected with the methods applied. These findings indicate that non-methanotrophic methylotrophs are not N limited in salt marshes and suggest that particular T-RFLP taxa do not specialize on different N availabilities nor respond indirectly to the increase in plant biomass (at least after fertilization for 7 months).
Although salt marshes are likely a minor source of global methane emissions (Hanson and Hanson, 1996), this study demonstrates again the central role of microbial communities in regulating global methane emissions. However, the intricate relationships between C1-cycling microorganisms pose a challenge for predicting how methane cycling will respond to environmental changes. Despite these interactions, however, we observed a consistent, linear response to N addition at all three sites, indicating that the overall methane flux response to N addition is predictable within an ecosystem. More work is needed to confirm these results in other seasons and more salt marshes to investigate whether this stimulation is due to changes in abundance and/or composition of the methanogen community or their metabolic efficiency.
Conflict of Interest Statement
The authors declare that the research was conducted in the absence of any commercial or financial relationships that could be construed as a potential conflict of interest.
Acknowledgments
We are grateful to our reviewers for their thoughtful comments on a prior draft. We thank Todd Bank, Stephanie Chen, Pedro Flombaum, Barbara Huang, Michael Marchesano, Tim Roth, and Claudia Weihe for invaluable lab and field assistance. We also thank Roark Galloway for his technical assistance with the gas chromatograph, and Emma Aronson for invaluable discussions of these ideas. Thanks also to Jeff Crooks (National Estuarine Research Reserve, Tijuana River Estuary Reserve), Brian Collins (US Fish and Wildlife Service, San Diego Wildlife Refuges), Andrew Brooks (University of California Reserve System, Carpinteria Salt Marsh Reserve), and Vince Cicero (California State Parks, Morro Bay National Estuary) for their expertise and help regarding the study sites. Financial support was provided in part by the Gordon and Betty Moore Foundation, the National Science Foundation, the University of California at Irvine, and Mildred E. Mathias Graduate Student Research Grants.
References
Abdo, Z., Schüette, U. M. E., Bent, S. J., Williams, C. J., Forney, L. J., and Joyce, P. (2006). Statistical methods for characterizing diversity of microbial communities by analysis of terminal restriction fragment length polymorphisms of 16S rRNA genes. Environ. Microbiol. 8, 929–938.
Allison, S. D., and Vitousek, P. M. (2005). Responses of extracellular enzymes to simple and complex nutrient inputs. Soil Biol. Biochem. 37, 937–944.
Anderson, M. J., Gorley, R. N., and Clarke, K. R. (2008). PERMANOVA+ for PRIMER: Guide to Software and Statistical Methods. Plymouth: PRIMER-E.
Aronson, E. L., and Helliker, B. R. (2010). Methane flux in non-wetland soils in response to nitrogen addition: a meta-analysis. Ecology 91, 3242–3251.
Auman, A. J., Speake, C. C., and Lidstrom, M. (2001). nifH sequences and nitrogen fixation in Type I and Type II methanotrophs. Appl. Environ. Microbiol. 67, 4009–4016.
Bartlett, K. B., Harriss, R. C., and Sebacher, D. I. (1985). Methane flux from coastal salt marshes. J. Geophys. Res. 90, 5710–5720.
Bertness, M. D., Ewanchuck, P. J., and Silliman, B. (2002). Anthropogenic modification of New England salt marshes. Proc. Natl. Acad. Sci. U.S.A. 99, 1395–1398.
Bodelier, P. L. E., and Laanbroek, H. J. (2004). Nitrogen as a regulatory factor of methane oxidation in soils and sediments. FEMS Microbiol. Ecol. 47, 265–277.
Bodelier, P. L. E., Roslev, P., Henckel, T., and Frenzel, P. (2000). Stimulation by ammonium-based fertilizers of methane oxidation in soil around rice roots. Nature 403, 421–424.
Boyer, E. W., and Zedler, J. (1998). Effects of nitrogen additions on the vertical structure of a constructed cordgrass marsh. Ecol. Appl. 8, 692–705.
Boyer, K. E., Fong, P., Vance, R. R., and Ambrose, R. F. (2001). Salicornia virginica in a Southern California salt marsh: seasonal patterns and a nutrient-enrichment experiment. Wetlands (Wilmington) 21, 315–326.
Bradford, M. A., Fierer, N., Jackson, R. B., Maddox, T. R., and Reynolds, J. F. (2008). Nonlinear root-derived carbon sequestration across a gradient of nitrogen and phosphorous deposition in experimental mesocosms. Glob. Chang Biol. 14, 1113–1124.
Caffrey, R. M., Murrell, J. C., Wigand, C., and McKinney, R. A. (2007). Effect of nutrient loading on biogeochemical and microbial processes in a New England salt marsh. Biogeochemistry 82, 251–264.
Cardoni, D. A., Isacch, J. P., Fanjul, M. E., Escapa, M., and Iribarne, O. O. (2011). Relationship between anthropogenic sewage discharge, marsh structure and bird assemblages in an SW Atlantic saltmarsh. Mar. Environ. Res. 71, 122–130.
Cheng, X., Luo, Y., Xu, Q., Lin, G., Zhang, Q., Chen, J., and Li, B. (2010). Seasonal variation in CH(4) emission and its (13)C-isotopic signature from Spartina alterniflora and Scirpus mariqueter soils in an estuarine wetland. Plant Soil 327, 85–94.
Chistoserdova, L., Kalyuzhnaya, M. G., and Lidstrom, M. E. (2009). The expanding world of methylotrophic metabolism. Annu. Rev. Microbiol. 63, 477–499.
Conley, D. J., Paerl, H. W., Howarth, R. W., Boesch, D. F., Seitzinger, S. P., Havens, K. E., Lancelot, C., and Likens, G. E. (2009). Controlling eutrophication: nitrogen and phosphorus. Science 323, 1014–1015.
Cottingham, K. L., Lennon, J. T., and Brown, B. L. (2005). Knowing when to draw the line: designing more informative ecological experiments. Front. Ecol. Environ. 3, 145–152.
Crain, C. (2007). Shifting nutrient limitation and eutrophication effects in marsh vegetation across estuarine salinity gradients. Estuaries Coast 30, 26–34.
Dakora, F. D., and Phillips, D. A. (2002). Root exudates as mediators of mineral acquisition in low-nutrient environments. Plant Soil 245, 35–47.
Dedysh, S. N., Knief, C., and Dunfield, P. F. (2005). Methylocella species are facultatively methanotrophic. J. Bacteriol. 187, 4665–4670.
Dentener, F., Drevet, J., and Lamarque, J. F. (2006). Nitrogen and sulfur deposition on regional and global scales: a multimodel evaluation. Global Biogeochem. Cycles 20, GB4003.
Felsenstein, J. (2005). Theoretical Evolutionary Genetics. Available at: http://evolution.genetics.washington.edu/pgbook/pgbook.html
Fesefeldt, A., Poetsch, M., and Gliesche, C. G. (1997). Development of a species-specific gene probe for Hyphomicrobium facilis with inverse PCR. Appl. Environ. Microbiol. 63, 335–337.
Fitch, R., Theodose, T., and Dionne, M. (2009). Relationships among upland development, nitrogen, and plant community composition in a Maine salt marsh. Wetlands (Wilmington) 29, 1179–1188.
Galloway, J. N., Dentener, F. J., Capone, D. G., Boyer, E. W., Howarth, R. W., Seitzinger, S. P., Asner, E. P., Cleveland, C. C., Green, P. A., Holland, E. A., Karl, D. M., Michaels, A. F., Porter, J. H., Townsend, A. R., and Vorosmarty, C. J. (2004). Nitrogen cycles: past, present, and future. Biogeochemistry 70, 153–226.
Graham, D. W., Chaudhary, J. A., Hanson, R. S., and Arnold, R. G. (1993). Factors affecting competition between type I and type II methanotrophs in two-organism, continuous-flow reactors. Microb. Ecol. 25, 1–17.
Graham, S. A., and Mendelssohn, I. A. (2010). Multiple levels of nitrogen applied to an oligohaline marsh identify a plant community response sequence to eutrophication. Mar. Ecol. Prog. Ser. 417, 73–82.
Jensen, S., Neufeld, J. D., Birkeland, N. K., Hovland, M., and Murrell, J. C. (2008). Methane assimilation and trophic interactions with marine Methylomicrobium in deep-water coral reef sediment off the coast of Norway. FEMS Microbiol. Ecol. 66, 320–330.
Kai, F. M., Tyler, S. C., Randerson, J. T., and Blake, D. R. (2011). Reduced methane growth rate explained by decreased Northern Hemisphere microbial sources. Nature 476, 194–197.
Kalyuzhnaya, M. G., Hristova, K. R., Lidstrom, M. E., and Chistoserdova, L. (2008). Characterization of a novel methanol dehydrogenase in representatives of Burkholderiales: implications for environmental detection of methylotrophy and evidence for convergent evolution. J. Bacteriol. 190, 3817–3823.
King, G. M., and Wiebe, W. J. (1978). Methane release from soils of a Georgia salt marsh. Geochim. Cosmochim. Acta 42, 343–348.
Lelieveld, J., Crutzen, P. J., and Brühl, C. (1993). Climate effects of atmospheric methane. Chemosphere 26, 739–768.
Liu, L. L., and Greaver, T. L. (2009). A review of nitrogen enrichment effects on three biogenic GHGs: the CO2 sink may be largely offset by stimulated N2O and CH4 emissions. Ecol. Lett. 12, 1103–1117.
Magenheimer, J., Moore, T., Chmura, G., and Daoust, R. (1996). Methane and carbon dioxide flux from a macrotidal salt marsh, Bay of Fundy, New Brunswick. Estuaries Coast 19, 139–145.
McDonald, I. R., Bodrossy, L., Chen, Y., and Murrell, J. C. (2008). Molecular ecology techniques for the study of aerobic methanotrophs. Appl. Environ. Microbiol. 74, 1305–1315.
McDonald, I. R., Radajewski, S., and Murrell, J. C. (2005a). Stable isotope probing of nucleic acids in methanotrophs and methylotrophs: a review. Org. Geochem. 36, 779–787.
McDonald, I. R., Smith, K., and Lidstrom, M. E. (2005b). Methanotrophic populations in estuarine sediment from Newport Bay, California. FEMS Microbiol. Lett. 250, 287–293.
Moosvi, S. A., Mcdonald, I. R., Pearce, D. A., Kelly, D. P., and Wood, A. P. (2005). Molecular detection and isolation from Antarctica of methylotrophic bacteria able to grow with methylated sulfur compounds. Syst. Appl. Microbiol. 28, 541–554.
Moussard, H., Stralis-Pavese, N., Bodrossy, L., Neufeld, J. D., and Murrell, J. C. (2009). Identification of active methylotrophic bacteria inhabiting surface sediment of a marine estuary. Environ. Microbiol. Rep. 1, 424–433.
Nercessian, O., Noyes, E., Kalyuzhnaya, M. G., Lidstrom, M. E., and Chistoserdova, L. (2005). Bacterial populations active in metabolism of C-1 compounds in the sediment of Lake Washington, a freshwater lake. Appl. Environ. Microbiol. 71, 6885–6899.
Neufeld, J. D., Chen, Y., Dumont, M. G., and Murrell, J. C. (2008). Marine methylotrophs revealed by stable-isotope probing, multiple displacement amplification and metagenomics. Environ. Microbiol. 10, 1526–1535.
Oremland, R. S., and Polcin, S. (1982). Methanogenesis and sulfate reduction: competitive and non-competitive substrates in estuarine sediments. Appl. Environ. Microbiol. 44, 1270–1276.
Qiu, Q., Conrad, R., and Lu, Y. (2009). Cross-feeding of methane carbon among bacteria on rice roots revealed by DNA-stable isotope probing. Environ. Microbiol. Rep. 1, 355–361.
Redmond, M. C., Valentine, D. L., and Sessions, A. L. (2010). Identification of novel methane-, ethane-, and propane-oxidizing bacteria at marine hydrocarbon seeps by stable isotope probing. Appl. Environ. Microbiol. 76, 6412–6422.
Rigby, M., Prinn, R. G., Fraser, P. J., Simmonds, P. G., Langenfelds, R. L., Huang, J., Cunnold, D. M., Steele, L. P., Krummel, P. B., Weiss, R. F., O’Doherty, S., Salameh, P. K., Wang, H. J., Harth, C. M., Mühle, J., and Porter, L. W. (2008). Renewed growth of atmospheric methane. Geophys. Res. Lett. 35, L22805.
Schloss, P. D., Westcott, S. L., Ryabin, T., Hall, J. R., Hartmann, M., Hollister, E. B., Lesniewski, R. A., Oakley, B. B., Parks, D. H., Robinson, C. J., Sahl, J. W., Stres, B., Thallinger, G. G., Van Horn, D. J., and Weber, C. F. (2009). Introducing mothur: open-source, platform-independent, community-supported software for describing and comparing microbial communities. Appl. Environ. Microbiol. 75, 7537–7541.
Shimel, J. P., and Gulledge, J. (1998). Microbial community structure and global trace gases. Glob. Chang Biol. 4, 745–758.
Valentine, D. L. (2011). Emerging topics in marine methane biogeochemistry. Ann. Rev. Mar. Sci. 3, 147–171.
Vitousek, P. M., Hattenschwiler, S., Olander, L., and Allison, S. (2002). Nitrogen and nature. Ambio 31, 97–101.
Wilkinson, T. G., Topiwala, H. H., and Hamer, G. (1974). Interactions in a mixed bacterial population growing methane in continuous culture. Biotechnol. Bioeng. 16, 41–59.
Keywords: methylotrophy, methanogenesis, methanotrophy, methane flux, nitrogen gradient, nutrient limitation, mxaF, acetate
Citation: Irvine IC, Vivanco L, Bentley PN and Martiny JBH (2012) The effect of nitrogen enrichment on C1-cycling microorganisms and methane flux in salt marsh sediments. Front. Microbio. 3:90. doi: 10.3389/fmicb.2012.00090
Received: 07 December 2011; Paper pending published: 04 January 2012;
Accepted: 23 February 2012; Published online: 19 March 2012.
Edited by:
Paul Bodelier, Netherlands Institute of Ecology, NetherlandsReviewed by:
Marina Kalyuzhnaya, University of Washington, USAHinsby Cadillo-Quiroz, Arizona State University, USA
Zhongjun Jia, Chinese Academy of Sciences, China
Copyright: © 2012 Irvine, Vivanco, Bentley and Martiny. This is an open-access article distributed under the terms of the Creative Commons Attribution Non Commercial License, which permits non-commercial use, distribution, and reproduction in other forums, provided the original authors and source are credited.
*Correspondence: Irina C. Irvine, Division of Planning, Science and Resource Management, Santa Monica Mountains National Recreation Area, U.S. National Park Service, 401 West Hillcrest Drive, Thousand Oaks, CA 91360, USA. e-mail: irina_irvine@nps.gov