

 Oliver C. Sitton3


95% of researchers rate our articles as excellent or good
Learn more about the work of our research integrity team to safeguard the quality of each article we publish.
Find out more
ORIGINAL RESEARCH article
Front. Microbiol. , 21 March 2012
Sec. Microbiotechnology
Volume 3 - 2012 | https://doi.org/10.3389/fmicb.2012.00093
Biofuels are anticipated to enable a shift from fossil fuels for renewable transportation and manufacturing fuels, with biohydrogen considered attractive since it could offer the largest reduction of global carbon budgets. Currently, lignocellulosic biohydrogen production remains inefficient with pretreatments that are heavily fossil fuel-dependent. However, bacteria using alkali-treated biomass could streamline biofuel production while reducing costs and fossil fuel needs. An alkaliphilic bacterium, Halanaerobium hydrogeniformans, is described that is capable of biohydrogen production at levels rivaling neutrophilic strains, but at pH 11 and hypersaline conditions. H. hydrogeniformans ferments a variety of 5- and 6-carbon sugars derived from hemicellulose and cellulose including cellobiose, and forms the end products hydrogen, acetate, and formate. Further, it can also produce biohydrogen from switchgrass and straw pretreated at temperatures far lower than any previously reported and in solutions compatible with growth. Hence, this bacterium can potentially increase the efficiency and efficacy of biohydrogen production from renewable biomass resources.
As the price of fossil fuels increases and reserves diminish, biofuel production is seen as a viable contribution to current as well as future energy demands. Hydrogen (H2), alcohol, and hydrocarbon generation by microbial fermentation of lignocellulosic plant materials holds promise as alternatives to petroleum based fuels. H2 has an advantage in that combustion only results in water vapor, without the generation of carbon dioxide. Although the potential exists for microbially generated fuels from biomass to be economically attractive, several issues are still to be resolved. Of particular note is the large fossil fuel-dependent energy input of the typical steam blasting pretreatment of biomass as well as detoxification of the resulting compounds that are inhibitory to fermentation, and overall low hydrogen yields.
While many technical issues are still to be resolved pertaining to using H2 as a transportation fuel, particularly devising safe storage methods, the demand for sustainable forms of H2 is great with regard to industry. Hydrogen gas is currently produced through the steam reforming of natural gas and coal gasification, and is used in chemical production, oil refining, and steel manufacturing. The vast majority of global H2 production is by industrial consumers, with individual H2 production facilities meeting the demands of their manufacturing processes (Mueller-Langer et al., 2007). As the price of natural gas continues to increase, demand is likely to increase for an economically and environmentally sustainable means of H2 production that can fit into the current on-site production model. The further development of biological H2 generation derived from plant biomass could be used to meet the demands of these industries while decreasing their reliance on fossil fuels.
Fibrous plant material is made up of lignocellulose and principally contains cellulose, hemicellulose, and lignin. Cellulose is comprised of linear chains of the sugar glucose and is mostly crystalline; whereas, hemicellulose is more amorphous, being made up of both pentoses and hexoses, and is more readily hydrolyzed (Updegraff, 1969). Lignin has a poorly defined, heterologous structure providing strength and support to plant structure (Lebo et al., 2001) but is recalcitrant to bacterial degradation. It is due to lignins recalcitrance that pretreatments are required to facilitate its removal. Currently, the most common pretreatment method is steam blasting that causes the solid cellulose to become separated from the aqueous hemicellulose and lignin. However, this treatment requires electricity for steam generation and is typically a natural gas- or coal-dependent step (Datar et al., 2007; Liu et al., 2002). Hence, considerable amounts of CO2 are emitted and the production of biofuels remains fossil fuel-dependent. Under these conditions, a host of compounds that are inhibitory to fermentation are generated from lignin degradation and include weak acids, furan derivatives, and phenolic compounds (Palmqvist and Hahn-Hägerdal, 2000b). Before microbial fermentation of hemicellulose can occur, these inhibitors must be separated and removed from the liquid fraction. Current detoxification methods include enzyme treatment, fractionation of volatile compounds, and chemical treatment. However, alkali treatment is the most effective method of precipitating toxins and destabilizing inhibitors (Palmqvist and Hahn-Hägerdal, 2000a). Overall, the current processes of pretreatment, detoxification, and subsequent fermentation are relatively inefficient and remain fossil fuel-dependent, thus counterproductive to the goal of reducing greenhouse gas emissions.
An effective alternative is alkali treatment of the lignocellulose. This pretreatment separates cellulose from the hemicellulose and lignin, reduces the crystallinity of the cellulose making it more accessible for degradation and fermentation, and limits the production of inhibitory compounds (Gáspár et al., 2007; Jackson, 1977; Spencer and Akin, 1980). However, the resulting substrates are highly alkaline and potentially have a high concentration of salts. Previously, alkali treatment was evaluated against several others, including steam blasting, for bioethanol production from a number of biomass substrates. The results indicated that alkali treatment was the most efficient process, producing at least 3.5 times higher ethanol yields compared to steam-blasted or acid-treated biomass (Klinke et al., 2004). Hence, a fermentative haloalkaliphilic bacterium with naturally high H2 yields may decrease the number of production steps for biofuel production. The application of such an organism would eliminate the need for steam blasting of biomass. The need for removal of inhibitory compounds would also be eliminated in addition to the pH neutralization step prior to sugar fermentation. Hence, a fermentative haloalkaliphile offers a potentially more efficient and cost-effective adaptation for biohydrogen production.
The current study describes the isolation and characterization of such an organism, Halanaerobium hydrogeniformans, from Soap Lake, WA along with the development of a modified, alkaline pretreatment of lignocellulosic material that foregoes many of the existing pretreatment issues. H. hydrogeniformans was tested for the capacity to grow and produce biohydrogen on several 5- and 6-carbon sugars as well as with alkaline pretreated straw and switchgrass in batch and fed-batch bioreactors to assess the feasibility of haloalkaliphilic biohydrogen production.
Highly enriched liquid cultures that resulted from lake sediment slurries were plated on medium containing 1.25% (wt/vol) agar in order to isolate single colonies to attain a pure culture. The culture medium included (per liter): 70 g NaCl, 40 g Na2CO3, 6.3 g K2HPO4, 1 g yeast extract, 0.75 g Na2S (as a reductant), 0.6 g cysteine (as a reductant), along with 10 mL of basal medium stock solution and 10 mL of trace mineral solution. The basal medium stock solution included (per liter): 50 mg NH4NO3, 8.5 mg MgCl2·6H2O, 7.5 mg SiO2, 4.5 mg MnSO4·H2O, 4.2 mg CaCl2·2H2O, 4 mg methylene blue (as an oxygen indicator), and 1.8 mg FeSO4·7H2O. The trace mineral solution included (per liter): 3 g MgSO4·7H20, 1.63 g Na3-NTA, 1 g NaCl, 0.64 g MnCl2·4H2O, 0.13 g ZnCl2, 0.1 g FeSO4·7H2O, 0.1 g CaCl2·2H2O, CoCl2·6H2O, 0.03 g NiSO4·6H2O, 0.025 g Na2MoO4·2H2O, 0.025 g Na2WO4·2H2O, 0.01 g AlK(SO4)2·12H2O, 0.01 g H3BO3, and 7 mg CuCl2·2H2O.
All plates and colony manipulations were carried out in an anaerobic chamber (Coy Laboratory Products Inc, Grass Lake, MI) under an atmosphere of ∼95% N2/5% H2. Due to high pH and NaCl concentrations, the plating medium was made by mixing two-fold concentrated solutions of sterile medium with a two-fold solution of sterile, molten agar in water post-autoclaving to avoid a blackened slurry precipitate. Sterile solutions of separate carbon sources, Na2S, and cysteine were also added post-autoclaving. Cells and cell dilutions of liquid cultures, grown to an optical density of ∼0.3, were aliquoted (1 mL) into empty, sterile plastic plates that had been equilibrated in the anaerobic chamber for at least 5 days. Molten medium (50°C) was poured over the cells, swirled, and allowed to solidify (Bender et al., 2007). The plates were then incubated in the anaerobic chamber at 33°C and single colonies were visible after ∼ 2 weeks. Colonies were extracted from agar with a sterile toothpick and inoculated into 2.5 mL of sterile liquid medium as described above. Once grown, the cultures were checked for consistent cell morphology via phase contrast microscopy. One culture was selected and inoculated into 100 mL of sterile medium as above, and used to make frozen glycerol stock cultures. One milliliter of culture was combined with 100 μL of autoclaved and anaerobic glycerol for a final concentration of 10% (v/v) glycerol and was performed in the anaerobic glove bag. The resulting culture has been deposited at the American Type Culture Collection (ATCC) under ATCC Patent Deposit Designation PTA-10410 and under U. S. Patent 8,034,592.
Genomic DNA was isolated from frozen cell pellets. The cell pellet was thawed and resuspended in sterile deionized H2O (300 μL) with gentle pipeting, then boiled (10 min), and centrifuged (13,000 × g; 3 min, RT). Genomic DNA was purified with the Wizard DNA purification kit (Promega, Madison, WI; Bender et al., 2007). One microliter of the supernatant containing purified gDNA was used for 16S rRNA gene amplification with universal bacterial primers 27F (5′-AGAGTTTGATCCTGGCTCAG-3′) and 1492R (5′-GGTTACCTTGTTACGACTT-3′) as well as the universal archeal primers 21F (5′-TTCCGGTTGATCCTGCCGGA-3′) and 23SaRev (5′-CTTTCGGTCGCCCCTACT-3′; Dimitriu et al., 2008; Dimitriu et al., 2005), as previously described (Bender et al., 2007). PCR products were obtained for the bacterial, but not for the archeal, PCR reactions. The resultant bacterial PCR products were sequenced by the University of Missouri DNA Core Facility1. The sequence was analyzed by BLAST analysis2 using the nucleotide collection and highly similar sequence (Megablast) settings. The identification of phylogenetic neighbors was initially carried out by the BLAST (Altschul et al., 1997) and MegaBLAST (Zhang et al., 2000) programs against the database of type strains of valid prokaryotic names (Chun et al., 2007). Sixteen sequences with the highest scores were then selected for the calculation of pairwise sequence similarity by using the global alignment algorithm implemented at the EzTaxon server3 (Chun et al., 2007).
The 16S rRNA gene sequence of the isolate and those of the closest type strains were aligned by using the NAST alignment function of Greengenes (DeSantis et al., 2006) and edited and trimmed by using Jalview (Clamp et al., 2004; Waterhouse et al., 2009). A Neighbor-Joining phylogenetic tree was generated by using the MEGA4 program (Tamura et al., 2007). The sequence data have been submitted to GenBank with accession number GQ215697.
Cultures were grown under anaerobic conditions in 28 mL Balch/Hungate tubes with a liquid volume of 5 mL (Balch and Wolfe, 1976) capped with blue butyl rubber stoppers, crimp sealed with aluminum seals, and gassed with 80% N2/20% CO2 as previously described (Elias et al., 2004). The empty tubes were degassed and autoclaved (121°C, 20 min). Once the tubes cooled, the medium was added via filter sterilization using 0.2 μm syringe filters so as to avoid the precipitation that occurs with autoclaving.
Stock solutions of the carbon sources cellobiose, glucose, mannose, ribose, galactose, arabinose, and xylose were prepared separately, filter-sterilized into the sterile culture tubes through 0.2 μm pore size syringe filters, and used at a final concentration of 30 mM except for cellobiose at 15 mM. Negative control cultures had no carbon source other than the 0.1% (w/v) yeast extract. All medium components and sugars were purchased from either Sigma Life Science (St. Louis, MO) or Fisher Scientific (Pittsburg, PA). Culture volumes totaled 5 mL including a 10% (v/v) inoculation. Cultures were grown in triplicate in the dark at 30°C. Growth was followed by optical density as well as by protein quantification for liquid cultures when pure sugars were used as the carbon source. Experiments involving straw and switchgrass used only protein quantification for the determination of growth.
Protein was quantified using a modified Bradford assay (Bradford, 1976) where the culture samples at pH ∼10.5 (0.3 mL) were centrifuged (13,000 × g; 5 min; RT) and the supernatant discarded. The pellet was resuspended in deionized and filter-sterilized (0.22 μm pore size) H2O to the original 0.3 mL volume and frozen (−20°C) until analyzed. The samples were thawed and amended with 0.1 mL of 5N NaOH, heated (80°C; 30 min), cooled, and then added to the Bradford solution (4 mL) as previously described (Bradford, 1976).
Hydrogen was quantified on a gas chromatogram (Varian Inc, Palo Alto, CA; model CP-3380) equipped with Varian fused silica Select Permanent Gas/CO2 HR column (CP-7430) operating at 30°C, and a thermal conductivity detector at 175°C. The carrier gas was N2 at 14 psi, and samples were analyzed by using the Star Chromatography Workstation Version 5.50 software (Varian, Inc.). Injection volumes were 50 μL with the injection port temperature at 50°C.
The loss of sugars and appearance of organic acids were followed over time with high pressure liquid chromatography (HPLC; Shimadzu, Inc., Columbia, MD, USA) equipped with an Aminex HPX-87H ion exculsion column (125-0140; Phenomenex Inc, Torrance, CA) and a column oven (Shimadzu CTO-20A) set at 53°C. Both a refractive index (RI) detector (Shimadzu RID-10A) and UV/VIS detector (Shimadzu SPD-20A) were employed. Injection volumes for HPLC, 10 μL, were accomplished with an autosampler (Shimadzu SIL-10AF) and system controller (Shimadzu SCC-10A). The mobile phase for all detections was N2 degassed 30 mM H2SO4 under isocratic flow (Shimadzu DGU-20A3) pumped (Shimadzu LC-10Ai) at 22 mL/min. All data from triplicate analyses were analyzed by using Shimadzu LC Solutions Version 1.2.
Switchgrass was obtained from the Bradford Farm at the University of Missouri and dried. The straw was purchased from a retail outlet and was already dried. Both were pulverized and passed through a 1 mm screen. The resulting lignocellulose that passed through the screen was weighed out in 0.4 g aliquots and placed in 120 mL pyrex serum bottles to which 20 mL of 40 g/L Na2CO3 was added to maintain the concentration of 20 g/L of lignocellulose as previously described (Bjerre et al., 1996). The bottles were then sealed with blue butyl rubber stoppers and held in place with crimp seals as previously described (Elias et al., 2004). Duplicate bottles were then subjected to pretreatment temperatures of room temperature (12 h), 55°C (2 h), 75°C (2 h), 90°C (1 h), 130°C (15 min), 150°C (15 min), and 170°C (15 min) in a conventional oven. Each of the pretreated samples were allowed to cool and then transferred to 50 mL falcon tubes and centrifuged (12 min; 27,000 × g; RT).
The supernatant and the insoluble slurry material were separated for determination of their respective capacities to support growth and biohydrogen production with the isolate. The supernatant was taken as the lignocellulosic liquor that presumably contained sugars resulting from hemicellulose (Bjerre et al., 1996; Klinke et al., 2004) and was transferred to serum bottles, sealed with blue butyl stoppers as above and degassed with N2. Sterile and anaerobic (80% N2/20% CO2) Hungate tubes received 1 mL of filtered 5× concentrated medium solution as described above without any carbon or electron source as well as 3.5 mL of the degassed lignocellulosic liquor. The resulting 4.5 mL solution was reduced with cysteine and sulfide as described above and then received 0.5 mL of a freshly grown culture of the isolate. The culture tubes were then incubated at 33°C with shaking (250 rpm). Before distribution to the Hungate tubes, samples (1 mL) were taken for sugar and organic acid analysis as well as for protein quantification (0.3 mL) as described above. Similar samples were taken at the end of the cultivation and the production of H2 was followed periodically as described above.
The solid material slurry was presumed to contain primarily cellulose (Bjerre et al., 1996; Klinke et al., 2004). In order to avoid the concentration of salts during drying, the slurry was washed twice with 20 mL of deionized and filter-sterilized water (20 mL) via centrifugation (12 min; 27,000 × g; RT). The washed slurry was placed in pre-weighed plastic weigh-boats and dried at 80°C (2 h) (Bjerre et al., 1996), and weighed again when dry. Sterile Hungate tubes received 0.2 g of the dried solid material, sealed, crimped, and degassed as above. Each tube then received 4.5 mL of filter-sterilized medium with no carbon or electron source followed by 0.5 mL of a freshly grown culture of the isolate. Immediately after inoculation, a replicate set of tubes was sacrificed to obtain samples of organic acids (1 mL) as well as for protein quantification (0.3 mL) as described above. At the end of the cultivation, similar samples were taken, and the production of H2 was followed periodically as described above.
Bioreactor studies were carried out using a Biostat BPlus system (Sartorius Stedim, Bohemia, NY) bioreactor with a 3 L vessel and a 2 L working volume. Throughout all bioreactor cultivations, Halanaerobium hydrogenoformans’ H2 productivity was measured with the substrates glucose, cellobiose and switchgrass hydrolyzate substrates (see below for preparation). As with serum bottle cultivation, the bioreactor was autoclaved empty (121°C, 45 min) and then filled with filter-sterilized growth media as described above until the desired volume was reached. System parameters were set (33ºC, pH = 11.0, agitation = 750 rpm) using the DCU-2 control unit (Sartorius Stedim, Bohemia, NY) and the sterile medium was sparged (N2, 30 mL/min) until anaerobic conditions were achieved as evidenced by the methylene blue indicator turning colorless. The N2 mass flow through the headspace was set at 30 ml/min and maintained by the flow controller of the DCU-2. Once stabilized, fresh inoculum (60 ml) was injected into the system using aseptic and anaerobic techniques.
Throughout the fed-batch controlled cultivation, a Trace Analytical ta3000R (Ametek, Pittsburgh, PA) reducing gas detector measured (H2) in the exit gas stream (every 3.5 min). Gas components were separated by chromatography before entering a heated, mercuric oxide bed, and photometric detector. Reducing gases, including molecular H2, reacted stoichiometrically with the mercuric oxide releasing Hg2+ into the flowing carrier gas stream, and photometric detection was measured by UV absorption of Hg2+. The lower detection limit of the unit is 25 ppb H2 with an accuracy of 10% of reading. Culture samples were obtained using a ceramic filter (Flownamics, Madison, WI) every 2 h. Sugars and organic acids were analyzed using high performance liquid chromatography [HPLC; HP1090 running Chemstation A.03 software (Agilent, Santa Clara, Ca)] with a Rezex-RHM (Phenomenex, Torrance, CA) ion exchange analytical column. The mobile phase was H2SO4 in Milli-Q (18 MΩ) water (0.005N, 0.6 ml/min, 85°C) which passed through a UV–VIS diode-array detector for quantifying organic acids (cut-off absorbance at 210 nm) and a HP 1037 (Agilent, Santa Clara, Ca) RI detector connected in series for quantifying sugars. The injection volume was 10 μL for all samples. Cell concentration was measured indirectly by monitoring the optical density of the culture fluid using a Fundulux II (Sartorius Stedim, Bohemia, NY) probe.
Bioreactor cultivations were performed with 30 mM glucose, 15 mM cellobiose, 150 mM cellobiose, and swithgrass that utilized the haloalkaliphilic pretreatment described in detail here and above. For glucose and cellobiose, each was added via filter sterilization with a syringe and needle and the bioreactor was allowed to stabilize under anaerobic conditions as indicated by a return to colorless medium. For 30 mM glucose, a 60 mL aliquot of freshly grown inoculum was added (total volume = 1.8 L) and the liquid and gas sampling systems started and operated for 80 h. With 15 mM cellobiose, the same procedure was used and the system was operated for 100 h. Using 150 mM cellobiose, the same starting procedure was used except 100 mL of inoculum was used and the system was operated for 100 h. At that point, 400 mL was rapidly pumped from the system. Fresh medium flow began with 15 mM cellobiose (0.3 mL/min) until the culture volume was 2 L (∼7320 min), and the feed rate stopped for continuation in batch mode. The total operating time was 240 h. Cultivation with switchgrass began with milling through a 20 mesh screen. Milled switchgrass (∼40 g) was placed in 2.0 L NaCO3 (40 g/L, pH = 11.0,) slowly stirred overnight at room temperature. The mixture was filtered and the supernatant analyzed for sugars by using HPLC as described above. The filtered hydrolyzate (1320 mL) and 380 mL 5× culture growth medium was added to the bioreactor and stabilized at the operating conditions. Once stabilized, fresh inoculum (100 mL) was added for a total liquid volume of 1.8 L.
Cells were prepared for scanning electron microscopy (SEM) observation by fixing with 2.5% (v/v) anaerobic glutaraldehyde. The fixed cells were allowed to sit for approximately 2 h and then withdrawn by gentle removal of the tube stopper and the liquid, leaving the fixed cells in a small amount of liquid. The cells were transferred onto a 0.22 μm pore size nucleopore filter (shiny side up). The membrane was positioned on top of a slightly moistened piece of filter paper in a small petri dish. Each solution was added to the filter paper only until the membrane began to float. The sample was washed with buffer twice (0.1 M cacodylate buffer), followed by three rinses with ultrapure water and, finally, an ethanol dehydration series of 10%, 20, 35, & 50% (v/v). A second 0.22 μm pore size nucleopore filter was then placed on top of the membrane with the sample and the dehydration continued with 70, 90, 95 and 3 × 100% (v/v) ethanol. Following dehydration, the nucleopore filters were placed between screens and the sample was critical-point dried immediately (Tousimis Auto-Samdri; 815 Automatic Critical Point Dryer; Rockville, MD). Following this, the sandwiched nucleopore membranes were separated, mounted onto SEM stubs and sputter coated (Emitech K575x Turbo Sputter Coater; Kent, England) with a thin layer of platinum on a rotating sample holder (20 kV, 45 s). The coated samples were then viewed by using a Hitachi S-4700 FESEM (Hitachi High Technologies America, Inc.; Pleasanton, CA) at a working distance of 5–6 mm, a voltage of 2.0–10.0 kV, and a magnification of ∼6000×. All cell preparations and visualization were conducted at the University of Missouri Electron Microscopy Core Facility4.
There is a wide diversity of alkaliphilic bacteria spanning several phylogenic groups, most notably from soda lakes (Duckworth et al., 1996; Jones et al., 1998; Rees et al., 2004); however, their application for H2 production has not been investigated. Soap Lake, Washington, a highly haloalkaline lake, possesses a pH value of 10, 15–140 g/L NaCl, and anaerobic lake bottom sediments with extraordinarily high sulfide concentrations (Anderson, 1958; Mormile et al., 1999; Pinkart et al., 2006; Sorokin et al., 2007; Dimitriu et al., 2008) making it an ideal location to obtain haloalkaliphilic bacteria.
Lake bottom sediments were enriched using a culturing medium (Mormile et al., 1999) that mirrored the geochemistry of Soap Lake. The culturing medium was modified to include either 30 mM glucose or 15 mM cellobiose as a carbon source. Subculturing the initial enrichment into the modified media resulted in the accumulation of hydrogen gas. Serial dilution plating of the hydrogen producing mixed culture led to the isolation of a pure strain of bacteria, designated as strain SL-HP. Strain SL-HP was grown in the modified media to confirm the ability to produce hydrogen from the fermentation of both glucose and cellobiose as well as characterize its basic physiology.
Strain SL-HP was found to be an obligately anaerobic, gram negative, non-motile, non-sporulating, elongated rod that is ∼18 × 1 μm (Figure 1). Growth was observed between 20 and 37°C, pH 7–12, and NaCl concentrations of 2.5–15% (w/v) (Table A1 in Appendix). Optimum growth conditions were 30°C, pH 11, and 7.5% NaCl. In addition, increased growth was observed when SL-HP was grown in the presence sodium sulfide, even when other sources of reductant were present. The optimum sodium sulfide concentration was found to be 0.75 g/L (data not shown).
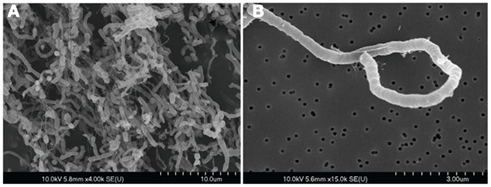
Figure 1. (A,B) Scanning electron microscopy images of H. hydrogenoformans showing the long, curved nature of the isolate. Cells pictured here were grown on 15 mM cellobiose in liquid culture under non-agitated conditions at 30°C, and pH 11 with 7% (v/v) NaCl. Cells were fixed with 2.5% (v/v) anaerobic glutaraldehyde, subjected to ethanol dehydration, critical-point drying, and coated with palladium.
In the interest of pursuing this bacterium as a potential strain for industrial biohydrogen production, the ability to ferment a variety of sugars derived from cellulosic biomass was observed. SL-HP was able to ferment and produce hydrogen from glucose, cellobiose, xylose, arabinose, mannose, and galactose. Observed products of fermentation include acetate, formate, and hydrogen (Table 1). Due to the high concentration of carbonate and the alkaline pH of the growth medium, accumulation of CO2 was not detected in the headspace, but is most likely a product of fermentation. Glucose, ribose, and cellobiose fermentations resulted in the largest accumulation of biomass, while cellobiose, glucose, and mannose resulted in the highest levels of hydrogen production. In addition to these pentose and hexose sugars, growth was also observed on glycerol. Growth above control levels was not observed when acetate, lactate, or ethanol was the added carbon source.
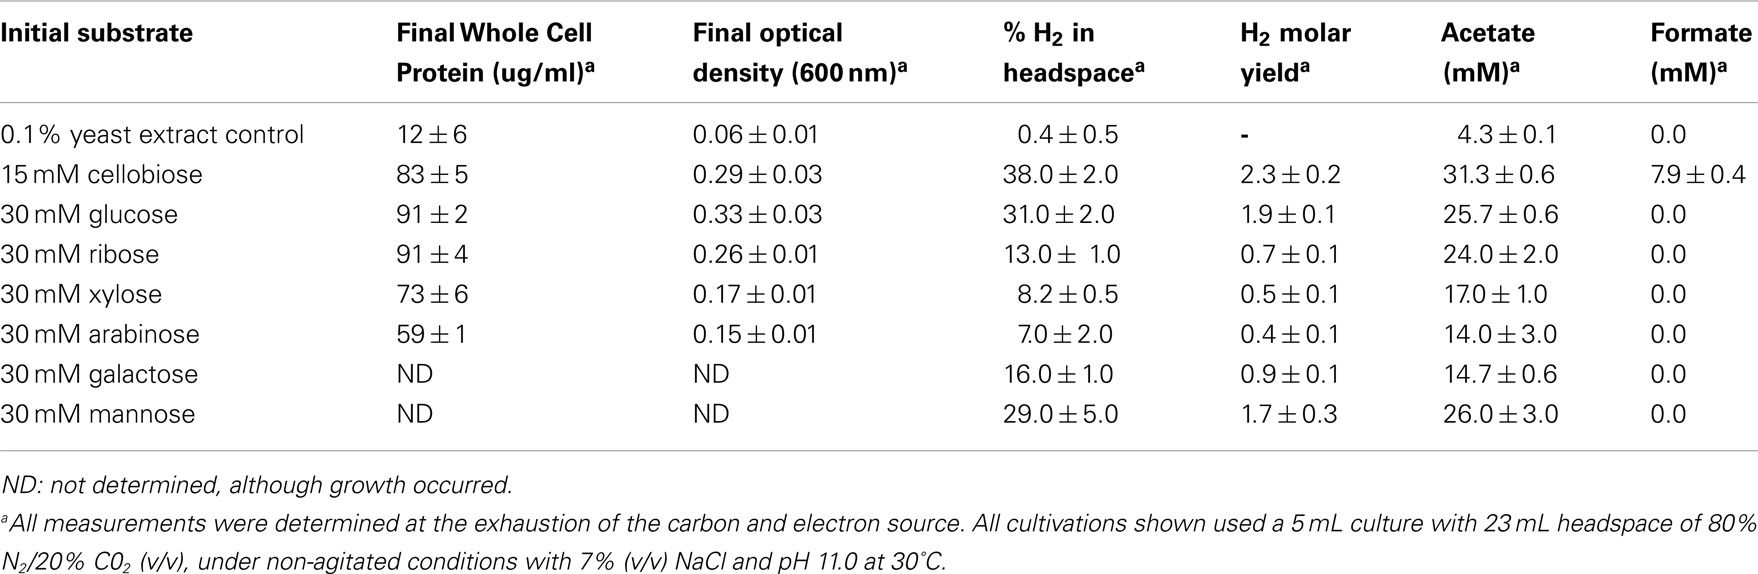
Table 1. Growth, metabolism and hydrogen production during non-shaking, uncontrolled batch cultivation.
Phylogenetic analysis clearly placed SL-HP in the Halanaerobium genus (Figure 2). The strain’s 16S rRNA gene sequence was most closely related to H. saccharolyticum subsp. saccharolyticum (97.4% sequence similarity), H. kushneri (97.4% sequence similarity), H. acetethylicum (97.3% sequence similarity), H saccharolyticum subsp. senegalense (97.2% sequence similarity), and H. praevalens (97.0% sequence similarity). The G + C content of SL-HP was determined to be 33 mol% through the sequenced genome (Brown et al., 2011), which is comparable with other members of the Halanaerobium genus (Supplemental Table 1). Though SL-HP possesses high 16S rRNA gene sequence similarities and G + C content with the other members of the genus Halanaerobium, it possesses a pH tolerance up to 12 and a growth optimum at pH 11. This is the first report of a true alkaliphilic strain of Halanaerobium. As such, we have proposed that this strain be recognized as a new species. We proposed the species name of H. hydrogeniformans: hy.dro.ge.ni.for’mans. N.L. n. hydrogenum (from Gr. n. hudôr, water; and Gr. v. gennaô, to produce), hydrogen; L. part. adj. formans, forming; N.L. part. adj. hydrogeniformans, hydrogen-forming. This name was used to describe the recently sequenced genome of this organism (GenBank deposition GQ215697; Brown et al., 2011).
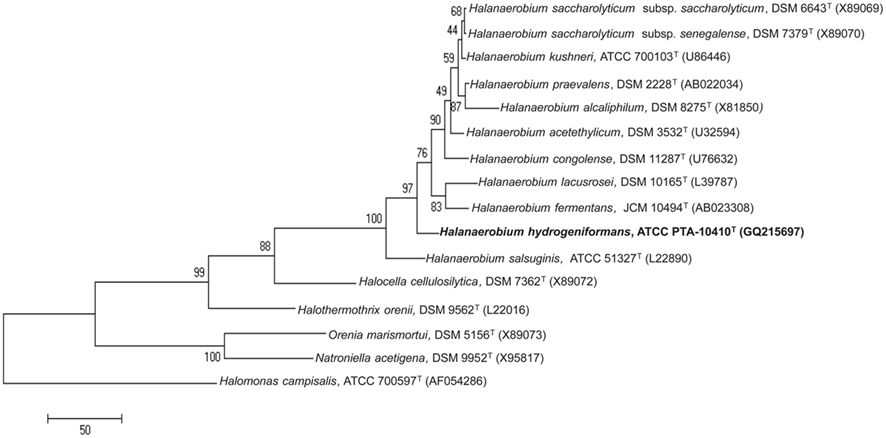
Figure 2. Evolutionary relationships of 16 taxa. The evolutionary history was inferred using the maximum parsimony method (Eck and Dayhoff, 1966). The bootstrap consensus tree inferred from 1000 replicates is taken to represent the evolutionary history of the taxa analyzed (Felsenstein, 1985). Branches corresponding to partitions reproduced in less than 50% bootstrap replicates are collapsed. The percentage of replicate trees in which the associated taxa clustered together in the bootstrap test (1000 replicates) are shown next to the branches (Felsenstein, 1985). The MP tree was obtained using the Close-Neighbor-Interchange algorithm (Nei and Kumar, 2000), with search level 3 (Felsenstein, 1985; Nei and Kumar, 2000) in which the initial trees were obtained with the random addition of sequences (10 replicates). The tree is drawn to scale, with branch lengths calculated using the average pathway method (Nei and Kumar, 2000), and are in the units of the number of changes over the whole sequence. All alignment gaps were treated as missing data. There were a total of 1380 positions in the final dataset, out of which 301 were parsimony informative. Phylogenetic analyses were conducted in MEGA4 (Tamura et al., 2007).
When grown in serum bottles with 15 mM cellobiose and without agitation at 33°C, increase in optical density ceased after 125 h while H2 production continued at a constant linear rate until approximately 450 h (Figure 3A). This was consistent with acetate and formate production along with decreasing cellobiose concentrations over the same time period (Figure 3B). Also of note, the pH decreased from 10.5 to 10.0 during the first 100 h of growth, perhaps as a result of acetate production (Figure 3B), but was maintained over the course of the cultivation. These data suggest a constant rate of sugar metabolism until substrate levels were exhausted with sugar metabolism not being obligately tied to growth.
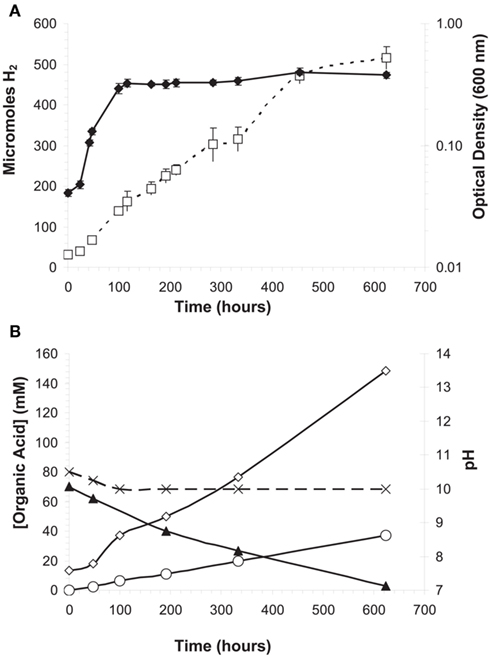
Figure 3. Quantification of growth and metabolic by-products over time in H. hydrogenoformans growing on cellobiose under non-agitating conditions at 30°C and pH 11 with 7% (v/v) NaCl. (A) Logarithmic growth (♦) occurred for the first 125 h of cultivation at which point the cells entered stationary phase, but H2 (□) production continued beyond 600 h as did (B) acetate (⋄) and formate (O) production until cellobiose (▲) was exhausted. (B) The pH (X) of the culture initially decreased from 10.5 but never fell below 10.0.
Under non-agitated conditions in serum bottles, H. hydrogeniformans grew as an opaque mass that adhered to the bottom of the glass bottle. The addition of agitation resulted in a dramatic increase in the growth rate and H2 evolution as well as a visible decrease in the amount of mass adhering to the glass surfaces. Culture agitation decreased the generation time to ∼12 h and increased the biomass yield by three-fold while also increasing the rate of H2 production five-fold and the overall H2 yield by ∼30% (Figure 4).Assessment of fermentative process efficiency is routinely referred to as the “Hydrogen Molar Yield (HMY),” and is determined by measuring the moles of H2 produced per mole of a hexose or pentose sugar oxidized. The theoretical HMY maximum for glucose via anaerobic fermentation is 4 (Hawkes et al., 2002; Shung and Wen-Hsing, 2008). Facultative anaerobes, such as enteric bacteria, have a HMY maximum of 2. With H. hydrogeniformans in serum cultures, 5-carbon sugar HMY ranged from 0.4 to 0.7; whereas 6-carbon sugars, including cellobiose, yielded a HMY of 0.9–2.3 (Table 1). While this value is low compared to the theoretical maximum, the highest published HMY from glucose by an obligate anaerobic wild type strain, Clostridium beijerinckii RZF-1108, is 1.97 (Zhao et al., 2011). In comparison, strains considered for fermentation of cellulosic sugars, such as Clostridium thermocellum, have been reported to produce only 1.5 mol H2/mol hexose (Levin et al., 2006) and engineered Clostridium paraputrificum, over-expressing a hydrogenase, produced a maximal 2.4 mol H2/mol hexose (Morimoto et al., 2005). E. coli has been engineered to achieve a HMY of 1.8, which is near the theoretical maximum for a facultative anaerobe (Akhtar and Jones, 2009).These results are comparable to the HMY of H. hydrogeniformans growing on cellobiose. Clearly though, there is room for improvement in biological H2 production toward the theoretical maximum. Identification of new strains with higher HMY or metabolic engineering of current strains, including H. hydrogeniformans, are possible routes toward achieving this goal.
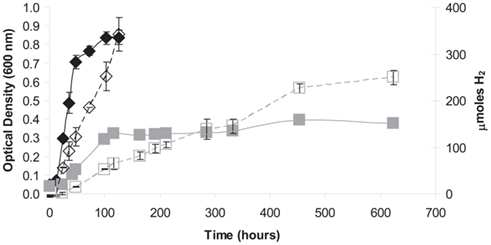
Figure 4. Agitation of H. hydrogenoformans cultures growing on cellobiose resulted in increased growth yield and rate (♦) as well as greater H2 yield and production rate (⋄) as compared to growth ( ) and H2 production (□) in non-agitated cultures. A concomitant increase in the rate of cellobiose degradation and acetate production were observed with agitation (data not shown).
One of the first steps toward determining industrial feasibility is to move from sealed bottles to small bioreactors, preferably in fed-batch mode. This was performed using H. hydrogeniformans on several carbon sources. Bioreactor grown cells consumed 30 mM glucose within 67 h and yielded stoichiometric amounts of acetate and formate in a molar ratio of 3:1 (Figure 5A) with 75% of the available carbon from glucose being accounted for under the conditions tested (Table 2). Examination of the genome of H. hydrogeniforms resulted in the identification of several pathways for acetate production from pyruvate (Figure 6). If one assumes that all acetate produced from pathways other than through pyruvate formate lyase results in the production of CO2, 90% of the carbon can be accounted for. The exit gas H2 productivity profile peak occurred at 50 h and then decreased sharply (Figure 5B). Numerical integration of the exit gas H2 concentration over time yielded the total molar H2 production.
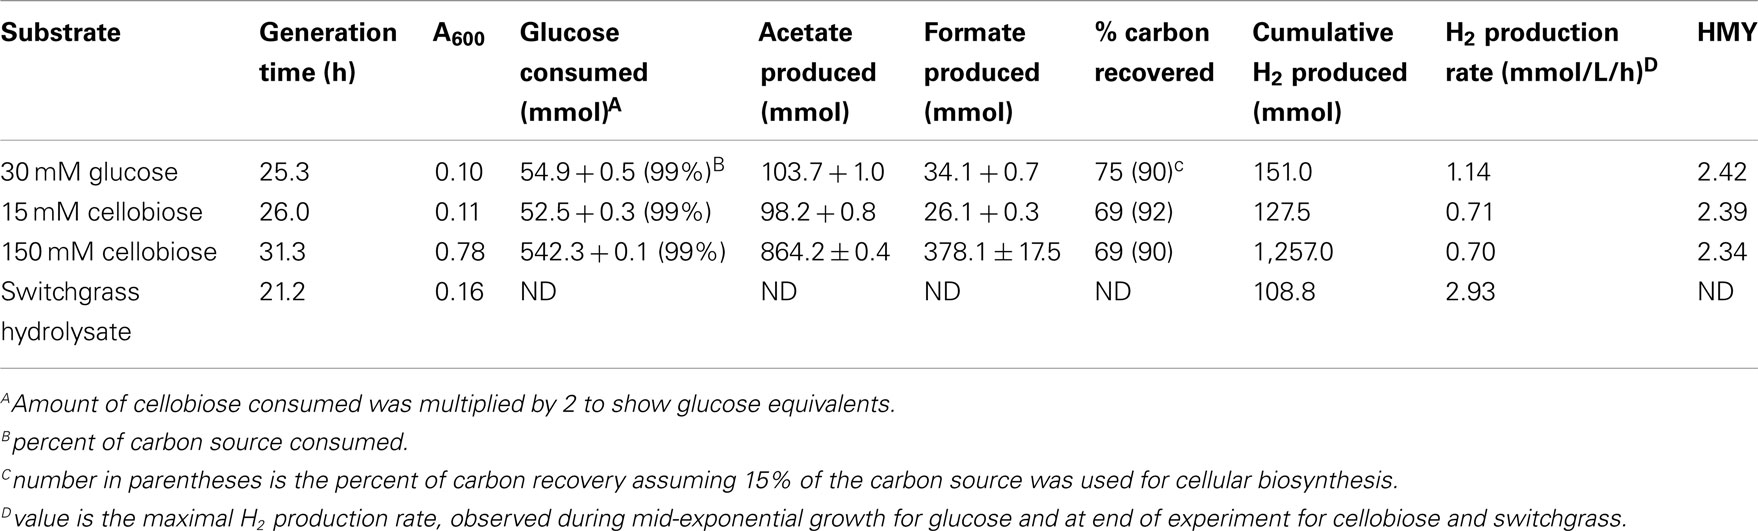
Table 2. Growth, metabolism and hydrogen production during fed-batch controlled cultivation.
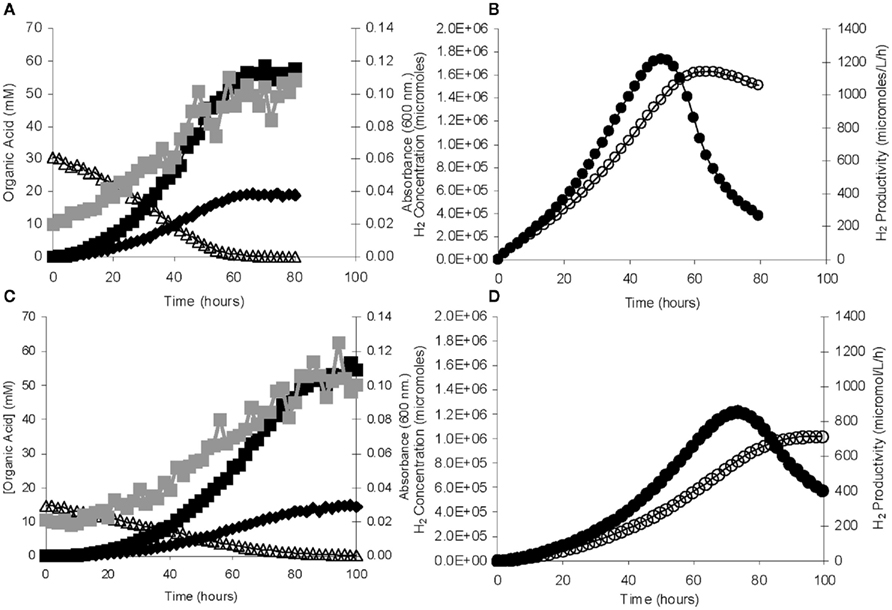
Figure 5. Fed-batch bioreactor growth and H2 production from H. hydrogenoformans. (A) Growth () increased with time as 30 mM glucose (Δ) decreased until exhaustion with the concomitant increase in acetate (■) and formate (♦). (B) The [H2] (○) increased until glucose exhaustion while the peak H2 productivity (●) peaked at a slightly earlier time. (C,D) Fed-batch bioreactor growth and H2 production with 15 mM cellobiose using the same symbols.
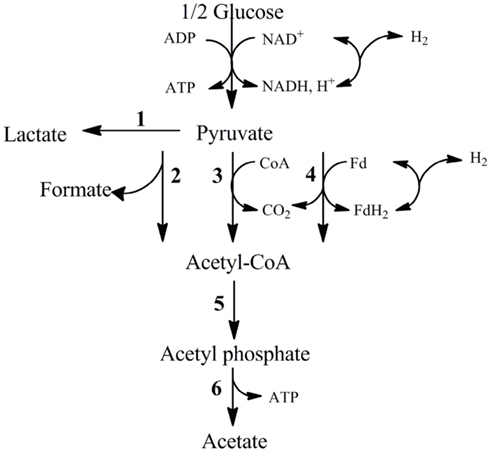
Figure 6. Pathways for the metabolism of pyruvate by H. hydrogeniformans based the genome annotation. (1) Lactate dehydrogenase (Halsa_1287), (2) Pyruvate formate lyase (Halsa_0723), (3) Pyruvate dehydrogenase (Halsa_0919, Halsa_2297, Halsa_0164), (4) Pyruvate ferrodoxin/flavodoxin oxidoreductase (Halsa_2334), (5) Phosphotransacetylase (Halsa_1556), (6) Acetate kinase (Halsa_1555).
where TotMolH2 is the molar production of H2 (mmol), F is the volumetric flow rate of the N2 stream (mL/min), ρ is the density of the nitrogen stream (g/mL), MW is the H2 molecular weight (2.016 g/mol), and w is the H2 concentration in the exit gas sample (ppm). Dividing Eq. 1 by the liquid volume and the reaction time gives the overall H2 productivity

where H2prod is the volumetric productivity of H2 production (micromoles/L/h), Vol is the liquid volume (L), and t is the reaction time (min). The maximum H2 productivity was 1.14 mmol/L/h (Table 2) which was ∼50% of the 2.35 mmol/L/h reported for serum cultures using glucose. The HMY was calculated as

where HMY is (mmol/mmol), and C is the substrate concentration, (mM). The HMY at maximum productivity was 2.42 mmol H2/mmol glucose (Table 2). This is less than the theoretical yield of 4.0 when producing acetate, which suggests that some of the available NADH from glycolysis is not being oxidized to H2 by the hydrogenase.
Bioreactor grown cells consumed 15 mM cellobiose within ∼100 h, producing acetate and formate with a molar ratio of 3.8:1 (Figure 5C) with ∼70% of the available carbon being accounted for under the conditions tested. If one accounts for assumed CO2 production based on identified pathways, one can account for 92% of carbon from cellobiose (Table 2). The exit gas H2 concentration profile peaked at 73 h, with a maximum hydrogen productivity of 0.71 mmol/L/h, occurring at 94 h (Figure 5D). This agreed well with serum bottle culture value of 0.7 mmol/L/h. The HMY at maximum productivity was 2.39 mmol H2/mmol glucose equivalent and was similar to the glucose cultivation above. Bioreactor cultivations with 150 mM cellobiose exhausted the cellobiose supply within 100 h and yielded an acetate to formate molar ratio of 4:1 with a H2 productivity of 0.7 mmol/L/h with ∼70% of the available carbon being accounted for; 90% again assuming CO2 production., and an HMY of 2.34 (Table 2).
While this microorganism can use several pure sugars for the production of hydrogen, to be practically applicable, it would also need to produce H2 from lignocellulosic material. Further, to do so at a lower temperature and pressure would also reduce the carbon footprint and energy input of the process, streamlining it from current methodologies as detailed above. To this end and to test feasibility with H. hydrogeniformans in serum bottle cultures, shredded straw and switchgrass were dried, passed through a 1 mm screen and then subjected to a Na2CO3 alkaline pretreatment modified from that described by Bjerre et al. (1996) by the use of 40 g Na2CO3/L instead of 10 g/L at several temperatures. Using the lower Na2CO3 concentration and high pressure with wheat straw, Aspergillus niger produced the highest ethanol concentration with a pretreatment of 170°C for 10 min after neutralization of the hemicellulosic liquor (Bjerre et al., 1996). When crystalline cellulose was tested by these researchers, the same pretreatment conditions resulted in the highest conversion to the more bioavailable amorphous cellulose (Bjerre et al., 1996).
In the present work, digestion of the non-neutralized hemicellulosic liquor produced from switchgrass or straw was tested for hydrogen production with duplicate cultures using various pretreatment temperatures at ambient pressure. Pretreatments included room temperature (RT; overnight), 55°C (2 h) 75°C (2 h), 90°C (1 h), 130°C (15 min), 150°C (15 min), or 170°C (15 min) with treatments at 55°C yielding the best hydrogen production rate and extent (Figure 7A,B), followed by RT and 75°C. With each lignocellulosic material, protein concentrations more than tripled by the end of the incubation for the RT and 55°C pretreatments (Figure 7C,D), suggesting cellular growth from the pretreatment liquor while the higher pretreatment temperatures yielded far less protein. This was concomitant with the greatest production of acetate in both the straw (6 mM at RT; 2.5 mM at 55°C) and switchgrass (9 mM at RT; 14 mM at 55°C) as measured by HPLC analysis (data not shown). Individual sugars could not be identified in the liquors when compared with pure sugar standards (data not shown). From pretreated straw, hydrogen production was best at 55°C, with RT and 75°C yielding similar results but less then 55°C. Use of the RT pretreatment would require further exploration to determine if the smaller yield of biohydrogen could be offset by the further reduction of the carbon footprint for biohydrogen production from straw. With switchgrass, however, the difference was far more distinct and the overall H2 yield was more than double that of straw. In both cases, the pH did not fall below 10.2 during the incubations. Other differences included the lack of H2 production with switchgrass at 90 and 130°C but some production at 150 and 170°C (Figure 7A), suggesting that inhibitory compounds from lignin degradation may have been produced with these temperatures and higher Na2CO3 concentrations (Klinke et al., 2004). The rates of biohydrogen production were 0.37 and 0.88 μmol H2/h/mL for straw and switchgrass, respectively, as compared to a range of 0.59 μmol H2/h/mL with xylose or arabinose, and up to 2.35 μmol H2/h/mL with glucose. The rate of hydrogen production with switchgrass was highly similar to that found recently using A. thermophilum DSM 6725 at 70°C (Yang et al., 2009). The values of 0.37 and 0.88 μmol H2/h/mL for straw and switchgrass, respectively, are ∼12% of those generated by a fully grown microbial consortium producing H2 from steam explosion-treated corn stover (Datar et al., 2007) or generated in various neutrophilic bioreactor configurations with glucose as the feedstock (Gavala et al., 2006). However, a 10% (v/v) inoculum was used in the present case in order to assess both H2 production as well as the capacity to support growth. Hence, it would be expected that if the feedstock was pumped into a bioreactor with an already fully grown culture, this strain would likely produce H2 at an increased rate.
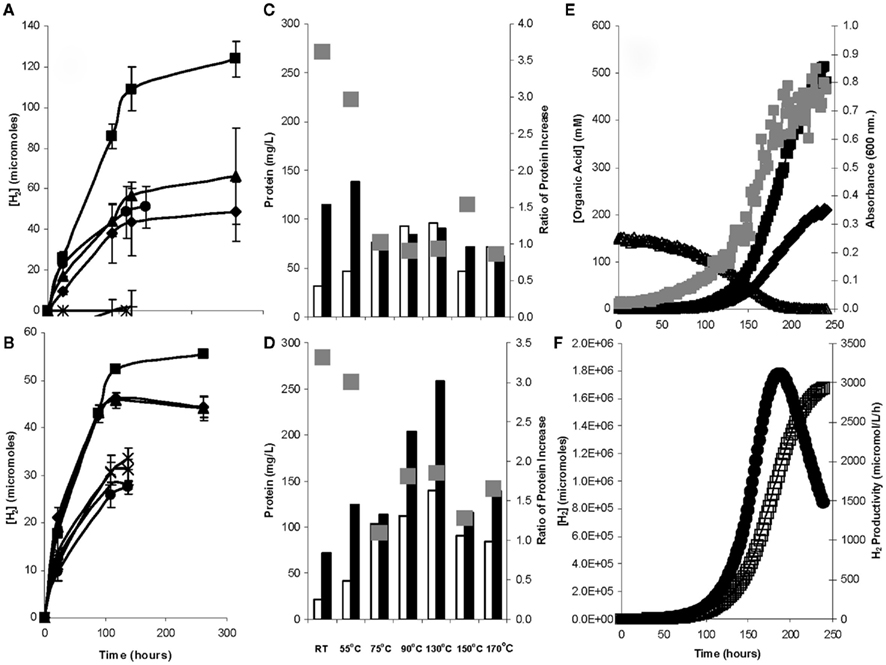
Figure 7. Biohydrogen production from the hemicellulosic liquors of (A) switchgrass and (B) straw in serum grown H. hydrogenoformans. In each case a pretreatment of 55°C (■) yielded higher H2 concentrations than those of room temperature (♦), 75°C (▲), 90°C (×), 130°C (*), 150°(●), or 170°C (+). (C) switchgrass and (D) straw protein concentrations from incubations with the respective hydrolysate showing that the initial (white bar) protein values increased by the end of the incubation (black bar), with the highest ratios of protein increase () at lower temperatures. Fed-batch bioreactor culture of H. hydrogeniformans(E) degraded switchgrass hydrolysate (Δ) with the concomitant increase in optical density (), acetate (■), and formate (♦). (F) The (H2) (□) increased until switchgrass hydrolysate exhaustion while the peak H2 productivity (●) peaked at a slightly earlier time (Zhao et al., 2011).
For bioreactor studies with switchgrass, after it was milled and exposed to an alkaline pretreatment, the resulting supernatant possessed ∼8.5 mM cellobiose. Chromatographic peaks for monomers were blurred in the analysis, so it was impossible to determine the concentration of hemicellulose degradation products and/or glucose in the sample. H. hydrogeniformans consumed the initial cellobiose charge within ∼200 h, producing an acetate:formate molar ratio of 3.5 (Figure 7E). The exit gas (H2) peaked at 190 h and then decreased sharply with a maximum H2 productivity of 2.93 mM/L/h (Figure 7F, Table 2). This is approximately four times higher productivity than with pure cellobiose and twice that of pure glucose, but the time to achieve this productivity was almost three times that of the pure carbon sources. This suggested that while the degradation of the switchgrass liquor required a longer residence time, the eventual biohydrogen productivity may cancel out the greater time required. Further optimization of both the fermentation process and the pretreatment will likely decrease the residence time required for the fermentation process, thus resulting in equal or higher H2 productivity with a faster turnover time.
While growth and biohydrogen production were supported with the liquor, H. hydrogeniformans also used the solid residue remaining from the pretreatment, although to a diminished extent and only producing between 23 and 32 μmoles of H2 with either feedstock (data not shown). The solid residue may primarily be insoluble, amorphous cellulose. The inability of H. hydrogeniformans to more efficiently metabolize the insoluble cellulosic material can be tracked to the genome which contains no genes annotated as cellulases. In order to achieve more complete conversion of plant biomass, additional treatments steps would be needed such as incubation with high pH tolerance cellulose degrading enzymes. An alternative would be genetic engineering of H. hydrogeniformans for the production cellulases to allow more complete conversion of plant biomass. Either option would serve to degrade the amorphous and crystalline cellulose to cellobiose and glucose, which could then be metabolized by this bacterium to produce H2. Genetic manipulation is likely the more cost efficient method in the longer-term and will require the development of a facile genetic system. Additionally, a system for genetic manipulation would allow pathways to be knocked out to increase flux through H2 producing pathways. Given the large number of existing protocols, this is likely achievable in the shorter-term.
The authors declare that the research was conducted in the absence of any commercial or financial relationships that could be construed as a potential conflict of interest.
We thank Cheryl Jensen and Randy Tindall at the University of Missouri EM Core Facility for their assistance with cell preparation and SEM microscopy, John Coutts (University of Missouri) for drying and screening of the straw and switchgrass, and Drs. Jim K. Fredrickson (PNNL) and Tommy Phelps (ORNL) for helpful suggestions. We also thank Professor Jean Euzéby for providing the epithet for H. hydrogeniformans. This work was made possible through support from the US Department of Energy, Office of Biological and Environmental Research and the University of Missouri Life Sciences Undergraduate Research Program.
Akhtar, M. K., and Jones, P. R. (2009). Construction of a synthetic YdbK-dependent pyruvate:H2 pathway in Escherichia coli BL21(DE3). Metabol. Eng. 11, 139–147.
Altschul, S. F., Madden, T. L., Schäffer, A. A., Zhang, J., Zhang, Z., Miller, W., and Lipman, D. J. (1997). Gapped BLAST and PSI-BLAST: a new generation of protein database search programs. Nucleic Acids Res. 25, 3389–3402.
Anderson, G. C. (1958). Seasonal characteristics of two saline lakes in Washington. Limnol. Ocean 3, 51–68.
Balch, W. E., and Wolfe, R. S. (1976). New approach to the cultivation of methanogenic bacteria: 2-mercaptoethanesulfonic acid (HS-CoM)-dependent growth of Methanobacterium ruminantium in a pressurized atmosphere. Appl. Environ. Microbiol. 32, 781–791.
Bender, K. S., Yen, H. B., Hemme, C. L., Yang, Z., He, Z., He, Q., Zhou, J., Huang, K. H., Alm, E. J., Hazen, T. C., Arkin, A. P., and Wall, J. D. (2007). Analysis of a ferric uptake regulator (Fur) mutant of Desulfovibrio vulgaris Hildenborough. Appl. Environ. Microbiol. 73, 5389–5400.
Bjerre, A. B., 0lesen, A. B., Fernqvist, T., Ploger, A., and Schmidt, A. S. (1996). Pretreatment of wheat straw using combined wet oxidation and alkaline hydrolysis resulting in convertible cellulose and hemicellulose. Biotechnol. Bioeng. 49, 568–577.
Bradford, M. M. (1976). A rapid and sensitive method for the quantitation of microgram quanitities of protein utilizing the principle of protein-dye binding. Anal. Biochem. 72, 248–254.
Brown, S. D., Begemann, M. B., Mormile, M. R., Wall, J. D., Han, C. S., Goodwin, L. A., Pitluck, S., Land, M. L., Hauser, L. J., and Elias, D. A. (2011). Complete genome sequence of the haloalkaliphilic, hydrogen-producing bacterium Halanaerobium hydrogeniformans. J. Bacteriol. 193, 3682–3683.
Chun, J., Lee, J. H., Jung, Y., Kim, M., Kim, S., Kim, B. K., and Lim, Y. W. (2007). EzTaxon: a web-based tool for the identification identification of prokaryotes based on 16S ribosomal RNA gene sequences. Int. J. Syst. Evol. Microbiol. 57, 2259–2261.
Clamp, M., Cuff, J., Searle, S. M., and Barton, G. J. (2004). The Jalview Java alignment editor. Bioinformatics 20, 426–427.
Datar, R., Huang, J., Maness, P. C., Mohagheghi, A., Czernik, S., and Chornet, E. (2007). Hydrogen production from the fermentation of corn stover pretreated with a steam explosion process. Int. J. Hydrogen Energy 32, 932–939.
DeSantis, T. Z., Hugenholtz, P., Larsen, N., Rojas, M., Brodie, E. L., Keller, K., Huber, T., Dalevi, D., Hu, P., and Andersen, G. L. (2006). Greengenes, a chimera-checked 16S rRNA gene database and workbench compatible with ARB. Appl. Environ. Microbiol. 72, 5069–5072.
Dimitriu, P. A., Pinkart, H. C., Peyton, B. M., and Mormile, M. R. (2008). Spatial and temporal patterns in the microbial diversity of a meromictic soda lake in Washington State. Appl. Environ. Microbiol. 74, 4877–4888.
Dimitriu, P. A., Shukla, S. K., Conradt, J., Márquez, M. C., Ventosa, A., Maglia, A., Peyton, B. M., Pinkart, H. C., and Mormile, M. R. (2005). Nitrincola lacisaponensis gen. nov., sp. nov., a novel alkaliphilic bacterium isolated from an alkaline, saline lake. Int. J. Syst. Evol. Microbiol. 55, 2273–2278.
Duckworth, A. W., Grant, W. D., Jones, B. E., and Steenbergen, R. (1996). Phylogenetic diversity of soda lake alkaliphiles. FEMS Microbiol. Ecol. 19, 181–191.
Eck, R. V., and Dayhoff, M. O. (1966). Atlas of Protein Sequence and Structure. Silver Springs, MD: National Biomedical Research Foundation.
Elias, D. A., Suflita, J. M., McInerney, M. J., and Krumholz, L. R. (2004). Periplasmic cytochrome c3 of Desulfovibrio vulgaris is directly involved in H2-mediated metal but not sulfate reduction. Appl. Environ. Microbiol. 70, 413–420.
Felsenstein, J. (1985). Confidence limits on phylogenies: an approach using the bootstrap. Evolution 39, 783–791.
Gáspár, M., Kálmán, G., and Réczey, K. (2007). Corn fiber as a raw material for hemicellulose and ethanol production. Process Biochem. 42, 1135–1139.
Gavala, H. N., Skiadas, I. V., and Ahring, B. K. (2006). Biological hydrogen production in suspended and attached growth anaerobic reactor systems. Int. J. Hydrogen Energy 31, 1164–1175.
Hawkes, F. R., Dinsdale, R., Hawkes, D. L., and Hussy, I. (2002). Sustainable fermentative hydrogen production: challenges for process optimisation. Int. J. Hydrogen Energy 27, 1339–1347.
Jackson, M. G. (1977). Review article: the alkali treatment of straws. Anim. Feed Sci. Technol. 2, 105–130.
Jones, B. E., Grant, W. D., Duckworth, A. W., and Owenson, G. G. (1998). Microbial diversity of soda lakes. Extremophiles 2, 191–200.
Klinke, H. B., Thomsen, A. B., and Ahring, B. K. (2004). Inhibition of ethanol-producing yeast and bacteria by degradation products produced during pre-treatment of biomass. Appl. Microbiol. Biotechnol. 66, 10–26.
Lebo, S. E., Gargulak, J. D., and McNally, T. J. (2001). “Lignin,” in Kirk-Othmer Encyclopedia of Chemical Technology, Vol. 15 (New York, NY: John Wiley & Sons, Inc.), 1–32.
Levin, D. B., Islam, R., Cicek, N., and Sparling, R. (2006). Hydrogen production by Clostridium thermocellum 27405 from cellulosic biomass substrates. Int. J. Hydrogen Energy 31, 1496–1503.
Liu, H. W., Walter, K. H., Vogt, G. M., Vogt, H. S., and Holbein, B. E. (2002). Steam pressure disruption of municipal solid waste enhances anaerobic digestion kinetics and biogas yield. Biotechnol. Bioeng. 77, 121–130.
Morimoto, K., Kimura, T., Sakka, K., and Ohmiya, K. (2005). Overexpression of a hydrogenase gene in Clostridium paraputrificum to enhance hydrogen gas production. FEMS Microbiol. Lett. 246, 229–234.
Mormile, M. R., Romine, M. F., Garcia, M. T., Ventosa, A., Bailey, T. J., and Peyton, B. M. (1999). Halomonas campisalis sp. nov., a denitrifying, moderately haloalkaliphilic bacterium. Syst. Appl. Microbiol. 22, 551–558.
Mueller-Langer, F., Tzimas, E., Kaltschmitt, M., and Peteves, S. (2007). Techno-economic assessment of hydrogen production processes for the hydrogen economy for the short and medium term. Int. J. Hydrogen Energy 32, 3797–3810.
Nei, M., and Kumar, S. (2000). Molecular Evolution and Phylogenetics. New York, NY: Oxford University Press.
Palmqvist, E., and Hahn-Hägerdal, B. (2000a). Fermentation of lignocellulosic hydrolysates. I: inhibitors and detoxification. Biotechnol. Res. 74, 17–24.
Palmqvist, E., and Hahn-Hägerdal, B. (2000b). Fermentation of lignocellulosic hydrolysates. II: inhibitors and mechanisms of inhibition. Biotechnol. Res. 74, 25–33.
Pinkart, H. C., Simonsen, B., Peyton, B. M., and Mormile, M. R. (2006). “The sulfur cycle in a permanently meromictic haloalkaline lake,” in Proceedings of the Society of Photo-Optical Instrumentation Engineers (SPIE), Instruments, Methods, and Missions for Astrobiology, Vol. 6309, 9th Edn, eds R. B. Hoover, G. V. Levin, and A. Y. Rozanov (San Diego: SPIE Digital Library), 63090M1–63090M10.
Rees, H. C., Grant, W. D., Jones, B. E., and Heaphy, S. (2004). Diversity of Kenyan soda lake alkaliphiles assessed by molecular methods. Extremophiles 8, 63–71.
Shung, S., and Wen-Hsing, C. (2008). “Biological hydrogen production by strict anaerobic bacteria: fundamentals, operational strategies, and limitations,” in Biocatalysis and Bioenergy, eds C. T. Hou and J.-F. Shaw (New York: John Wiley & Sons, Inc.), 265–277.
Sorokin, D. Y., Foti, M., Pinkart, H. C., and Muyzer, G. (2007). Sulfur-oxidizing bacteria in Soap Lake (Washington State), a meromictic, haloalkaline lake with an unprecedented high sulfide content. Appl. Environ. Microbiol. 73, 451–455.
Spencer, R. R., and Akin, D. E. (1980). Rumen microbial degradation of potassium hydroxide-treated coastal bermudagrass leaf blades examined by electron microscopy. J. Anim. Sci. 51, 1189–1196.
Tamura, K., Dudley, J., Nei, M., and Kumar, S. (2007). MEGA4: molecular evolutionary genetics analysis (MEGA) software version 4.0. Mol. Biol. Evol. 8, 1596–1599.
Updegraff, D. M. (1969). Semimicro determination of cellulose in biological materials. Anal. Biochem. 32, 420–424.
Waterhouse, A. M., Procter, J. B., Martin, D. M. A., Clamp, M., and Barton, G. J. (2009). Jalview Version 2 – a multiple sequence alignment editor and analysis workbench. Bioinfomatics 25, 1189–1191.
Yang, S. J., Kataeva, I., Hamilton-Brehm, S. D., Engle, N. L., Tschaplinski, T. J., Doeppke, C., Davis, M., Westpheling, J., and Adams, M. W. W. (2009). Efficient degradation of lignocellulosic plant biomass, without pretreatment, by the thermophilic anaerobe “Anaerocellum thermophilum” DSM 6725. Appl. Environ. Microbiol. 75, 4762–4769.
Zeikus, J. G., Hegge, P. W., Thompson, T. E., Phelps, T. J., and Langworthy, T. A. (1983). Isolation and description of Haloanaerobium praevalens gen. nov. and sp. nov., an obligately anaerobic halophile common to great salt lake sediments. Curr. Microbiol. 9, 225–234.
Zhang, Z., Schwartz, S., Wagner, L., and Miller, W. (2000). A greedy algorithm for aligning DNA sequences. J. Comput. Biol. 7, 203–214.
Zhao, X., Xing, D., Fu, N., Liu, B., and Ren, N. (2011). Hydrogen production by the newly isolated Clostridium beijerinckii RZF-1108. Bioresour. Technol. 102, 8432–8436.
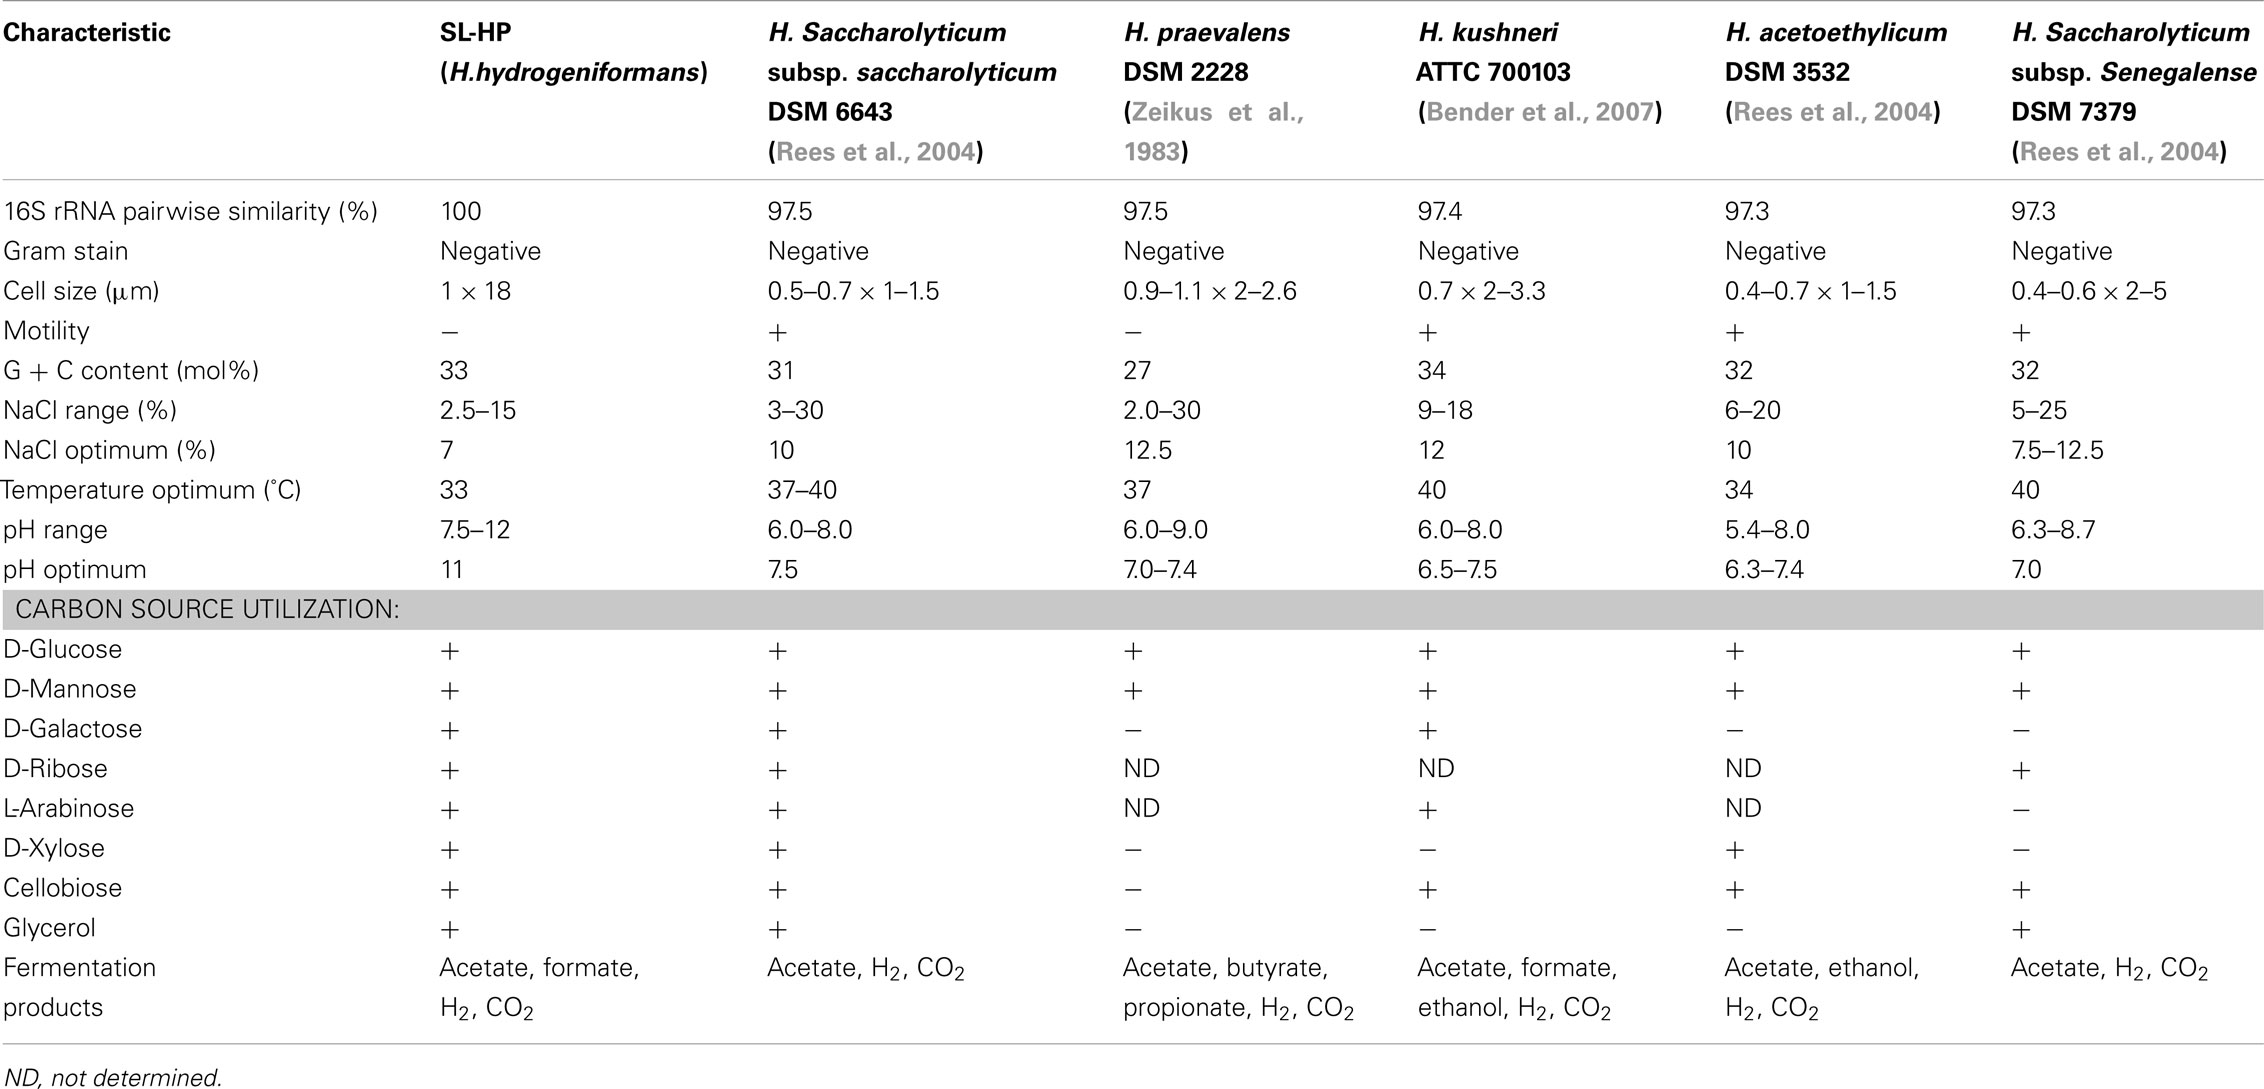
Table A1. Comparison of H. hydrogeniformans with other species of the genus Halanaerobium.
Keywords: biohydrogen, extremophile, alkaliphile, biofuel
Citation: Begemann MB, Mormile MR, Sitton OC, Wall JD and Elias DA (2012) A streamlined strategy for biohydrogen production with Halanaerobium hydrogeniformans, an alkaliphilic bacterium. Front. Microbio. 3:93. doi: 10.3389/fmicb.2012.00093
Received: 03 January 2012; Paper pending published: 09 February 2012;
Accepted: 26 February 2012; Published online: 21 March 2012.
Edited by:
Kartik Chandran, Columbia University, USAReviewed by:
Carl James Yeoman, University of Illinois at Champaign-Urbana, USACopyright: © 2012 Begemann, Mormile, Sitton, Wall and Elias. This is an open-access article distributed under the terms of the Creative Commons Attribution Non Commercial License, which permits non-commercial use, distribution, and reproduction in other forums, provided the original authors and source are credited.
*Correspondence: Dwayne A. Elias, Biosciences Division, Oak Ridge National Laboratory, P.O. Box 2008, Room 248 Bldg. 1505, MS-6036, Oak Ridge, TN 37831-6036, USA. e-mail:eliasda@ornl.gov
Disclaimer: All claims expressed in this article are solely those of the authors and do not necessarily represent those of their affiliated organizations, or those of the publisher, the editors and the reviewers. Any product that may be evaluated in this article or claim that may be made by its manufacturer is not guaranteed or endorsed by the publisher.
Research integrity at Frontiers
Learn more about the work of our research integrity team to safeguard the quality of each article we publish.